 Eva Odehnalová1
 Lucia Valíková1
 Guido Caluori1,2,3,4
 Tomáš Kulík1,5Veronika Římalová6
 Tomasz Jadczyk1,7
 Eva Dražanová8
 Iveta Pavlova8
 Martin Pešl1,2,9
 Václav Kubeš10
 Zdeněk Stárek1,5*
- 1Interventional Cardiac Electrophysiology Group, International Clinical Research Center, St. Anne’s University Hospital Brno, Brno, Czech
- 2Nanotechnology, CEITEC Masaryk University, Brno, Czech
- 3IHU LIRYC, Electrophysiology and Heart Modeling Institute, Fondation Bordeaux Université, Pessac, France
- 4University Bordeaux, INSERM, Cardiothoracic Research Center of Bordeaux, Pessac, France
- 51st Department of Internal Medicine—Cardioangiology, St. Anne’s University Hospital Brno, Brno, Czech
- 6Biostatistics, International Clinical Research Center, St. Anne’s University Hospital Brno, Brno, Czech
- 7Division of Cardiology and Structural Heart Diseases, Medical University of Silesia, Katowice, Poland
- 8Institute of Scientific Instruments of the Czech Academy of Sciences, Brno, Czech
- 9Department of Biology, Faculty of Medicine Masaryk University Brno, Brno, Czech
- 10Department of Pathology, University Hospital Brno, Brno, Czech
Aims: Gross pathology inspection (patho) is the gold standard for the morphological evaluation of focal myocardial pathology. Examination with 9.4 T magnetic resonance imaging (MRI) is a new method for very accurate display of myocardial pathology. The aim of this study was to demonstrate that lesions can be measured on high-resolution MRI images with the same accuracy as on pathological sections and compare these two methods for the evaluation of radiofrequency (RF) ablation lesion dimensions in swine heart tissue during animal experiment.
Methods: Ten pigs underwent radiofrequency ablations in the left ventricle during animal experiment. After animal euthanasia, hearts were explanted, flushed with ice-cold cardioplegic solution to relax the whole myocardium, fixed in 10% formaldehyde and scanned with a 9.4 T magnetic resonance system. Anatomical images were processed using ImageJ software. Subsequently, the hearts were sliced, slices were photographed and measured in ImageJ software. Different dimensions and volumes were compared.
Results: The results of both methods were statistically compared. Depth by MRI was 8.771 ± 2.595 mm and by patho 9.008 ± 2.823 mm; p = 0.198. Width was 10.802 ± 2.724 mm by MRI and 11.125 ± 2.801 mm by patho; p = 0.049. Estuary was 2.006 ± 0.867 mm by MRI and 2.001 ± 0.872 mm by patho; p = 0.953. The depth at the maximum diameter was 4.734 ± 1.532 mm on MRI and 4.783 ± 1.648 mm from the patho; p = 0.858. The volumes of the lesions calculated using a formula were 315.973 ± 257.673 mm3 for MRI and 355.726 ± 255.860 mm3 for patho; p = 0.104. Volume directly measured from MRI with the “point-by-point” method was 671.702 ± 362.299 mm3.
Conclusion: Measurements obtained from gross pathology inspection and MRI are fully comparable. The advantage of MRI is that it is a non-destructive method enabling repeated measurements in all possible anatomical projections.
1 Introduction
Gross pathological inspection (patho) and manual measurements are standard methods in autopsy evaluation of tissue (Song et al., 2017) including myocardial pathologies and radiofrequency ablation lesions (Nakagawa et al., 1995) (Dickfeld et al., 2007) (Krahn et al., 2018). Nevertheless, this method inadvertently destroys the sample, effectively preventing reevaluation and allowing only unidirectional slicing. Therefore, patho is limited to complex anatomical objects, the number of measured planes is limited, and the calculated volume is only approximate.
Magnetic resonance imaging (MRI) represents well established diagnostics non-invasive method that allow exact repeatable measurements of myocardial pathologies (Ishihara et al., 2007) (Braggion-Santos et al., 2013) (Suzuki et al., 2021). Standardly used 1.5 T and 3 T MRI allows visualization of myocardial pathologies including radiofrequency lesions “in vivo” (Dickfeld et al., 2007) (Badger et al., 2010) (Markman and Saman 2017) (Tofig et al., 2019) as well post-mortem. Moreover, high-resolution MRI systems are very promising and rapidly evolving imaging methods (Schneider et al., 2008) (Schneider et al., 2011) (Wech et al., 2016) (Ertürk et al., 2017) (Erturk et al., 2019) (Heo et al., 2019), which allow precise evaluation of the heart in unparalleled quality. Berte et al. described the successful use of 1.5T MRI for in vivo imaging of the hearts and 9.4 T MRI (Bruker) for explanted hearts in 2015, where they used high-resolution MRI for evaluation of the lesions after radiofrequency (RF) ablation in an ovine experiment (Berte et al., 2015).
RF ablation is a catheter-based non-pharmacological treatment of cardiac arrhythmias (Kalbfleisch and Langberg 1992). The principle of this method is destruction of the myocardium, which serves as an arrhythmogenic substrate with RF energy applied to the tip of the ablation catheter (Haines and Verow, 1990). RF energy creates limited thermal coagulation necrosis that heals as the non-conducting scar and treats arrhythmia (D. E. Haines and Watson 1989) (Haverkamp et al., 1989) (Nath et al., 1994) (O’Donnell and Nadurata. 2004) (D. Haines 2018). The radiofrequency lesion is histologically characterized by central thermal coagulation necrosis, where myocardial cells lose clear boundaries and transverse striping. Central necrosis is surrounded by a thin border zone consisting of a mix of healthy and damaged cells. Behind this border zone is a healthy myocardium (Delacretaz et al., 1999) (Gepstein et al., 1999) (Krahn et al., 2018). Catheter ablation of arrhythmias is a very fast-growing area of cardiology, and many experiments have been performed. To evaluate the effect of RF ablation, it is crucial to evaluate the extent of necrosis, synonymously called RF lesions. The standard method is gross pathology; however, MRI evaluation is becoming very promising as an alternative method.
Therefore, the aim of this study was to demonstrate that lesions can be measured on high-resolution MRI images with the same accuracy as on pathological sections and compare results from MRI and patho measurements of the lesions formed after experimental RF ablation in swine heart tissue.
2 Materials and methods
2.1 Permission
The animal experiment was approved by the ethics committee of the University of Veterinary and Pharmaceutical Sciences in Brno (approval number 12–2018) and by the Ministry of Education Youth and Sports (approval number MSMT-17402/2018–3). All procedures performed on pigs were in accordance with Directive 2010/63/EU of the European Parliament on the protection of animals used for scientific purposes.
2.2 Animal preparation
The animal experiment was carried out in cooperation with the Animal Center FNUSA-ICRC Brno. Ten female swine (weight, 50–55 kg; age, 6 months) were used. Each animal was weighed on a digital scale to determine the exact weight. Premedication before anesthesia was done by mixture of ketamine 2 mg/kg + xylazine 2 mg/kg + tiletamine 2 mg/kg + zolazepam 2 mg/kg by intramuscular (i.m.) application. After this, pigs were intubated and an intravenous cannula was inserted into the ear vein. Animals were kept under mechanical ventilation with 1.5% isoflurane. Amiodarone (5 mg/kg, i. m.) was applied by very slow application to suppress ventricular fibrillation. Heparin (7.000 I.U., intravenous application) was administered before sheats were inserted into the femoral veins and then was repeated in a dose of 3500 I.U every hour. The animal arterial blood pressure was measured invasively in femoral artery. An oximeter was placed on the tongue of the animal to monitor oxygen saturation. A temperature control probe was inserted into the animal esophagus to minimize the risk of thermal damage to the esophagus. At the end of the experiment, animals were sacrificed by intravenous application (in dosage 4–6 ml/50 kg) of special mixture intended for euthanasia in animals named—T61 (Intervet International B.V., Boxmeer, Netherland).
2.3 RF ablations and examination of hearts
All pigs underwent a standard RF protocol under general anesthesia—left ventricles were ablated on the septum, on the lateral wall, on the inferior wall, on the anterior wall and in the left ventricular outflow tract (LVOT) position with a different power setting for 1 min or up until “steam pop” appeared. After completion of the ablation protocol, the animal was sacrificed and moved to the pathology room. Hearts were removed from the thoracic cavity and flushed with ice-cold cardioplegic solution (St. Thomas solution) to relax the whole myocardium. The heart was then fixed in 10% formaldehyde. Hearts were scanned with a 9.4 T magnetic resonance system (Bruker BioSpec 182 94/30USR), equipped with a volume coil 1H 198/154 mm. Ex vivo MRI imaging was performed in cooperation with the Institute of Scientific Instruments of the Czech Academy of Sciences. Anatomical images were processed using ImageJ software, which is intended for scientific use and is freely accessible on the website at www.imagej.net (Schindelin et al., 2015) (Rueden et al., 2017). All measurements done in ImageJ software were done manually without using any automatic processing tools. After the hearts were scanned, they were cut into 3–5-mm-thick slices, which were placed side by side, photographed by the camera (Nikon DX AF-S NIKKOR), and analyzed using the same ImageJ software. We opted for this method of analysis because manual measurement of the pathology samples is associated with a risk of inhaling toxic formaldehyde fumes. Each lesion was measured three times and evaluated by two independent observations.
As the last step, the heart was removed out from formaldehyde, rinsed under running water and several lesions with characteristic parameters (without “steam pop” effect) were cut out from the heart, with an approximate volume of 1 × 1 × 0.5 cm. The samples were rinsed again under running water, dehydrated via ascending ethanol series and subsequently immersed in xylene. Then the samples were immersed in liquid paraffin, and paraffin blocks were prepared. Tissue blocks were sliced into sections, fixed on the histological glass, and stained with hematoxylin and eosin and Masson’s trichrome (to visualize the viability of the tissue). Masson’s trichrome stains central necrosis purple, healthy myocardium is stained red, and the connective tissue is stained blue. Hematoxylin and eosin staining was used for basic resolution. The cytoplasm is stained pink and nuclei are stained purple (Krahn et al., 2018). Slides were examined and photographed under a digital microscope (Leica DM 5000B, Leica Microsystems, Germany) at 25x, 50x and 200x magnification.
2.4 Measurement of lesions
Depth (A) of lesions was measured as the maximal distance between the point of contact of the catheter with the endocardium and the outermost apex of the lesion. Width (B) was measured in the place of the biggest length of the lesion. Estuary (D)—lesion surface diameter–was measured as a hollow in the endocardium created by catheter pressure. The depth of the maximum diameter (C) was measured as the distance between the estuary and the horizontal straight line passing through the widest point of the lesion (see Figure 1). The volume of the lesion was calculated from the measured parameters using the following formula (Guerra, 2013):
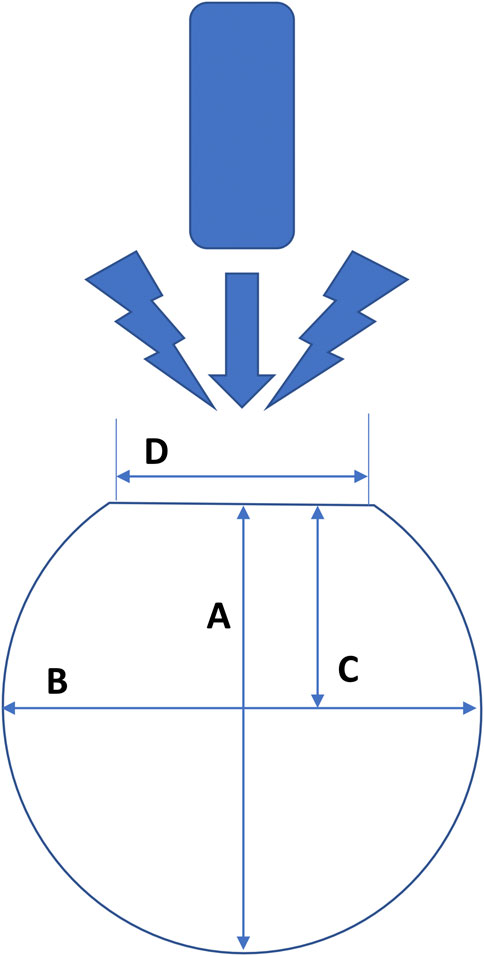
FIGURE 1. Schema of measuring the dimensions of lesions formed after radiofrequency ablation in the left ventricle of the swine hearts. (A) = maximum depth, (B) = maximum width, (C) = depth at the maximum diameter and (D) = lesion surface diameter (“estuary”). The measurement of each lesion takes place where the lesion reaches its maximum parameters.
2.5 Measurement of lesions on MRI scans
Hearts were scanned using the 9.4 T MRI system. Every sample was removed from fixation solution, rinsed with physiological solution (0.9% NaCl, Braun) to remove all formaldehyde and submerged in a plastic jar filled with clean physiological solution and underwent MRI scanning. During immersion of the samples into a physiological solution, a syringe was used to inject a solution into the atria and ventricles, to get rid of air bubbles and blood clots, which possibly could be the cause of MRI artifacts and reduce the quality of MRI slices. All hearts were scanned once. The regions of interest (ROIs) were left heart ventricles with ablation lesions. All MRI scans were performed on a 9.4 T Bruker BioSpec 94/30USR scanner with a Bruker volume coil 1H 198/154 mm. Fast low-angle shot (FLASH) scout images were used to localize the left ventricle with ablation lesions. Proton-density (PD) weighted anatomical images were taken using FLASH sequence with TR = 1268.9 ms, TE = 4.43 ms, FA = 45.7°, FOV 100 mm x 100 mm, 8 averages, and a 256 × 256 image matrix. Eighty axial slices with a thickness of 1.0 mm were acquired; the slices covered the whole heart. The raw MRI data format was exported to the DICOM format for the further analysis. These anatomical images provided sufficient background for optimal visualization of lesions and volumetric data analysis.
Lesions were measured using ImageJ software. After image import, the ImageJ window was calibrated using the known pixel-to-mm ratio (1.024 pixel/mm). The measurement of each lesion took place in a slice, where the lesion reached its maximum parameters of depth (A), width (B), estuary (D), and depth at the maximum diameter (C) (see Figure 1). Each lesion was bounded by a border zone that gave a low signal and was therefore displayed in black (Organ 1976) (Krahn et al., 2018). The border zone was a transition region between the necrotic, ablated and healthy, non-ablated myocardium (Ursell et al., 1985). We measured only the central completely necrotic part of the lesion. The border zone was not included in the measurement of lesion size (see Figure 2).
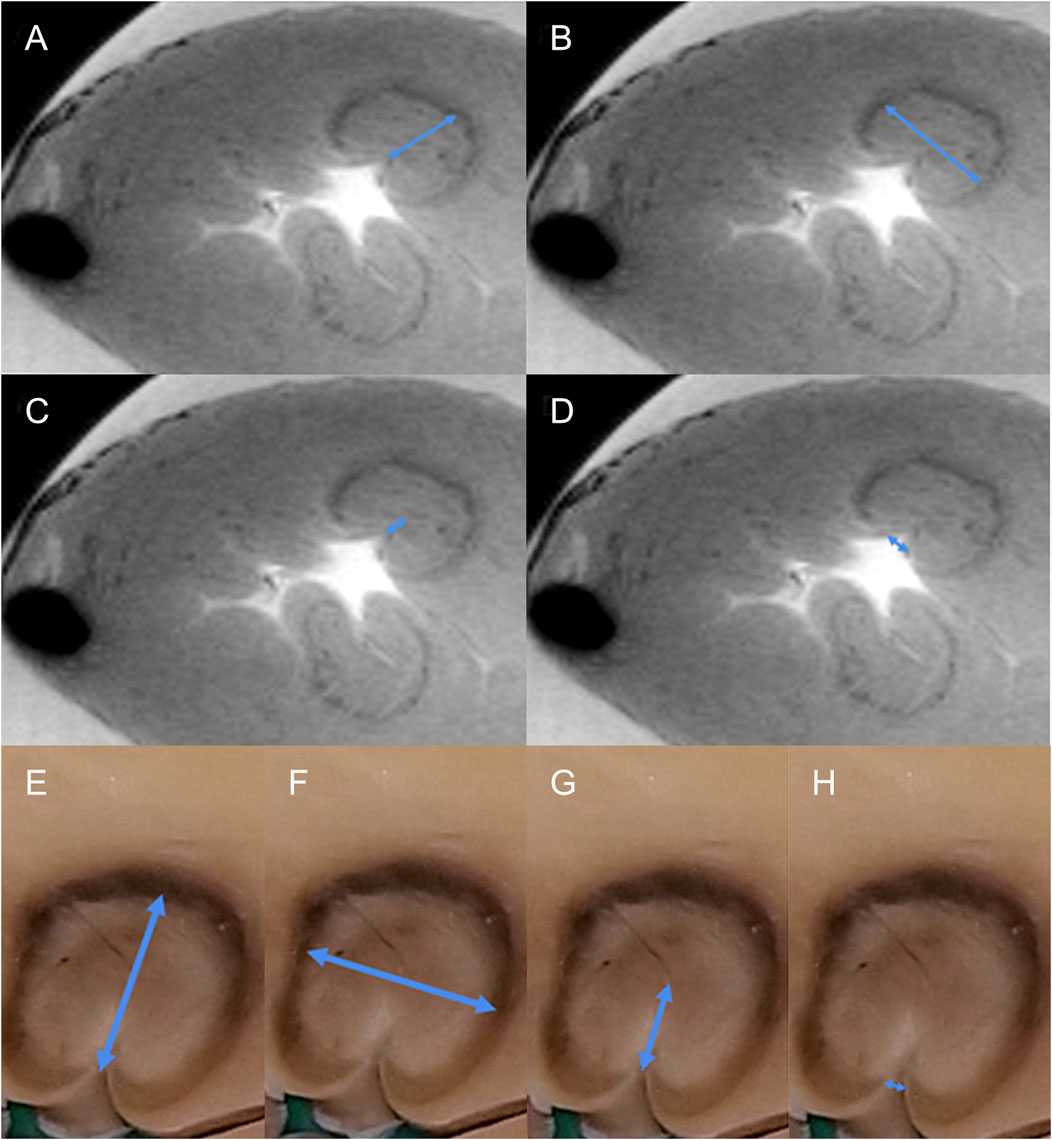
FIGURE 2. Example of measurement of the different dimensions of the radiofrequency lesion. (A–D), measurement from MRI data, transverse section of the left ventricle. Two lesions are visible, the upper one is measured (blue arrows, A = depth, B = width, C = depth at the maximum diameter, and D = lesion surface diameter (“estuary). (E–H), measurement from pathological samples, detail of the lesion, the same measurement as for MRI [blue arrows, E = depth, F = width, G = depth at the maximum diameter, and H = lesion surface diameter (“estuary”)].
The volume of the lesions is calculated according to the abovementioned formula. In addition, we directly measured the lesion volume from MRI slices using the “point by point” method (see Figure 3) which is a variation of the Cavalieri principle. This method consists of gradually outlining the circumference of the lesion in all slices involving the measured lesion. The resulting volume is obtained by the total sum of all individually measured volumes from all slices where the lesion is displayed.
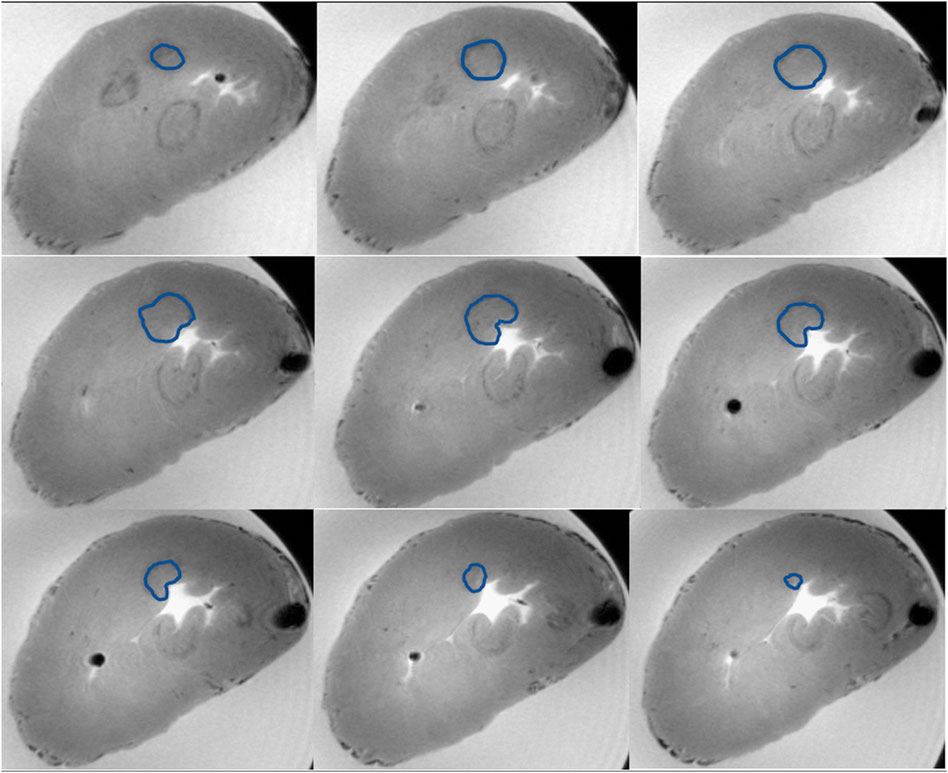
FIGURE 3. Example of volume measurement with the “point-by-point” method from MRI data. On the picture you can see nine subsequent transverse sections of the left ventricle capturing the whole radiofrequency lesion. Three lesions are visible, the upper one is measured. The measured lesion is outlined in all scans with a blue line. The resulting volume is the sum of the individual volumes from all involved MRI scans.
2.6 Measurement of lesions on pathology slices
As a first step, the heart was manually sliced on the macrotome (see Figure 4), a device originally developed by Templeton in 1961 (Templeton 1961) for slicing brains during histopathological examinations. The macrotome consists of the following: a base plate made of plexiglass with dimensions 220 × 240 × 8 mm. In the plate, there are holes with a diameter of 5 mm, which are arranged in parallel rows. The distance between the holes is 1 cm in rows along the longer side of the plate and 0.7 cm in rows along the shorter side of the plate. The next parts of the macrotome are fixing pins, which are 11.8 cm long and have a diameter of 0.8 cm. One end of the pins is tapered to a diameter of 0.5 cm and is used to insert the pin into the plate. The swine heart is placed on the plate of the macrotome and is fixed by pins all the way round. Using a long sharp knife, the heart is gradually sliced.
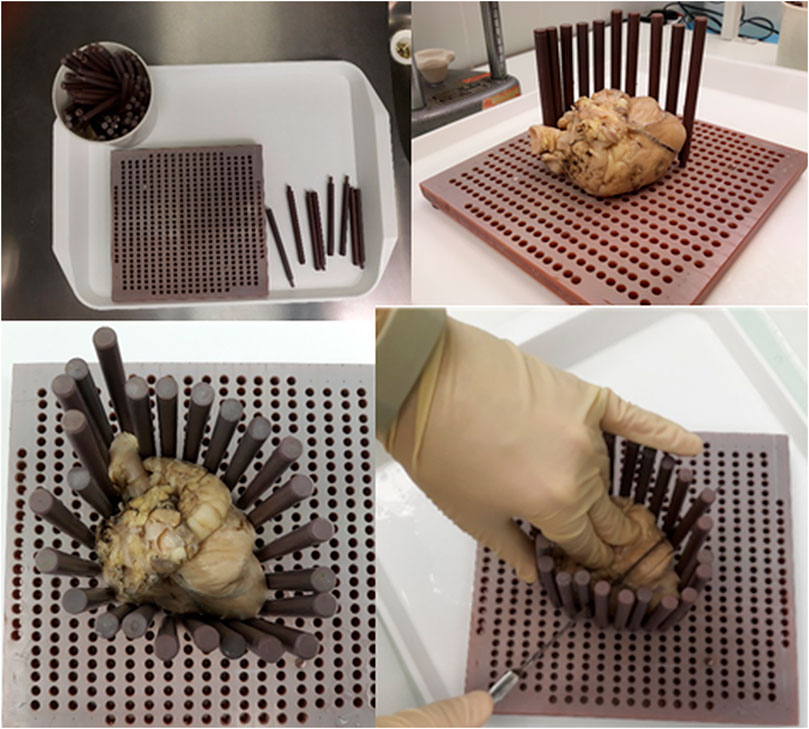
FIGURE 4. Use of the macrotome for slicing of the ventricles. In the basic plate are holes arranged in parallel rows. The swine heart is placed on the macrotome plate and fixed by pins all the way round. The heart is gradually sliced using a long sharp knife.
Every heart was removed from the fixation solution, placed in a flow box, and manually sliced using the above-mentioned macrotome to 3–5-mm-thick slices. Slices were laid side by side, and pictures were taken using a camera (see Figure 5). All hearts were photographed in this way. The whole preparation of the heart for measuring pathological sections took approximately 20 min (fix the heart on the macrotome and slice it, take a photo, and upload it to ImageJ). Photos were imported to the ImageJ program. The calibration of the software was set manually according to the settings of the caliper, which is located on each photo and shows exactly the size of 1 cm. The depth, width, estuary, and depth at the maximum diameter were measured in the same way, as in MRI scans (from photo where is the lesion in maximal dimensions, black surrounding zone not included) (see Figure 2). The volume of the lesions was calculated using the abovementioned formula.
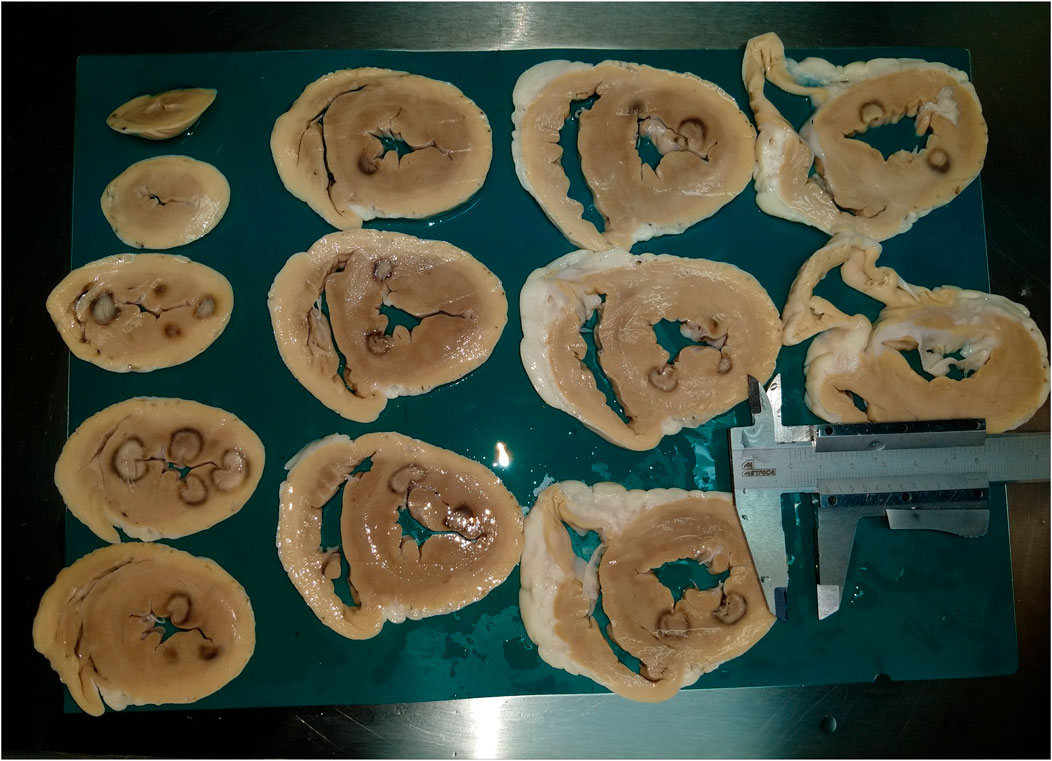
FIGURE 5. Example of a pathological picture used for measurement of radiofrequency lesions. On the picture you can see 13 subsequent transverse sections of the left ventricle. Radiofrequency lesions are visible. There is a caliper showing the exactly 1 cm, which was used to calibrate the software ImageJ.
2.7 Statistical analysis
All variables are described as mean ± SD, if symmetrically distributed, otherwise as median (IQR). In order to compare measurements for all within-subjects factors—method (MRI, patho), observer (two independent persons), and measurement (all lesions were measured three times by each method and observer), least squares means from multilevel (mixed-effect) models were compared separately for depth, width, estuary, depth at the maximum diameter, volume calculated by formula, and for volume directly measured from MRI with the “point-by-point” method. No interactions among factors were considered. Additionally, in the case of variable width, the measurements were split into two separate models by a factor observer in order to analyze the data independently on the observer. In the analysis of the time of measurement, due to skewness, the data were first log-transformed and then a least squares means from multilevel (mixed-effect) model was used to compare the methods (MRI, patho) as a single within-subjects factor. Comparison of recognized lesions was performed using the chi-square test. All tests were performed at a significance level of α = 0.05. Statistical analysis was conducted using R version 3.6, RStudio version 1.2.1335, and package lme4 version 1.1–21.
3 Results
Histological characteristics of lesions created after RF ablation of porcine hearts are signs of coagulative necrosis characterized by karyolysis with significant cytoplasmic hypereosinophilia. Each of the lesions was loosely demarcated by a narrow border zone consisting of cardiomyocytes in different stages of cell damage. Unaffected tissue displays no tissue damage and retains the conventional morphology of cardiac tissue (see Figure 6).
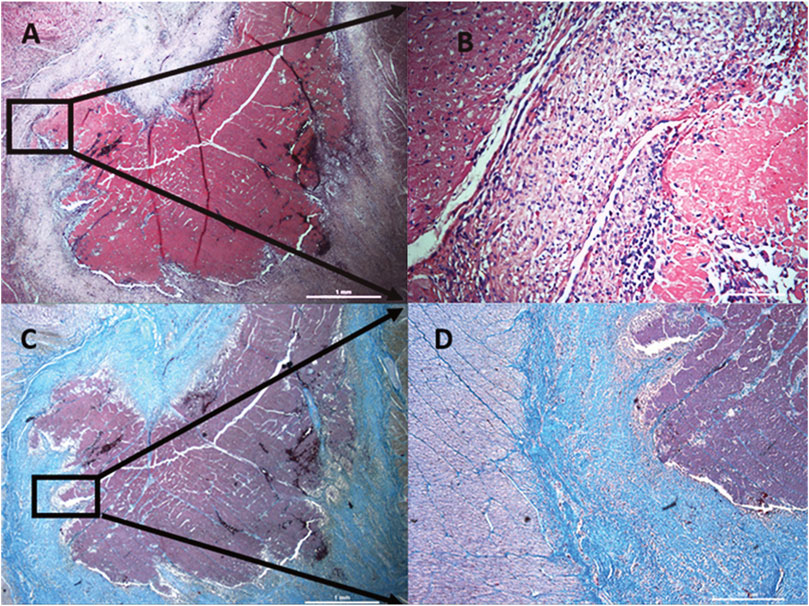
FIGURE 6. Histological characteristics of lesions created after radiofrequency ablation of porcine hearts. Lesions created by radiofrequency ablation are formed by coagulation necrosis, where cells have no borders and they are completely destroyed. Nuclei are not visible. Every lesion is surrounded by a differently wide rim consisting of cells at different stages of necrosis (damaged cell membrane and nuclei) sharply transitioning into healthy cardiomyocytes (clearly demarcated individual cells, pink cytoplasm, distinct purple nuclei). (A) hematoxylin-eosin staining, magnification 25x. (B) detail from A, magnification 200x, (C) trichrome staining, magnification 25x, (D) detail from C, magnification 50x.
A total of 99 lesions were created; the MRI method successfully evaluated 92 (92.93% from all lesions), and with the patho method successfully evaluated 98 (98.99% from all lesions). No statistically significant difference was found (p = 0.755) between the two methods. The depth from MRI was 8.771 ± 2.595 mm, and from patho was 9.008 ± 2.823 mm; p = 0.198. The width of the lesion was 10.802 ± 2.724 mm on MRI, and 11.125 ± 2.801 mm with patho; p = 0.049. The limit p-value for the variable width is created by the interpersonal variability. Splitting models into two independent structures, we observed no statistically significant effect of method. The lesion values were almost identical, showing 2.006 ± 0.867 mm by MRI and 2.001 ± 0.872 mm by patho; p = 0.953. The depth at the maximum diameter was 4.734 ± 1.532 mm in MRI slices and 4.783 ± 1.648 mm from patho slices, p = 0.858. The volumes of the lesions calculated using a formula from both methods were 315.973 ± 257.673 mm3 for MRI and 355.726 ± 255.860 mm3 for patho; p = 0.104. Volume acquired from MRI by the “point-by-point” method was 671.702 ± 362.299 mm3, which is two times larger than the volumes from the patho or MRI calculated using a formula (Table 1).
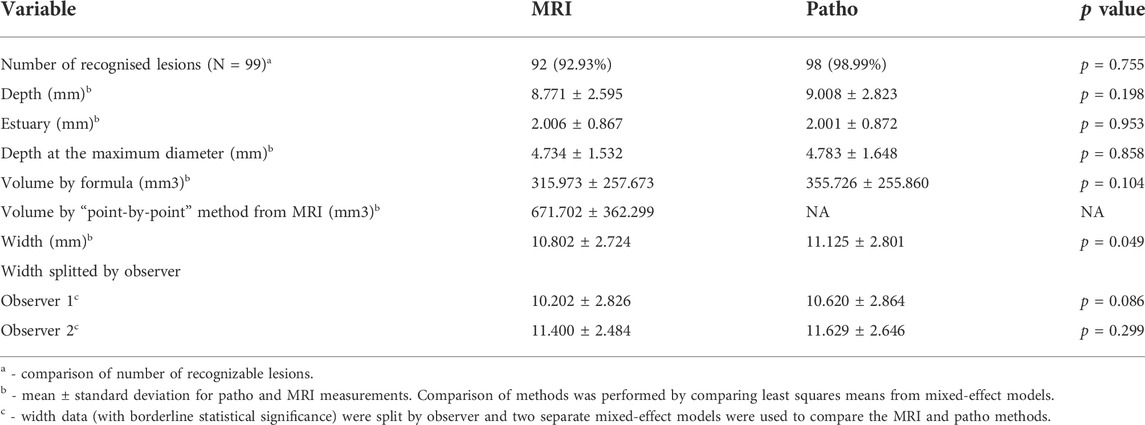
TABLE 1. Comparison of evaluation of radiofrequency lesions with gross pathology inspection (patho) and MRI evaluation.
The complete time for preparing and MRI scanning was 115 ± 3 min (cleaning the heart from formaldehyde, placing it into the physiological solution, setting the MRI device, scanning the MRI sample, and controlling the quality of MRI scans after scanning). Preparing the heart for patho measurement, cutting of the slices on the macrotome for patho measurements and taking photos, took 21 ± 1 min.
The difference between the duration of measurements from MRI slices and from patho as follows: for MRI measurement, the median value was 56 s (53–59.2), whereas the median value for patho was 53 s (47–59), p = 0.001. Statistically significant differences were not found for intrapersonal variability (Supplementary File S1), but for interpersonal variability between observer 1 and observer 2, respectively, as follows: width was 10.418 ± 2.851 mm and 11.518 ± 2.569 mm (p < 0.0001), depth was 8.501 ± 2.937 mm and 9.286 ± 2.416 mm (p < 0.0001), estuary was 2.055 ± 0.867 mm and 1.942 ± 0.870 mm (p = 0.042), and depth at the maximum diameter was 4.638 ± 1.621 mm and 4.909 ± 1.558 mm (p = 0.002), respectively.
4 Discussion
To the best of our knowledge, this is the first study focused on the comparison of two measuring methods (MRI x patho) of ablation lesions in the left ventricle. We compared two possible methods for measuring the dimensions of lesions formed in the myocardium of ventricles after RF ablation in an animal experiment. Our results showed, like the other studies (Lardo Albert et al., 2000; Dickfeld et al., 2007), that measurements obtained from pathology gross inspection (patho) and from MRI are fully comparable. For the variabiles depth, estuary, depth at the maximum diameter, and volume by formula, we found no statistically significant difference between these two methods. The limit p-value for the variable width was created by the interpersonal variability. Splitting models into two independent structures, we observed no statistically significant effect.
We found a statistically significant difference in values for directly measured volume from MRI (“point-by-point” method) and volume calculated by formula from MRI slices or patho. The reason for this is the more precise characteristics of the “point-by-point” method, where the volume was measured as a summary of all partial volumes obtained by manual gradual outlining of the lesion edges from all involved MRI slices. Another method of determining the lesion volume is to use a formula; a prerequisite for successful use of the formula is a regular oval shape of the lesion, which cannot be fully achieved in RF ablation lesions. RF lesions with higher energy settings are not precisely delineated and have a completely irregular shape (Figure 7). Therefore, using a formula to calculate volume has not been successful due to the irregular shape of the lesions. From this point of view, it seems more precise to use the “point-by-point” method.
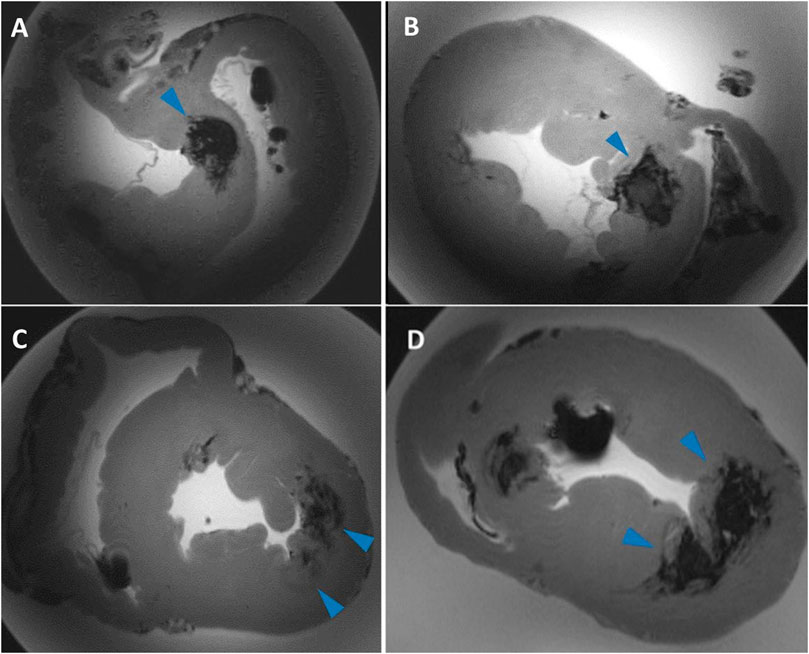
FIGURE 7. Examples of complex lesions. Transverse sections of ventricles of the swine heart on MRI scans. (A,B) shows the irregular shape of lesions with unclear borders. During high energy applications, a “steam pop” sometimes occurs, which causes rupture of the myocardial tissue. This rupture spreads into the myocardium and causes irregular and badly bounded lesions. (C,D) example of fused lesions—lesions formed so close each other that they partially merge into one.
Similar to previous studies (Dinkel et al., 2013) (Bolte et al., 2007) (Zhao et al., 2013) (Thiesse et al., 2016) (Erasmus et al., 2003) (Muenzel et al., 2012) (Lazebnik et al., 2005) we found statistically significant differences in all measured parameters for interpersonal differences between both observers. This can be explained by the high-power values that were used and that we had several “steam pop” effects. If a “steam pop” effect occurred, there was a partial disruption of the myocardium, which spreads to the width and not to the depth of the tissue. For complex lesions such as RF lesions, is not easy to pinpoint the maximal parameters of the lesion after “steam pop” (Figure 7). Another possible explanation for the statistically significant difference in interpersonal differences is an individual assessment on which MRI slice the lesion reaches its maximum size. In addition, on several occasions, the individual lesions were placed close together such that they partially fused together (Figure 7). In this case, it depended on the individual evaluation of each observer as to where was the exact border of every lesion was.
No statistically significant difference was found in intrapersonal variability. This indicates the reproducibility of both measurement methods (see Supplementary File S1).
An important parameter for the evaluation of lesions is the time needed to perform a single measurement. We compared how long it takes to measure the basic parameters of the lesion (depth, width, estuary, and depth at the maximum diameter) from MRI slices and patho samples. The difference between the duration of measurements from MRI slices (without gradual outlining) and from patho was statistically significant (p = 0.001). The median value for MRI measurement was 56 s (53–59.2) and for patho measurement was 53 s (47–59). The difference between the duration of the measurement is significant from a statistical point of view; however, a difference of 3 s is from a practical point of view is negligible.
If outlining by the “point by point” method is included in the time measurement, the measurement of the lesion from MRI slices is significantly longer. In particular, the duration was 235.5 s (201–268.25) for overall MRI measurement and 177.5 s (144.8–208.5) for “point-by-point only.” This increase in time is fully compensated by the higher accuracy of the “point-by-point” method.
In our work, we recognized 92.93% of the lesions on MRI scans compared with 75% published by (Berte et al., 2015). In our study, were created 99 lesions in total; 92 lesions (92.93%) were identified by MRI and 98 (98.99%) lesions were identified by patho. One lesion could not be traced on patho or MRI, which represents 1.01%. Three lesions were not recognized in one heart as they were covered by a single MRI artifact and could not be identified in the first scan, representing 3.03% of all lesions. Three additional lesions were identified by patho, but not recognized on MRI. These lesions were small and did not have high intensity border with an overall “ghost-like” character.
In our study, hearts underwent MRI scanning submerged in physiological solution (0.9% NaCl, Braun), which is easy to handle and obtain. On the other hand, there is a background signal on MRI scans; thus, the image background of the scan is gray and produces suboptimal contrast. The use of Fomblin Y06/6 is recommended by other authors for optimal outcomes (Bulte et al., 2003) (Lipinski et al., 2006).
In Figure 7 there is a certain inhomogeneity of the image. The shading and the brightness difference in the center and the periphery of the image is an MRI artifact occurring during the scanning of larger dimension samples. Since the hearts were not exactly the same shape and size, the artifact occurred only by some of them. This artifact did not interfere with the lesions, thus did not obstruct the image processing, and did not affect the results. Therefore we did not use any filter. For the future, we are working on the filter creating and applying it on such sample scans.
A limitation of our study is that it is an ex vivo model on a non-beating pig heart. Also evaluation is limited in visualization of small, not very well-demarcated lesions. As well, preparing of the heart before MRI scanning and the scanning time itself is longer than that of gross pathology inspection. Furthermore, access to a 9.4 T MRI device is required. Not negligible is also the purchase price of MRI machine and the price of the organ scanning. As the limitation of our study must be also mentioned statistically significant difference in interpersonal differences in our case. Interpersonal differences will decrease with the gradually increasing experience of the observes.
5 Conclusion
Measurements obtained from pathology gross inspection and MRI scanning did not significantly differ in absolute values; however, MRI allows a significantly more precise assessment of lesion volume. The measurement time of the lesions on MRI was significantly longer from the statistical point of view, but negligible from a practical point of view. MRI evaluation is a nondestructive method, allowing for diverse scanning angles, resulting in clear lesion definition and more precise volume assessment.
Data availability statement
The original contributions presented in the study are included in the article/Supplementary Materials, further inquiries can be directed to the corresponding author.
Ethics statement
The animal experiment was approved by the ethics committee of the University of Veterinary and Pharmaceutical Sciences in Brno (approval number 12–2018) and by the Ministry of Education Youth and Sports (approval number MSMT-17402/2018–3). All procedures performed on pigs were in accordance with Directive 2010/63/EU of the European Parliament on the protection of animals used for scientific purposes.
Author contributions
Conceptualization GC, ZS, EO, and MP; methodology GC, ZS, EO, and MP; MRI samples preparation EO, GC and IP; MRI scanning IP; formal analysis VR, TK; investigation EO, LV, ZS, GC, IP, ED and VK; writing‐original draft preparation EO, ZS; writing—review and editing, GC, TK, TJ, ED, IP, and MP; supervision ZS; project administration EO, ZS; funding acquisition ZS. All authors have read and agreed to the published version of the manuscript.
Funding
This research was supported by the European Regional Development Fund‐Project ENOCH (No. CZ.02.1.01/0.0/0.0/16_019/0000868) and Medical University of Silesia statutory funds (KNW-1-048/N/9/K, PCN-1-005/N/0/K. The MR measurements were supported by the grant LM2015062 “National Infrastructure for Biological and Medical Imaging (Czech-BioImaging)”. This publication was supported also by Masaryk University (project “New imaging, computational and analytical methods in diagnostics and monitoring of cardiovascular disorders” MUNI/A/1462/2021) with the support of the Specific University Research Grant, as provided by the MEYS CR in 2022.
Conflict of interest
The reviewer PL declared a shared affiliation, with no collaboration, with one of the authors, GC, to the handling editor at the time of the review.
Publisher’s note
All claims expressed in this article are solely those of the authors and do not necessarily represent those of their affiliated organizations, or those of the publisher, the editors and the reviewers. Any product that may be evaluated in this article, or claim that may be made by its manufacturer, is not guaranteed or endorsed by the publisher.
Supplementary material
The Supplementary Material for this article can be found online at: https://www.frontiersin.org/articles/10.3389/fphys.2022.834328/full#supplementary-material
References
Badger Troy J., Daccarett Marcos, Akoum Nazem W., YawAdjei-Poku A., Burgon Nathan S., Haslam Thomas S., et al. (2010). Evaluation of left atrial lesions after initial and repeat atrial fibrillation ablation: Lessons learned from delayed-enhancement MRI in repeat ablation procedures. Circ. Arrhythm. Electrophysiol. 3 (3), 249–259. doi:10.1161/CIRCEP.109.868356
Berte Benjamin, Hubert Cochet, Magat Julie, Naulin Jérôme, Ghidoli Daniele, Pillois Xavier, et al. (2015). Irrigated needle ablation creates larger and more transmural ventricular lesions compared with standard unipolar ablation in an ovine model. Circ. Arrhythm. Electrophysiol. 8 (6), 1498–1506. doi:10.1161/CIRCEP.115.002963
Bolte H., Jahnke T., Schäfer F. K. W., Wenke R., Hoffmann B., Freitag-Wolf S., et al. (2007). Interobserver-variability of lung nodule volumetry considering different segmentation algorithms and observer training levels. Eur. J. Radiol. 64 (2), 285–295. doi:10.1016/j.ejrad.2007.02.031
Bulte Jeff W. M., Einstein Ophira, Reinhartz Etti, Zywicke Holly A., Douglas Trevor, Frank Joseph A., et al. (2003). MR microscopy of magnetically labeled neurospheres transplanted into the lewis EAE rat brain. Magn. Reson. Med. 50 (1), 201–205. doi:10.1002/mrm.10511
Delacretaz E., Wtlliam G. S., Winters G. L., Lynch K., Peter L., Lynch K., et al. (1999). Ablation of ventricular tachycardia with a saline-cooled radiofrequency catheter: Anatomic and histologic characteristics of the lesions in humans. J. Cardiovasc. Electrophysiol. 10 (6), 860–865. doi:10.1111/j.1540-8167.1999.tb00267.x
Dickfeld Timm, Kato Ritsushi, Zviman Menekem, Nazarian Saman, Dong Jun, Ashikaga Hiroshi, et al. (2007). Characterization of acute and subacute radiofrequency ablation lesions with non-enhanced magnetic resonance imaging. Heart rhythm. 4 (2), 208–214. doi:10.1016/j.hrthm.2006.10.019
Dinkel J., Khalilzadeh O., Hintze C., Fabel M., Puderbach M., Eichinger M., et al. (2013). Inter-observer reproducibility of semi-automatic tumor diameter measurement and volumetric analysis in patients with lung cancer. Lung Cancer 82 (1), 76–82. doi:10.1016/j.lungcan.2013.07.006
Erasmus Jeremy, Gladish Gregory, Broemeling Lyle, Bradley Sabloff, Truong Mylene, Herbst Roy, et al. (2003). Interobserver and intraobserver variability in measurement of non-small-cell carcinoma lung lesions: Implications for assessment of tumor response. J. Clin. Oncol. 21 (32), 2574–2582. doi:10.1200/JCO.2003.01.144
Erturk M. A., Li X., Pierre-Fancois V., Ugurbil K., Gregory J. (2019). Evolution of UHF body imaging in the human torso at 7T: Technology, applications, and future directions. Top. Magn. Reson. Imaging 28 (3), 101–124. doi:10.1097/RMR.0000000000000202
Ertürk M. Arcan, Wu Xiaoping, Eryaman Yiğitcan, Pierre-François Van de Moortele , Auerbach Edward J., Lagore Russell L., et al. (2017). Toward imaging the body at 10.5 tesla. Magn. Reson. Med. 77 (1), 434–443. doi:10.1002/mrm.26487
Gepstein L., Gal H., Shpun S., Cohen D., Shlomo A. (1999). Atrial linear ablations in pigs: Chronic effects on atrial electrophysiology and pathology. Circulation 100 (4), 419–426. doi:10.1161/01.CIR.100.4.419
Guerra Jose M., Jorge E., Raga S., Galvez-Monton C., Alonso-Martin C., Rodriguez-Font E., et al. (2017). Effects of open-irrigated radiofrequency ablation catheter design on lesion formation and complications: In vitro comparison of 6 different devices: In vitro comparison of open-irrigated catheters. J. Cardiovasc. Electrophysiol. 24, 1157–1162. doi:10.1111/jce.12175
Haines D. E., Verow A. F. (1990). Observations on electrode-tissue interface temperature and effect on electrical impedance during radiofrequency ablation of ventricular myocardium. Circulation 82 (3), 1034–1038. doi:10.1161/01.CIR.82.3.1034
Haines David (2018). Biophysics of ablation: Application to technology. J. Cardiovasc. Electrophysiol. 15 (10), S11–S11. doi:10.1046/j.1540-8167.2004.15102.x
Haines David E., Watson Denny D. (1989). Tissue heating during radiofrequency catheter ablation: A thermodynamic model and observations in isolated perfused and superfused canine right ventricular free wall. Pacing Clin. Electrophysiol. 12 (6), 962–976. doi:10.1111/j.1540-8159.1989.tb05034.x
Haverkamp Wilhelm, Hindricks Gerhard, Gulker Hartmut, Rissel Ulrich, Pfennings Winnfried, Martin Borggrefe, et al. (1989). Coagulation of ventricular myocardium using radiofrequency alternating current: Bio-physical aspects and experimental findings. Pacing Clin. Electrophysiol. 12 (1), 187–195. doi:10.1111/j.1540-8159.1989.tb02646.x
Heo Dan, Lim Soyeon, Lee Jiye, Lee Myung Eun, Cho Soyoung, Jeong Jisu, et al. (2019). Radiological assessment of effectiveness of soluble RAGE in attenuating angiotensin II-induced LVH mouse model using in vivo 9.4T MRI. Sci. Rep. 9 (23), 8475. doi:10.1038/s41598-019-44933-6
Ishihara Yuri, Reza Nazafat John V. Wylie, Linguraru Marius G., Josephson Mark E., Howe Robert D., Manning Warren J., et al. 2007. “MRI evaluation of RF ablation scarring for atrial fibrillation treatment.” In , edited by Kevin R. Cleary and michael I. Miga, 65090Q. San Diego, CA. doi:10.1117/12.710323
Kalbfleisch Steven J., Langberg Jonathan J. (1992). Catheter ablation with radiofrequency energy: Biophysical aspects and clinical applications. J. Cardiovasc. Electrophysiol. 3 (2), 173–186. doi:10.1111/j.1540-8167.1992.tb01106.x
Krahn Philippa R. P., Singh Sheldon M., Biswas Labonny, Yak Nicolas, KevanAnderson J. T., Barry Jennifer, et al. (2018). Cardiovascular magnetic resonance guided ablation and intra-procedural visualization of evolving radiofrequency lesions in the left ventricle. J. Cardiovasc. Magn. Reson. 20. doi:10.1186/s12968-018-0437-z
Lardo Albert C., McVeigh Elliot R., Pitayadet J., Berger Ronald D., Hugh C., Lima J., et al. (2000). Visualization and temporal/spatial characterization of cardiac radiofrequency ablation lesions using magnetic resonance imaging. Circulation 102 (6), 698–705. doi:10.1161/01.CIR.102.6.698
Lazebnik R. S., Brent D., Weinberg M. S. B., Jonathan S. L., Wilson D. L. (2005). Semiautomatic parametric model-based 3D lesion segmentation for evaluation of MR-guided radiofrequency ablation therapy. Acad. Radiol. 12 (12), 1491–1501. doi:10.1016/j.acra.2005.07.011
Lipinski M. J., Vardan J. C., Karen C. B., Fuster V., Fallon J. T., Fisher E. A., et al. (2006). MRI to detect atherosclerosis with gadolinium-containing immunomicelles targeting the macrophage scavenger receptor. Magn. Reson. Med. 56 (3), 601–610. doi:10.1002/mrm.20995
Markman Timothy M., Saman Nazarian. (2017). Cardiac magnetic resonance for lesion assessment in the electrophysiology laboratory. Circ. Arrhythm. Electrophysiol. 10 (11), e005839. doi:10.1161/CIRCEP.117.005839
Muenzel Daniela, Engels Heinz-Peter, Bruegel Melanie, Kehl Victoria, Rummeny Ernst, Metz Stephan (2012). Intra- and inter-observer variability in measurement of target lesions: Implication on response evaluation according to RECIST 1.1. Radiol. Oncol. 46 (1), 8–18. doi:10.2478/v10019-012-0009-z
Nakagawa H., Yamanashi W. S., Pitha J. V., Arruda M., Wang X., Ohtomo K., et al. (1995). Comparison of in vivo tissue temperature profile and lesion geometry for radiofrequency ablation with a saline-irrigated electrode versus temperature control in a canine thigh muscle preparation. Circulation 91 (8), 2264–2273. doi:10.1161/01.CIR.91.8.2264
Nath S., DiMarco J. P., Haines D. E. (1994). Basic aspects of radiofrequency catheter ablation. J. Cardiovasc. Electrophysiol. 5 (10), 863–876. doi:10.1111/j.1540-8167.1994.tb01125.x
Organ L. W. (1976). Electrophysiologic principles of radiofrequency lesion making. Appl. Neurophysiol. 39 (2), 69–76. doi:10.1159/000102478
O’Donnell David, Nadurata Voltaire (2004). Radiofrequency ablation for post infarction ventricular tachycardia. Indian Pacing Electrophysiol. J. 4 (2), 63–72.
Rueden Curtis T., Johannes Schindelin, Mark C. H., Ellen T. A., Eliceiri Kevin W., Walter A. E., et al. (2017). ImageJ2: ImageJ for the next generation of scientific image data. BMC Bioinforma. 18 (76), 529. doi:10.1186/s12859-017-1934-z
Santos Braggion, Fernanda Maria, Koenigkam-Santos Marcel, Reis Teixeira Sara, Volpe G. J., Trad H. S. (2013). Magnetic resonance imaging evaluation of cardiac masses. Arq. Bras. Cardiol. 101, 263–272. doi:10.5935/abc.20130150
Schindelin Johannes, Rueden Curtis T., Hiner Mark C., Eliceiri Kevin W. (2015). The ImageJ ecosystem: An open platform for biomedical image analysis. Mol. Reprod. Dev. 82 (7–8), 518–529. doi:10.1002/mrd.22489
Schneider Jürgen E., Lanz Titus, Barnes Hannah, Bohl Steffen, Lygate Craig A., Ordidge Roger J., et al. (2011). Accelerated cardiac magnetic resonance imaging in the mouse using an eight-channel array at 9.4 tesla: Accelerated cardiac MRI in mice at 9.4 T. Magn. Reson. Med. 65 (1), 60–70. doi:10.1002/mrm.22605
Schneider Jürgen E., Lanz Titus, Barnes Hannah, Medway Debra, Lygate Craig A., Smart Sean, et al. (2008). Ultra-fast and accurate assessment of cardiac function in rats using accelerated MRI at 9.4 tesla. Magn. Reson. Med. 59 (3), 636–641. doi:10.1002/mrm.21491
Song Kyoung D., Lee Min Woo, Rhim Hyunchul, Kang Tae Wook, DongCha Ik, Yang Jehoon (2017). Chronological changes of radiofrequency ablation zone in rabbit liver: An in vivo correlation between gross pathology and histopathology. Br. J. Radiol. 90 (1071), 20160361. doi:10.1259/bjr.20160361
Suzuki Atsushi, Lehmann H. Immo, Wang Songyun, Monahan Kristi H., Parker Kay D., Rettmann Maryam E., et al. (2021). Impact of myocardial fiber orientation on lesions created by a novel heated saline-enhanced radiofrequency needle-tip catheter: An MRI lesion validation study. Heart rhythm. 18 (3), 443–452. doi:10.1016/j.hrthm.2020.11.015
Templeton McCormick (1961). A simple macrotome for soft tissues. Stain Technol. 36 (4), 255–256. doi:10.3109/10520296109113287
Thiesse P., Ollivier L., Di Stefano-Louineau D., Négrier S., Savary J., Pignard K., et al. (2016). Response rate accuracy in oncology trials: Reasons for interobserver variability. Groupe français d’Immunothérapie of the fédération nationale des centres de Lutte contre le cancer. J. Clin. Oncol. 15, 3507–3514. doi:10.1200/JCO.1997.15.12.3507
Tofig Bawer J., Peter Lukac, Nielsen Jan M., EsbenHansen S. S., RasmusTougaard S., HenrikJensen K., et al. (2019). Radiofrequency ablation lesions in low-intermediate-and normal-voltage myocardium: An in vivo study in a porcine heart model. Europace 21 (12), 1919–1927. doi:10.1093/europace/euz247
Ursell P. C., Gardner P. I., Albala A., Fenoglio J. J., Wit A. L., AlbAlA A. (1985). Structural and electrophysiological changes in the epicardial border zone of canine myocardial infarcts during infarct healing. Circ. Res. 56 (3), 436–451. doi:10.1161/01.RES.56.3.436
Wech Tobias, Seiberlich Nicole, Schindele Andreas, Grau Vicente, Diffley Leonie, Gyngell Michael L., et al. (2016). Development of real-time magnetic resonance imaging of mouse hearts at 9.4 tesla – simulations and first application. IEEE Trans. Med. Imaging 35 (3), 912–920. doi:10.1109/TMI.2015.2501832
Zhao Binsheng, Tan Yongqiang, Bell Daniel J., Marley Sarah E., Guo Pingzhen, Mann Helen, et al. (2013). Exploring intra- and inter-reader variability in uni-dimensional, Bi-dimensional, and volumetric measurements of solid tumors on CT scans reconstructed at different slice intervals. Eur. J. Radiol. 82 (6), 959–968. doi:10.1016/j.ejrad.2013.02.018
Keywords: evaluation of radiofrequency ablation lesions, comparison of methods, gross pathology inspection, high-resolution MRI evaluation, animal experiments, catheter ablation of arrhythmias, ex vivo MRI scanning
Citation: Odehnalová E, Valíková L, Caluori G, Kulík T, Římalová V, Jadczyk T, Dražanová E, Pavlova I, Pešl M, Kubeš V and Stárek Z (2022) Comparison of gross pathology inspection and 9.4 T magnetic resonance imaging in the evaluation of radiofrequency ablation lesions in the left ventricle of the swine heart. Front. Physiol. 13:834328. doi: 10.3389/fphys.2022.834328
Received: 13 December 2021; Accepted: 03 October 2022;
Published: 19 October 2022.
Edited by:
Geoffrey A. Head, Baker Heart and Diabetes Institute, AustraliaReviewed by:
Peter Latta, Central European Institute of Technology (CEITEC), CzechiaKyungjoon (Joon) Lim, The University of Sydney, Australia
James Todd Pearson, National Cerebral and Cardiovascular Center (Japan), Japan
Copyright © 2022 Odehnalová, Valíková, Caluori, Kulík, Římalová, Jadczyk, Dražanová, Pavlova, Pešl, Kubeš and Stárek. This is an open-access article distributed under the terms of the Creative Commons Attribution License (CC BY). The use, distribution or reproduction in other forums is permitted, provided the original author(s) and the copyright owner(s) are credited and that the original publication in this journal is cited, in accordance with accepted academic practice. No use, distribution or reproduction is permitted which does not comply with these terms.
*Correspondence: Zdeněk Stárek, emRlbmVrLnN0YXJla0BmbnVzYS5jeg==