 Adrián Montes-de-Oca-García1,2
 Juan Corral-Pérez1,2
 Daniel Velázquez-Díaz1,2,3
 Alejandro Perez-Bey2,4María Rebollo-Ramos1,2
 Alberto Marín-Galindo1,2
 Félix Gómez-Gallego5
 Maria Calderon-Dominguez2,6
 Cristina Casals1,2*
 Jesús G. Ponce-González1,2
- 1MOVE-IT Research Group, Department of Physical Education, Faculty of Education Sciences, University of Cadiz, Cádiz, Spain
- 2Research Unit, Biomedical Research and Innovation Institute of Cadiz (INiBICA), Puerta Del Mar University Hospital, University of Cadiz, Cádiz, Spain
- 3Department of Psychology, Brain Aging and Cognitive Health Laboratory, University of Pittsburgh, Pittsburgh, PA, United States
- 4Department of Physical Education, GALENO Research Group, Faculty of Education Sciences, University of Cadiz, Cádiz, Spain
- 5Faculty of Health Sciences, International University of La Rioja, Logroño, Spain
- 6Biomedicine, Biotechnology and Public Health Department, University of Cadiz, Cádiz, Spain
This study aimed to analyze the influence of the peroxisome proliferator-activated receptor (PPAR)-gamma coactivator (PGC)-1 alpha (PPARGC1A) gene rs8192678 C>T polymorphism on different health-related parameters in male and female young adults. The PPARGC1A gene rs8192678 polymorphism was ascertained by polymerase chain reaction in 74 healthy adults (28 women; 22.72 ± 4.40 years) from Andalusia (Spain). Health-related variables included cardiometabolic risk, anthropometry and body composition, biochemical parameters, insulin sensitivity (QUICKI and HOMA-IR indexes), blood pressure (BP) at rest and after exercise, diet, basal metabolism, physical activity, maximal fat oxidation, and cardiorespiratory fitness. Our results showed differences by PPARGC1A gene rs8192678 C>T polymorphism in body mass (p = 0.002), body mass index (p = 0.024), lean body mass (p = 0.024), body fat (p = 0.032), waist circumference (p = 0.020), and BP recovery ratio (p < 0.001). The recessive model (CC vs. CT/TT) showed similar results but also with differences in basal metabolism (p = 0.045) and total energy expenditure (p = 0.024). A genotype*sex interaction was found in the QUICKI index (p = 0.016), with differences between CC and CT/TT in men (p = 0.049) and between men and women inside the CT/TT group (p = 0.049). Thus, the PPARGC1A gene rs8192678 C>T polymorphism is associated with body composition, basal metabolism, total energy expenditure, and BP recovery, where the CC genotype confers a protective effect. Moreover, our study highlighted sexual dimorphism in the influence of PPARGC1A gene rs8192678 C>T polymorphism on the QUICKI index.
Introduction
The peroxisome proliferator-activated receptor-gamma (PPARγ) coactivator-1 alpha (PPARGC1A, also known as PGC-1α), initially identified as a coactivator of PPARγ, is a transcriptional coactivator of the PPAR superfamily of nuclear receptors (Zhu et al., 2009). It interacts with PPARγ, influencing many other transcriptional factors that may affect health status (Janani and Ranjitha Kumari, 2015). PGC-1α is involved in mitochondrial biogenesis, glucose utilization, gluconeogenesis, insulin signaling, fatty acid oxidation, and thermogenesis (Petr et al., 2018). In humans, the PPARGC1A gene coactivates multiple transcriptional factors involved in a wide variety of biological responses (Tharabenjasin et al., 2019); thus, it is a crucial protein in human metabolism (Liang and Ward, 2006).
The three most studied Single Nucleotide Polymorphisms (SNPs) of the PPARGC1A gene are PPARGC1A rs8192678, PPARGC1A rs2970847, and PPARGC1A rs3736265. Regarding rs8192678 polymorphism, a C→T substitution leading to the change of glycine with serine in codon 482 (Gly482Ser), can be considered the most important polymorphism of PPARGC1A (Csép et al., 2017), with controversial results about the influence on gene expression (Csép et al., 2017) and, hence, on PGC-1α functions (Wu et al., 2016). In this line, the T allele (482Ser) of the PPARGC1A polymorphism has been associated with reduced expression of PPARGC1A (Wu et al., 2016).
The PPARGC1A gene rs8192678 polymorphism has been previously related to the development of obesity (Mirzaei et al., 2012; Franks et al., 2014; Costa-Urrutia et al., 2018; Zamaninour et al., 2018), biochemical parameters such as glucose, insulin, triglycerides and inflammatory markers, resting energy expenditure (Mirzaei et al., 2012), and physical fitness level (Costa-Urrutia et al., 2018). In fact, it has been speculated that altered PPARGC1A gene expression might contribute to developing insulin resistance by impaired metabolic pathways related to cardiovascular risk (e.g., PPAR-mediated adipocyte differentiation, lipid oxidation, gluconeogenesis in the liver, or glucose transport in the muscles) (Vohl et al., 2005). Furthermore, PPARGC1A rs8192678 polymorphism could affect muscle fiber type composition due to the influence on mitochondrial biogenesis through PGC-1α (Petr et al., 2018; Tharabenjasin et al., 2019), which is related to fat oxidation capacity (Wu et al., 2016). However, the influence of PPARGC1A (Gly482Ser) polymorphism on fat oxidation capacity during exercise remains unknown despite its relevance as an indicator of metabolic flexibility (Goodpaster and Sparks, 2017).
Notwithstanding, the results of previous studies about the PPARGC1A gene rs8192678 C>T polymorphism and its association with health are not always uniform, being sometimes contradictory or insufficient. Thus, this study aimed to investigate the influence of PPARGC1A gene rs8192678 C>T polymorphism on different health-related parameters in male and female young adults by including body composition, cardiorespiratory fitness (VO2max), basal metabolism, total energy expenditure, maximal fat oxidation (MFO), physical activity, diet, blood pressure, biochemical parameters, insulin sensitivity, and cardiometabolic risk (CMR).
Materials and methods
Design
This study, with a cross-sectional design, was part of the “NutAF research Project” (Rebollo-Ramos et al., 2019; Montes-de-Oca-García et al., 2020; Corral-Pérez et al., 2021; Montes-de-Oca-García et al., 2021). The PPARGC1A gene rs8192678 C>T polymorphism was assessed in a young adult population, investigating any feasible relation with various health outcomes. The Ethical Committee of the Hospital Puerta del Mar (Cadiz, Spain), according to the Helsinki Declaration, approved this study. The participants were fully informed of the aims of the study and any possible side effect, all of them gave their written informed consent. The tests were conducted at the University of Cadiz (Spain), specifically in the Laboratory of Physical Activity and Exercise.
Subjects
A total of 74 Spanish Caucasian subjects [28 women; 22.72 ± 4.40 years old; 25.81 ± 5.61 kg m−2 of body mass index (BMI)] were enrolled. According to one of our main variables, BMI, and using the G*Power software (v. 3.1.9.6, University of Kiel, Germany), we obtained a compute achieved power of 0.95, and an effect size of 0.8, with our sample size. All participants were young adults with different weight status, but healthy (without diseases), living in the province of Cadiz located in Andalusia (Spain). The Table 1 includes the participants’ characteristics. The criteria of inclusion comprised being between 18 and 45 years old, maintaining a stable body mass (±2 kg) in the last 6 months and BMI between 20 and 40 kg · m−2. Participants were excluded from the study if the met the following criteria: having changed their usual diet during the last 6 months (e.g., a weight-loss diet), being an active smoker, or having any cardiovascular disease, injury or any other condition that prevented physical activity.
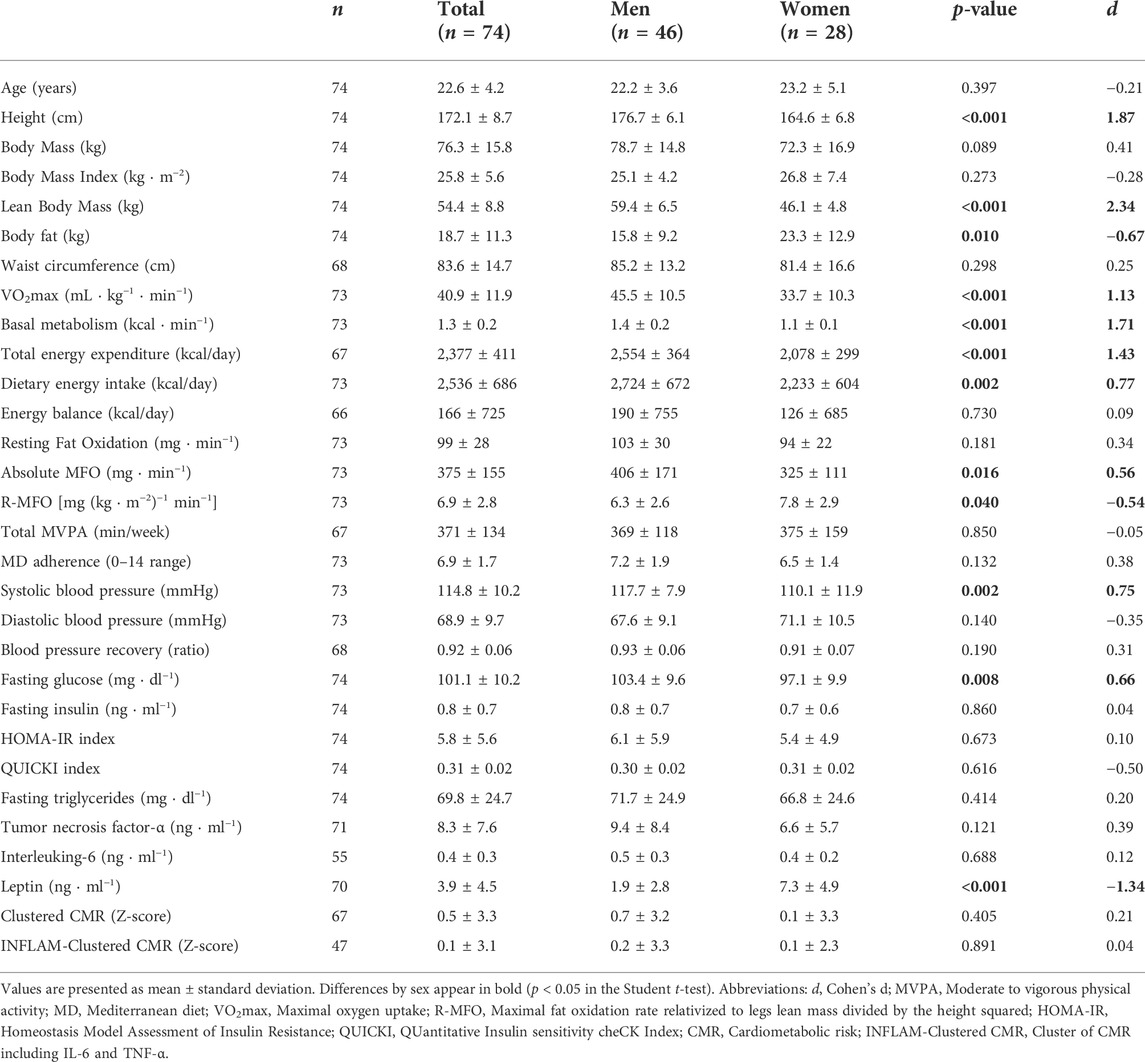
TABLE 1. Participants’ characteristics and differences between sexes.
Procedures
The week before measurements, both diet and physical activity were registered asking to the participants to maintain their usual lifestyles. The day before measurements, participants were directed to maintain their habitual diet/hydration, to avoid alcohol and caffeine intake, and to prevent vigorous physical activity. At the laboratory, basal heart rate and blood pressure were measured, then fasting blood samples were obtained to assess the PPARGC1A gene rs8192678 C>T polymorphism and plasma markers including glucose, triglycerides, interleukin-6 (IL-6), tumor necrosis factor-α (TNF-α), insulin, and leptin. After that, participants underwent anthropometric and body composition assessments and, finally, the physical exercise tests to estimate MFO and maximal oxygen consumption (VO2max).
Physical activity
Accelerometry was used to estimate physical activity (GT3X+, Actigraph TM, LLC, Fort Walton Beach, FL, United States) during the 7 days prior to laboratory tests. During waking hours, the accelerometer was worn on the hip, as previously described (Corral-Pérez et al., 2021). Measures were included in the analysis if at least 10 h/day and 4 days (with one weekend day) were registered. Finally, Moderate to Vigorous Physical Activity (MVPA) was estimated as any activity over 2,691 counts/min (Corral-Pérez et al., 2021). Light Physical Activity (150–2,690 counts/min) was also measured in order to estimate total energy expenditure (Corral-Pérez et al., 2021), which was calculated by adding the basal metabolism and the caloric expenditure of physical activity measured through accelerometry, taking into account the 10% more energy expenditure from the diet-induced thermogenesis.
Dietary assessment
The week before laboratory measurements, all participants completed a dietary record by weighting for five consecutive days, including two weekend days. In order to quantify energy intakes (kcal per day), dietary records were analyzed by using the DIAL software (version 1.19). Likewise, the daily energy balance was calculated as the dietary energy intake minus the total energy expenditure. Concerning dietary patterns, the degree of adherence to the Mediterranean diet of the participants was measured through a 14-item questionnaire (García-Conesa et al., 2020).
Heart rate and blood pressure
Systolic blood pressure (SBP) and diastolic blood pressure (DBP) were measured, after 10 min of sitting rest, by using an Omron M3 digital monitor (HEM-7051-E, Kyoto, Japan) as previously described (Montes-de-Oca-García et al., 2021). Heart rate was recorded at resting and during the exercise tests by using a Polar Team 2 monitoring equipment (Polar Electro Inc., Lake Success, NY, United States). Additionally, the blood pressure recovery from a maximal exercise test was determined by using the SBP in a third minute of recovery to peak exercise SBP ratio (Michaelides et al., 2013).
Blood extraction
Fasting blood samples were taken from the antecubital vein and collected in EDTA tubes, one tube was stored as total blood for genomic typing and the second tube was centrifuged (2,500 rpm, 15 min, 4°C) to obtain plasma that was stored at −80 °C until analyses.
Genomic typing of the PPARGC1A gene rs8192678 C>T polymorphism
Genomic Deoxyribonucleic acid (DNA) was extracted from peripheral blood anticoagulated with EDTA using a standard phenol/chloroform procedure followed by alcohol precipitation. Allelic discrimination analysis was performed by predesigned Life Technologies TaqMan® SNP Genotyping Assays on demand for the PPARGC1A rs8192678 polymorphism (ID: C_1643192_20). A quantitative Real-Time polymerase chain reaction (qRT-PCR) amplification was performed using a StepOne™ Real-Time PCR System (Life Technologies, Foster City, CA, United States) using the next steps: 1) denaturation stage at 95 °C for 10 min, 2) followed by 50 cycles of denaturation at 92 °C for 15 s, 3) annealing/extension at 60 °C for 1 min, and 4) final extension stage of 30 s at 60 °C.
Plasma biochemical parameters
Glucose and triglycerides levels were measured using commercial kits from Spinreact (glucose-HK, ref. 1001200; TAG, ref. 10013110) and following manufactures’ instructions. The intra-assay coefficients of variation were <1% and <0.4%, and inter-assay coefficients of variation were <1.5% and <3.6% for glucose and triglycerides, respectively. Absorbances were obtained using a BIO-TEK PowerWaveTM 340 microplate reader and the BIO-TEK KC JuniorTM program (Bio-Tek Instruments Inc., Winooski, VT, United States).
Plasma IL-6 TNF-α levels, as pro-oxidant cytokines, were determined by Immunology Multiplex Assay MILLIPLEX® MAP Human High Sensitivity T Cell Magnetic Bead Panel 96-Well Plate Assay (HSTCMAG-28SK and HSCRMAG-32K, Merck Millipore, Darmstadt, Germany) and the Luminex® 200TM System (Luminex Corp., Austin, TX, United States) according to the manufacturer’s instructions. The intra-assay coefficients of variation were <5%, and inter-assay coefficients of variation were <15%. Minimum detected value for IL-6 was 0.11 pg · ml−1, and for TNF-α was 0.16 pg · ml−1.
Also, plasma insulin and leptin levels were measured using MILLIPLEX® MAP Human Metabolic Hormone Magnetic Bead Panel (HMHEMAG-34K, Millipore Sigma, Burlington, MA, United States) and Luminex® 200TM System (Luminex Corp., Austin, TX, United States) according to the manufacturer’s instructions. The intra-assay coefficients of variation were <10%, and inter-assay coefficients of variation were <15%. Insulin data in pg · ml−1 was converted to mUI · L−1 (Knopp et al., 2019).
Based on glucose and insulin levels, some indexes were obtained. HOMA-IR (Homeostasis Model Assessment of Insulin Resistance) (Geloneze et al., 2009), and QUICKI (QUantitative Insulin sensitivity cheCK Index) (Sarafidis et al., 2007) were calculated as a previous study of the NutAF project described (Montes-de-Oca-García et al., 2021).
Anthropometry and body composition
Height was registered in a standing position with a rod (SECA 225, range from 60 to 200 cm; 1 mm of precision). Waist circumference was measured using a plastic anthropometric tape (SECA 201; range from 0 to 205 cm; 1 mm of precision) at the midpoint. All measurements were registered by duplicated. Body mass (kg), body fat (kg), and lean body mass (kg) were evaluated through a multi-frequency bioelectrical bioimpedance analyzer with 8-point electrodes (TANITA-MC780MA, Barcelona, Spain). A specific posture was adopted by the participants according to the manufacturer’s instructions, moreover, the subjects were required to urinate before the test, to wear light clothes, and to remove any metal object, such as earrings, watches, etc. The BMI was calculated by dividing body mas in kilograms to squared height in meters.
Basal metabolic rate
The Respiratory Exchange Ratio (RER) and resting fat oxidation were estimated in resting conditions through indirect calorimetry by using a Jaeger MasterScreen CPX® (CareFusion, San Diego, CA, United States) gas analyzer, in a conditioned room (21 ± 1°C, 50 ± 2% relative humidity). The oxygen uptake (VO2) and carbon dioxide production (VCO2) were registered breath-by-breath and averaged every 20 s during 30 min, with the participant wearing a mask and lying in a supine position. A stable period of 5 min with a coefficient of variation for VO2 and VCO2 lower than 15% was selected for the analysis, these VO2 and VCO2 average values were then used to calculate the basal metabolism (kcal) by the Frayn’s equation (Frayn, 1983).
Maximal fat oxidation and cardiorespiratory fitness
The MFO test consisted of a 3-min steps incremental test on a cycle ergometer (Lode Excalibur, Groningen, Netherlands) with 15 W increments in overweight/obese participants and 30 W in normal weight participants, maintaining a pedaling cadence of 60–80 rpm, until RER ≥1. After a 5-min recovery period, the VO2max test was performed (Achten et al., 2002), beginning at the load at which the MFO test ended. The VO2max test consisted of a 1-min incremental test until exhaustion, at the same load rate and cadence as described for the MFO test. A polynomial curve that best fits the present analysis was drawn for each subject by using the values of fat oxidation and % VO2max of each step. Specifically, the VO2 and VCO2 average values of the last 60 s of each step were used to estimate fat oxidation by indirect calorimetry using the mentioned Frayn’s equation (Frayn, 1983). Similarly, in order to calculate the % VO2max reached in each step, the VO2 average values were used. Then, MFO was expressed as absolute values and also relativized to legs lean mass divided by squared height (R-MFO).
Statistical analysis
To verify the Hardy-Weinberg equilibrium and to describe both the genotypic and allelic frequencies, chi-squared test was applied. The Kolmogorov-Smirnov and Levene tests were used to check normality of distribution and homogeneity of variance, respectively.
All variables were separately analyzed and two CMR clusters were obtained. A CMR cluster according to sex was created with the standardized values (Z-score) [(value −mean)/standard deviation] of waist circumference, body fat percentage, SBP, DBP, blood glucose, and triglycerides. The second CMR cluster was created adding the TNF-α and IL-6 markers to the mentioned cluster model (Montes-de-Oca-García et al., 2020; Montes-de-Oca-García et al., 2021).
A one-way analysis of variance (ANOVA), followed by Bonferroni post hoc comparisons, was applied to determine the differences between the PPARGC1A gene rs8192678 C>T polymorphisms (CC, CT, and TT). In addition, a recessive model was included comparing through a Student t-test for independent samples the differences between both groups (CC vs. CT/TT). Differences between sexes were also assessed by using a Student t-test for independent samples. In order to determine the interaction of sex and the PPARGC1A gene rs8192678 C>T polymorphism, a two-way ANOVA and Bonferroni post hoc comparisons were carried out. In all group comparisons, the effect sizes were calculated, thus, statistical analysis included Cohen’s d for Student t-test for independent samples, eta squared (η2) for one-way ANOVA, and partial eta squared (ηp2) for two-way ANOVA.
All analyses were performed by using the IBM SPSS Statistics 22 software (SPSS Inc., Chicago, IL, United States), with significance set at p < 0.05, and expressing data as mean ± standard deviation (SD).
Results
Regarding the general characteristics of the participants that are shown in Table 1, statistically significant differences were found between sexes in height (higher in men; p < 0.001), lean body mass (higher in men; p < 0.001), body fat (higher in women; p = 0.010), VO2max per kilogram of body mass (higher in men; p < 0.001), basal metabolic rate (higher in men; p < 0.001), total energy expenditure (higher in men; p < 0.001), dietary energy intake (higher in men; p = 0.002), absolute MFO rate (higher in men; p = 0.016), R-MFO rate (higher in women; p = 0.040), SBP (higher in men; p = 0.002), fasting blood glucose (higher in men; p = 0.008), and leptin (higher in women; p < 0.001).
The Hardy-Weinberg equilibrium (HWE) test indicated that χ2 = 0.005, p = 0.945, suggesting that the population is consistent with HWE and confirming that the allele types were randomly sampled. The expected frequencies were CC (p = 0.4203) n = 31.1, CT (p = 0.4554) n = 33.7, and TT (p = 0.1230) n = 9.1. The distribution of PPARGC1A genotype frequencies was 42% for CC, 46% for CT, and 12% for TT.
The differences in health-related parameters between PPARGC1A gene variants (CC, CT, and TT) of the participants are presented in Table 2. In the one-way ANOVA, statistically significant differences were found in body composition. Specifically, there were significant differences in body mass (p = 0.002), BMI (p = 0.024), lean body mass (p = 0.024), body fat (p = 0.032), and waist circumference (p = 0.020). Moreover, statistically significant differences were found in the blood pressure recovery ratio (p < 0.001). No genotype * sex interactions were found in the two-way ANOVA for any of the analyzed variables (p > 0.050).
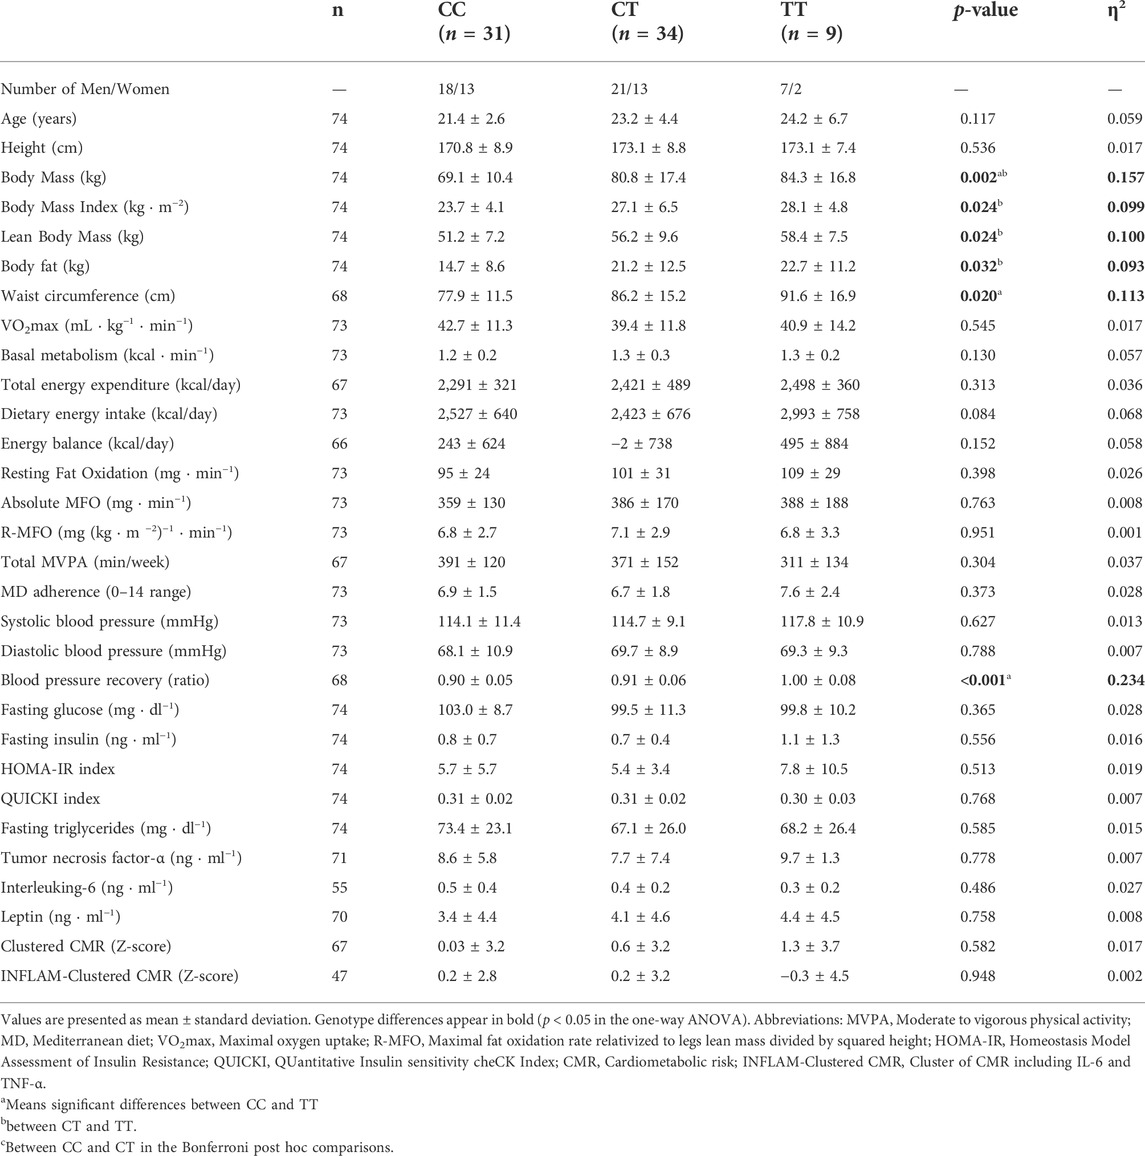
TABLE 2. Differences between the three PPARGC1A gene rs8192678 C>T polymorphisms in the analyzed variables.
The differences between groups in the recessive model (CC vs. CT/TT) are shown in Table 3, where the CC genotype showed lower age (p = 0.031), body mass (p < 0.001), BMI (p = 0.004), lean body mass (p = 0.008), body fat (p = 0.006), waist circumference (p = 0.006), basal metabolism (p < 0.001), and blood pressure recovery ratio (p = 0.047) than the CT/TT genotype group.
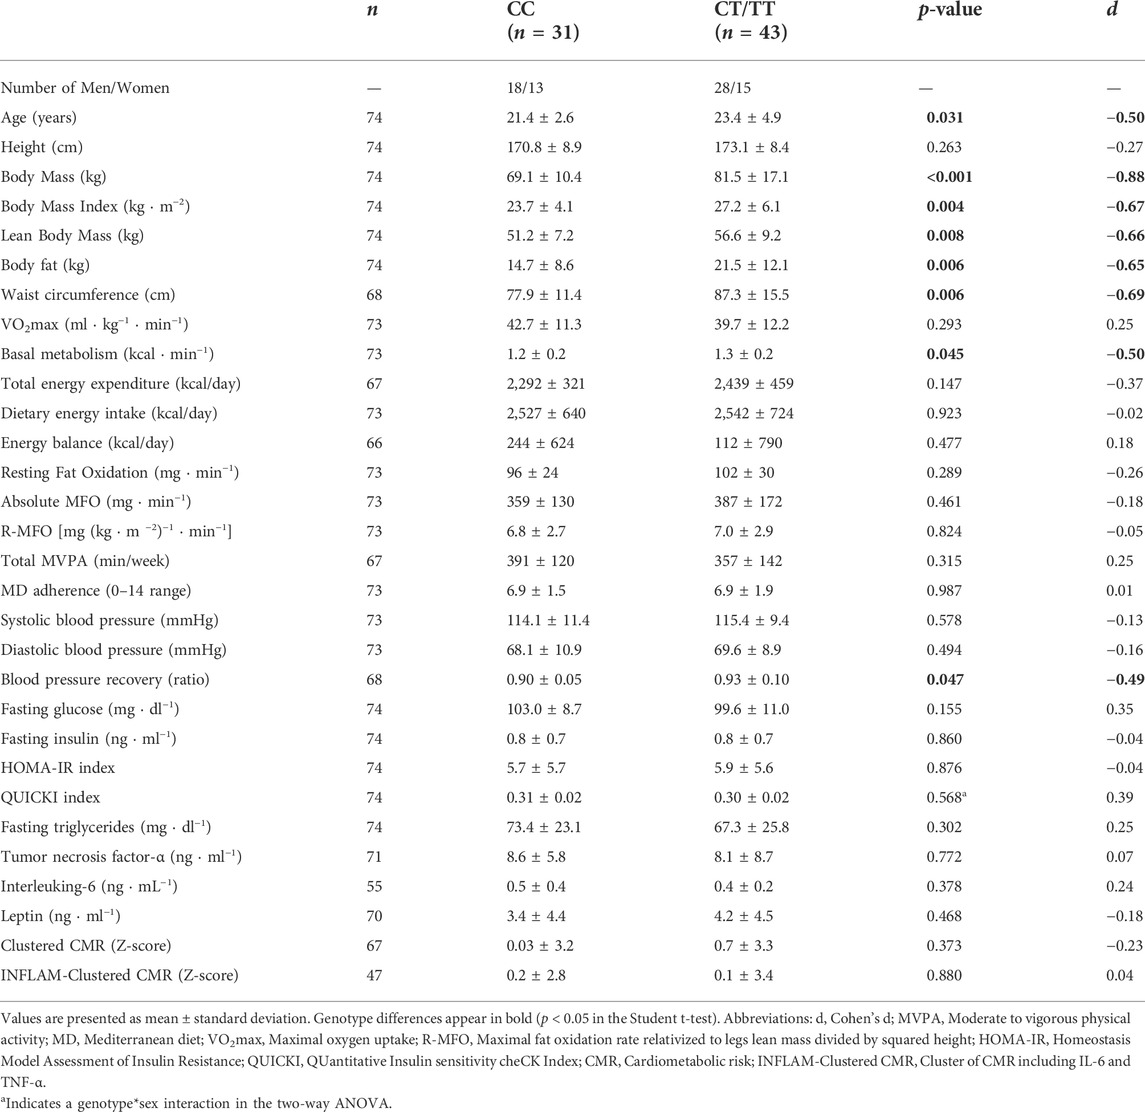
TABLE 3. Comparisons of the recessive model (CC vs. CT/TT) in the analyzed variables.
Moreover, in the two-way ANOVA, a genotype * sex interaction was found in QUICKI (F (1,70) = 6.121; p = 0.016; ηp2 = 0.080), presented in Figure 1, with statistically significant differences between CC and CT/TT in men (p = 0.049) and between men and women inside the CT/TT group (p = 0.049).
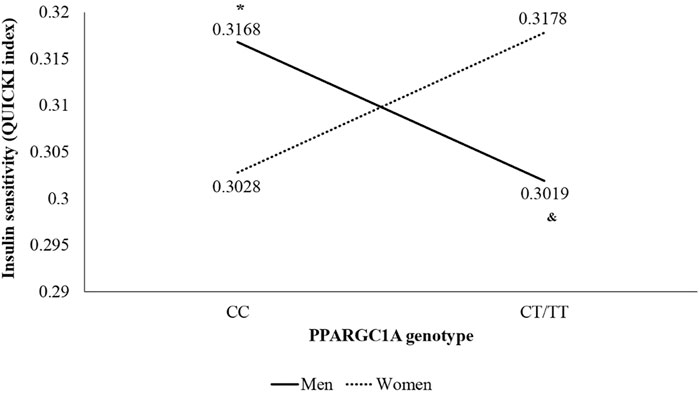
FIGURE 1. Interaction of sex and genotype of PPARGC1A gene rs8192678 C>T polymorphism in insulin sensitivity (QUICKI index) using the recessive model (CC vs. CT/TT). *p < 0.050 vs. other genotype groups. & p < 0.050 vs. women of the same genotype group.
Discussion
The main finding of the present cross-sectional study is that PPARGC1A gene rs8192678 C>T polymorphism is associated with body composition, basal metabolic rate, and insulin sensitivity (QUICKI index). In our study, the T allele carriers had higher values of body mass, BMI, lean body mass, body fat, and waist circumference. The influence of PPARGC1A gene rs8192678 C>T polymorphism on body composition is not explained by differences in cardiorespiratory fitness, age, height or MFO, since all groups showed similar values. Hence, our results showed that individuals with the PPARGC1A rs8192678 (T) genotype have a higher risk of developing obesity and metabolic disorders such as insulin resistance, according to previous data (Yang et al., 2011).
In addition, specific-gender analyses are encouraged in the literature; in this line, a main result in our study showed a genotype*sex interaction in QUICKI index, with lower values of QUICKI index (which means a lower insulin sensitivity) in T allele carriers in men and with higher values of QUICKI index (which means a higher insulin sensitivity) in women inside the CT/TT group. In agreement, epidemiological studies revealed gender differences regarding the association of rs8192678 with the metabolic syndrome pathology and insulin resistance (Csép et al., 2017). The insulin sensitivity finding in men is partially contradicted by body composition results, since the amount of muscle mass is directly associated with insulin sensitivity in young overweight adults (Haines et al., 2020) and, in our study, the T allele carriers had higher levels of lean body mass. However, in addition to having a greater amount of muscle mass, the T allele carriers also had higher levels of fat mass, BMI and waist circumference than C allele carriers, which would explain a lower insulin sensitivity, since adiposity is directly associated with decreased insulin sensitivity (Smith et al., 2020). Otherwise, the higher score in the QUICKI index in women could be explained by the higher levels of estrogens, which confers an increased insulin sensitivity and, therefore, a cardioprotective effect compared with men (Goossens et al., 2021).
In connection with biochemical parameters, the scientific evidence on insulin and glucose agrees with the results of our study. In fact, in the study of Mirzaei et al. (2012) there were no statistically significant differences in the levels of fasting blood glucose and insulin between the three PPARGC1A gene rs8192678 C>T polymorphism variants. In addition, the association between PPARGC1A gene rs8192678 C>T polymorphism and CMR has been slightly studied through individual cardiovascular risk factors such as body composition (Mirzaei et al., 2012; Franks et al., 2014; Zamaninour et al., 2018), type 2 diabetes-related parameters (Zhu et al., 2017), inflammatory markers and lipid profile (Mirzaei et al., 2012), and blood pressure (Vimaleswaran et al., 2008). Therefore, to our knowledge, this is the first study in which the relationship between PPARGC1A gene rs8192678 C>T polymorphism and a cluster of CMR factors is investigated. However, we did not find any association with this polymorphism.
Regarding blood pressure, it has been suggested that PPARGC1A gene rs8192678 (Gly482Ser) polymorphism is associated with blood pressure in young adults, such that Ser482 allele homozygotes have higher values of blood pressure than Gly482 allele homozygotes (Vimaleswaran et al., 2008). Similarly, in our study it was shown that those subjects carrying the T allele (Ser482) have a worse recovery of systolic blood pressure after exercise, and, consequently, they also have a higher cardiovascular risk (Michaelides et al., 2013). Thus, our study is the first to analyze the differences in the recovery of SBP depending on the three PPARGC1A gene rs8192678 C>T polymorphism variants. In fact, our results offer a very useful tool to detect cardiometabolic risk early and from a genetic perspective.
The findings of our study confirm some of the results of previous studies on the influence of PPARGC1A gene rs8192678 C>T polymorphism on health-related parameters. For example, Zamaninour et al. (2018) demonstrated that PPARGC1A gene rs8192678 C>T polymorphism is related to obesity onset age in obese adults without acute or chronic diseases. However, despite the association of adiposity and chronic inflammation, the study of Mirzaei et al. (2012) showed no statistically significant differences in the levels of C-reactive protein and fasting blood triglycerides between the three PPARGC1A gene rs8192678 C>T polymorphism variants, so the results of our study are consistent since no significant differences were found in TNF-α, IL-6 or fasting plasma triglycerides. Besides, contrary to our data, it has been observed that the 482Ser of PPARGC1A is associated with lower leptin levels and lower cardiometabolic risk factors despite obesity in Mexican-Mestizos (Vázquez-Del Mercado et al., 2015).
Moreover, higher values of basal metabolic rate and total energy expenditure were observed in the T allele carriers, that was accompanied by an increased adiposity was observed in this group. This controversial data could be explained because the basal metabolic rate and energy expenditure are directly related to lean body mass, in addition to other factors such as aging and chronic diseases (Zampino et al., 2020). The observed higher lean mass in the PPARGC1A rs8192678 (T) genotype is likely due to the increased fat mass, since, after 100 days of overfeeding, lean mass has been shown to increase approximately 3 kg with a fat mass accumulation of approximately 5 kg in a group of young adults (Ernersson et al., 2010), as in our study. Likewise, the higher levels of adiposity of the T allele carriers could justify the worse results of the blood pressure recovery ratio. In point of fact, BMI and waist circumference have previously been negatively associated with blood pressure recovery in healthy adults (Dimkpa and Ugwu, 2010).
Previously, PPARGC1A gene rs8192678 polymorphism has been associated with a subcutaneous adiposity accumulation and with insulin resistance in obese adults (Franks et al., 2014). In addition, Mirzaei et al. (2012) investigated the possible correlation with obesity-related conditions and resting energy expenditure in healthy adults with different states of body mass, finding significant differences in BMI, fat mass, insulin levels, and resting energy expenditure among the three genotypes of PPARGC1A gene rs17574213 polymorphism (CC, CT, and TT). Specifically, this study reported statistically significant differences between the three PPARGC1A gene rs8192678 C>T polymorphism variants in the QUICKI index, with a general tendency towards a worse prognosis in those subjects with the T allele compared to the C allele. However, this study showed no significant differences in HOMA-IR and basal metabolic rate.
Nevertheless, even though significant differences were found in our study in basal metabolism, no significant differences were found in MFO. This lack of significance could be explained by the absence of significant differences in VO2max since it has been shown that MFO depends directly on VO2max (Randell et al., 2017). These results indicate that the PPARGC1A gene rs8192678 C>T polymorphism is associated with basal metabolism (Muller et al., 2003), but not with fat metabolism during exercise, which is influenced by other factors such as age, sex, diet, and physical fitness level (Compher et al., 2006). Hence, the observed increase of adiposity in the T allele in our study could be mainly due to the activation of adipogenesis (de sá et al., 2017; Stachowiak et al., 2018), since this group showed a normal fat oxidation capacity and increased basal metabolic rate compared to C allele carriers.
Regarding VO2max, our findings confirm the results of previous studies in which no statistically significant differences were found in VO2max. For example, He et al. (2008) showed that VO2max was not associated with the rs8192678G>A polymorphism in Chinese healthy young adults. On the contrary, another study reported that in untrained men the G allele carriers at rs8192678 typically have higher VO2max values (Ring-Dimitriou et al., 2014). Thus, it becomes evident that there is controversy regarding this issue. Nevertheless, a relatively recent systematic review (Petr et al., 2018) reported that the aerobic training response is significantly influenced by PPAR’s gene polymorphisms and their coactivators. Indeed, in some genetically predisposed individuals, the aerobic training can negatively influence glucose metabolism and VO2max (Petr et al., 2018). Likewise, it has been shown that the SNP Gly482Ser in the PPARGC1A gene impairs exercise-induced slow-twitch muscle fiber transformation in humans (Steinbacher et al., 2015). Thus, more studies are also needed in this regard.
Concerning physical activity, our results contradict other studies in which significant differences were found in physical activity levels. For instance, a twin study of Gielen et al. (2014) showed that AA carriers in PPARGC1A gene rs8192678G>A polymorphism presented higher physical activity levels than GG carriers. Besides, another study reported that in healthy Korean children the genetic effects of the PGC-1α genotypes on health-related parameters might be modulated by lifestyle factors such as physical activity (Ha et al., 2015). Hence, more studies about this topic are also needed.
Respecting energy balance, Muller et al. (2003) showed that individuals with Gly/Gly showed a lower rate of fat oxidation than individuals with either Gly/Ser or Ser/Ser, resulting in a more positive energy balance in Gly/Gly carriers compared with in Gly/Ser or Ser/Ser carriers. Despite not finding significant differences in our study, the same happened, so an increased energy balance due to reduced fat oxidation would predict an increased cardiometabolic risk. Otherwise, we have not found any study that relates the PPARGC1A gene rs8192678 C>T polymorphism with the Mediterranean diet adherence. Specifically, in our study no significant association was found in this regard, which seems to indicate that the PPARGC1A gene rs8192678 C>T polymorphism is not associated with the Mediterranean diet adherence.
It should be noted that this study is not without limitations. We are aware that transient occasion factors may bias variable measurements and serve as sources of common variance which is a major limitation of the design of cross-sectional studies. Moreover, the number of participants included in the present study is scarce to make solid conclusions (e.g., there were only nine participants of which only two were women in the TT group). All our subjects were young and healthy (despite overweight/obesity), living in the province of Cadiz (south of Spain), thus a multicenter study is encouraged to compare our results with other populations. Furthermore, participants were excluded if they are smokers or have any cardiovascular disease, among others, potentially compromising external validity of results. Therefore, future studies should include a larger cohort with longitudinal design, also prioritizing results from genome-wide association studies. Regarding the body composition assessment, Dual Energy X-ray Absorptiometry (DXA) can be included to obtain a more precise evaluation instead of bioimpedance.
However, a strength of this study is the assessment of MFO and VO2max by using an exercise protocol test and adequate equipment under laboratory-controlled conditions. Moreover, the number of registered outcomes, including biochemical parameters, brings strengths to the design. Likewise, this study provides novel results, since to our knowledge no study to date has investigated the relationship between PPARGC1A gene rs8192678 C>T polymorphism and health-related parameters such as blood pressure recovery ratio, the ability to oxidize fat during exercise, diet, and clustered CMR factors.
Conclusion
In conclusion, PPARGC1A gene rs8192678 C>T polymorphism is associated with body composition, basal metabolism, and systolic blood pressure recovery ratio, with higher values in CT/TT groups. However, this polymorphism has little or no influence on VO2max, resting fat oxidation, MFO, physical activity, diet, systolic and diastolic blood pressure, biochemical parameters, and CMR. Moreover, our study highlighted sexual dimorphism in the influence of PPARGC1A gene rs8192678 C>T polymorphism on the QUICKI index, with a tendency towards a worse prognosis in those subjects with the T allele and male gender. Nonetheless, more studies are required to clarify the association between PPARGC1A gene rs8192678 C>T polymorphism and health-related parameters in a larger population.
Data availability statement
The original contributions presented in the study are included in the article/supplementary materials, further inquiries can be directed to the corresponding author.
Ethics statement
The studies involving human participants were reviewed and approved by Ethical Committee of the Hospital Puerta del Mar (Cadiz, Spain). The patients/participants provided their written informed consent to participate in this study.
Author contributions
Conceptualization, JP-G, AM-d-O-G, and CC.; outcomes analysis, AP-B, DV-D, JC-P, AM-G, MR-R, MC-D, and FG-G; statistical analysis, JP-G, AM-d-O-G, and CC; writing—original draft preparation, JP-G, AM-d-O-G, and CC; writing—review and editing, JC-P, DV-D, AP-B, AM-G, M.-R, MC-D, and FG-G; funding acquisition, JP-G and CC. All authors have read and agreed to the published version of the manuscript.
Funding
This work was supported by the University of Cadiz [grant numbers PR2016-051 and PR2019-054], by the Spanish Ministry of Science and Innovation [PID2019-110063RA-I00 and PID2020-120034RA-I00], and by Biomedical Research and Innovation Institute of Cadiz (INiBICA) (LI19/21INCO09). JC-P and AM-G are supported by a predoctoral grant from the Spanish Ministry of Education [grant number FPU19/02326 and FPU20/03649], AM-d-O-G and MR-R are supported by a predoctoral grant from the University of Cadiz. DV-D is supported by the Margarita Salas Postdoctoral Program from European Union Next GenerationEU and University of Cádiz.
Acknowledgments
We would like to thank to the people involved in technical assistance.
Conflict of interest
The authors declare that the research was conducted in the absence of any commercial or financial relationships that could be construed as a potential conflict of interest.
Publisher’s note
All claims expressed in this article are solely those of the authors and do not necessarily represent those of their affiliated organizations, or those of the publisher, the editors and the reviewers. Any product that may be evaluated in this article, or claim that may be made by its manufacturer, is not guaranteed or endorsed by the publisher.
References
Achten J., Gleeson M., Jeukendrup A. (2002). Determination of the exercise intensity that elicits maximal fat oxidation. Med. Sci. Sports Exerc. 34 (1), 92–97. doi:10.1097/00005768-200201000-00015
Compher C., Frankenfield D., Keim N., Roth-Yousey L. (2006). Best practice methods to apply to measurement of resting metabolic rate in adults: a systematic review. J. Am. Diet. Assoc. 106 (6), 881–903. doi:10.1016/j.jada.2006.02.009
Corral-Pérez J., Velázquez-Díaz D., Perez-Bey A., Montes-de-Oca-García A., Fernandez-Santos J. R., Amaro-Gahete F. J., et al. (2021). Accelerometer-measured physical activity and sedentary time are associated with maximal fat oxidation in young adults. Eur. J. Sport Sci., 1–10. doi:10.1080/17461391.2021.1953149
Costa-Urrutia P., Abud C., Franco-Trecu V., Colistro V., Rodríguez-Arellano M. E., Granados J., et al. (2018). Genetic susceptibility to pre diabetes mellitus and related association with obesity and physical fitness components in Mexican-Mestizos. Prim. Care Diabetes 12 (5), 416–424. doi:10.1016/j.pcd.2018.07.005
Csép K., Szigeti E., Vitai M., Korányi L. (2017). The PPARGC1A-Gly482Ser polymorphism (RS8192678) and the metabolic syndrome in a central Romanian population. Acta Endocrinol. 13 (2), 161–167. doi:10.4183/aeb.2017.161
de sá P. M., Richard A. J., Hang H., Stephens J. M. (2017). Transcriptional regulation of adipogenesis. Compr. Physiol. 7 (2), 635–674. doi:10.1002/cphy.c160022
Dimkpa U., Ugwu A. C. (2010). Independent multiple correlates of post-exercise systolic blood pressure recovery in healthy adults. Int. J. Exerc. Sci. 3 (1), 25–35.
Ernersson Å., Nystrom F. H., Lindström T. (2010). Long-term increase of fat mass after a four week intervention with fast food based hyper-alimentation and limitation of physical activity. Nutr. Metab. 7, 68. doi:10.1186/1743-7075-7-68
Franks P. W., Christophi C. A., Jablonski K. A., Billings L. K., Delahanty L. M., Horton E. S., et al. (2014). Common variation at PPARGC1A/B and change in body composition and metabolic traits following preventive interventions: the Diabetes Prevention Program. Diabetologia 57 (3), 485–490. doi:10.1007/s00125-013-3133-4
Frayn K. N. (1983). Calculation of substrate oxidation rates in vivo from gaseous exchange. J. Appl. Physiol. Respir. Environ. Exerc. Physiol. 55 (2), 628–634. doi:10.1152/jappl.1983.55.2.628
García-Conesa M. T., Philippou E., Pafilas C., Massaro M., Quarta S., Andrade V., et al. (2020). Exploring the validity of the 14-item mediterranean diet adherence screener (medas): a cross-national study in seven European countries around the mediterranean region. Nutrients 12 (10), E2960. doi:10.3390/nu12102960
Geloneze B., Vasques A. C. J., Stabe C. F. C., Pareja J. C., Rosado Lefp de L., Queiroz E. C. D., et al. (2009). HOMA1-IR and HOMA2-IR indexes in identifying insulin resistance and metabolic syndrome: Brazilian metabolic syndrome study (BRAMS). Arq. Bras. Endocrinol. Metabol. 53 (2), 281–287. doi:10.1590/s0004-27302009000200020
Gielen M., Westerterp-Plantenga M. S., Bouwman F. G., Joosen A. M. C. P., Vlietinck R., Derom C., et al. (2014). Heritability and genetic etiology of habitual physical activity: a twin study with objective measures. Genes Nutr. 9 (4), 415. doi:10.1007/s12263-014-0415-5
Goodpaster B. H., Sparks L. M. (2017). Metabolic flexibility in health and disease. Cell Metab. 25 (5), 1027–1036. doi:10.1016/j.cmet.2017.04.015
Goossens G. H., Jocken J. W. E., Blaak E. E. (2021). Sexual dimorphism in cardiometabolic health: the role of adipose tissue, muscle and liver. Nat. Rev. Endocrinol. 17 (1), 47–66. doi:10.1038/s41574-020-00431-8
Ha C. D., Cho J. K., Han T., Lee S. H., Kang H. S. (2015). Relationship of PGC-1α gene polymorphism with insulin resistance syndrome in Korean children. Asia. Pac. J. Public Health 27 (2), NP544–51. doi:10.1177/1010539513477685
Haines M. S., Dichtel L. E., Santoso K., Torriani M., Miller K. K., Bredella M. A., et al. (2020). Association between muscle mass and insulin sensitivity independent of detrimental adipose depots in young adults with overweight/obesity. Int. J. Obes. 44 (9), 1851–1858. doi:10.1038/s41366-020-0590-y
He Z., Hu Y., Feng L., Bao D., Wang L., Li Y., et al. (2008). Is there an association between PPARGC1A genotypes and endurance capacity in Chinese men? Scand. J. Med. Sci. Sports 18 (2), 195–204. doi:10.1111/j.1600-0838.2007.00648.x
Janani C., Ranjitha Kumari B. D. (2015). PPAR gamma gene - a review. Diabetes Metab. Syndr. 9 (1), 46–50. doi:10.1016/j.dsx.2014.09.015
Knopp J. L., Holder-Pearson L., Chase J. G. (2019). Insulin units and conversion factors: a story of truth, boots, and faster half-truths. J. Diabetes Sci. Technol. 13 (3), 597–600. doi:10.1177/1932296818805074
Liang H., Ward W. F. (2006). PGC-1alpha: a key regulator of energy metabolism. Adv. Physiol. Educ. 30 (4), 145–151. doi:10.1152/advan.00052.2006
Michaelides A. P., Liakos C. I., Vyssoulis G. P., Chatzistamatiou E. I., Markou M. I., Tzamou V., et al. (2013). The interplay of exercise heart rate and blood pressure as a predictor of coronary artery disease and arterial hypertension. J. Clin. Hypertens. 15 (3), 162–170. doi:10.1111/jch.12035
Mirzaei K., Hossein-Nezhad A., Emamgholipour S., Ansar H., Khosrofar M., Tootee A., et al. (2012). An exonic peroxisome proliferator-activated receptor-γ coactivator-1α variation may mediate the resting energy expenditure through a potential regulatory role on important gene expression in this pathway. J. Nutr. Nutr. 5 (2), 59–71. doi:10.1159/000337352
Montes-de-Oca-García A., Perez-Bey A., Corral-Pérez J., Velázquez-Díaz D., Opazo-Díaz E., Fernandez-Santos J. R., et al. (2020). Maximal fat oxidation capacity is associated with cardiometabolic risk factors in healthy young adults. Eur. J. Sport Sci. 21, 907–917. doi:10.1080/17461391.2020.1788650
Montes-de-Oca-García A., Perez-Bey A., Velázquez-Díaz D., Corral-Pérez J., Opazo-Díaz E., Rebollo-Ramos M., et al. (2021). Influence of ace gene I/D polymorphism on cardiometabolic risk, maximal fat oxidation, cardiorespiratory fitness, diet and physical activity in young adults. Int. J. Environ. Res. Public Health 18 (7), 3443. doi:10.3390/ijerph18073443
Muller Y. L., Bogardus C., Pedersen O., Baier L. (2003). A Gly482Ser missense mutation in the peroxisome proliferator-activated receptor γ coactivator-1 is associated with altered lipid oxidation and early insulin secretion in Pima Indians. Diabetes 52 (3), 895–898. doi:10.2337/diabetes.52.3.895
Petr M., Stastny P., Zajac A., Tufano J. J., Maciejewska-Skrendo A. (2018). The role of peroxisome proliferator-activated receptors and their transcriptional coactivators gene variations in human trainability: A systematic review. Int. J. Mol. Sci. 19 (5), E1472. doi:10.3390/ijms19051472
Randell R. K., Rollo I., Roberts T. J., Dalrymple K. J., Jeukendrup A. E., Carter J. M., et al. (2017). Maximal fat oxidation rates in an athletic population. Med. Sci. Sports Exerc. 49 (1), 133–140. doi:10.1249/MSS.0000000000001084
Rebollo-Ramos M., Velázquez-Díaz D., Corral-Pérez J., Barany-Ruiz A., Pérez-Bey A., Fernández-Ponce C., et al. (2019). Aerobic fitness, mediterranean diet and cardiometabolic risk factors in adults. Endocrinol Diabetes Nutr 67, 113. doi:10.1016/j.endinu.2019.04.004
Ring-Dimitriou S., Kedenko L., Kedenko I., Feichtinger R. G., Steinbacher P., Stoiber W., et al. (2014). Does genetic variation in PPARGC1A affect exercise-induced changes in ventilatory thresholds and metabolic syndrome? J. Exerc Physiol. Online 17 (2), 1–18.
Sarafidis P. A., Lasaridis A. N., Nilsson P. M., Pikilidou M. I., Stafilas P. C., Kanaki A., et al. (2007). Validity and reproducibility of HOMA-IR, 1/HOMA-IR, QUICKI and McAuley’s indices in patients with hypertension and type II diabetes. J. Hum. Hypertens. 21 (9), 709–716. doi:10.1038/sj.jhh.1002201
Smith G. I., Polidori D. C., Yoshino M., Kearney M. L., Patterson B. W., Mittendorfer B., et al. (2020). Influence of adiposity, insulin resistance, and intrahepatic triglyceride content on insulin kinetics. J. Clin. Invest. 130 (6), 3305–3314. doi:10.1172/JCI136756
Stachowiak M., Szczerbal I., Flisikowski K. (2018). Investigation of allele-specific expression of genes involved in adipogenesis and lipid metabolism suggests complex regulatory mechanisms of PPARGC1A expression in porcine fat tissues. BMC Genet. 19 (1), 107. doi:10.1186/s12863-018-0696-6
Steinbacher P., Feichtinger R. G., Kedenko L., Kedenko I., Reinhardt S., Schönauer A. L., et al. (2015). The single nucleotide polymorphism Gly482Ser in the PGC-1α gene impairs exercise-induced slow-twitch muscle fibre transformation in humans. PLoS One 10 (4), e0123881. doi:10.1371/journal.pone.0123881
Tharabenjasin P., Pabalan N., Jarjanazi H. (2019). Association of PPARGC1A Gly428Ser (rs8192678) polymorphism with potential for athletic ability and sports performance: a meta-analysis. PLoS One 14 (1), e0200967. doi:10.1371/journal.pone.0200967
Vázquez-Del Mercado M., Guzmán-Ornelas M. O., Meraz F. I. C., Ríos-Ibarra C. P., Reyes-Serratos E. A., Castro-Albarran J., et al. (2015). The 482Ser of PPARGC1A and 12Pro of PPARG2 alleles are associated with reduction of metabolic risk factors even obesity in a Mexican-mestizo population. Biomed. Res. Int. 2015, 285491. doi:10.1155/2015/285491
Vimaleswaran K. S., Luan J., Andersen G., Muller Y. L., Wheeler E., Brito E. C., et al. (2008). The Gly482Ser genotype at the PPARGC1A gene and elevated blood pressure: a meta-analysis involving 13, 949 individuals. J. Appl. Physiol. 105 (4), 1352–1358. doi:10.1152/japplphysiol.90423.2008
Vohl M. C., Houde A., Lebel S., Hould F. S., Marceau P. (2005). Effects of the peroxisome proliferator-activated receptor-γ co-activator-1 Gly482Ser variant on features of the metabolic syndrome. Mol. Genet. Metab. 86 (1–2), 300–306. doi:10.1016/j.ymgme.2005.07.002
Wu H., Deng X., Shi Y., Su Y., Wei J., Duan H., et al. (2016). PGC-1α, glucose metabolism and type 2 diabetes mellitus. J. Endocrinol. 229 (3), R99–R115. doi:10.1530/JOE-16-0021
Yang Y., Mo X., Chen S., Lu X., Gu D. (2011). Association of peroxisome proliferator-activated receptor gamma coactivator 1 alpha (PPARGC1A) gene polymorphisms and type 2 diabetes mellitus: a meta-analysis. Diabetes. Metab. Res. Rev. 27 (2), 177–184. doi:10.1002/dmrr.1158
Zamaninour N., Mirzaei K., Maghbooli Z., Keshavarz S. A. (2018). Peroxisome proliferator-activated receptor gamma coactivator 1α variation: a closer look at obesity onset age and its related metabolic status and body composition. Appl. Physiol. Nutr. Metab. 43 (12), 1321–1325. doi:10.1139/apnm-2018-0190
Zampino M., Alghatrif M., Kuo P. L., Simonsick E. M., Ferrucci L. (2020). Longitudinal changes in resting metabolic rates with aging are accelerated by diseases. Nutrients 12 (10), E3061. doi:10.3390/nu12103061
Zhu S., Liu Y., Wang X., Wu X., Zhu X., Li J., et al. (2009). Evaluation of the association between the PPARGC1A genetic polymorphisms and type 2 diabetes in Han Chinese population. Diabetes Res. Clin. Pract. 86 (3), 168–172. doi:10.1016/j.diabres.2009.09.020
Keywords: genetic association studies, cardiometabolic risk, metabolism, healthy lifestyle, PPARGC1A, caucasian, obesity, physical exercise
Citation: Montes-de-Oca-García A, Corral-Pérez J, Velázquez-Díaz D, Perez-Bey A, Rebollo-Ramos M, Marín-Galindo A, Gómez-Gallego F, Calderon-Dominguez M, Casals C and Ponce-González JG (2022) Influence of Peroxisome Proliferator-Activated Receptor (PPAR)-gamma Coactivator (PGC)-1 alpha gene rs8192678 polymorphism by gender on different health-related parameters in healthy young adults. Front. Physiol. 13:885185. doi: 10.3389/fphys.2022.885185
Received: 27 February 2022; Accepted: 04 July 2022;
Published: 22 July 2022.
Edited by:
Vanessa Amaral Mendonça, Federal University of Jequitinhonha and Mucuri Valleys (UFVJM), BrazilReviewed by:
Mika Venojärvi, University of Eastern Finland, FinlandXu Yan, Victoria University, Australia
Copyright © 2022 Montes-de-Oca-García, Corral-Pérez, Velázquez-Díaz, Perez-Bey, Rebollo-Ramos, Marín-Galindo, Gómez-Gallego, Calderon-Dominguez, Casals and Ponce-González. This is an open-access article distributed under the terms of the Creative Commons Attribution License (CC BY). The use, distribution or reproduction in other forums is permitted, provided the original author(s) and the copyright owner(s) are credited and that the original publication in this journal is cited, in accordance with accepted academic practice. No use, distribution or reproduction is permitted which does not comply with these terms.
*Correspondence: Cristina Casals, Y3Jpc3RpbmEuY2FzYWxzQHVjYS5lcw==