 Mikio Hiura
 Akio Funaki2
 Hirohide Shibutani
- 1Center for Brain and Health Sciences, Aomori University, Aomori, Japan
- 2Faculty of Sociology, Aomori University, Aomori, Japan
- 3Faculty of Creative Engineering, Kanagawa Institute of Technology, Atsugi, Japan
Purpose: The present study used near-infrared spectroscopy to investigate the relationships between cerebral oxygen metabolism and perfusion in the prefrontal cortex (PFC) during exercises of different intensities.
Methods: A total of 12 recreationally active men (age 24 ± 6 years) were enrolled. They performed 17 min of low-intensity exercise (ExL), followed by 3 min of moderate-intensity exercise (ExM) at constant loads. Exercise intensities for ExL and ExM corresponded to 30% and 45% of the participants’ heart rate reserve, respectively. Cardiovascular and respiratory parameters were measured. We used near-infrared time-resolved spectroscopy (TRS) to measure the cerebral hemoglobin oxygen saturation (ScO2) and total hemoglobin concentration ([HbT]), which can indicate the cerebral blood volume (CBV). As the cerebral metabolic rate for oxygen (CMRO2) is calculated using cerebral blood flow (CBF) and ScO2, we assumed a constant power law relationship between CBF and CBV based on investigations by positron emission tomography (PET). We estimated the relative changes in CMRO2 (rCMRO2) and CBV (rCBV) from the baseline. During ExL and ExM, the rate of perceived exertion was monitored, and alterations in the subjects’ mood induced by exercise were evaluated using the Profile of Moods Scale-Brief.
Results: Three minutes after exercise initiation, ScO2 decreased and rCMRO2 surpassed rCBV in the left PFC. When ExL changed to ExM, cardiovascular variables and the sense of effort increased concomitantly with an increase in [HbT] but not in ScO2, and the relationship between rCMRO2 and rCBV was dissociated in both sides of the PFC. Immediately after ExM, [HbT], and ScO2 increased, and the disassociation between rCMRO2 and rCBV was prominent in both sides of the PFC. While blood pressure decreased and a negative mood state was less prominent following ExM compared with that at rest, ScO2 decreased 15 min after exercise and rCMRO2 surpassed rCBV in the left PFC.
Conclusion: Dissociated coupling between cerebral oxidative metabolism and perfusion in the PFC was consistent with the effort required for increased exercise intensity and associated with post-exercise hypotension and altered mood status after exercise. Our result demonstrates the first preliminary results dealing with the coupling between cerebral oxidative metabolism and perfusion in the PFC using TRS.
1 Introduction
Near-infrared spectroscopy (NIRS) has been used to explore alterations in oxygenation in the prefrontal cortex (PFC) evoked by exercise. Although only a small volume of oxygenation in the PFC is detected by NIRS, its informative index has been assumed to be a surrogate for brain activity during dynamic exercise. Notably, the PFC is involved in the executive control network for autonomic regulation, planning, and action monitoring during exercise, and in the emotional function, including mood status (Davidson, 2003; Heimer and Van Hoesen, 2006). As physiological activity in the brain is accompanied with oxygen consumption for oxidative phosphorylation and glycolysis without oxygen consumption (Raichle and Mintun, 2006), the balance between oxygen delivery and extraction is reflected in the correlation between cerebral blood flow (CBF) and cerebral metabolic rate of oxygen (CMRO2). Ever since the relationship between the CBF and CMRO2 was first investigated, it was suggested that changes in CBF must involve a tight coupling between cellular energy requirements and the supplies of glucose and oxygen (Roy and Sherrington, 1890). However, neuroimaging studies by positron emission tomography (PET) demonstrated the unexpected finding that the magnitude of increase in CMRO2 was much lower than that in CBF during simple somatosensory stimulation (Fox and Raichle, 1986; Fox et al., 1988; Madsen et al., 1999). Subsequent studies postulated regional and activation-dependent differences in the relationship between CBF and CMRO2 (Mintun et al., 2002; Vafaee and Gjedde, 2004; Vafaee et al., 2012). To clarify this relationship using a simplified method, CBF and CMRO2 have been observed simultaneously. However, obtaining readings of these parameters using only a single PET measurement is impossible. Previous studies quantified CBF and oxygenation in the PFC using a single session of simultaneous measurements of PET and NIRS during hyper- and hypocapnia (Rostrup et al., 2002), acetazolamide administration that induced an increase in hemodynamic aspects (Ohmae et al., 2006) and hemodialysis (Polinder-Bos et al., 2020). Although these studies demonstrated correlations between NIRS variables and CBF or cerebral blood volume (CBV), the relationship between CBF and CMRO2 was not described. Furthermore, simultaneous PET and NIRS measurements during exercise have not been reported to date.
During exercise, changes in oxygenation can be measured by NIRS in a restricted volume of the cerebral cortex, but CBF cannot be measured. Accordingly, PET measurements can be used to investigate the relationship between cerebral oxygenation and CBF. However, during exercise, PET measurements are limited as follows: 1) the regional CBF (rCBF) is available as data averaged over 2 min during a period of stability, and 2) the exercise intensity must be low-to-moderate so that head movement does not prevent measurement. Considering these limitations in PET measurement, we demonstrated changes in CBF during and after low-intensity cycling exercise using PET (Hiura et al., 2014; Hiura et al., 2018a). Additionally, we compared changes in oxygenation with absolute values of CBF measured by NIRS and PET, which were measured with a similar exercise protocol but in different groups (Hiura et al., 2018b). Since continuous-wave (CW) NIRS was applied in that study, we could not obtain cerebral hemoglobin oxygen saturation (ScO2) and the concentration of total hemoglobin ([HbT]), which indicates CBV, or demonstrate CMRO2. In this study, we applied near-infrared time-resolved spectroscopy (TRS) to measure the absolute values of ScO2 and [HbT]. CBV can be calculated using [HbT], the molecular weight of hemoglobin, brain tissue density, and blood hemoglobin concentration (HGB) (Ijichi et al., 2005; Roche-Labarbe et al., 2010).
TRS can continuously and simultaneously measure the absolute values of oxyhemoglobin [HbO] and deoxyhemoglobin [HbR] in the cerebral tissue using ScO2 as the ratio of [HbO] to [HbT], where [HbT] is the sum of [HbO] and [HbR] (Ohmae et al., 2006; Torricelli et al., 2014; Auger et al., 2016). Based on the Fick principle, CMRO2 can be calculated as the product of CBF, HGB, and the oxygen extraction fraction (OEF), which is equal to the arteriovenous oxygen difference, i.e., the difference between SaO2 and venous hemoglobin saturation (SvO2). As TRS measures ScO2 within mixed structures consisting of arteries, capillaries, and vein, the ratio among these components during exercise has not been reported. Accordingly, we assumed that cerebral tissue [Hb] consists of 25% arterial and 75% venous blood [Hb] (Watzman et al., 2000), and SvO2 can be calculated using SaO2 and ScO2. Based on the estimated relationship between CBV and CBF described in previous studies using PET and NIRS (Ito et al., 2001; Brown et al., 2003; Ito et al., 2003; Roche-Labarbe et al., 2010), CMRO2 can be estimated using CBV, HGB, and ScO2 by TRS. Furthermore, because of the enhanced depth discrimination of absorption changes, TRS provides better attenuation of extra-cerebral effects on measurements than CW NIRS (Ayaz et al., 2022).
The aim of our study was to examine the relationship between cerebral oxygen metabolism and perfusion in the PFC during continuous cycling exercise at low (ExL) and moderate intensities (ExM) at various time points in response to exercise. With this exercise protocol, we intended to induce the augmented sense of effort at ExM and postexercise hypotension (PEH) in which the blood pressure (BP) decreases to a level below the baseline after exercise termination. The cycling exercise was performed in the supine position to compare CBV obtained by TRS with CBF evaluated in the PFC during exercise, with a protocol similar to that in previous studies (Hiura et al., 2018a). The second aim of our study was to clarify the specific role of the PFC in the relationship between cerebral oxygen metabolism and perfusion at various time points in response to exercise. We hypothesized that the relationship between cerebral oxygen metabolism and perfusion in the PFC would change during exercise depending on exercise intensity and the time course. Since the exercise protocol in the present study is associated with an improved mood status (Bartholomew et al., 2005), we also expected that these relationships in the PFC, which involved the executive control network for emotion (Davidson, 2003; Heimer and Van Hoesen, 2006), would change after the exercise termination.
2 Materials and methods
2.1 Study design and participants
We investigated oxygenation and CBV in the PFC by TRS using the same protocol that was used in the previous PET study, where CBF in the PFC did not significantly change during low-intensity cycling exercise (Hiura et al., 2018a). For characteristics of participants to be consistent with those in the previous study, a total of 12 recreationally active men (mean ± SD age, 26 ± 7 years; body weight, 70.1 ± 7.1 kg; height, 175.1 ± 4.2 cm) participated in the study. None of the participants had a personal history of physical or psychiatric illness or substance abuse, and none were taking any medications. The participants were instructed to live and eat as normally as possible but avoid rigorous exercise, alcohol, and drugs during the 24 h preceding the experimental sessions.
All participants provided written informed consent after a detailed explanation of the study. The study protocol was designed in accordance with the guidelines of the national government and the 2008 revision of the Declaration of Helsinki. The protocol was approved by the ethics committee of the Faculty of Sociology, Aomori University (no. 01-2020).
2.2 Experimental protocol
The protocol was consistent with that of a previous PET study that investigated CBF during ExL, and PEH was evoked after ExM (Hiura et al., 2018a). We followed this protocol so that we could compare CBV measured by TRS during ExL with CBF evaluated in the PET study. A schematic representation of the experimental procedure is shown in Figure 1. The study protocol consisted of a 20-min ergometer cycling protocol under constant load, with 17 min of low-intensity exercise (ExL), followed by 3 min of moderate-intensity exercise (ExM). The 3 min of ExM was used to attain PEH. The participants performed the exercise using a supine ergometer (Angioergo, Lode, Groningen, Netherlands). The work rate (WR) for ExL was set such that HR increased and remained around 30% of a participant’s heart rate reserve (HRR), calculated using the following formula: [(estimated maximum heart rate [HR]−resting HR) × 0.3] + resting HR (Karvonen et al., 1957). The maximum HR (HRmax) was estimated by subtracting the participant’s age from 220 years. For ExM, the WR was increased by 50% of the ExL level, yielding an increase in the HR above 45% of the HRR (Garber et al., 2011). Before the main experimental session, the participants completed an incremental test to volitional exhaustion using a cycling ergometer in the upright position. In this test, pulmonary oxygen consumption (
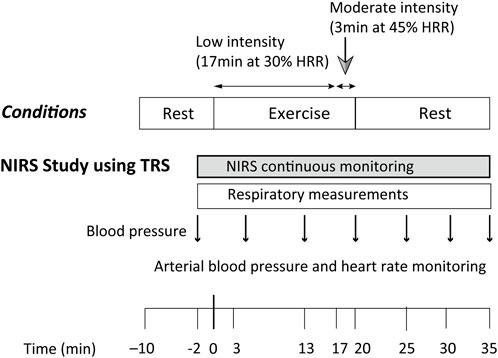
FIGURE 1. Experimental protocol used for the acquisition of cerebral oxygenation by NIRS during and after a 20-min constant load cycling protocol, comprising 17 min of low-intensity and 3 min of moderate-intensity exercise. The time of exercise initiation was defined as time 0. HRR: heart rate reserve; NIRS: near-infrared spectroscopy; TRS: near-infrared time-resolved spectroscopy.
2.3 Experimental procedures
2.3.1 Cycling ergometer incremental test
Before the main session of the NIRS study, each participant completed an incremental exercise test to volitional exhaustion using a cycling ergometer (Torqualizer ef med 600, h/p/cosmos, Nussdorf, Germany) in the upright position, starting at a WR of 20 W, with a subsequent increase in the WR at 20 W/min or 25 W/min according to the participant’s fitness level. Prior to the start of the test, the participants were instrumented and then they sat quietly for 2 min on the cycling ergometer. Respiratory variables were measured using an online gas analyzer (COSMED, Italy) in breath-by-breath mode, and
2.3.2 Cardiovascular and respiratory measurements
The HR was measured using a Polar WearLink heart rate sensor with Bluetooth (Polar Electro Oy, Kempele, Finland). The systolic and diastolic BPs (SBP and DBP, respectively) were measured using an automated upper-arm cuff-oscillometric sphygmomanometer (Omron HEM-7120; Kyoto, Japan). BP was assessed at the baseline (rest), 3 min (Ex3), 13 min (Ex13), and 20 min (Ex20) after exercise initiation, and 5 min (Post5), 10 min (Post10), and 15 min (Post15) after exercise termination. Respiratory gas exchange variables were measured at rest, Ex3, Ex13, at the end of ExL (Ex17), Ex20, Post5, Post10, and Post15 time points, in breath-by-breath mode, using an online gas analyzer (Quark CPET, Cosmed) as described previously. All data were averaged over the last 15 s of the rest, Ex3, Ex13, Ex17, Ex20, Post5, Post10, and Post15 periods. During the exercise sessions, measurements were started 2 min before exercise initiation and continued for 15 min after the exercises were completed.
2.3.3 Mood measurements
Participants’ moods before and after the cycling protocol were evaluated using the POMS-B. The POMS-B rates self-reported the mood across six dimensions: tension/anxiety (tension), depression/dejection (depression), anger/hostility (anger), fatigue/inertia (fatigue), confusion/bewilderment (confusion), and vigor/activity (vigor) (McNair DM, 2007).
2.3.4 NIRS measurements
A portable three-wavelength TRS system (tNIRS-1; Hamamatsu Photonics K.K., Hamamatsu, Japan) was used for quantitative measurements of oxygenation in the PFC. The TRS system applies a time-correlated single-photon counting method. The precise methodology is described in detail in previous studies (Ijichi et al., 2005; Torricelli et al., 2014; Lange and Tachtsidis, 2019). Briefly, the system consists of 3-picosecond (ps) light pulses with different wavelengths (755, 816, and 850 nm), a 100-ps duration at a repetition frequency of 5 MHz as the pulse light source, a photon-counting head for single-photon detection, and signal-processing circuits for time-resolved measurements. By acquiring the distribution of the times of flight of photons propagating from the source to the detector, it is possible to enhance depth discrimination of absorption changes, thereby enabling the rejection of extra-cerebral effects (Wabnitz et al., 2020). The light emission and detection optodes were positioned on the forehead just below the hairline at a 40-mm inter-optode distance. With this optode spacing, the TRS can monitor hemodynamic responses around the gray matter region because the photons passing through the head convey the intracerebral hemodynamic responses (Ohmae et al., 2006). Based on our previous study (Hiura et al., 2018b), the position of TRS probes was based on the International EEG 10–20 system for electrode placement (Klem et al., 1999). The optodes were placed over the left and right forehead between Fp1 and F3 and between Fp2 and Fp4 to maximize the probability of photon transmission through the lateral portions of Brodmann areas 9 and 46 (Okamoto et al., 2004). According to the computed tomography scan of a representative participant, the explored volume included the dorsolateral PFC (DLPFC) in the middle frontal gyrus. The optodes were fixed using black rubber to prevent stray light from reaching the detector. The covered optodes were firmly affixed to the skin using transparent tape. Furthermore, to prevent movement, a cap made of opaque cloth was placed over the sensors. The photons can pass through the scalp, skull, and frontal lobe to a depth of several centimeters, with only minimal influence from skin blood flow (Fantini, 2014; Lange and Tachtsidis, 2019). As TRS provides absolute values of [HbO] and [HbR], [HbT] is determined as the sum of [HbO] and [HbR], with ScO2 and CBV calculated as follows:
where the square brackets indicate the respective hemoglobin concentrations (μM) obtained by TRS, MWHb is the molecular weight of hemoglobin (64,500), HGB is the blood hemoglobin concentration (g/dL), and Dbt is the brain tissue density (1.05 g/mL) (Ijichi et al., 2005; Roche-Labarbe et al., 2010).
2.3.5 Estimation of CMRO2
Based on the Fick principle, CMRO2 was calculated as follows:
where k = 1.39 [ml (O2)/g (HGB)] is the amount of O2 bound to HGB at complete saturation and HGB is the blood hemoglobin concentration (g/dL). As OEF equals to the arteriovenous oxygen difference, Eq. 3 can be rewritten as follows:
ScO2 was estimated using the following equation (Watzman et al., 2000):
where α and β are constants, and α can be assumed as 0.25.
Using these formulas and applying SaO2 and ScO2, we obtained the following equation:
If oxygenation, represented by ScO2, is measured simultaneously with CBF, CMRO2 is obtained. However, CBF could not be obtained by TRS for calculating CMRO2 combined with individual ScO2. Consequently, CBF was estimated using CBV, assuming a constant power law relationship between changes in CBF and CBV (Ito et al., 2001; Ito et al., 2003). Since we cannot clarify the ratio of the contribution from the arterial and venous components during exercise and HGB was not obtained in the present study, the ratio of CMRO2 to CMRO2 at rest (rCMRO2) was considered referring to previous studies using NIRS (Roche-Labarbe et al., 2010). rCMRO2 was calculated as follows:
with γ = 3.4, induced by a previous study which demonstrated CBV = 1.09 × CBF0.29 (Ito et al., 2003), and the subscript “rest” indicates baseline values.
Additionally, the ratio of CBF to CBF at rest (rCBF) and the ratio of OEF to OEF at rest (rOEF) are as follows:
As the HGB values for six participants were examined within a month of the main study, we referred to these values only to clarify whether [HbT] was an outlier. Referring to Eq. 7, individual HGB was not necessary to calculate rCMRO2 and relative changes in CBV, i.e., the ratio of CBV to CBVrest (rCBV). We calculated rCMRO2 when ScO2 or [HbT] changed significantly from the baseline. As arterial and venous blood samples were not available in the present study, we assumed that HGB and SaO2 would not change during ExL and ExM or after completion of the exercise protocol. We assumed SaO2 to be 98% throughout the exercise protocol.
As the TRS system (tNIRS-1) sampled data at 5-s intervals, all data were averaged over the last 15 s of the rest, Ex3, Ex13, Ex17, Ex20, Post5, Post10, and Post15 time points to compare NIRS data with respiratory variables in the same time window. To obtain the best possible baseline and postexercise conditions, NIRS signals were observed as a fraction of fluctuations in HR, PETCO2, and
2.4 Statistical analysis
Data were analyzed using GraphPad Prism 9 (San Diego, CA, United States) and SPSS version 25 (IBM, Armonk, NY, United States). Power calculation using G*Power showed that, setting the effect size as 0.40 with the number of measurements as 3 (rest, ExL, and ExM), a sample size of n = 6 for each level is sufficient (alpha level<0.05 and statistical power >90%) (Hiura et al., 2022). A previous study using the TRS system (tNIRS-1) explored changes in [HbT] during a 13-min session, which consisted of 70% and 80% of
3 Results
3.1 Cardiovascular variables
Table 1 summarizes the cardiovascular variables during the exercise protocol. All cardiovascular variables increased during exercise and were higher at Ex20 than Ex13. After exercise termination, the HR remained slightly higher than that at rest, except at Post15. Compared with the resting baseline, SBP decreased at Post10 and Post15 and MBP decreased at Post15, while DBP remained at baseline levels after exercise termination. HR reached 30% ± 2% HRR at Ex13% and 46% ± 3% HRR at Ex20.
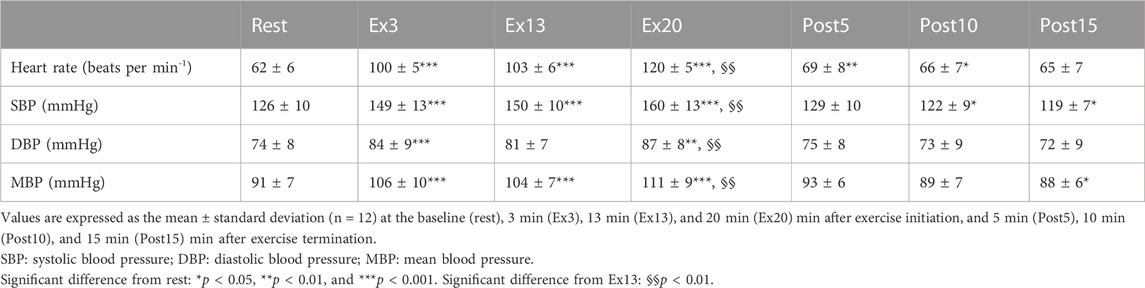
TABLE 1. Cardiovascular variables in response to the 17-min low-intensity constant-load cycling exercise, followed by the 3-min moderate-intensity constant-load cycling exercise.
3.2 Respiratory variables
The respiratory variables during the exercise protocol are summarized in Table 2. All respiratory variables, except the RER, increased during exercise and reached a steady state during ExL, returning to the baseline level after exercise termination. After the exercise intensity was changed,
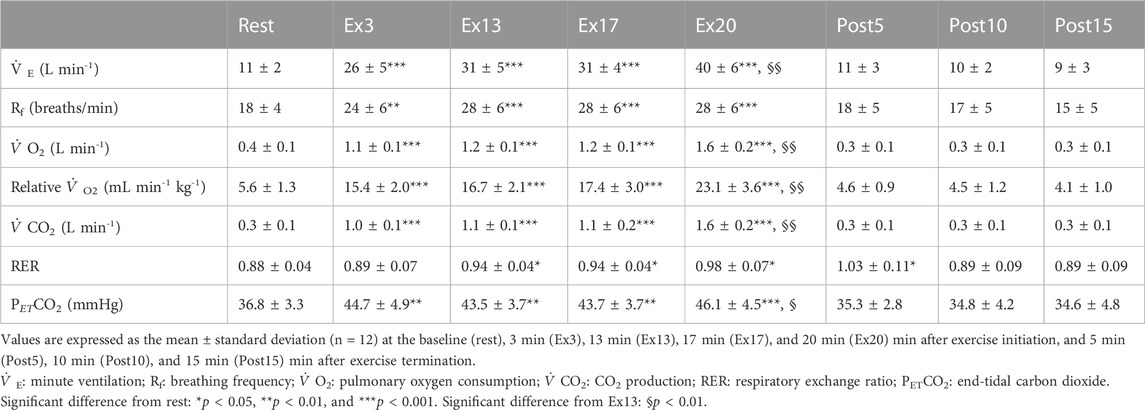
TABLE 2. Respiratory variables in response to the 20-min cycling exercise comprising 17-min low-intensity constant-load cycling exercise followed by the 3-min moderate-intensity constant-load cycling exercise, obtained in the near-infrared spectroscopy study.
3.3 Perceived exertion and mood status
During exercise, RPE changed from 8.8 ± 1.1 a.u. (arbitrary units) for ExL to 11.4 ± 1.68 a.u. for ExM (p < 0.0001). The mood ratings for the six dimensions of the POMS-B at rest and after exercise are summarized in Table 3. There was a significant decrease in mood ratings for fatigue (p = 0.03), with a tendency for a decrease in tension (p = 0.250), anger (p = 0.187), and confusion (p = 0.121).
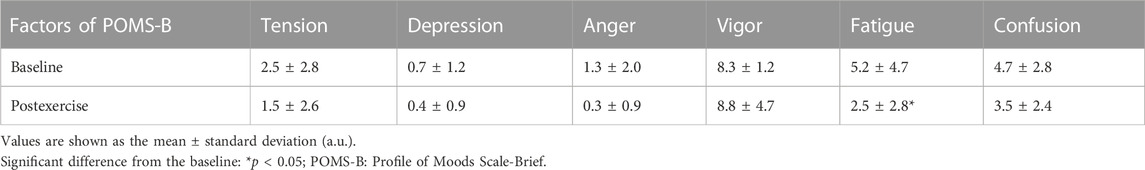
TABLE 3. Descriptive statistics for the subjective mood ratings collected before and after exercise.
3.4 NIRS variables
Two typical examples of changes in ScO2 and [HbT] are shown in conjunction with the HR in Figure 2. Changes in these NIRS and physiological variables for all participants are shown in Supplementary Figure S1. Changes in ScO2 and [HbT] throughout the exercise protocol are presented, along with changes in HR, PETCO2, and relative
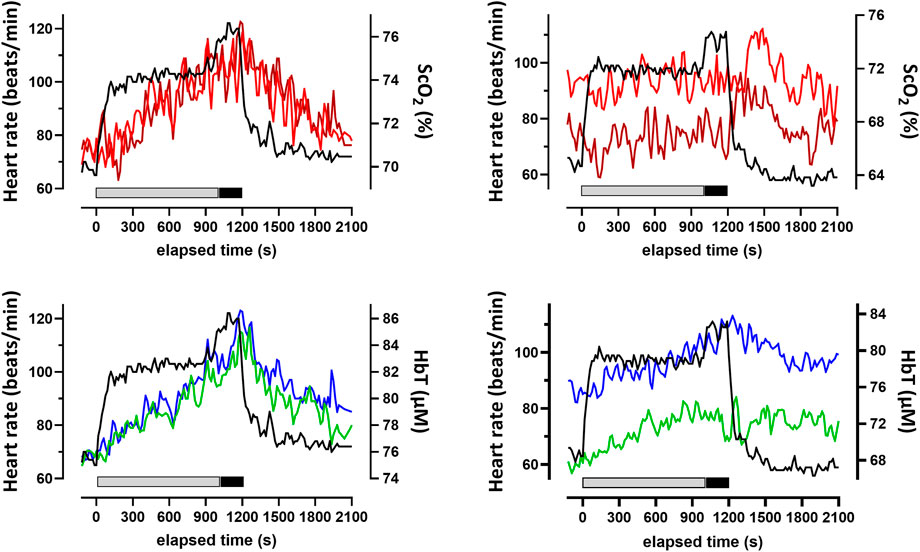
FIGURE 2. Typical changes for two participants (left and right) in the heart rate and cerebral oxygenation variables obtained by NIRS for the prefrontal cortex during and after the 20-min constant-load cycling protocol, comprising 17 min of low-intensity and 3 min of moderate-intensity exercise. Data were averaged over 15 s at each time point. Changes in ScO2 for the left (red) and right (brown) PFC and HbT for the left (green) and right (blue) prefrontal cortex are depicted. The thick bars below the NIRS parameter changes indicate the periods of the exercise session of low (gray) and moderate intensity (black). ScO2: cerebral hemoglobin oxygen saturation; HbT: total hemoglobin concentration in the brain tissue; NIRS: near-infrared spectroscopy.
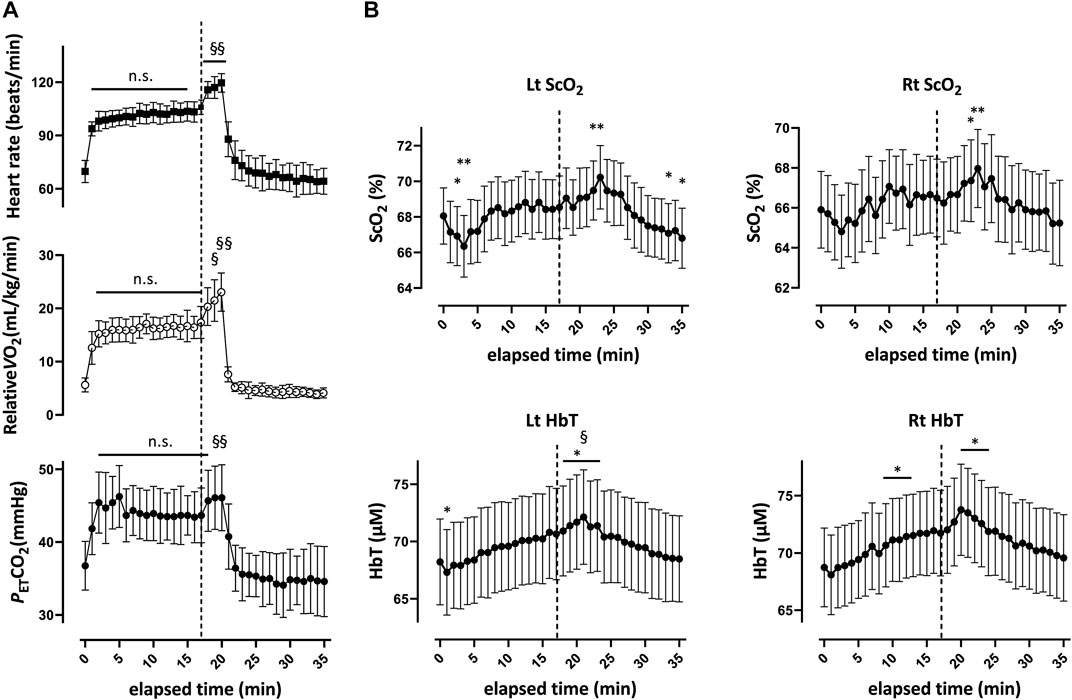
FIGURE 3. Respiratory variables (A) and cerebral oxygenation variables obtained by near-infrared spectroscopy for the prefrontal cortex (B) during and after the 20-min constant-load cycling protocol, comprising 17 min of low-intensity and 3 min of moderate-intensity exercise. Data were averaged over 15 s at each time point.
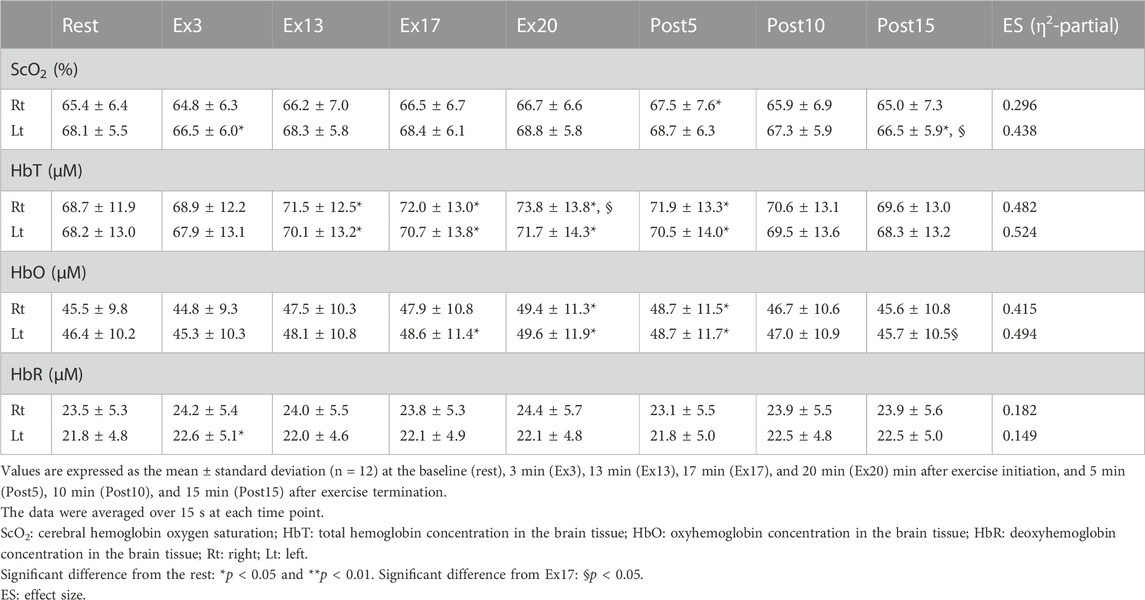
TABLE 4. Changes in NIRS signals in response to constant-load cycling exercise protocol, 17-min of low-intensity exercise, followed by the 3-min moderate-intensity exercise.
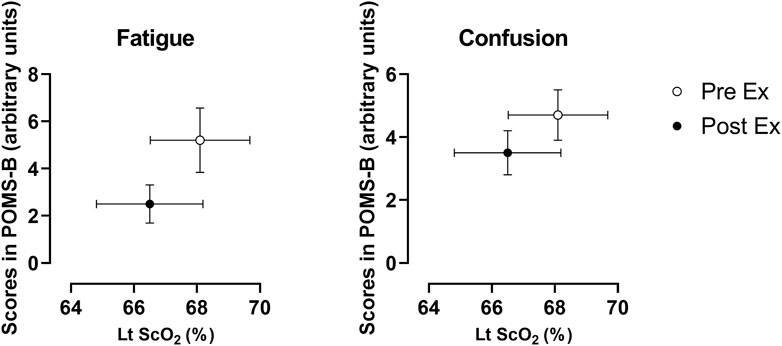
FIGURE 4. Changes in mood ratings for fatigue and confusion and ScO2 for the left prefrontal cortex. Data were derived from all of the participants (n = 12) and expressed as the mean ± standard error of the mean. Lt: left; PreEx: before the exercise started; PostEx: after the exercise terminated.
3.5 Relationships among rCMRO2, rCBV, rCBF, and rOEF
Based on the changes in ScO2 and [HbT] (Figure 3B), we calculated rCMRO2, rCBV, rCBF, and rOEF using Eqs 7–9. Comparisons between rCMRO2 and rCBV, rCMRO2 and rCBF, and rCBF and rOEF obtained at each time point for both sides of the PFC are shown in Figure 5. We selected the time points where either ScO2 or HbT changed significantly on either side of the PFC compared with that at rest. The relationships between rCMRO2 and rCBF, rCMRO2 and rCBF, and rCBF and rOEF differed over the time course of the exercise protocol for the right and left PFC [F (6, 66) = 6.175 and 4.335, p < 0.001 and p = 0.001; F (6, 66) = 7.469 and 14.32, p < 0.0001 and p = 0.0001; and F (6, 66) = 19.89 and 24.6, p < 0.0001 and p = 0.0001, respectively]. A summary of rCMRO2, rCBV, rCBF, and rOEF during the exercise protocol is shown in Table 5. During ExL, rCMRO2 and rCBV did not change except for at Ex13 in the right PFC. CMRO2 surpassed rCBV at Ex3, and this relationship remained until immediately after exercise termination. CMRO2 surpassed rCBF at Ex3 in the left PFC; however, this relationship changed to the opposite direction in that CBF surpassed rCMRO2. At Ex20 and immediately after exercise termination, CMRO2, rCBV, and rCBF were increased compared with that at Ex3 on both sides of the PFC. Compared with Ex13, rCMRO2, rCBV, and rCBF were higher at Ex20 and Post1 on the right of the PFC. rOEF decreased at Ex20 and immediately after exercise termination compared with Ex3. The magnitude of change in rCBF was larger than that in rCMRO2, rCBV, and rOEF.
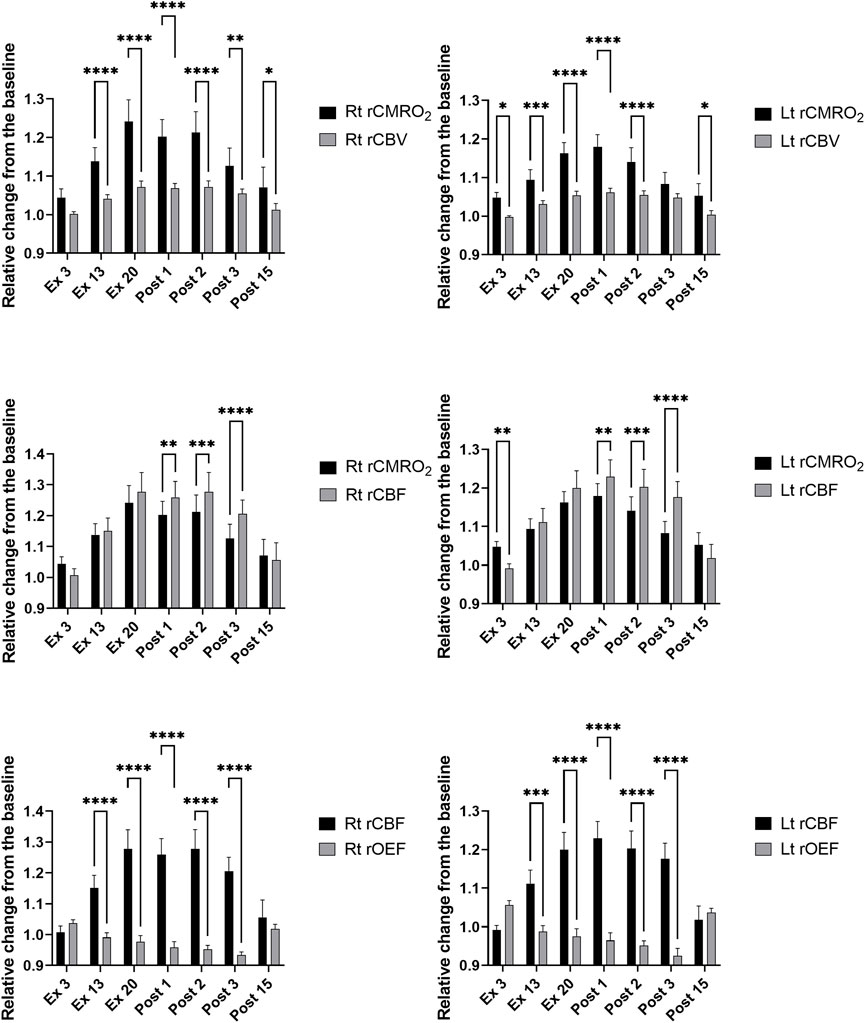
FIGURE 5. Relative changes from the baseline in the right and left prefrontal in the cerebral metabolic rate for oxygen and cerebral blood volume (upper), in the cerebral metabolic rate for oxygen and cerebral blood flow (middle), and in the cerebral blood flow and oxygen extraction fraction (lower) during and after the 20-min constant-load cycling protocol, comprising 17 min of low-intensity and 3 min of moderate-intensity exercise. Data were averaged over 15s at each time point and expressed as the mean ± standard error of the mean. rCMRO2: relative changes from the baseline in the cerebral metabolic rate for oxygen; rCBV: relative changes from the baseline in the cerebral blood volume; rCBF: the relative changes from the baseline in cerebral blood flow; rOEF: the relative changes from the baseline in the oxygen extract fraction; Lt: left; Rt: right; rest: baseline; Ex3, Ex13, and Ex20: 3, 13, and 20 min after exercise initiation, respectively; Post1, Post2, Post3, and Post15: 1, 2, 3, and 15 min after exercise termination, respectively, difference between rCMRO2 and rCBV, rCMRO2 and rCBF, and rCBF and rOEF at each time point; **p < 0.05, ***p < 0.001, and ****p < 0.0001; Sidak’s multiple comparison test.
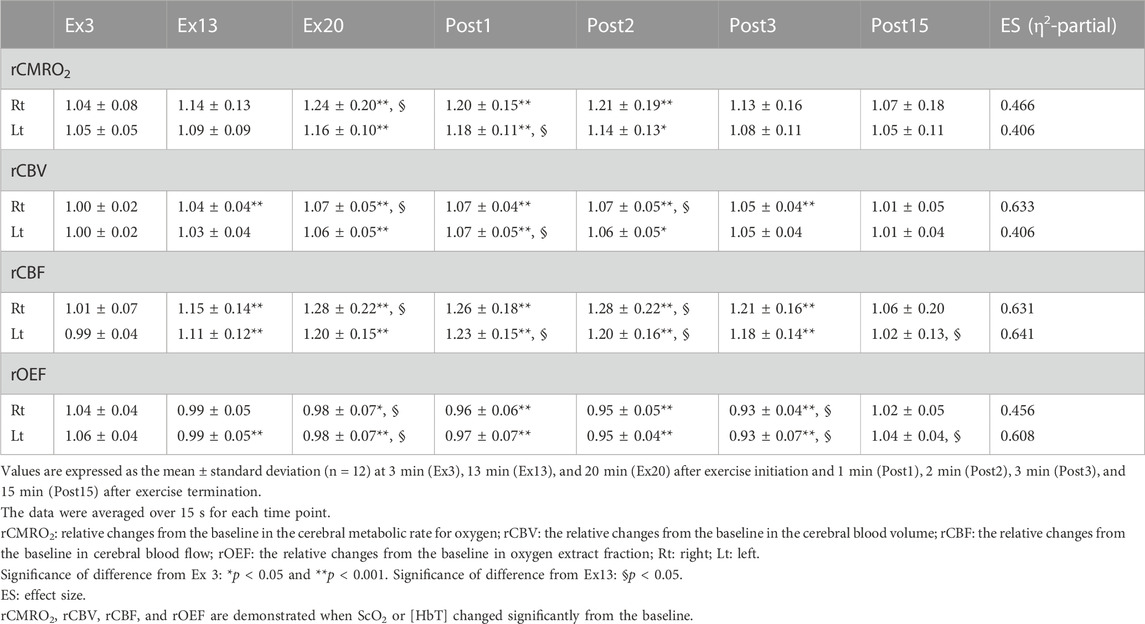
TABLE 5. Changes in the relative changes from the baseline cerebral metabolic rate for oxygen and cerebral blood volume in response to 17-min low-intensity cycling ergometer exercises, followed by 3-min moderate-intensity cycling ergometer exercises.
4 Discussion
In this study, cerebral oxygen metabolism and perfusion during low- and moderate-intensity cycling exercises were examined by investigating ScO2 and [HbT]. While CBV can be calculated using ScO2 and HGB, we estimated rCBF assuming a constant power law relationship between CBV and CBF. There were several main findings of our study that estimated changes in CMRO2 and CBV using NIRS variables. First, rCBV increased significantly during ExL only in the right PFC, and ScO2 decreased in the initial phase of exercise, especially in the left PFC, which led to the difference between rCMRO2 and rCBV. Second, assuming the power law relationship between CBV and CBF, rCBF increased significantly during ExL, causing the difference between rCMRO2 and rCBF, with rCBF surpassing rCMRO2, which was contrary to the relationships between rCMRO2 and rCBV. Third, elevated cardiovascular variables during ExM, in conjunction with the augmented sense of effort, caused differences between rCMRO2 and rCBV and between rCMRO2 and rCBF. Fourth, after exercise termination (Post15), rCMRO2 increased and was greater than rCBV, while no differences were identified between rCMRO2 and rCBF and between rCBF and rOEF associated with PEH and positive changes in the mood status as well. These results demonstrate the estimated relationship between cerebral oxygen metabolism and perfusion during exercise explored by TRS.
4.1 Cerebral oxygen metabolism and perfusion in response to low- and moderate-intensity exercise
As studies have reported changes in oxygenation under various situations in the PFC, including maximal incremental tests and constant workload tasks ranging from low to supramaximal intensities (De Wachter et al., 2021), the present study addressed the important aspect of the relationship between cerebral oxygen metabolism and perfusion. During ExL, ScO2 decreased at Ex3 in the left PFC. This finding is consistent with that of a previous study (Takehara et al., 2017) that measured changes in [HbO] and [HbR] during low- and moderate-intensity cycling exercise, but the absolute values of ScO2 were not measured. Decrease in ScO2 can be attributed to the increase in CMRO2, provided that CBF does not decrease. At Ex3, rCMRO2 surpassed rCBV and rCBF in the left PFC. As the exercise continued with ExL, rCBV increased only in the right PFC at Ex13, but rCBF increased in both the sides. This is not compatible with the result from a previous PET study (Hiura et al., 2018a), in which participants and exercise intensity were similar to those in the present study, which showed no change in CBF in the PFC during ExL. It would be attributable to the methodological limitation for PET measurements in which the coefficient of variation was approximately 20% for CBF in our previous study (unpublished data). At Ex13, rCMRO2 surpassed rCBV, while rCMRO2 was compatible to rCBF.
By the end of ExM, ScO2 and [HbT] increased significantly, along with a simultaneous increase in the cardiovascular and respiratory variables and perceived exertion. rCBF increased during exercise in association of the cerebrovascular reactivity to CO2, with PETCO2 ranging from 36–44 mmHg. These changes in NIRS variables caused an increase in rCMRO2 in the PFC at ExM compared with that at ExL and induced an opposite relationship between rCMRO2 and rCBF compared with that at ExL such that rCBF surpassed rCMRO2 immediately after exercise termination. This finding is associated with that of a previous study which demonstrated that the relationship between rCBF and CMRO2 during prolonged continuous visual stimulation was different at 1 min and 25 min of the observation period (Mintun et al., 2002). The study demonstrated that the relative changes in CMRO2 were higher than those in CBF at 25 min from the initiation of the stimulation, and this relationship was reversed at 1 min from the initiation. Further studies are needed to elucidate the effect of both the intensity and duration of exercise on the relationship between CMRO2 and CBF. After ExM termination, a situation in which rCBF surpassed rCMRO2 coincided with the decrease in rOEF, which seems to control rCMRO2 to be at a constant level. This phenomenon is associated with a previous study that explored the relationships among CBF, CMRO2, and OEF for the global brain, in which the maximal exercise during dehydration induced a decrease in CBF but compensator increases in OEF maintained CMRO2 (Trangmar et al., 2014).
We observed changes in cerebral oxygenation in response to higher-intensity exercise. However, the observed intensities of 33% ± 5% and 46% ± 4%
4.2 Relationship between cerebral oxidative metabolism and perfusion associated with the functional role of the PFC during exercise
During low-intensity cycling exercise, CBF was shown to increase significantly in the bilateral sensorimotor cortex for the legs and cerebellum, with a moderate increase in the insular cortex and no increase in the PFC (Hiura et al., 2014; Hiura et al., 2018a). While neuronal activations for leg movement and central command result in a significant increase in CBF in these regions, we speculate that the associated neuronal activation for initiating exercise would result in an increase in rCMRO2, but not in rCBV and rCBF, at Ex3. To the best of our knowledge, no study has reported an increase in CBF in the PFC using PET during exercise, although the DLPFC has reciprocal interconnections with the premotor areas, basal ganglia, and cerebellum, by which the lateral part of the PFC can control broad aspects of motor behavior (Seeley et al., 2007; Tanji and Hoshi, 2008). Matsukawa et al. (2015) reported a decrease in [HbO] with a slight change in [HbR] and a substantial decrease in ScO2, which is in line with our results, and suggested a possible contribution of feedback to the DLPFC stimulated by mechanical limb motion. We speculated that it was not the change in CBF but the increase in CMRO2 that indicated a possible association between the DLPFC and other cortical regions that have executive control and autonomic regulation.
Exercise is associated with a positive effect on feelings of vigor and fatigue (Dishman et al., 2010). In particular, the PFC is associated with various features of affective processing (Davidson, 2003) and mood status (Monroe et al., 2020). A recent study performed by using NIRS demonstrated that increased changes in [HbO] were identified in the DLPFC after 10 min of running at an intensity of 50%
As PEH was induced with a small change of 7 mmHg in SBP at most, the relationship between cerebral oxygen and perfusion was dissociated as rCMRO2 surpassed rCBV at Post15 but not rCBF, while SBP and MBP decreased compared with the baseline. However, to clarify if this dissociated relationship between cerebral oxygen metabolism and perfusion in the PFC contributes to its mechanism, another exercise protocol that will evoke a more severe PEH is needed in the future.
With our exercise protocol, no interaction effects were identified regarding ScO2 or [HbT] and the PFC side, although absolute values of ScO2 were greater in the left PFC and those of [HbT] were greater in the right PFC. This finding is consistent with that of a recent study (Asahara and Matsukawa, 2023) that explored changes in [HbO] and ScO2 in the PFC during low- and moderate-intensity one-legged cycling exercise using t-NIRS. The authors demonstrated that no laterality-related differences were observed in the changes in cerebral oxygenation.
4.3 Significance and perspective of exploring the relationship between CMRO2 and CBF
We estimated the relationship between CMRO2 and CBF using TRS NIRS since previous studies using PET have demonstrated that changes in CBF are not uniquely coupled to changes in oxidative metabolism. The relationships between CMRO2 and CBF have been examined in humans during low-intensity somatosensory and visual stimulation and during motor activity such as moving fingers at different rates (Mintun et al., 2002; Vafaee and Gjedde, 2004; Vafaee et al., 2012). Spatially dissociated changes in CMRO2 and CBF in several cortical and subcortical regions of the brain during the right finger-to-thumb movement were suggested, demonstrating that CMRO2 surpassed CBF in the right putamen and supplementary motor area (Vafaee and Gjedde, 2004). Although our results regarding the relationship between rCMRO2 and rCBF are not identical to those between CMRO2 and CBF, the dissociated relationship between rCMRO2 and rCBF in the left PFC in response to ExL, with rCMRO2 being greater than rCBF, is in line with that observed in the previous PET study observed in the right putamen. The authors speculated that the relative changes in CMRO2 and CBF could be a guide for the postsynaptic processing of projections that are active while preparing for a neuronal task. After ExM termination, dissociated couplings between rCMRO2 and rCBF were identified in both sides of the PFC, with rCBF being greater than rCMRO2. This relationship is compatible as the magnitude of CMRO2 is smaller than increases in CBF in the sensory-motor cortex during simple somatosensory stimulation (Fox and Raichle, 1986) and in the striate cortex during visual stimulation (Mintun et al., 2002).
To observe CMRO2 and CBF simultaneously, single-session NIRS and arterial spin labeling with MRI have been previously demonstrated for CMRO2 measurement in rats and mice (Hashem et al., 2020). NIRS alone has also been used to measure CMRO2 in newborn piglets by combining two near-infrared techniques: diffuse correlation spectroscopy and TRS NIRS (Tichauer et al., 2006; Verdecchia et al., 2013). However, in these studies, CBF was determined using an invasive manner that involved the injection of indocyanine green as an intravascular tracer. These alternative methods to measure CMRO2 and CBF pose a great concern; however, to explore rCBF and rCMRO2 directly, future studies applying simultaneous TRS and PET measurements are required.
4.4 Limitations
The small sample size, possible selection bias, and several methodological limitations of our study do not allow us to draw generalizable conclusions. Other limitations are described as follows.
• For a constant power law relationship between changes in CBF and CBV investigating rhesus monkeys and newborn piglets (Grubb et al., 1974; Brown et al., 2003), Ito et al. demonstrated the relationship between CBF and CBV in response to hyper- and hypocapnia in humans as CBV = 1.09 × CBF0.29 (Ito et al., 2003). However, because the relationship between the changes in CBF and CBV differs depending on the stimulation applied, this relationship during exercise also differs from that observed via the cerebrovascular response to CO2 induced by inhalation or hyperventilation. To the best of our knowledge, simultaneous measurements to examine changes in CBF and CBV in response to exercise have not been reported using PET. Dual measurements of CBF and CBV obtained by the simultaneous application of PET and TRS will clarify this relationship when changes in CBF are evoked by exercise.
• To minimize the effect of extra-cerebral components, we selected TRS. Although appropriate, during exercise when skin blood flow increases, NIRS signals would be contaminated by extra-cerebral effects. Accordingly, it should be noted that the tNIRS-1 applies the diffusion equation for the semi-infinite homogeneous medium instead of the two-layer data fitting analysis head model, previously used to discriminate and quantify absolute extra-cerebral and cerebral hemoglobin concentrations during incremental physical exercise (Auger et al., 2016).
• Another limitation is that arterial blood sampling was not performed to measure HGB and SaO2, which is necessary to detect CBV and calculate CMRO2 using the estimated CBF. Additional research using arterial blood sampling is required to validate and complement our results.
• When using NIRS systems, artifacts caused by head movement and sweat during prolonged exercise should be considered, especially during high-intensity exercise. In our data processing, we carefully observed and removed artifact-induced errors. To detect the precise location in the PFC, additional studies involving MRI can clarify the area of NIRS data collection.
4.5 Summary
In summary, we examined cerebral oxygenation in the PFC and estimated the relationship among rCMRO2, rCBV, rCBF, and rOEF during low- and moderate-intensity cycling exercises. Low-intensity cycling exercise did not evoke increases in ScO2 and [HbT] in the PFC but did induce a decrease in ScO2 in the left PFC at 3 min after exercise initiation, which was reflected as the dissociated relationships between rCMRO2 and rCBV and rCMRO2 and rCBV. When exercise intensity increased, there was an increase in cardiovascular variables, which was accompanied with an increase in perceived exertion. There was also an increase in ScO2 and [HbT], and a dissociated relationship between rCMRO2 and rCBV and rCMRO2 and rCBF in the PFC was identified. Alterations in the relationship between cerebral oxygen metabolism and perfusion in the PFC could be caused by exercise intensity and the duration of physiological stimulation, which could be reflected in the functional role of the PFC during exercise.
Data availability statement
The original contributions presented in the study are included in the article/Supplementary Materials; further inquiries can be directed to the corresponding author.
Ethics statement
The studies involving human participants were reviewed and approved by the ethics committee of the Faculty of Sociology, Aomori University. The patients/participants provided their written informed consent to participate in this study.
Author contributions
MH designed this study in collaboration with HS and AF. MH and KT prepared the physiological measurements. HS and AF designed the psychological assessment. MH performed the study according to the experimental protocol and collected data. MH and KT analyzed and interpreted the data. MH wrote the manuscript with assistance from YK. YK supervised the program. All authors contributed to the article and approved the submitted version.
Funding
This study was funded by Aomori University (annual budget allocated for Center for Brain and Health Sciences in 2022).
Acknowledgments
The authors thank all participants who volunteered for the study. The authors acknowledge the support received from Yuki Kasugai and Takayuki Ikeda during the arrangement of the experiments.
Conflict of interest
The authors declare that the research was conducted in the absence of any commercial or financial relationships that could be construed as a potential conflict of interest.
Publisher’s note
All claims expressed in this article are solely those of the authors and do not necessarily represent those of their affiliated organizations, or those of the publisher, the editors, and the reviewers. Any product that may be evaluated in this article, or claim that may be made by its manufacturer, is not guaranteed or endorsed by the publisher.
Supplementary material
The Supplementary Material for this article can be found online at: https://www.frontiersin.org/articles/10.3389/fphys.2023.1165939/full#supplementary-material
SUPPLEMENTARY FIGURE S1 | Changes in cardiovascular, respiratory variables and cerebral oxygenation variables obtained using near-infrared spectroscopy for the prefrontal cortex during and after a constant load of 17-minutes of low-intensity followed by 3-minutes of moderate-intensity constant-load cycling exercise for all participants (n = 12). (A) Heart rate and ScO2, (B) Heart rate and HbT, (C) PETCO2 and ScO2, (D) PETCO2 and HbT, (E) Relative
References
Asahara, R., Ishii, K., Liang, N., Hatanaka, Y., Hihara, K., and Matsukawa, K. (2022). Regional difference in prefrontal oxygenation before and during overground walking in humans: A wearable multichannel NIRS study. Am. J. Physiol. Regul. Integr. Comp. Physiol. 322 (1), R28–r40. doi:10.1152/ajpregu.00192.2021
Asahara, R., and Matsukawa, K. (2023). Prefrontal oxygenation is quantified with time-resolved near-infrared spectroscopy: Effect of sex on baseline oxygenation and the response during exercise. Am. J. Physiol. Regul. Integr. Comp. Physiol. 325 (1), R31–R44. doi:10.1152/ajpregu.00048.2023
Auger, H., Bherer, L., Boucher, E., Hoge, R., Lesage, F., and Dehaes, M. (2016). Quantification of extra-cerebral and cerebral hemoglobin concentrations during physical exercise using time-domain near infrared spectroscopy. Biomed. Opt. Express 7 (10), 3826–3842. doi:10.1364/BOE.7.003826
Ayaz, H., Baker, W., Blaney, G., Boas, D., Bortfeld, H., Brady, K., et al. (2022). Optical imaging and spectroscopy for the study of the human brain: Status report. Neurophotonics 9 (S2), S24001. doi:10.1117/1.NPh.9.S2.S24001
Bartholomew, J. B., Morrison, D., and Ciccolo, J. T. (2005). Effects of acute exercise on mood and well-being in patients with major depressive disorder. Med. Sci. Sports Exerc 37 (12), 2032–2037. doi:10.1249/01.mss.0000178101.78322.dd
Borg, G. (1970). Perceived exertion as an indicator of somatic stress. Scand. J. Rehabil. Med. 2 (2), 92–98. doi:10.2340/1650197719702239298
Brown, D. W., Hadway, J., and Lee, T.-Y. (2003). Near-infrared spectroscopy measurement of oxygen extraction fraction and cerebral metabolic rate of oxygen in newborn piglets. Pediatr. Res. 54 (6), 861–867. doi:10.1203/01.PDR.0000090928.93045.BE
Cohen, J. (1988). Statistical power analysis for the behavioral sciences. Hillsdale, NJ, USA: L. Erlbaum Associates.
Damrongthai, C., Kuwamizu, R., Suwabe, K., Ochi, G., Yamazaki, Y., Fukuie, T., et al. (2021). Benefit of human moderate running boosting mood and executive function coinciding with bilateral prefrontal activation. Sci. Rep. 11 (1), 22657. doi:10.1038/s41598-021-01654-z
Davidson, R. J. (2003). Affective neuroscience and psychophysiology: Toward a synthesis. Psychophysiology 40 (5), 655–665. doi:10.1111/1469-8986.00067
De Wachter, J., Proost, M., Habay, J., Verstraelen, M., Díaz-García, J., Hurst, P., et al. (2021). Prefrontal cortex oxygenation during endurance performance: A systematic review of functional near-infrared spectroscopy studies. Front. Physiology 12, 761232. doi:10.3389/fphys.2021.761232
Dishman, R. K., Thom, N. J., Puetz, T. W., O'Connor, P. J., and Clementz, B. A. (2010). Effects of cycling exercise on vigor, fatigue, and electroencephalographic activity among young adults who report persistent fatigue. Psychophysiology 47 (6), 1066–1074. doi:10.1111/j.1469-8986.2010.01014.x
Endo, K., Liang, N., Idesako, M., Ishii, K., and Matsukawa, K. (2018). Incremental rate of prefrontal oxygenation determines performance speed during cognitive Stroop test: The effect of ageing. J. Physiol. Sci. 68 (6), 807–824. doi:10.1007/s12576-018-0599-3
Endo, K., Matsukawa, K., Liang, N., Nakatsuka, C., Tsuchimochi, H., Okamura, H., et al. (2013). Dynamic exercise improves cognitive function in association with increased prefrontal oxygenation. J. Physiol. Sci. 63 (4), 287–298. doi:10.1007/s12576-013-0267-6
Fantini, S. (2014). Dynamic model for the tissue concentration and oxygen saturation of hemoglobin in relation to blood volume, flow velocity, and oxygen consumption: Implications for functional neuroimaging and coherent hemodynamics spectroscopy (CHS). Neuroimage 85 (1), 202–221. doi:10.1016/j.neuroimage.2013.03.065
Fox, P. T., and Raichle, M. E. (1986). Focal physiological uncoupling of cerebral blood flow and oxidative metabolism during somatosensory stimulation in human subjects. Proc. Natl. Acad. Sci. U. S. A. 83 (4), 1140–1144. doi:10.1073/pnas.83.4.1140
Fox, P. T., Raichle, M. E., Mintun, M. A., and Dence, C. (1988). Nonoxidative glucose consumption during focal physiologic neural activity. Science 241 (4864), 462–464. doi:10.1126/science.3260686
Garber, C. E., Blissmer, B., Deschenes, M. R., Franklin, B. A., Lamonte, M. J., Lee, I. M., et al. (2011). American college of sports medicine position stand. Quantity and quality of exercise for developing and maintaining cardiorespiratory, musculoskeletal, and neuromotor fitness in apparently healthy adults: Guidance for prescribing exercise. Med. Sci. Sports Exerc 43 (7), 1334–1359. doi:10.1249/MSS.0b013e318213fefb
Grubb, R. L., Raichle, M. E., Eichling, J. O., and Ter-Pogossian, M. M. (1974). The effects of changes in PaCO2 on cerebral blood volume, blood flow, and vascular mean transit time. Stroke 5 (5), 630–639. doi:10.1161/01.str.5.5.630
Hashem, M., Zhang, Q., Wu, Y., Johnson, T. W., and Dunn, J. F. (2020). Using a multimodal near-infrared spectroscopy and MRI to quantify gray matter metabolic rate for oxygen: A hypothermia validation study. NeuroImage 206, 116315. doi:10.1016/j.neuroimage.2019.116315
Heimer, L., and Van Hoesen, G. W. (2006). The limbic lobe and its output channels: Implications for emotional functions and adaptive behavior. Neurosci. Biobehav Rev. 30 (2), 126–147. doi:10.1016/j.neubiorev.2005.06.006
Hiura, M., Nariai, T., Ishii, K., Sakata, M., Oda, K., Toyohara, J., et al. (2014). Changes in cerebral blood flow during steady-state cycling exercise: A study using oxygen-15-labeled water with PET. J. Cereb. Blood Flow. Metab. 34 (3), 389–396. doi:10.1038/jcbfm.2013.220
Hiura, M., Nariai, T., Sakata, M., Muta, A., Ishibashi, K., Wagatsuma, K., et al. (2018a). Response of cerebral blood flow and blood pressure to dynamic exercise: A study using PET. Int. J. Sports Med. 39 (3), 181–188. doi:10.1055/s-0043-123647
Hiura, M., Nariai, T., Takahashi, K., Muta, A., Sakata, M., Ishibashi, K., et al. (2018b). Dynamic exercise elicits dissociated changes between tissue oxygenation and cerebral blood flow in the prefrontal cortex: A study using NIRS and PET. Adv. Exp. Med. Biol. 1072, 269–274. doi:10.1007/978-3-319-91287-5_43
Hiura, M., Shirai, Y., Shibutani, H., Funaki, A., Takahashi, K., Katayama, Y., et al. (2022). Estimation of cerebral hemodynamics and oxygenation during various intensities of rowing exercise: An nirs study. Front. Physiol. 13. doi:10.3389/fphys.2022.828357
Ijichi, S., Kusaka, T., Isobe, K., Okubo, K., Kawada, K., Namba, M., et al. (2005). Developmental changes of optical properties in neonates determined by near-infrared time-resolved spectroscopy. Pediatr. Res. 58 (3), 568–573. doi:10.1203/01.Pdr.0000175638.98041.0e
Ito, H., Kanno, I., Ibaraki, M., Hatazawa, J., and Miura, S. (2003). Changes in human cerebral blood flow and cerebral blood volume during hypercapnia and hypocapnia measured by positron emission tomography. J. Cereb. Blood Flow. Metab. 23 (6), 665–670. doi:10.1097/01.Wcb.0000067721.64998.F5
Ito, H., Takahashi, K., Hatazawa, J., Kim, S. G., and Kanno, I. (2001). Changes in human regional cerebral blood flow and cerebral blood volume during visual stimulation measured by positron emission tomography. J. Cereb. Blood Flow. Metab. 21 (5), 608–612. doi:10.1097/00004647-200105000-00015
Karvonen, M. J., Kentala, E., and Mustala, O. (1957). The effects of training on heart rate; a longitudinal study. Ann. Med. Exp. Biol. Fenn. 35 (3), 307–315.
Klem, G. H., Luders, H. O., Jasper, H. H., and Elger, C. (1999). The ten-twenty electrode system of the international federation. The international federation of clinical neurophysiology. Electroencephalogr. Clin. Neurophysiol. Suppl. 52, 3–6.
Lange, F., and Tachtsidis, I. (2019). Clinical brain monitoring with time domain NIRS: A review and future perspectives. Appl. Sci. 9 (8), 1612. doi:10.3390/app9081612
Madsen, P. L., Cruz, N. F., Sokoloff, L., and Dienel, G. A. (1999). Cerebral oxygen/glucose ratio is low during sensory stimulation and rises above normal during recovery: Excess glucose consumption during stimulation is not accounted for by lactate efflux from or accumulation in brain tissue. J. Cereb. Blood Flow. Metab. 19 (4), 393–400. doi:10.1097/00004647-199904000-00005
Matsukawa, K., Ishii, K., Liang, N., Endo, K., Ohtani, R., Nakamoto, T., et al. (2015). Increased oxygenation of the cerebral prefrontal cortex prior to the onset of voluntary exercise in humans. J. Appl. Physiology 119 (5), 452–462. doi:10.1152/japplphysiol.00406.2015
McNair Dm, H. J. (2007). Profile of mood states (POMS), technical update. North Tonawanda, NY: Multi-Health Systems.
Mintun, M. A., Vlassenko, A. G., Shulman, G. L., and Snyder, A. Z. (2002). Time-related increase of oxygen utilization in continuously activated human visual cortex. Neuroimage 16 (2), 531–537. doi:10.1006/nimg.2002.1114
Monroe, D. C., Patel, N. R., McCully, K. K., and Dishman, R. K. (2020). The effects of exercise on mood and prefrontal brain responses to emotional scenes in smokers. Physiol. Behav. 213, 112721. doi:10.1016/j.physbeh.2019.112721
Nowak, M., Olsen, K. S., Law, I., Holm, S., Paulson, O. B., and Secher, N. H. (1999). Command-related distribution of regional cerebral blood flow during attempted handgrip. J. Appl. Physiology 86 (3), 819–824. doi:10.1152/jappl.1999.86.3.819
Ohmae, E., Ouchi, Y., Oda, M., Suzuki, T., Nobesawa, S., Kanno, T., et al. (2006). Cerebral hemodynamics evaluation by near-infrared time-resolved spectroscopy: Correlation with simultaneous positron emission tomography measurements. Neuroimage 29 (3), 697–705. doi:10.1016/j.neuroimage.2005.08.008
Okamoto, M., Dan, H., Sakamoto, K., Takeo, K., Shimizu, K., Kohno, S., et al. (2004). Three-dimensional probabilistic anatomical cranio-cerebral correlation via the international 10-20 system oriented for transcranial functional brain mapping. Neuroimage 21 (1), 99–111. doi:10.1016/j.neuroimage.2003.08.026
Polinder-Bos, H. A., Elting, J. W. J., Aries, M. J., Garcia, D. V., Willemsen, A. T., van Laar, P. J., et al. (2020). Changes in cerebral oxygenation and cerebral blood flow during hemodialysis - a simultaneous near-infrared spectroscopy and positron emission tomography study. J. Cereb. Blood Flow. Metab. 40 (2), 328–340. doi:10.1177/0271678X18818652
Raichle, M. E., and Mintun, M. A. (2006). Brain work and brain imaging. Annu. Rev. Neurosci. 29, 449–476. doi:10.1146/annurev.neuro.29.051605.112819
Roche-Labarbe, N., Carp, S. A., Surova, A., Patel, M., Boas, D. A., Grant, P. E., et al. (2010). Noninvasive optical measures of CBV, StO2, CBF index, and rCMRO2 in human premature neonates' brains in the first six weeks of life. Hum. Brain Mapp. 31 (3), 341–352. doi:10.1002/hbm.20868
Rostrup, E., Law, I., Pott, F., Ide, K., and Knudsen, G. M. (2002). Cerebral hemodynamics measured with simultaneous PET and near-infrared spectroscopy in humans. Brain Res. 954 (2), 183–193. doi:10.1016/S0006-8993(02)03246-8
Roy, C. S., and Sherrington, C. S. (1890). On the regulation of the blood-supply of the brain. J. Physiol. 11 (1-2), 85–158. doi:10.1113/jphysiol.1890.sp000321
Seeley, W. W., Menon, V., Schatzberg, A. F., Keller, J., Glover, G. H., Kenna, H., et al. (2007). Dissociable intrinsic connectivity networks for salience processing and executive control. J. Neurosci. 27 (9), 2349–2356. doi:10.1523/JNEUROSCI.5587-06.2007
Takehara, N., Tsubaki, A., Yamazaki, Y., Kanaya, C., Sato, D., Morishita, S., et al. (2017). “Changes in oxyhemoglobin concentration in the prefrontal cortex and primary motor cortex during low- and moderate-intensity exercise on a cycle ergometer,” in Oxygen transport to tissue XXXIX. Editors H. J. Halpern, J. C. LaManna, D. K. Harrison, and B. Epel (Cham, Germany: Springer International Publishing), 241–247.
Tanji, J., and Hoshi, E. (2008). Role of the lateral prefrontal cortex in executive behavioral control. Physiol. Rev. 88 (1), 37–57. doi:10.1152/physrev.00014.2007
Tichauer, K. M., Brown, D. W., Hadway, J., Lee, T. Y., and St Lawrence, K. (2006). Near-infrared spectroscopy measurements of cerebral blood flow and oxygen consumption following hypoxia-ischemia in newborn piglets. J. Appl. Physiol. 100 (3), 850–857. doi:10.1152/japplphysiol.00830.2005
Torricelli, A., Contini, D., Pifferi, A., Caffini, M., Re, R., Zucchelli, L., et al. (2014). Time domain functional NIRS imaging for human brain mapping. Neuroimage 85 (1), 28–50. doi:10.1016/j.neuroimage.2013.05.106
Trangmar, S. J., Chiesa, S. T., Stock, C. G., Kalsi, K. K., Secher, N. H., and Gonzalez-Alonso, J. (2014). Dehydration affects cerebral blood flow but not its metabolic rate for oxygen during maximal exercise in trained humans. J. Physiol. 592 (14), 3143–3160. doi:10.1113/jphysiol.2014.272104
Vafaee, M. S., and Gjedde, A. (2004). Spatially dissociated flow-metabolism coupling in brain activation. Neuroimage 21 (2), 507–515. doi:10.1016/j.neuroimage.2003.10.003
Vafaee, M. S., Vang, K., Bergersen, L. H., and Gjedde, A. (2012). Oxygen consumption and blood flow coupling in human motor cortex during intense finger tapping: Implication for a role of lactate. J. Cereb. Blood Flow. Metab. 32 (10), 1859–1868. doi:10.1038/jcbfm.2012.89
Verdecchia, K., Diop, M., Lee, T. Y., and St Lawrence, K. (2013). Quantifying the cerebral metabolic rate of oxygen by combining diffuse correlation spectroscopy and time-resolved near-infrared spectroscopy. J. Biomed. Opt. 18 (2), 27007. doi:10.1117/1.Jbo.18.2.027007
Wabnitz, H., Contini, D., Spinelli, L., Torricelli, A., and Liebert, A. (2020). Depth-selective data analysis for time-domain fNIRS: Moments vs. time windows. Biomed. Opt. Express 11 (8), 4224–4243. doi:10.1364/BOE.396585
Wan, X., Liu, C., Olson, T. P., Chen, X., Lu, W., and Jiang, W. (2021). Differences in peak oxygen uptake in bicycle exercise test caused by body positions: A meta-analysis. Front. Cardiovasc Med. 8, 734687. doi:10.3389/fcvm.2021.734687
Watzman, H. M., Kurth, C. D., Montenegro, L. M., Rome, J., Steven, J. M., and Nicolson, S. C. (2000). Arterial and venous contributions to near-infrared cerebral oximetry. Anesthesiology 93 (4), 947–953. doi:10.1097/00000542-200010000-00012
Keywords: cerebral oxygenation, cerebral metabolic rate for oxygen, cerebral blood volume, cerebral blood flow, exercise intensity, postexercise hypotension, mood status
Citation: Hiura M, Funaki A, Shibutani H, Takahashi K and Katayama Y (2023) Dissociated coupling between cerebral oxygen metabolism and perfusion in the prefrontal cortex during exercise: a NIRS study. Front. Physiol. 14:1165939. doi: 10.3389/fphys.2023.1165939
Received: 14 February 2023; Accepted: 07 July 2023;
Published: 25 July 2023.
Edited by:
Lee Stoner, University of North Carolina at Chapel Hill, United StatesReviewed by:
Stephane Perrey, Université de Montpellier, FranceKanji Matsukawa, Hiroshima University, Japan
Atsuhiro Tsubaki, Niigata University of Health and Welfare, Japan
Copyright © 2023 Hiura, Funaki, Shibutani, Takahashi and Katayama. This is an open-access article distributed under the terms of the Creative Commons Attribution License (CC BY). The use, distribution or reproduction in other forums is permitted, provided the original author(s) and the copyright owner(s) are credited and that the original publication in this journal is cited, in accordance with accepted academic practice. No use, distribution or reproduction is permitted which does not comply with these terms.
*Correspondence: Mikio Hiura, aGl1cmFAYW9tb3JpLXUuYWMuanA=