 Marek Strzała1*
 Kamil Sokołowski1
 Łukasz Wądrzyk1
 Robert Staszkiewicz2
 Łukasz Kryst3Magdalena Żegleń4Piotr Krężałek5
 Marcin Maciejczyk6
- 1Department of Water Sports, Faculty of Physical Education and Sport, University of Physical Education, Kraków, Poland
- 2Department of Biomechanics, Faculty of Physical Education and Sport, University of Physical Education, Kraków, Poland
- 3Department of Anthropology, Faculty of Physical Education and Sport, University of Physical Education, Kraków, Poland
- 4Pain Research Group, Institute of Psychology, Jagiellonian University in Krakow, Kraków, Poland
- 5Department of Physiotherapy, Faculty of Motor Rehabilitation, University of Physical Education, Kraków, Poland
- 6Department of Physiology and Biochemistry, Faculty of Physical Education and Sport, University of Physical Education, Kraków, Poland
Background: The study aimed to assess differences in the biological age (BA) of 13-year-old swimmers and show their ability, as biologically younger—late mature or older—early mature, to develop fast 60-s oxygen uptake (
Methods: The study involved 36 competitive young male swimmers (metrical age: 12.9 ± 0.56 years). Depending on BA examination, the group was divided into early-mature (BA: 15.8 ± 1.18 years, n = 13) and late-mature (BA: 12.9 ± 0.60 years, n = 23) participants, especially for the purpose of comparing tethered swimming indices, i.e., average values of force (Fave) and
Results: In the 1-min tethered front crawl test, early-mature swimmers obtained higher results of absolute values of
Conclusion: The 1-min tethered swimming test revealed significant differences in the homogeneous calendar age/heterogeneous BA group of swimmers. These were distinguished by the higher level of
Introduction
The performance of young athletes training in competitive swimming depends on their circulatory and respiratory abilities, skeletal muscle energetics, and somatic traits, which are developed simultaneously with maturation and training. Therefore, testing and then proper training with appropriate intensity, corresponding to physiological changes, supporting the current development of the body and specific motor skills, constitute a priority. In addition, acting in a harmonious manner ensures long-term progress focused on the development of an adult elite swimmer (Pichardo et al., 2018).
In young swimmers, in the period of building up the foundations of endurance, aerobic capacity assessed as maximal oxygen uptake (
In competitive swimming, developing the fast component of
During exercise, the fast phase of
Nevertheless, to gather useful results to evaluate young swimmers’ strength potential and physiological endurance, tethered swimming can be used as a valid and reliable tool to measure exerted forces in water, where simultaneously physiological variables are not significantly different from free swimming effort of similar duration (Morouço et al., 2014; Ruiz-Navarro et al., 2020).
This study aimed to assess differences in BA of 13-year-old swimmers and show their ability, as biologically younger or older, to develop fast 60-s
Materials and methods
Participants
Overall, 36 young male swimmers volunteered to participate in the study. Their metrical age was 12.9 ± 0.56 years, and their BA was estimated as 14.0 ± 1.56 years, with a body mass index of 19.1 ± 1.94 kg m–2. All swimmers were licensed by the Polish Swimming Federation, and their training experience was 4–5 years. Their swimming level according to FINA scores in the 400-m freestyle race was 323.0 ± 66.88 pts, which situates them at the fifth threshold in the Ruiz-Navarro et al. (2022) classification of the competitive level. The subjects performed 10 training sessions each week, versatile in style, with a load adapted to their age, and regularly competed in swimming competitions within their age group, including at the national level (Polish championships).
Oxygen uptake and pulling force measurements in the tethered swimming test
The maximum front crawl tethered test was performed for 1 min, along with the measurement of
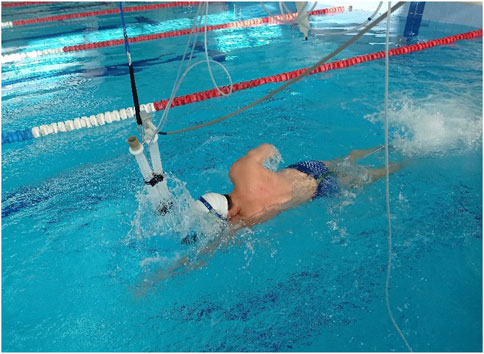
FIGURE 1. One of the participants during simultaneous oxygen uptake and tethered force measurements in the 1-min front crawl tethered swimming test.
400-m front crawl race
The 400-m freestyle competition with the participation of judges was carried out in a 25-m swimming pool (all swimmers used the front crawl technique). An automatic timing device (Omega, Switzerland; OCP5, StartTime V) was applied. Before the race, the participants completed a 1000-m warm-up as in a competition. All trials were recorded using a camera at 50 Hz framing (GC-PX100BE, JVC, Japan). The camera was placed on a tripod at the bleachers, 7 m above the water surface, on an extension in the middle point of the pool.
The 400-m race surface swimming speed (i.e., clean surface front crawl swimming, Vsurf [m·s–1]) was distinguished for a 13-m sector for each 25-m lap, besides the 10-m sector on the first lap. Times for separate sectors were measured when the swimmer’s head crossed the imaginary line linking the markers on both sides of the pool. Markers were placed at the side of the pool to indicate the lines separating three zones: (a) I 7-m turn zone (including the first 10-m start zone), (b) surface swimming zone (13 m), and (c) II turn zone (5 m). Times were measured when swimmers’ heads crossed the imaginary line linking markers at the sides of the pool (Kinovea ver. 0.8.15 software). The 400-m front crawl velocity (Vtotal [m·s–1]) was defined as 400 divided by the final time of the race. The video analysis and computation of the basic kinetic and kinematic indices were performed as previously described by Sokołowski et al. (2021).
Kinematic indices
For the kinematic analysis, SR, SL, and SI were calculated. SR was defined as the number of full stroke cycles performed within a unit of time (in cycles∙min–1) and was calculated with the video analysis of three consecutive stroke cycles (intraclass correlation of 0.99, 95% CI: 0.960–0.997). SL was defined as the horizontal distance that the body traveled during a full stroke cycle and was calculated as
where SL (in m) is the stroke length, v is the swimming velocity, and SR is the stroke rate. Finally, SI was deemed as an overall swimming efficiency estimator and computed as
where SI (in m2∙s–1) is the stroke index, SL is the stroke length, and v is the swimming velocity.
Biological age
The swimmers’ BA was assessed based on the collected measurements of height (using a stadiometer, Sieber Hegner Maschinen AG, Switzerland) and body mass (Tanita BC-418, Japan). Then, age calculations were performed on the basis of the percentile charts for these data (Figure 2). The following formula was used:
where BHage is the age obtained from the percentile charts in accordance with the participant’s body height and BMage is the age obtained from the percentile charts in accordance with the participant’s body mass. Growth charts by the Children’s Memorial Health Institute, standardized and validated for the Polish population, were used (the 50th percentile was applied to align height and mass with age). Additionally, pubertal development was assessed. Tanner stages based on pubic hair scale were estimated (Bornstein, 2018). Tanner’s scale was used only as an auxiliary measurement because the determination of biological sex relied mainly on the morphological criterion; Tanner’s scale was used in the event of three participants caused by large discrepancies in height- and weight-based ages.
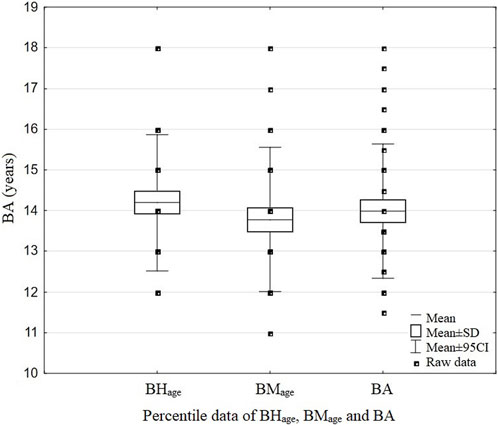
FIGURE 2. Data of BHage, BMage, and BA of the examined swimmers.
BHage, age obtained from the percentile charts in accordance with the participant’s body height; BMage, age obtained from the percentile charts in accordance with the participant’s body mass; BA, biological age.
In this study, older—early mature (BA: 15.8 ± 1.18 years, calendar age: 13.0 ± 0.49 years) and younger (BA: 12.9 ± 0.60 years, calendar age: 12.8 ± 0.58 years) BA groups were also distinguished to show the differentiation of variables (
Statistical analysis
The assumption of the normality of the variables was verified by a visual examination of the distributions and the Lilliefors test. The results of this analysis were empowering to carry out a two-factor ANOVA (6 × 2) with 1 within-subject factor (six measurements of
The analyses were performed for small, medium, and large effect sizes. An alpha level of 0.05 was assumed in all analyses. As for ANOVA, the power to detect significant interaction between a grouping factor and the within-subjects factor, three effect sizes were assumed: small: f = 0.10, medium: f = 0.25, and large: f = 0.40 (Cohen, 1988). The achieved power for the sample of 36 participants was 0.30, 0.98, and 0.99, respectively. For correlations, the assumed effect sizes were r = 0.10, 0.30, and 0.50. The achieved sample power value was 0.09, 0.45, and 0.92. In summary, for ANOVA, the sample size was satisfactory for medium and large effects but not for small effects. For correlations, the sample size was only enough to detect large effects. All statistical analyses were conducted using Statistica 13.3 software (TIBCO Software Inc., Palo Alto, CA, United States).
Results
In this study, the division of swimmers into early-mature (older BA) and late-mature (younger BA) groups by presenting the most important variables (
The older—early-mature group had higher
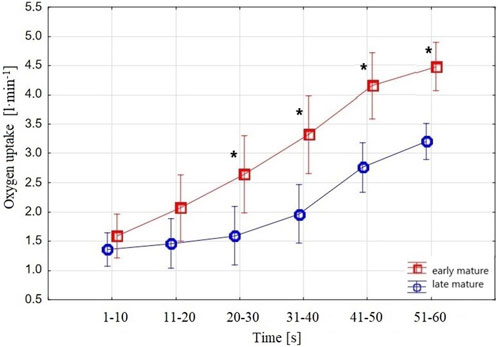
FIGURE 3. Swimmers’
When analyzing the groups separately, in the late-mature group, the ANOVA results showed no difference from the first to the third
Fave (Figure 4) in the 10-s periods of the 1-min tethered test was different (two-factor ANOVA, 6 × 2) between the BA groups and across the subsequent 10-s periods within the late-mature and the early-mature swimmers.
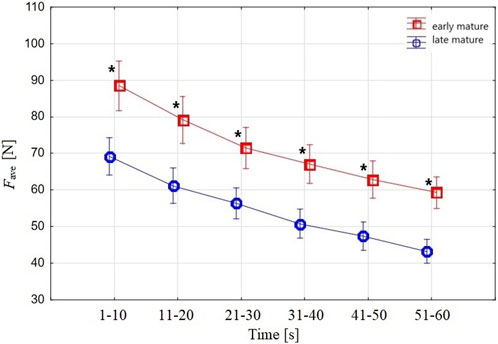
FIGURE 4. Swimmers’ Fave in the 10-s periods measured in the 1-min tethered test. The upper curve shows Fave in the early-mature group, and the lower curve depicts Fave in the late-mature group. Vertical bars indicate a 0.95 confidence interval; * shows a significant difference between early-mature and late-mature swimmers.
Considering
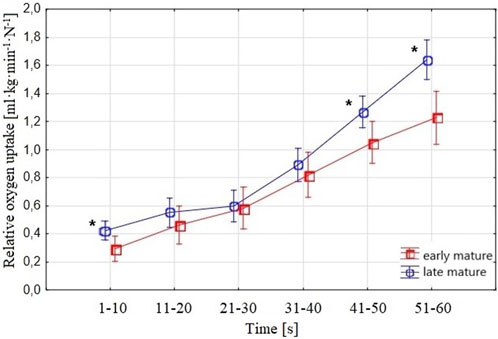
FIGURE 5. Swimmers’ relative
An increased, ranging from low to very strong, correlation was noted between
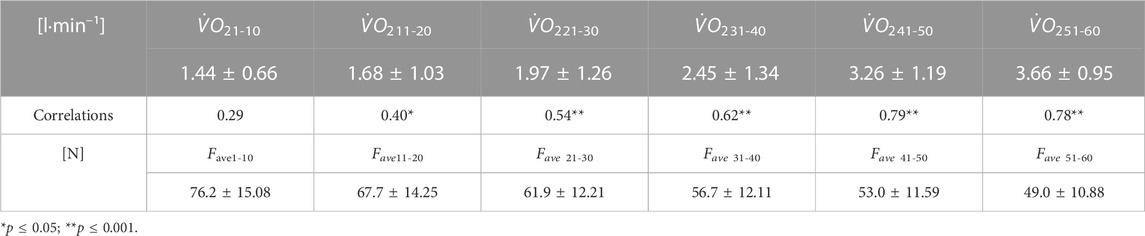
TABLE 1. Pearson’s correlations between
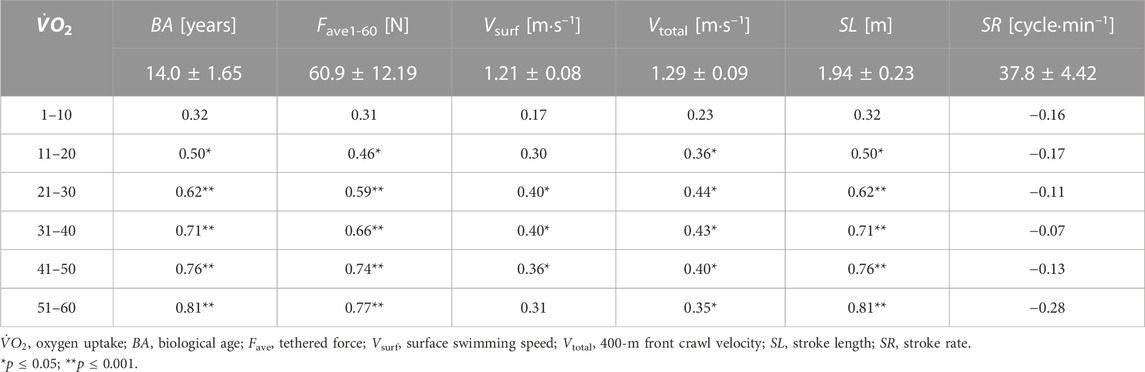
TABLE 2. Pearson’s correlations between
The subsequent 10-s periods of Fave showed a significant moderate relationship with the swimming race results of Vsurf, Vtotal, and SL and a strong or very strong relationship with BA (Table 3).
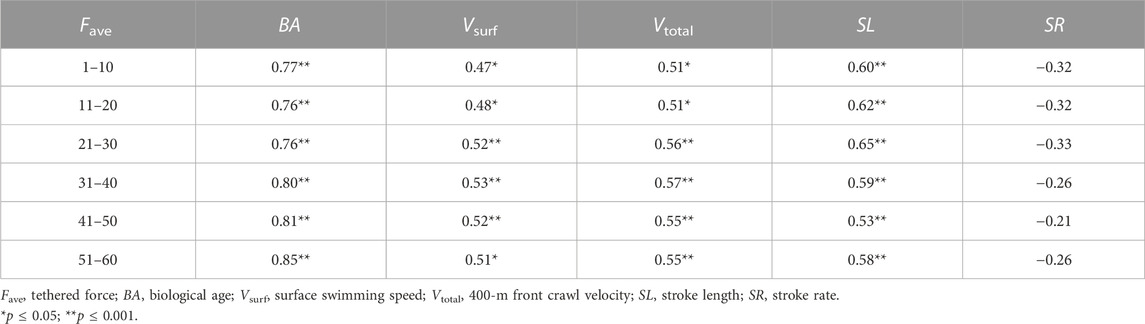
TABLE 3. Pearson’s correlations of Fave (N) in the subsequent 10-s periods with BA, entire force indice of the 1-min tethered test, and speed and kinematic indice of the 400-m front crawl race (n = 36).
As depicted in Table 4, there was a significant moderate correlation between the 400-m swimming speed (Vsurf and Vtotal) and SL kinematic and
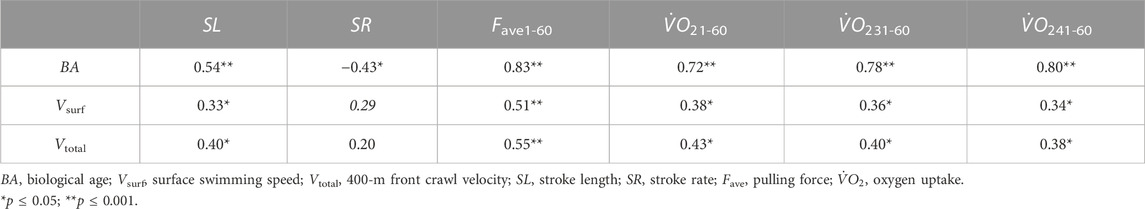
TABLE 4. Pearson’s correlations between Vtotal, Vsurf, and BA and SL, SR, Fave1-60,
Additionally,
Discussion
This study aimed to evaluate the oxygen kinetics during a 1-min tethered test in young swimmers with different BAs. It was hypothesized that oxygen kinetics might be different in participants with different BAs. Calendar age-homogeneous 13-year-old swimmers were significantly differentiated in terms of biological development. Dividing them in accordance with BA into early-mature and late-mature groups revealed their differences in
In this study,
It can be hypothesized that, generally, a slower increase in
As explained by Poole et al. (2012), the available evidence supports a greater bias toward oxidative vs. glycolytic metabolism in children compared with adults (in the present study, late-mature vs. early-mature swimmers). This helps explain a greater percentage of
In this study, the influence of the
It could be stated that short-duration extreme performance is dependent on fast
Pulling force results of the all 36 swimmers showed moderate (Iave1-60) and high (Fave1-60) correlations with 400-m front crawl performance and a high relationship with the main contributor of swimming speed, i.e., SL kinematics, similar to the case of
In future studies, skeletal muscle volume relating to performance could be calculated to assess the muscle’s effectiveness in producing force during tethered swimming. Considering similar tests closer to the natural conditions, e.g., in a flume, could be seen as an alternative to the static tests carried out in this work, which was its limitation (Ruiz-Navarro et al., 2020).
In conclusion, the 1-min tethered swimming test showed significant differences in the homogeneous calendar age/heterogeneous BA groups of swimmers. These were distinguished by a higher level of
Data availability statement
The raw data supporting the conclusion of this article will be made available by the authors, without undue reservation.
Ethics statement
The studies involving humans were approved by the Komisja Bioetyczna przy Okregowej Izbie Lekarskiej w Krakowie, Krupnicza 11A. The studies were conducted in accordance with the local legislation and institutional requirements. Written informed consent for participation in this study was provided by the participants’ legal guardians/next of kin.
Author contributions
MS collected the data, performed statistical analysis, and wrote the manuscript. KS co-wrote the manuscript and collected the data. LW collected the data. RS collected the data. LK collected the data. MZ collected the data. PK collected the data. MM co-wrote the manuscript. All authors contributed to the article and approved the submitted version.
Conflict of interest
The authors declare that the research was conducted in the absence of any commercial or financial relationships that could be construed as a potential conflict of interest.
Publisher’s note
All claims expressed in this article are solely those of the authors and do not necessarily represent those of their affiliated organizations, or those of the publisher, the editors, and the reviewers. Any product that may be evaluated in this article, or claim that may be made by its manufacturer, is not guaranteed or endorsed by the publisher.
References
Almeida T. A. F., Pessôa Filho D. M., Espada M. C., Reis J. F., Sancassani A., Massini D. A., et al. (2021). Physiological responses during high-intensity interval training in young swimmers. Front. Physiol. 12, 662029. doi:10.3389/fphys.2021.662029
Arend M., Kivastik J., Talts J., Mäestu J. (2021). The effect of inspiratory muscle warm-up on VO 2 kinetics during submaximal rowing. Sports (Basel) 9, 42. doi:10.3390/sports9030042
Bar-Or O. (1982). Physiologische gesetzmässigkeiten sportlicher aktivität beim kind. Kinder Im. Leist. (Birkhäuser Basel) 2, 18–30. doi:10.1007/978-3-0348-6699-6_3
Baxter-jones A., Goldstein H., Helms P., Helms Thede A. P. (1993). The development of aerobic power in young athletes. J. Appl. Physiol. (1985) 75, 1160–1167. doi:10.1152/jappl.1993.75.3.1160
Beelen A., Sargeant A. J. (1993). Effect of prior exercise at different pedalling frequencies on maximal power in humans. Artic. Eur. J. Appl. Physiol. Occup. Physiol. 66, 102–107. doi:10.1007/BF01427049
Birat A., Ratel S. (2020). “Physiological determinants of swimming performance and their trainability in children,” in High performance youth swimming (New York and London: Routledge, Taylor and Francis Group), 10–22. doi:10.4324/9780429465598-3
Bornstein M. H. (2018). The SAGE encyclopedia of lifespan human development. Maryland: SAGE Publications Bethesda. doi:10.4135/9781506307633
Campos E. Z., Kalva-Filho C. A., Gobbi R. B., Barbieri R. A., Almeida N. P., Papoti M. (2017). Anaerobic contribution determined in swimming distances: relation with performance. Front. Physiol. 8, 755. doi:10.3389/fphys.2017.00755
Costill D. L., Kovaleski J., Porter D., Kirwan J., Fielding R., King D. (1985). Energy expenditure during front crawl swimming: predicting success in middle-distance events. Int. J. Sports Med. 6, 266–270. doi:10.1055/s-2008-1025849
Costill D. L., Maglischo E. W., Richardson A. B. (1992). Handbook of sports medicine and science. Oxford: Blackwell Publishing. doi:10.1002/9781119227045
Dotan R., Mitchell C., Cohen R., Klentrou P., Gabriel D., Falk B. (2012). Child—Adult differences in muscle activation—A review. Pediatr. Exerc. Sci. 24, 2–21. doi:10.1123/pes.24.1.2
Figueiredo P., Zamparo P., Sousa A., Vilas-Boas J. P., Fernandes R. J. (2011). An energy balance of the 200 m front crawl race. Eur. J. Appl. Physiol. 111, 767–777. doi:10.1007/s00421-010-1696-z
Fiori J. M., Bandeira P. F. R., Zacca R., Castro F. A. de S. (2022). The impact of a swimming training season on anthropometrics, maturation, and kinematics in 12-year-old and under age-group swimmers: A network analysis. Front. Sport. Act. Living 4, 799690. doi:10.3389/fspor.2022.799690
Gastin P. B., Lawson D. L. (1994). Variable resistance all-out test to generate accumulated oxygen deficit and predict anaerobic capacity. Eur. J. Appl. Physiol. Occup. Physiol. 69, 331–336. doi:10.1007/BF00392039
Hellard P., Pla R., Rodríguez F. A., Simbana D., Pyne D. B. (2018). Dynamics of the metabolic response during a competitive 100-m freestyle in elite male swimmers. Int. J. Sports Physiol. Perform. 13, 1011–1020. doi:10.1123/ijspp.2017-0597
Ingham S. A., Carter H., Whyte G. P., Doust J. H. (2007). Comparison of the oxygen uptake kinetics of club and olympic champion rowers. Med. Sci. Sports Exerc. 39, 865–871. doi:10.1249/mss.0b013e31803350c7
Kalva-Filho C. A., Zagatto A. M., Araújo M. I. C., Santiago P. R. P., Da Silva A. S. R., Gobatto C. A., et al. (2015). Relationship between aerobic and anaerobic parameters from 3-minute all-out tethered swimming and 400-m maximal front crawl effort. J. Strength Cond. Res. 29, 238–245. doi:10.1519/JSC.0000000000000592
Koppo K., Bouckaert J., Jones A. M. (2004). Effects of training status and exercise intensity on phase II VO 2 kinetics. Med. Sci. Sports Exerc. 36, 225–232. doi:10.1249/01.MSS.0000113473.48220.20
Lätt E., Jürimäe J., Haljaste K., Cicchella A., Purge P., Jürimäe T. (2009). Longitudinal development of physical and performance parameters during biological maturation of young male swimmers. Percept. Mot. Ski. 108, 297–307. doi:10.2466/PMS.108.1.297-307
Massini D. A., Almeida T. A. F., Vasconcelos C. M. T., Macedo A. G., Espada M. A. C., Reis J. F., et al. (2021). Are young swimmers short and middle distances energy cost sex-specific? Front. Physiol. 12, 796886. doi:10.3389/fphys.2021.796886
Massini D. A., Espada M. C., Macedo A. G., Santos F. J., Castro E. A., Ferreira C. C., et al. (2023). Oxygen uptake kinetics and time limit at maximal aerobic workload in tethered swimming. Metabolites 13, 773. doi:10.3390/metabo13070773
Morouço P. G., Marinho D. A., Keskinen K. L., Badillo J. J., Marques M. C. (2014). Tethered swimming can be used to evaluate force contribution for short-distance swimming performance. J. Strength Cond. Res. 28, 3093–3099. doi:10.1519/JSC.0000000000000509
Morouço P. G., Vilas-Boas J. P., Fernandes R. J. (2012). Evaluation of adolescent swimmers through a 30-s tethered test. Pediatr. Exerc. Sci. 24, 312–321. doi:10.1123/pes.24.2.312
Neiva H. P., Marques M. C., Barbosa T. M., Izquierdo M., Viana J. L., Teixeira A. M., et al. (2017). Warm-up for sprint swimming: race-Pace or aerobic stimulation? A randomized study. J. Strength Cond. Res. 31, 2423–2431. doi:10.1519/JSC.0000000000001701
Olbrecht J. (2015). The science of winning. Available at:https://scholar.google.com/scholar?hl=pl&as_sdt=0%2C5&q=Olbrecht+2015+the+science+of+winning&btnG= (Accessed May 16, 2023).
Pichardo A. W., Oliver J. L., Harrison C. B., Maulder P. S., Lloyd R. S. (2018). Integrating models of long-term athletic development to maximize the physical development of youth. Int. J. Sport. Sci. Coach. 13, 1189–1199. doi:10.1177/1747954118785503
Poole D., Jones A. M., Poole D. C. (2012). Oxygen uptake kinetics. Compr. Physiol. 2, 933–996. doi:10.1002/cphy.c100072
Pringle J. S. M., Doust J. H., Carter H., Tolfrey K., Campbell I. T., Jones A. M., et al. (2003). Oxygen uptake kinetics during moderate, heavy and severe intensity “submaximal” exercise in humans: the influence of muscle fibre type and capillarisation. Eur. J. Appl. Physiol. 89, 289–300. doi:10.1007/s00421-003-0799-1
Reis J. F., Alves F. B., Bruno P. M., Vleck V., Millet G. P. (2012). Oxygen uptake kinetics and middle distance swimming performance. J. Sci. Med. Sport 15, 58–63. doi:10.1016/j.jsams.2011.05.012
Ribeiro J., Figueiredo · P., Sousa · A., Monteiro · J., Pelarigo · J., Vilas-Boas J. P., et al. (2015). VO₂ kinetics and metabolic contributions during full and upper body extreme swimming intensity. Eur. J. Appl. Physiol. 115, 1117–1124. doi:10.1007/s00421-014-3093-5
Rodríguez F. A., Keskinen K. L., Malvela M. T., Keskinen O. P. (2003). “Oxygen uptake kinetics during free swimming: A pilot study,” in Biomech. Med. Swim. IX (Publications de l’Université de Saint-Étienne), 379–384. Available at:https://www.researchgate.net/publication/234015321 (Accessed May 16, 2022).
Ruiz-Navarro J. J., Gay A., Cuenca-Fernández F., López-Belmonte Ó., Morales-Ortíz E., López-Contreras G., et al. (2022). The relationship between tethered swimming, anaerobic critical velocity, dry-land strength, and swimming performance. Int. J. Perform. Anal. Sport 22, 407–421. doi:10.1080/24748668.2022.2072561
Ruiz-Navarro J. J., Morouço P. G., Arellano R. (2020). Relationship between tethered swimming in a flume and swimming performance. Int. J. Sports Physiol. Perform. 15, 1087–1094. doi:10.1123/IJSPP.2019-0466
Santos K. B., Bento P. C. B., Pereira G., Rodacki A. L. F. (2016). The relationship between propulsive force in tethered swimming and 200-m front crawl performance. J. Strength Cond. Res. 30, 2500–2507. doi:10.1519/JSC.0000000000000410
Sokołowski K., Bartolomeu R. F., Barbosa T. M., Strzała M. (2022a). VO2 kinetics and tethered strength influence the 200-m front crawl stroke kinematics and speed in young male swimmers. Front. Physiol. 13, 1045178. doi:10.3389/fphys.2022.1045178
Sokołowski K., Strzała M., Radecki-Pawlik A. (2023). Body composition and anthropometrics of young male swimmers in relation to the tethered swimming and kinematics of 100-m front crawl race. J. Sports Med. Phys. Fit. 63, 436–443. doi:10.23736/S0022-4707.22.14054-5
Sokołowski K., Strzała M., Stanula A., Kryst Ł., Radecki-Pawlik A., Krężałek P., et al. (2021). Biological age in relation to somatic, physiological, and swimming kinematic indices as predictors of 100 m front crawl performance in young female swimmers. Int. J. Environ. Res. Public Health 18, 6062. doi:10.3390/ijerph18116062
Sokołowski K., Strzała M., Żegleń M. (2022b). Study of talented young male swimmers-scientific approach to the kinematic and physiological predictors of 400-m front crawl race. ACTA Bioeng. Biomech. 24, 2. doi:10.37190/ABB-01964-2021-02
Sousa A., Figueiredo P., Oliveira N. L., Oliveira J., Silva A. J., Keskinen K. L., et al. (2011). VO2 kinetics in 200-m race-pace front crawl swimming. Int. J. Sport. Med. 32, 765–770. doi:10.1055/s-0031-1279772
Strzała M., Stanula A., Krężałek P., Ostrowski A., Kaca M., Głąb G. (2019). Influence of morphology and strength on front crawl swimming speed in junior and youth age-group swimmers. J. strength Cond. Res. 33, 2836–2845. doi:10.1519/JSC.0000000000002084
Van Praagh E., Doré E. (2002). Short-term muscle power during growth and maturation. Sport. Med. 32, 701–728. doi:10.2165/00007256-200232110-00003
Wadrzyk L., Staszkiewicz R., Zeglen M., Kryst L. (2021). Relationship between somatic build and kinematic indices of underwater undulatory swimming performed by young male swimmers. Int. J. Perform. Anal. Sport 21, 435–450. doi:10.1080/24748668.2021.1909450
Zacca R., Toubekis A., Freitas L., Silva A. F., Azevedo R., Vilas-Boas J. P., et al. (2019). Effects of detraining in age-group swimmers performance, energetics and kinematics. J. Sports Sci. 37, 1490–1498. doi:10.1080/02640414.2019.1572434
Zamparo P., Capelli C., Zamparo P., Capelli C., Cautero M., Nino A. (2000). Energy cost of front-crawl swimming at supra-maximal speeds and underwater torque in young swimmers PhD project: the importance of oxygen extraction and blood volume for maximal oxygen uptake view project wetsuit in open water swimming: effects on perception, biomechanics, physiology and performance view project energy cost of front-crawl swimming at supra-maximal speeds and underwater torque in young swimmers. Artic. Eur. J. Appl. Physiol. 83, 487–491. doi:10.1007/s004210000318
Keywords: aerobic power, oxygen uptake, tethered swimming force, front crawl, maturity
Citation: Strzała M, Sokołowski K, Wądrzyk Ł, Staszkiewicz R, Kryst Ł, Żegleń M, Krężałek P and Maciejczyk M (2023) Oxygen uptake kinetics and biological age in relation to pulling force and 400-m front crawl performance in young swimmers. Front. Physiol. 14:1229007. doi: 10.3389/fphys.2023.1229007
Received: 25 May 2023; Accepted: 18 September 2023;
Published: 06 October 2023.
Edited by:
Monoem Haddad, Qatar University, QatarReviewed by:
Flávio De Souza Castro, Federal University of Rio Grande do Sul, BrazilDanilo Alexandre Massini, São Paulo State University, Brazil
Jesus J. Ruiz-Navarro, University of Granada, Spain
Copyright © 2023 Strzała, Sokołowski, Wądrzyk, Staszkiewicz, Kryst, Żegleń, Krężałek and Maciejczyk. This is an open-access article distributed under the terms of the Creative Commons Attribution License (CC BY). The use, distribution or reproduction in other forums is permitted, provided the original author(s) and the copyright owner(s) are credited and that the original publication in this journal is cited, in accordance with accepted academic practice. No use, distribution or reproduction is permitted which does not comply with these terms.
*Correspondence: Marek Strzała, bWFyZWsuc3RyemFsYUBhd2Yua3Jha293LnBs