 Tiago A. F. Almeida1,2,3
 Mário C. Espada3,4,5*
 Danilo A. Massini1,2
 Anderson G. Macedo1,2
 Eliane A. Castro1,2
 Cátia C. Ferreira4,6
 Joana F. Reis3,7
 Dalton M. Pessôa Filho1,2
- 1Graduate Programme in Human Development and Technology, São Paulo State University (UNESP), Rio Claro, Brazil
- 2Department of Physical Education, São Paulo State University (UNESP), Bauru, Brazil
- 3CIPER, Faculdade de Motricidade Humana, Universidade de Lisboa, Lisboa, Portugal
- 4Instituto Politécnico de Setúbal, Escola Superior de Educação, Setúbal, Portugal
- 5Life Quality Research Centre (LQRC—CIEQV, Leiria), Complexo Andaluz, Rio Maior, Portugal
- 6Research Group in Optimization of Training and Sport Performance (GOERD), Faculty of Sports Sciences, University of Extremadura, Cáceres, Spain
- 7Faculdade de Motricidade Humana, Universidade de Lisboa, Lisboa, Portugal
Purpose: This study aimed to evaluate the physiological responses associated with the stroke length (SL) and stroke rate (SR) changes as swimming velocity increases during an incremental step-test. Moreover, this study also aimed to verify if SL and SR relationships toward maximal oxygen uptake (V̇O2max), gas respiratory compensation point (RCP), exchange threshold (GET), and swimming cost can be applied to the management of endurance training and control aerobic pace.
Methods: A total of 19 swimmers performed the incremental test until volitional exhaustion, with each stage being designed by percentages of the 400 m (%v400) maximal front crawl velocity. V̇O2max, GET, RCP, and the respective swimming velocities (v) were examined. Also, the stroke parameters, SL, SR, the corresponding slopes (SLslope and SRslope), and the crossing point (Cp) between them were determined.
Results: GET and RCP corresponded to 70.6% and 82.4% of V̇O2max (4185.3 ± 686.1 mL min-1), and V̇O2 at Cp, SLslope, and SRslope were observed at 129.7%, 75.3%, and 61.7% of V̇O2max, respectively. The swimming cost from the expected V̇O2 at vSLslope (0.85 ± 0.18 kJ m-1), vSRslope (0.77 ± 0.17 kJ m-1), and vCp (1.09 ± 0.19 kJ m-1) showed correlations with GET (r = 0.73, 0.57, and 0.59, respectively), but only the cost at vSLslope and vCp correlated to RCP (0.62 and 0.69) and V̇O2max (0.70 and 0.79).
Conclusion: SL and SR exhibited a distinctive pattern for the V̇O2 response as swimming velocity increased. Furthermore, the influence of SL on GET, RCP, and V̇O2max suggests that SLslope serves as the metabolic reference of heavy exercise intensity, beyond which the stroke profile defines an exercise zone with high cost, which is recommended for an anaerobic threshold and aerobic power training. In turn, the observed difference between V̇O2 at SRslope and GET suggests that the range of velocities between SL and SR slopes ensures an economical pace, which might be recommended to develop long-term endurance. The results also highlighted that the swimming intensity paced at Cp would impose a high anaerobic demand, as it is located above the maximal aerobic velocity. Therefore, SLslope and SRslope are suitable indexes of submaximal to maximal aerobic paces, while Cp’s meaning still requires further evidence.
1 Introduction
Swimming is a sport that requires high technical proficiency, which, alongside the cost of swimming, is a factor that will decisively determine the training and competition performance (Wakayoshi et al., 1995; Silveira et al., 2019; Zacca et al., 2020). In training planning, it is important to incorporate the energetic balance that aligns with the specific race requirements when determining the duration of work intervals (Zamparo et al., 2005; Almeida et al., 2021), and swimming coaches should also assume that the time limit and maximal aerobic velocity (MAV) are influenced by stroking parameters (Wakayoshi et al., 1993; Almeida et al., 2022). In this sport, integrating precise measurements with less time-consuming or intrusive methods supports the ongoing exploration of applied exercise physiology in sports training (Espada et al., 2015; Zacca et al., 2019). This pursuit is driven by the recognition that performance improvement is intricately linked to the accurate identification of exercise intensity domains, thereby facilitating the optimization of daily training (Toussaint and Hollander, 1994; Nomura and Shimoyama, 2003; Espada et al., 2021).
Recently, Mezêncio et al. (2020) emphasized that in swimming, as a cyclic sport, the effectiveness of optimal limb coordination relies on its maintenance across consecutive stroke cycles. However, previous studies have demonstrated that inter-limb coordination in swimming is influenced by alterations of the stroke length (SL) and stroke rate (SR), with increasing swimming velocity and exhaustion (Alberty et al., 2005; Seifert et al., 2014). Indeed, if the upper limbs can contribute to approximately 85% of the propulsive force in swimming (Bartolomeu et al., 2018), the SL and SR relationship might be considered an index to analyze the coordination mode and the mechanical power output at a given velocity (Alberty et al., 2009; Ribeiro et al., 2017), thus also influencing energetic requirements (Barbosa et al., 2008). These were probably the reasons supporting the assumptions that swimmers dedicate much of their effort to increasing the propulsive force of the upper limbs (Crowley et al., 2017) and that SL and SR alterations with swimming velocity (v) progression were associated with aerobic pace indexes, such as physiological thresholds (Wakayoshi et al., 1993; Carvalho et al., 2020).
Despite the evidence, the question of whether SL and SR might be applied to plan and control aerobic training, as well as monitor the improvements in endurance ability, still requires further physiological characterization to determine which variable of exercise intensity should be parameterized to SL and SR and whether these stroke variables differ with regards to the influence on a given physiological response. For example, the peak of the SL response to increase in swimming velocity typically falls within the range of 65%–70% of the 200 m swimming performance, being better related to the lactate threshold (LT) than to the onset of blood lactate appearance (OBLA) (Nomura and Shimoyama, 2003). On the other hand, when SR increases above the critical values (e.g., above ∼50 strokes min-1), the spatial–temporal stroke coordination reaches the superposition mode (i.e., the propulsive phases of the two arms overlap) (Seifert et al., 2014). This adaptation not only increases propulsion but also requires an efficient technique to avoid the overdemand on the drag force, mechanical power, and energy output (Barbosa et al., 2008; Alberty et al., 2009; Ribeiro et al., 2017).
Indeed, SL and SR responses differed from moderate to heavy or severe swimming intensities with the downward and upward turn points, respectively, for SL and SR coinciding with the lactate turn point (i.e., lactate threshold) (Carvalho et al., 2020). Moreover, the decline in both propelling efficiency and swimming cost are also aligned with the reduced SL and increased SR values in swimming intensities reaching maximal aerobic and anaerobic paces (Barbosa et al., 2008; Ribeiro et al., 2017), which are circumstances related to ongoing fatigue development (Alberty et al., 2005). Consequently, analyzing SL and SR profiles can offer valuable insights into the physiological exercise domain, aiding in training management and assessing improvements in technical proficiency and contributing to achieving optimal performance.
However, studies relating to stroke, physiological parameters, and cost have postulated that swimming at maximum individual speed or under exhausting conditions requires a maximum frequency of strokes, imposing mechanical and physiological restrictions on the emergence of a stroke movement pattern that is operationally robust to accommodate the task requirements economically (Aujouannet et al., 2006; Alberty al., 2014). Therefore, competitive swimmers must associate the increase in the stroke rate with the improvement in propulsive efficiency to avoid velocity reduction since the cost (e.g., the ratio between oxygen costs and SR or velocity) relates to different indexes of maximal and submaximal aerobic paces (Wakayoshi et al., 1995; Ribeiro et al., 2017). On the contrary, SL should increase rather than SR to improve the swimming velocity with no additional demand on energy metabolism during the high-intensity swimming pace (Wakayoshi et al., 1993; Barbosa et al., 2008). Since studies have explored the relationships between stroke mechanics, energetics, and performance, the association of stroke mechanics toward the oxygen uptake (V̇O2) responses ranging from submaximal to maximal rates during swimming remains unstudied, despite its suitability for exercise intensity management.
The rationality of the current study is, therefore, to provide additional evidence on the association of SL and SR to the determinants of endurance performance (such as GET, RCP, V̇O2max, and swimming cost) and consequently offer feasible and reliable references for swimming training planning and pace strategies for different swimming races. Moreover, the association between stroke mechanics and exercise intensity indexes is expected to support the lack of physiological information about the role of SL and SR responses in managing swimming zones with tolerable and exhaustive metabolic profiles. Hence, during a maximal front-crawl progressive test, this study aims to verify how SL and SR profiles would relate to V̇O2 responses. Moreover, this study analyses the suitability of SL (SLslope), SR (SRslope), and the crossing point (Cp) to control the aerobic pace by locating these indexes into exercise zones and verifying the correlation level to the swimming velocity at GET, RCP, and V̇O2max. This study hypothesized that the SL and SR slopes (i.e., turn points) during an incremental exercise will demand different physiological responses, and when considering that the reduction of SL with the increasing exercise intensity is associated with the underwater faster hand velocity (Wakayoshi et al., 1995; Barbosa et al., 2008; Matthews et al., 2017), it will probably show more influence than SR on indexes of metabolically costly exercise intensities.
2 Materials and methods
2.1 Participants
In total, 19 well-trained male endurance swimmers (18.5 ± 5.6 years old, 66.3 ± 9.0 kg body weight, 176.1 ± 8.3 cm height, and 13.1% ± 4.0% body fat mass) with the best front crawl performances at the 50, 100, and 200 m representing 575 ± 95, 599 ± 100, and 588 ± 94 FINA points, respectively, participated in the study. All swimmers included in the study were actively participating in competitive training programs for a minimum of three consecutive annual seasons, with a mean swimming training volume of 25 km per week-1. The training was scheduled with 10.8% at very hard, 8.1% at hard, and 81.1% at light-to-moderate workload intensities. These intensity levels were determined based on exertion level zones and the thresholds for three blood lactate accumulation zones (Gonzalez-Rave et al., 2021).
Before participating in the research, all subjects and their respective guardians (when under 18 years old) provided informed consent by signing a consent form. The research conducted in this study was approved by the local University Ethical Committee in Human Research from São Paulo State University (UNESP-CAAE:02402512.7.0000.5398) in accordance with the principles outlined in the 1975 Declaration of Helsinki, ensuring the ethical considerations and standards for human research participants.
2.2 Study design
The swimmers performed an incremental step-test comprising five to eight 300 m stages with 30 s rest in between, until volitional exhaustion (i.e., stop before the stage end or unable to maintain the required pace) to evaluate V̇O2max, GET, and RCP. Participants were given instructions to refrain from engaging in intense training sessions and consuming beverages containing caffeine or alcohol for a minimum of 24 h prior to the experimental sessions.
2.3 Procedures
Based on the swimmers’ 400 m maximal front crawl velocity (v400 m), an incremental intermittent step-test was planned with seven stages of 300 m. The front crawl swimming velocity at the first stage was set at 70% of v400 m and progressed by 5% at each stage. The pace control during the steps was monitored by an experienced professional, who provided feedback to the swimmer every 50 m. The highest V̇O2 (averaged 9 s after a 3 s filter of the V̇O2 breath-by-breath data) achieved during the incremental step-test was considered to be V̇O2max. For V̇O2max confirmation, two criteria were considered: 1) a V̇O2 plateau phenomenon (variation <150 mL min-1) despite increments on intensity; 2) a respiratory exchange ratio (RER) above 1.10 (Poole et al., 2008).
During all tests, pulmonary gas sampling was collected through a portable breath-by-breath apparatus (K4b2, COSMED, Rome, Italy), coupled to the swimmer by a specific respiratory snorkel and valve system (Keskinen et al., 2003). Tests were conducted in the front crawl technique, using open turns, in a 50 m indoor swimming pool. GET and RCP were visually determined by two independent researchers through the analysis of VE·VCO2−1, VE·V̇O2−1, PETCO2, and PETO2 parameters. GET determination was considered to increase in VE·V̇O2−1 and PETO2, without a concomitant change in VE·V̇CO2−1 and PETCO2, respectively, and RCP was identified before the continuous increase in VE·V̇O2−1 and VE·VCO2−1 with a concomitant reduction in PETCO2 (Beaver et al., 1986). vGET, vRCP, and vV̇O2max were the corresponding velocities at the stage where each physiological response was observed.
SR, expressed in strokes per second (str·s-1), was calculated through the equation (SR = 60/stroke duration) (Craig and Pendergast, 1979), and SL, with the equation (SL = v/SR in m∙cycle−1). In order to adjust SL and SR (y) to v and V̇O2 (x) for each participant’s incremental step-test, a second-order polynomial function was applied. The determination of the slope (i.e., the turn point or the vertex of the function) after which the quadratic function starts to decrease (if a < 0, or the maximum SL) or increase (if a > 0, or the minimum SR) was assessed for the y (-D/4a, where D = b2 - 4ac), while the corresponding point for the x (-b/2a) assessed v and V̇O2 at each maximum SL or minimum SR (e.g., vSLslope, vSRslope, V̇O2SLslope, and V̇O2SRslope). v and V̇O2 at Cp (vCp and V̇O2Cp) were assessed by considering the intersection point between SL and SR adjustments to v and V̇O2. The best adjustments between V̇O2 (y) and v (x) were analyzed. The swimming cost was calculated at vSLslope, vSRslope, and vCp by applying the individual relationship between V̇O2 and v, considering the arbitrary caloric constant for V̇O2 (20.9 kJ), i.e., each 1 mlO2 is taken as equivalent to 20.9 J; therefore, each 1 W kg-1 is equivalent to 2.871 mlO2 kg-1 min-1 with the cost (in kJ m-1), considering the rate between kW and velocity (Massini et al., 2021).
2.4 Statistical analysis
The Shapiro–Wilk test tested the normality of data, which was expressed as mean ± standard deviation (M ± SD), and the variance described to the 95% confidence interval (95%CI). The mean values of V̇O2 and v corresponding to GET and RCP were contrasted to those of v and V̇O2, corresponding to SLslope, SRslope, and Cp using the ANOVA test (one-way, with LSD as post hoc analysis). The swimming cost at vSRslope, vSLslope, and vCp was correlated to vV̇O2max, vGET, and vRCP by Pearson`s coefficient, respectively, and values were interpreted as 0.90–1.00 [very strong], 0.70–0.89 [strong], 0.40–0.69 [moderate], 0.10–0.39 [weak], and 0.00–0.10 [negligible] (Schober et al., 2018). The post-test sample power was calculated using G*Power 3 software taking into account the results of Pearson’s coefficient, the actual sample size (N = 19), and the specified significance level (α = 0.05), following the methodology described by Faul et al. (2007). Data analysis was conducted using the Statistical Package for Social Sciences (SPSS 26.0, SPSS. Inc., Armonk, NY, United States).
3 Results
Figure 1 shows the adjustments in V̇O2 and stroke parameters as the swimming velocity progresses during the incremental step-test. The second-order polynomial relationships between SR and SL with v showed the higher coefficient of adjustments for each performance. Group adjustment reflects a trend for the increase of SR after 1.11 ± 0.18 m s-1 (95%CI: 1.03–1.19 m s-1) and the decrease of SL after 1.23 ± 0.13 m s-1 (95%CI: 1.17–1.29 m s-1), matching each other (Cp) at 1.66 ± 0.14 m s-1 (95%CI: 1.17–1.29 m s-1). Figure 1 shows the profiles across the swimming velocity progression of SR, SL, V̇O2, and swimming cost during an incremental step-test.
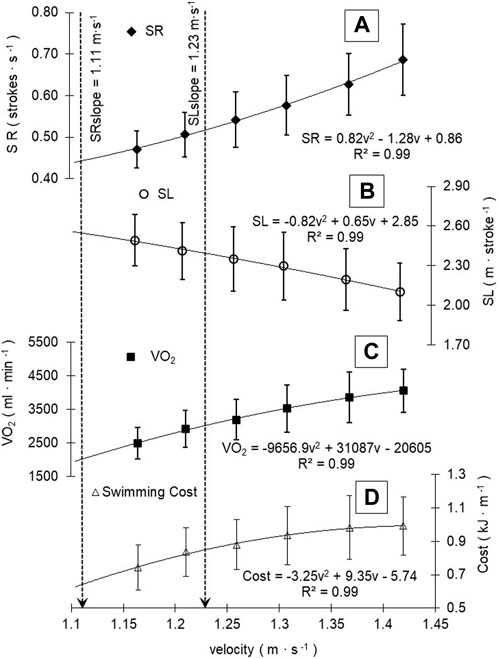
FIGURE 1. SR, SL, V̇O2, and swimming cost profiles (A, B, C, and D, respectively) during swimming velocity progression. Mean group and standard deviation values were plotted, and the best slope adjustments was depicted. Black dashed vertical lines are demarcating SL SR slopes during the increment of swimming velocity.
When related to the mean V̇O2 response to v increments, SL tends to decrease after 3141.9 ± 853.8 mL min-1 (95%CI: 2758.0–3525.8 mL min-1), SR increased after 2532.5 ± 674.0 mL min-1 (95%CI: 2229.4–2835.6 mL min-1), and project V̇O2 at Cp was 5415 ± 1208.2 mL min-1 (95%CI: 4871.7–5958.2 mL min-1). The peak of SL, after which it tends to decrease (2.34 ± 0.32 m∙cycle−1, 95%CI: 2.20–2.49 m∙cycle−1), occurred at different exercise domains and race paces, where SR begins to increase (0.51 ± 0.13 str·s-1, 95%CI: 0.45–0.56 str·s-1) (Figure 2, A, B, and C). From V̇O2max (4185.3 ± 686.1 mL min-1, 95%CI: 3876.8–4493.8 mL min-1) and vV̇O2max (1.42 ± 0.04 m s-1), V̇O2 and velocity at GET and RCP obtained 70.6% ± 9.4% (95%CI: 66.3%–74.8%) and 82.4% ± 9.2% (95%CI: 78.3%–86.6%) of V̇O2max and 84.6% ± 3.6% (95%CI: 83.0%–86.2%) and 91.9% ± 3.8% (95%CI: 90.1%–93.6%) of vV̇O2max, respectively (Figure 2). The relative values of vCp (116.9 ± 9.7 %vV̇O2max, 95%CI: 112.6%–121.3%) and V̇O2Cp (129.7 ± 20.2 %V̇O2max, 95%CI: 120.7%–138.8%) showed a tendency to demarcate a race pace above V̇O2max, whereas vSLslope (86.4 ± 8.9 %vV̇O2max, 95%CI: 82.4%–90.4%) and V̇O2SLslope (75.3 ± 15.4 %V̇O2max, 95%CI: 68.4%–82.2%) are demarcating a race pace between GET and RCP limits, and vSRslope (77.9 ± 12.1%vV̇O2max, 95%CI: 72.4%–83.3%) and V̇O2SRslope (61.7 ± 17.0%V̇O2max, 95%CI: 54.0%–69.3%) demarcated the swimming intensity below GET (Figure 2, A, B, and C).
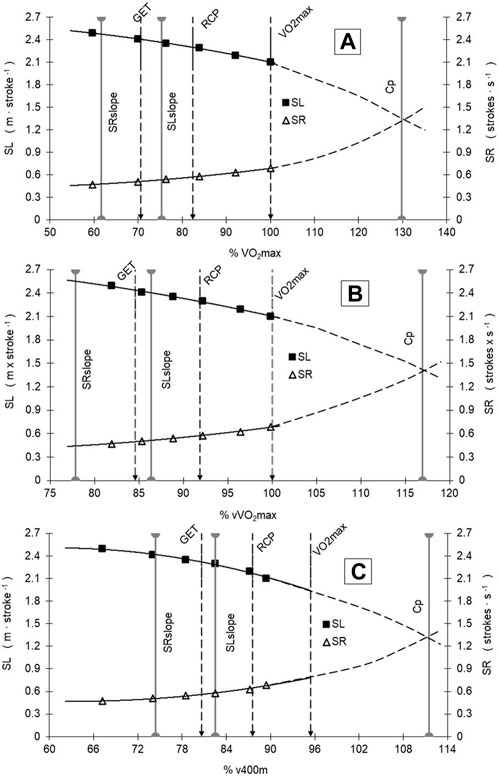
FIGURE 2. SR and SL vs. V̇O2 [in %V̇O2max and %vV̇O2max—Panels (A,B)] and %v400 m Panel (C) responses during the incremental test and swimming performance in the 400 m race. See text for further details. Gray solid vertical lines are demarcating SL and SR slopes and the Cp point.
The swimming cost calculated at vSLslope (0.89 ± 0.19 kJ∙m-1, 95%CI: 0.80–0.97), vSRslope (0.80 ± 0.18 kJ∙m-1, 95%CI: 0.72–0.88), and vCp (1.13 ± 0.20 kJ∙m-1, 95%CI: 1.04–1.22) evidenced significant correlations with GET (r = 0.73 [strong], 95%CI: 0.41–0.89, SP = 0.97; r = 0.57 [moderate], 95%CI: 0.16–0.82, SP = 0.76; and r = 0.60 [moderate], 95%CI: 0.20–0.83, SP = 0.80, respectively). Also, the swimming cost at vSLslope and vCp correlated with both RCP (r = 0.63 [moderate], 95%CI: 0.24–0.84, SP = 0.85; and r = 0.69 [moderate], 95%CI: 0.34–0.87, SP = 0.94, respectively) and VO2max (r = 0.70 [strong], 95%CI: 0.37–0.88, SP = 0.94; and r = 0.79 [strong], 95%CI: 0.53–0.92, SP = 0.99, respectively). Correlations to the velocity during the 400 m performance were observed for vCp, vGET, and vRCP (r = - 0.59 [moderate], 95%CI: −0.82—−0.19, SP = 0.80; r = 0.61 [moderate], 95%CI: 0.22–0.83, SP = 0.83; and r = 0.60 [moderate], 95%CI: 0.20–0.82, SP = 0.81, respectively).
Table 1 shows the percentages of GET, RCP, Cp, SLslope, and SRslope relative to vV̇O2max and V̇O2max. The percentage where SR tends to increase (SRslope) differs from the percentage where GET, RCP, Cp, and SLslope are located relative to vV̇O2max and V̇O2max.
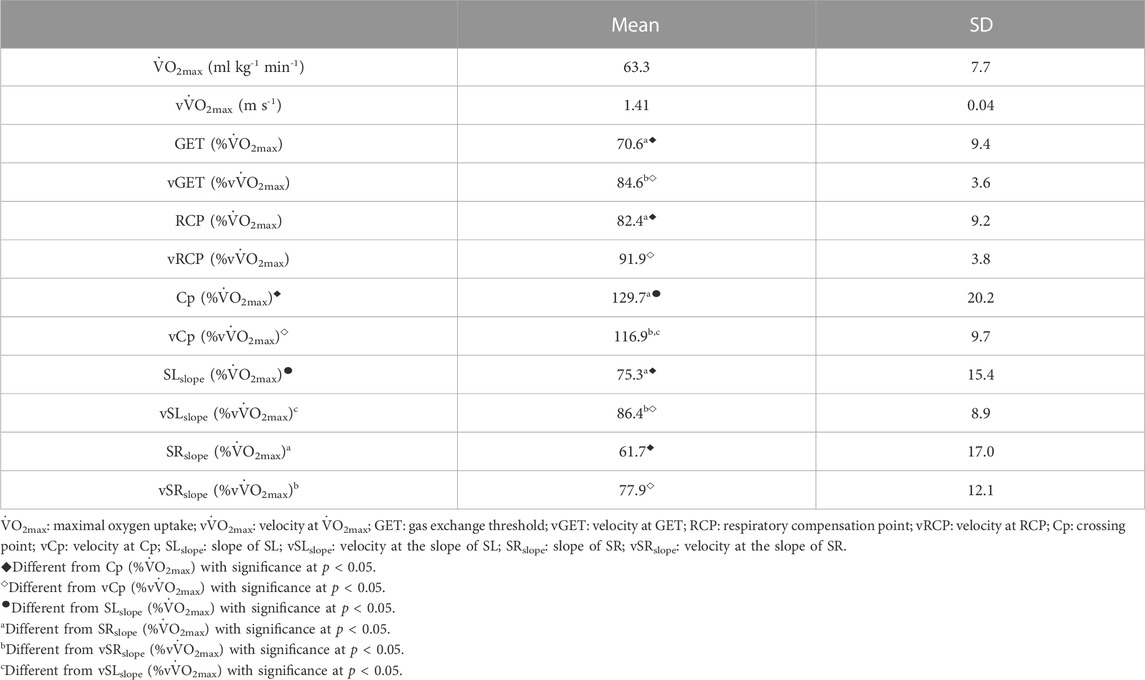
TABLE 1. Aerobic variables and swimming stroke profiles during the incremental step-test.
No differences were observed where SL tends to decrease (SLslope) with %vV̇O2max and %V̇O2 at GET, and %V̇O2 at RCP, but SLslope differed from %vV̇O2max and %V̇O2 at Cp. The results show that Cp localization at %vV̇O2max and %V̇O2max differed from all other physiological (GET and RCP) and stroke (SRslope, SLslope) references in the maximal incremental step-test.
4 Discussion
The current study investigated the association between SL and SR profiles with V̇O2 responses during an incremental test performed until exhaustion in front crawl swimming. The highlighted findings are as follows: i) SL and SR slopes did not demarcate similar %V̇O2max or %vV̇O2max responses; ii) while SR increases over moderate-to-heavy-exercise domains (i.e., through GET), the SL response tended to slightly decrease or remain unchanged at peak values; iii) the SL started to drop in the heavy-exercise domain (i.e., between GET and RPC), in which the slope is more costly than SRslope and is strongly correlated to GET, RCP, and V̇O2max; and iv) Cp (i.e., the projected point where the reduction in SL and the increase in SR crossed) suggests a swimming condition corresponding to supramaximal exercise intensities (e.g., above V̇O2max) and also correlated to GET, RCP, and V̇O2max. The observed second-order polynomial (quadratic function) relationships between SL and SR with the swimming velocity and V̇O2 response, as well as between cost and swimming velocity, are consistent with previous results (Seifert et al., 2007; Barbosa et al., 2008; Carvalho et al., 2020).
The increase of SR without impairing SL aligns with the statement that SR can increase proportionally to the velocity and energy demand, adjusting stroke mechanics, while maintaining an uncostly profile (Barbosa et al., 2008; Massini et al., 2021). Indeed, the current study observed that this increase in SR tends to occur before reaching the velocity or V̇O2 corresponding to GET despite the positive correlation between SR and GET. These findings partially support previous studies reporting similar locations and bivariate associations (Carvalho et al., 2020). Moreover, values previously reported as references for SL (2.46 ± 0.42 m∙str−1) and SR (0.48 ± 0.09 str∙s-1) slopes in competitive swimmers at a standard power output of 1000 W (±2.861 lO2∙min-1) (Toussaint and Hollander, 1994) closely resemble the values observed in the current study for SLslope, SRslope, and GET, although they are not aligned with each other, as suggested. This result strengthens the need to seek individual references for training planning and control since the misalignment between SLslope, SRslope, and GET suggests that a particular training zone for improving swimming economy exists between SRslope and SLslope, which falls somewhat below and above GET. This range is consistent with the exercise zone to improve endurance, i.e., z1–z2, according to González-Ravé et al. (2021).
In turn, when SL starts to drop, there is a critical demand for energetic releasing, which increases the swimming cost. Therefore, SLslope determines a costly adjustment in stroke mechanics that is interesting to be delayed since swimming intensity is reaching the boundary between the heavy- and severe-exercise domain (i.e., RCP, according to Pessôa Filho et al., 2012). This finding aligns with the reports that an increase in anaerobic contributions occurring as swimming intensity reaches heavy and severe exercise intensities (de Jesus et al., 2016; Carvalho et al., 2020) and an increased hydrodynamic drag (Seifert et al., 2014) are both factors contributing to SL and SR crossing trend. Moreover, the correlation of the swimming cost at SLslope with GET, RCP, and V̇O2max supports the statement delaying SL reduction can ensure and increase in SR (and, thus, swimming velocity) within exercise zones, where aerobic energy supply predominates (e.g., bellow GET) (Barbosa et al., 2008), In addition, delaying the drop in SL can improve tolerance during middle-distance performance (Alberty et al., 2009), as well as positively affect aerobic endurance and power (Wakayoshi et al., 1993). Hence, the current findings regarding V̇O2 responses at SLslope suggest that it demarcates an ideal exercise zone for the enhancement of both anaerobic threshold and aerobic power, which are physiological indexes that influence performance during 400, 800, and 1500 m races (Toussaint and Hollander, 1994).
The crossing point between SL and SR profiles was estimated as a mathematical projection in the current study. However, the cost at the Cp showed a similar correlation level with the physiological indexes of an aerobic incremental exercise (i.e., GET, RCP, and V̇O2max) as observed with the cost at SLslope. Although the meaning of these correlations differed from that discussed for SLslope, no previous reports support the meaning of Cp on the physiological response. Therefore, the current study observed that Cp relies on supramaximal exercise intensity (i.e., above 100%V̇O2max), more precisely at ∼130% and ∼117% of the V̇O2max and vV̇O2max, respectively, which correspond to exercise zones that are relevant to the 100 m race, and with high anaerobic (phosphagens and glycolytic) requirements for both sexes (Massini et al., 2021). Moreover, Cp was the only variable of stroke mechanics showing a correlation to v400 m.
Indeed, Cp can be interpreted as the point at which SL and SR show the same values; thus, Cp is probably coincident with the point where the propelling phases of both arms are superimposed. In addition, this point of arm coordination can be observed either during sprint performance in 100 m (Seifert et al., 2007) or in overcoming mechanical power declining due to exhaustion during the 400 m race (Alberty et al., 2009). Therefore, the current study speculates that the increase of Cp might be associated with the ability to increase SR, while SL decreases slowly, positively affecting both velocity development and tolerance during short- and middle-distance races, respectively. Moreover, the correlation of the cost at Cp with GET, RCP, and V̇O2max also indicates that this ability is present among swimmers with high aerobic contributions during submaximal and maximal swimming intensities. In other words, it suggests reduced anaerobic glycolysis activation and delayed acid–base disturbance at faster submaximal and maximal velocities (Troup, 1986; Toussaint Hollander, 1994; Wakayoshi et al., 1995; Pessôa-Filho et al., 2017; Almeida et al., 2020).
The current study presents some limitations concerning the control of the maturational stage of the swimmers since body growth and different anthropometric dimensions can influence stroke mechanics (Alves et al., 2022), as different height and arm spam seem to be positively correlated with SL but not with SR (Tijani et al., 2019). Another limitation is the swimming cost estimate without considering the contribution of anaerobic sources during swimming intensities above RCP, which should increase the cost (Pessôa Filho et al., 2017), and, therefore, be considered in future studies. Additionally, the role of blood lactate levels could be addressed in future studies, as it might provide physiological information about the meaning of Cp.
5 Conclusion
The findings suggest that SLslope and SRslope showed independent profiles from each other when compared with the V̇O2 response and velocity increments. In addition, the swimming cost at SLslope correlated to GET, RCP, and V̇O2max, while SRslope correlated only with GET. This association suggests that the range of swimming velocities from SRslope to SLslope (i.e., slightly below or just above GET) forms an economical zone (i.e., moderate aerobic pace recommended to improve long-term endurance ability). On the other hand, SLslope might be considered the metabolic reference aforementioned in which the aerobic pace demands a costly stroke profile. Therefore, swimming at such heavy to severe intensities (i.e., close to or above RCP) should be suitable to enhance the anaerobic threshold and aerobic power. Finally, considering that Cp is located at supramaximal swimming intensity (i.e., higher than the velocity or V̇O2 at maximal aerobic power), it probably relies on the range of exercise intensities with limited aerobic contribution, hence suggesting a swimming pace with a high demand upon anaerobic energy sources. However, improvements in Cp might be associated with enhanced aerobic energy contribution during submaximal and maximal swimming intensities.
Data availability statement
The raw data supporting the conclusion of this article will be made available by the authors, without undue reservation.
Ethics statement
The studies involving humans were approved by the Ethical Committee in Human Research from São Paulo State University. The studies were conducted in accordance with the local legislation and institutional requirements. Written informed consent for participation in this study was provided by the participants’ legal guardians/next of kin.
Author contributions
Conceptualization: TA, DM, AM, and DMPF; methodology: TA, ME, DM, AM, EC, CF, and DMPF; formal analysis: TA, DM, AM, and DMPF; investigation: TA, DM, AM, and DMPF; supervision: TA, DM, AM, and DMPF; data curation: TA, ME, DM, AM, EC, CF, and DMPF; writing—original draft preparation: TA, ME, CF, JR, and DMPF; writing—review and editing: TA, EC, ME, CF, JR, and DMPF; visualization: TA, ME, DM, AM, EC, CF, JR, and DMPF; and funding acquisition: TA, ME, CF, and DMPF. All authors contributed to the article and approved the submitted version.
Funding
The authors would like to acknowledge the São Paulo Research Foundation (FAPESP) (PROCESS 2016/04544-3) and Coordenação de Aperfeiçoamento de Pessoal de Nível Superior, Brazil (CAPES—Finance Code 001), for the partial financial support. The collaboration of TA and EC was possible thanks to the scholarships granted under CAPES in the scope of the Program CAPES-PrInt, process number 88887.310463/2018-00, Mobility number 88887.580265/2020-00, and International Cooperation Project number 88887.572557/2020-00. This research was also funded by the Foundation for Science and Technology, I.P., Grant/Award Number UIDB/04748/2020, and Instituto Politécnico de Setúbal.
Acknowledgments
The authors would like to express their gratitude to the swimmers for their time and effort during the study.
Conflict of interest
The authors declare that the research was conducted in the absence of any commercial or financial relationships that could be construed as a potential conflict of interest.
Publisher’s note
All claims expressed in this article are solely those of the authors and do not necessarily represent those of their affiliated organizations, or those of the publisher, the editors, and the reviewers. Any product that may be evaluated in this article, or claim that may be made by its manufacturer, is not guaranteed or endorsed by the publisher.
References
Alberty, M., Sidney, M., Huot-Marchand, F., Hespel, J., and Pelayo, P. (2005). Intracyclic velocity variations and arm coordination during exhaustive exercise in front crawl stroke. Int. J. Sports Med. 26 (6), 471–475. doi:10.1055/s-2004-821110
Alberty, M., Sidney, M., Pelayo, P., and Toussaint, H. M. (2009). Stroking characteristics during time to exhaustion tests. Med. Sci. Sports Exerc 41 (3), 637–644. doi:10.1249/MSS.0b013e31818acfba
Almeida, T. A. F., Massini, D. A., Silva Júnior, O. T., Venditti Júnior, R., Espada, M. A. C., Macedo, A. G., et al. (2022). Time limit and VO2 kinetics at maximal aerobic velocity: continuous vs. intermittent swimming trials. Front. Physiol. 13, 982874. doi:10.3389/fphys.2022.982874
Almeida, T. A. F., Pessôa Filho, D. M., Espada, M. A. C., Reis, J. F., Simionato, A. R., Siqueira, L. O. C., et al. (2020). VO2 kinetics and energy contribution in simulated maximal performance during short and middle distance-trials in swimming. Eur. J. Appl. Physiol. 120 (5), 1097–1109. doi:10.1007/s00421-020-04348-y
Almeida, T. A. F., Pessôa Filho, D. M., Espada, M. C., Reis, J. F., Sancassani, A., Massini, D. A., et al. (2021). Physiological responses during high-intensity interval training in young swimmers. Front. Physiol. 12, 662029. doi:10.3389/fphys.2021.662029
Alves, M., Carvalho, D. D., Fernandes, R. J., and Vilas-Boas, J. P. (2022). How anthropometrics of young and adolescent swimmers influence stroking parameters and performance? A systematic review. Int. J. Environ. Res. Public Health. 19 (5), 2543. doi:10.3390/ijerph19052543
Aujouannet, Y. A., Bonifazi, M., Hintzy, F., Vuillerme, N., and Rouard, A. H. (2006). Effects of a high-intensity swim test on kinematic parameters in high-level athletes. Appl Physiol Nut Metabol 31 (2), 150–158. doi:10.1139/H05-012
Barbosa, T. M., Fernandes, R. J., Keskinen, K. L., and Vilas-Boas, J. P. (2008). The influence of stroke mechanics into energy cost of elite swimmers. Eur. J. Appl. Physiol. 103, 139–149. doi:10.1007/s00421-008-0676-z
Bartolomeu, R. F., Costa, M. J., and Barbosa, T. M. (2018). Contribution of limbs’ actions to the four competitive swimming strokes: A nonlinear approach. J. Sports Sci. 36 (16), 1836–1845. doi:10.1080/02640414.2018.1423608
Beaver, W. L., Wasserman, K. M., and Whipp, B. (1986). A new method for detecting anaerobic threshold by gas exchange. J. Appl. Physiol. 60 (6), 2020–2027. doi:10.1152/jappl.1986.60.6.2020
Billat, V. L., and Koralsztein, J. P. (1996). Significance of the velocity at VO2max and time to exhaustion at this velocity. Sports Med. 22 (2), 90–108. doi:10.2165/00007256-199622020-00004
Carvalho, D. D., Soares, S., Zacca, R., Sousa, J., Marinho, D. A., Silva, A. J., et al. (2020). Anaerobic threshold biophysical characterisation of the four swimming techniques. Int. J. Sports Med. 41 (05), 318–327. doi:10.1055/a-0975-9532
Craig, A., and Pendergast, D. (1979). Relationships of stroke rate, distance per stroke, and velocity in competitive swimming. Med. Sci. Sports 11, 278–283. doi:10.1249/00005768-197901130-00011
Crowley, E., Harrison, A. J., and Lyons, M. (2017). The impact of resistance training on swimming performance: A systematic review. Sports Med. 47 (11), 2285–2307. doi:10.1007/s40279-017-0730-2
de Jesus, K., Sanders, R., de Jesus, K., Ribeiro, J., Figueiredo, P., Vilas-Boas, J. P., et al. (2016). The effect of intensity on 3-dimensional kinematics and coordination in front-crawl swimming. Int. J. Sports Physiol. Perform. 11 (6), 768–775. doi:10.1123/ijspp.2015-0465
Espada, M. C., Alves, F. B., Curto, D., Ferreira, C. C., Santos, F. J., Pessôa-Filho, D. M., et al. (2021). Can an incremental step test be used for maximal lactate steady state determination in swimming? Clues for practice. Int. J. Environ. Res. Public Health. 18 (2), 477. doi:10.3390/ijerph18020477
Espada, M. C., Reis, J. F., Almeida, T. F., Bruno, P. M., Vleck, V. E., and Alves, F. B. (2015). Ventilatory and physiological responses in swimmers below and above their maximal lactate steady state. J. Strength Cond. Res. 29 (10), 2836–2843. doi:10.1519/JSC.0000000000000504
Faul, F., Erdfelder, E., Lang, A. G., and Buchner, A. (2007). G*Power 3: A flexible statistical power analysis program for the social, behavioral, and biomedical sciences. Behav. Res. Methods. 39, 175–191. doi:10.3758/bf03193146
Gonzalez-Rave, J. M., Hermosilla, F., Gonzalez-Mohino, F., Casado, A., and Pyne, D. B. (2021). Training intensity distribution, training volume, and periodization models in elite swimmers: A systematic review. Int. J. Sports. Physiol. Perform. 16, 913–926. doi:10.1123/ijspp.2020-0906
Keskinen, K. L., Rodríguez, F. A., and Kerskinen, O. P. (2003). Respiratory snorkel and valve system for breath-by-breath gas analysis in swimming. Scand. J. Med. Sci. Sports. 13 (5), 322–329. doi:10.1034/j.1600-0838.2003.00319.x
Massini, D. A., Almeida, T. A. F., Vasconcelos, C. M. T., Macedo, A. G., Espada, M. A. C., Reis, J. F., et al. (2021). Are young swimmers short and middle distances energy cost sex-specific? Front. Physiol. 14 (12), 796886. doi:10.3389/fphys.2021.796886
Matthews, M. J., Green, D., Matthews, H., and Swanwick, E. (2017). The effects of swimming fatigue on shoulder strength, range of motion, joint control, and performance in swimmers. Phys. Ther. Sport. 23, 118–122. doi:10.1016/j.ptsp.2016.08.011
Mezêncio, B., Pinho, J. P., Huebner, R., Vilas-Boas, J. P., Amadio, A. C., and Serrão, J. C. (2020). Overall indexes of coordination in front crawl swimming. J. Sports Sci. 38 (8), 910–917. doi:10.1080/02640414.2020.1737349
Nomura, T., and Shimoyama, Y. (2003). “The relationship between stroke parameters and physiological responses at the various swim speeds,” in Biomechanics and medicine in swimming IX. J-C. Chatard (Saint-Etienne, 355–360.
Pessôa Filho, D. M., Alves, F. B., Reis, J. F., Greco, C. C., and Denadai, B. S. (2012). VO2 kinetics during heavy and severe exercise in swimming. Int. J. Sports Med. 33, 744–748. doi:10.1055/s-0031-1299753
Pessôa Filho, D. M., Siqueira, L. O. C., Simionato, A. R., Espada, M. A. C., Pestana, D. S., and DiMenna, F. J. (2017). A rapidly-incremented tethered-swimming test for defining domain-specific training zones. J. Hum. Kinet. 57, 117–128. doi:10.1515/hukin-2017-0053
Poole, C. P., Wilkerson, D. P., and Jones, A. M. (2008). Validity of criteria for establishing maximal O2 uptake during ramp exercise tests. Eur. J. Appl. Physiol. 102 (4), 403–410. doi:10.1007/s00421-007-0596-3
Ribeiro, J., Toubekis, A. G., Figueiredo, P., de Jesus, K., Toussaint, H. M., Alves, F., et al. (2017). Biophysical determinants of front-crawl swimming at moderate and severe intensities. Int. J. Sports Physiol. Perform. 12 (2), 241–246. doi:10.1123/ijspp.2015-0766
Schober, P., Boer, C., and Schwarte, L. A. (2018). Correlation coefficients: appropriate use and interpretation. Anesth. Analg. 126 (5), 1763–1768. doi:10.1213/ANE.0000000000002864
Seifert, L., Chollet, D., and Chatard, J. C. (2007). Kinematic changes during a 100-m front crawl: effects of performance level and gender. Med. Sci. Sports Exerc. 39 (10), 1784–1793. doi:10.1249/mss.0b013e3180f62f38
Seifert, L., Komar, J., Crettenand, F., Dadashi, F., Aminian, K., and Millet, G. P. (2014). Inter-limb coordination and energy cost in swimming. J. Sci. Med. Sport 17 (4), 439–444. doi:10.1016/j.jsams.2013.07.003
Silveira, R., Soares, S. M., Zacca, R., Alves, F. B., Fernandes, R. J., de Souza Castro, F. A., et al. (2019). A biophysical analysis on the arm stroke efficiency in front crawl swimming: comparing methods and determining the main performance predictors. Int. J. Environ. Res. Public Health. 16 (23), 4715. doi:10.3390/ijerph16234715
Tijani, J. M., Zouhal, H., Rhibi, F., Hackney, A. C., Ben Ounis, O., Saidi, K., et al. (2019). Relationship between anthropometry and stroking parameters of front crawl sprint performance in young swimmers. Med. Sport. 72, 355–365. doi:10.23736/S0025-7826.19.03427-6
Toussaint, H. M., and Hollander, A. P. (1994). Energetics of competitive swimming. Implications for training programmes. Sports Med. 18, 384–405. doi:10.2165/00007256-199418060-00004)
Wakayoshi, K., D’Acquisto, L. J., Cappaert, J. M., and Troup, J. P. (1995). Relationship between oxygen uptake, stroke rate and swimming velocity in competitive swimming. Int. J. Sports Med. 16 (1), 19–23. doi:10.1055/s-2007-972957
Wakayoshi, K., Yoshida, T., Ikuta, Y., Mutoh, Y., and Miyashita, M. (1993). Adaptations to six months of aerobic swim training: changes in velocity, stroke rate, stroke length and blood lactate. Int. J. Sports Med. 14 (7), 368–372. doi:10.1055/s-2007-1021194
Ward-Smith, A. J. (1999). The bioenergetics of optimal performances in middle-distance and long-distance track running. J. Biomech. 32 (5), 461–465. doi:10.1016/S0021-9290(99)00029-9
Zacca, R., Azevedo, R., Ramos, V. R., Abraldes, J. A., Vilas-Boas, J. P., Castro, F. A. S., et al. (2020). Biophysical follow-up of age-group swimmers during a traditional three-peak preparation program. J. Strength Cond. Res. 34 (9), 2585–2595. doi:10.1519/JSC.0000000000002964
Zacca, R., Toubekis, A., Freitas, L., Silva, A. F., Azevedo, R., Vilas-Boas, J. P., et al. (2019). Effects of detraining in age-group swimmers performance, energetics and kinematics. J. Sports Sci. 37 (13), 1490–1498. doi:10.1080/02640414.2019.1572434
Keywords: stroke mechanics, oxygen uptake, aerobic conditioning, exercise zones, swimming
Citation: Almeida TAF, Espada MC, Massini DA, Macedo AG, Castro EA, Ferreira CC, Reis JF and Pessôa Filho DM (2023) Stroke and physiological relationships during the incremental front crawl test: outcomes for planning and pacing aerobic training. Front. Physiol. 14:1241948. doi: 10.3389/fphys.2023.1241948
Received: 17 June 2023; Accepted: 31 July 2023;
Published: 14 August 2023.
Edited by:
Sabrina Demarie, Foro Italico University of Rome, ItalyReviewed by:
Athanasios A. Dalamitros, Aristotle University, GreeceFlávio De Souza Castro, Federal University of Rio Grande do Sul, Brazil
Argyris G Toubekis, National and Kapodistrian University of Athens, Greece
Copyright © 2023 Almeida, Espada, Massini, Macedo, Castro, Ferreira, Reis and Pessôa Filho. This is an open-access article distributed under the terms of the Creative Commons Attribution License (CC BY). The use, distribution or reproduction in other forums is permitted, provided the original author(s) and the copyright owner(s) are credited and that the original publication in this journal is cited, in accordance with accepted academic practice. No use, distribution or reproduction is permitted which does not comply with these terms.
*Correspondence: Mário C. Espada, bWFyaW8uZXNwYWRhQGVzZS5pcHMucHQ=