 Hiroyasu Hatakeyama
 Tomomi Oshima
 Shinichiro Ono
 Yuichi Morimoto
 Noriko Takahashi
- 1Department of Physiology, Kitasato University School of Medicine, Sagamihara, Kanagawa, Japan
- 2International Research Center for Neurointelligence (WPI-IRCN), The University of Tokyo Institute for Advanced Study (UTIAS), The University of Tokyo, Bunkyo-ku, Tokyo, Japan
- 3Laboratory of Structural Physiology, Center for Disease Biology and Integrative Medicine, Faculty of Medicine, The University of Tokyo, Bunkyo-ku, Tokyo, Japan
Introduction: Mobilization of intracellular insulin granules to the plasma membrane plays a crucial role in regulating insulin secretion. However, the regulatory mechanisms of this mobilization process have been poorly understood due to technical limitations. In this study, we propose a convenient approach for assessing intracellular insulin granule behavior based on single-molecule analysis of insulin granule membrane proteins labeled with Quantum dot fluorescent nanocrystals.
Methods: This approach allows us to analyze intracellular insulin granule movement with subpixel accuracy at 33 fps. We tracked two insulin granule membrane proteins, phogrin and zinc transporter 8, fused to HaloTag in rat insulinoma INS-1 cells and, by evaluating the tracks with mean-square displacement, demonstrated the characteristic behavior of insulin granules.
Results and discussion: Pharmacological perturbations of microtubules and F-actin affected insulin granule behavior on distinct modalities. Specifically, microtubule dynamics and F-actin positively and negatively regulate insulin granule behavior, respectively, presumably by modulating each different behavioral mode. Furthermore, we observed impaired insulin granule behavior and cytoskeletal architecture under chronic treatment of high concentrations of glucose and palmitate. Our approach provides detailed information regarding intracellular insulin granule mobilization and its pathophysiological implications. This study sheds new light on the regulatory mechanisms of intracellular insulin granule mobilization and has important implications for understanding the pathogenesis of diabetes.
1 Introduction
Insulin secretion from pancreatic β-cells plays an important role in glucose homeostasis, and dysregulation of this process is directly involved in the etiology of diabetes (Kahn, 2001; Seino et al., 2011). In β-cells, insulin is stored in secretory granules during biogenesis. These granules undergo mobilization to and fuse with the plasma membrane in response to stimuli, such as high glucose, followed by exocytosis to the extracellular space (Orci et al., 1973; Rorsman and Rentröm, 2003). Our previous studies using two-photon excitation imaging of insulin granule exocytotic events in β-cells with extracellular polar-tracers demonstrated the occurrence of full flattening with the plasma membrane (full fusion exocytosis) with minor contributions from kiss-and-run exocytosis (∼6%) and sequential exocytosis (∼10%) (Takahashi et al., 2004; Hatakeyama et al., 2006), suggesting an important role for the mobilization of secretory granules in regulating insulin secretion. Therefore, the precise examination of insulin granule mobilization is critical for understanding the regulatory mechanisms involved in insulin secretion.
Several live-cell imaging techniques have been used to evaluate mobilization processes prior to exocytosis, such as the dynamic movement of insulin secretory granules (Pouli et al., 1998; Ivarsson et al., 2004; Tabei et al., 2013; Heaslip et al., 2014; Hoboth et al., 2015; Ferri et al., 2019; 2021). Specifically, total internal reflection fluorescence (TIRF) microscopy has made a major contribution to unveiling such dynamics including the dependence of cytoskeletal elements on the granule movement (Heaslip et al., 2014). This approach can detect the movement of individual insulin granules with a high signal-to-noise ratio and at high temporal resolution; however, it can only capture events that occur just beneath the plasma membrane, within approximately 100 nm inside the cell–coverslip interface. However, a significant portion of insulin granules also reside deeper inside cells beyond the TIRF zone (several micrometers from the plasma membrane) (Müller et al., 2020), insulin granule dynamics within such regions is thought to be also an important process for regulating insulin secretion. Indeed, insulin granule movement inside cells has also been evaluated using confocal microscopy combined with single-particle tracking techniques (Ivarsson et al., 2004; Tabei et al., 2013); however, such analyses employing conventional fluorescent molecules have limited temporal resolution. Furthermore, it is difficult to precisely track individual secretory granule movements with these approaches because the dense fluorescent signals resulting from the visualization of all fluorescent molecules makes it difficult to resolve individual granules. Recently, an approach based on image correlation spectroscopy for analyzing the dynamics of insulin granules without tracking individual granules has been demonstrated (Ferri et al., 2019; 2021). This approach is very useful for understanding the ensemble behavior of insulin granules in cells because it can extract structural and dynamic properties directly from images without single-particle techniques. Therefore, single-molecule analysis of insulin granules beyond the TIRF zone will advance a comprehensive understanding of insulin granule dynamics by combining of these techniques. We previously developed a simple, convenient, and nontoxic method for labeling intracellular molecules with fluorescent semiconductor nanoparticle Quantum dots (QDs) using HaloTag technology and electroporation and applied this method to the analysis of the intracellular behavior of myosin proteins (Hatakeyama et al., 2017). QDs are a suitable tool for single-particle tracking because of their extremely bright, single molecule fluorescence and high photostability. Our approach enables an expansion of the repertoire of proteins for which intracellular dynamics can be analyzed for single molecules, and insulin granules are an ideal example. Therefore, in the present study, we analyzed intracellular behavior of insulin granules by labeling insulin granule membrane proteins with QDs in INS-1 cells that exhibit glucose-responsive insulin secretion (Asfari et al., 1992) to analyze the role of cytoskeletal elements and their pathophysiological relevance.
2 Results
2.1 Labeling and tracking of intracellular insulin granules with QDs
To track intracellular insulin granules with QDs, we selected to target the insulin granule membrane proteins, phogrin (Wasmeier and Hutton, 1996) and ZnT8 (Chimienti et al., 2004), as labeling molecules. Direct labeling of insulin itself with QDs would be very difficult, because it is necessary to penetrate the insulin granule membrane. Therefore, we incorporated HaloTag-enhanced green fluorescent protein (EGFP) into these membrane proteins at their cytoplasmic tail and expressed the fusion proteins in rat insulinoma INS-1 cells (Figure 1A). By staining these fusion proteins with HaloTag TMR ligand, localization of the proteins in mildly expressing cells was observed on punctate granule-like structures within the cytoplasm of the cells, which was completely different from that of control HaloTag that display diffuse signals throughout the cells (Supplementary Figure S1A). Such granule-like localization is quite similar to that of the insulin-HaloTag, and their diameters as measured by full width at half maximum were also similar among the proteins (Supplementary Figure S1B), the values of which were comparable to those obtained by previous electron microscopic investigations of insulin granules (Dean, 1973; Olofsson et al., 2002; Müller et al., 2020). Furthermore, many of such granule-like structures colocalized with insulin (Supplementary Figure S1C), showing that insulin granules can be tracked by tracking of these HaloTag proteins. Some structures apparently contain only one signal due to faint fluorescent signals (Supplementary Figure S1C, upper right). However, since we cannot completely rule out the possibility that some of the signals may represent non-colocalized phogrin/ZnT8 with insulin granules, we basically tracked the behavior of the two proteins for all types of experiments. No significant differences in behavior among insulin-HaloTag, phogrin-HaloTag, or ZnT8-HaloTag were observed (Supplementary Figure S1D). By electroporating QD-conjugated HaloTag ligands into the cells, we observed sparse bright spots of QD fluorescence (Figure 1B) as in our previous study (Hatakeyama et al., 2017). Blinking of most of the QD signals occurred in single steps (Figure 1C), indicating that most of the observed signals were derived from just one QD. QD fluorescence was collected for 30 s at 33 frames/s in EGFP-positive cells and analyzed the movement with sub-pixel accuracy (Figure 1D, Supplementary Movie S1). Movements varied from signal-to-signal, with some being mobile (Figure 1D, upper), whereas others stayed essentially in one position (Figure 1D, lower). To quantitatively analyze these movements, we calculated mean-square displacement (MSD) values for individual signals (Figure 1E), followed by evaluation with two scaling factors that were estimated from the MSD values, i.e., diffusion coefficient
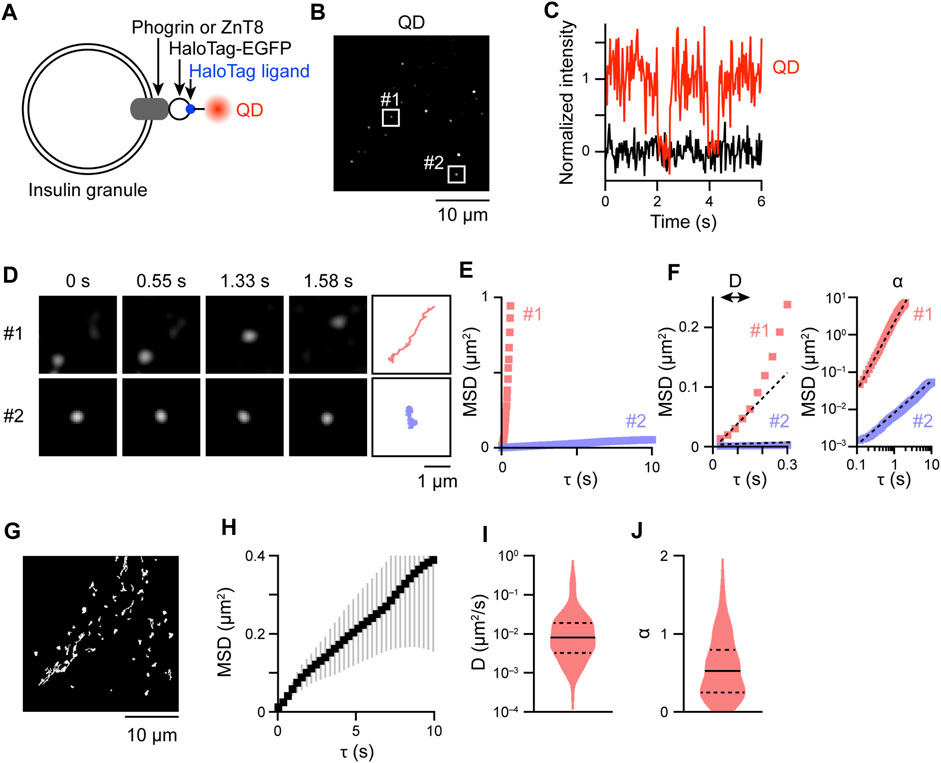
FIGURE 1. QD-labeling and tracking of insulin granules. (A) Schema for QD-labeling of insulin granule membrane proteins. (B) Snapshot of QD fluorescence in an INS-1 cell expressing HaloTag-ZnT8. The Laplacian of the Gaussian-filtered image. (C) Example of a QD fluorescence blinking event (red). The intensity in adjacent regions without QDs is also shown as background (black). (D) Changes in the position of QD signals in the boxed regions of (B); fast- (#1) and slow-moving (#2) signals were selected. Trajectories of the particles are also shown at the far right. (E) MSD curves derived from the trajectories in (D). (F) MSD curves with portions enlarged (τ ≤ 0.3 s) (left) or plotted on a log–log axis (right). Dashed lines represent the linear regression with Eq. 2 (left) and Eq. 3 (right). Based on the regression curves,
The behavior of phogrin-HaloTag and ZnT8-HaloTag was almost the same (Figure 2A). Unexpectedly, the mobility of the control HaloTag was obviously smaller than that of phogrin-HaloTag and ZnT8-HaloTag despite smaller molecular weight of the control HaloTag (Figure 2A). Detailed analysis with
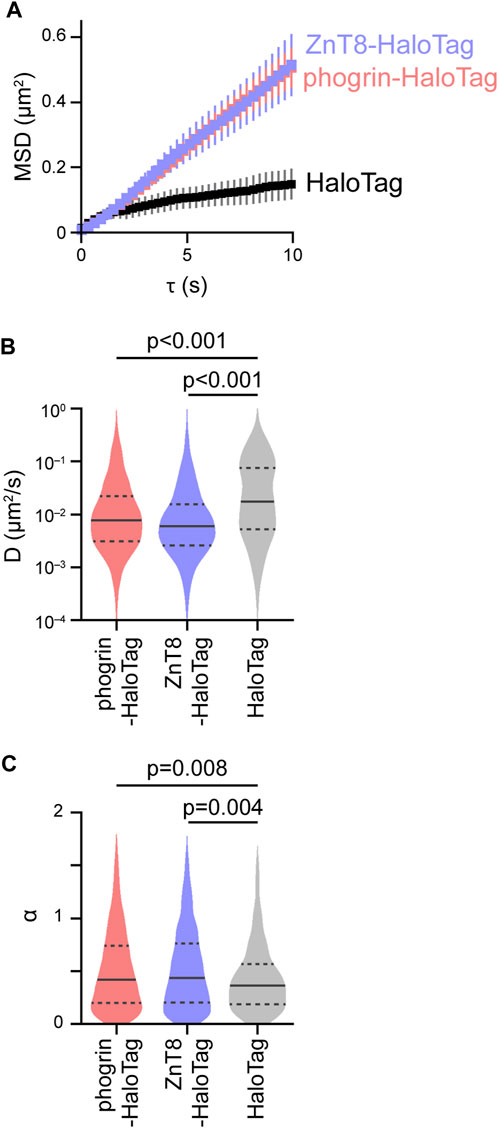
FIGURE 2. Evaluation of the intracellular movement of insulin granules. (A) Mean MSD curves in cells expressing control HaloTag (black), phogrin-HaloTag (red), and ZnT8-HaloTag (blue). Error bars represent SEM (n = 4-5 cells, 428–917 particles). (B,C) Violin plots of log D and α. Statistical significance was assessed as described in the Methods section.
2.2 Cytoskeletal dependence of insulin granule movements
Cytoskeletal elements such as microtubules and F-actin play an important role in regulating trafficking and exocytosis of secretory granules containing peptide hormones including insulin. As an application of our single-particle analysis of insulin granule behavior, we investigated the role of cytoskeletal elements on the intracellular behavior of insulin granules by acute disturbance of microtubules and F-actin with pharmacological inhibitors. Destabilization of microtubules with nocodazole resulted in a marked suppression of both phogrin-HaloTag and ZnT8-HaloTag movements (Figures 3A, B). Nocodazole treatment significantly decreased
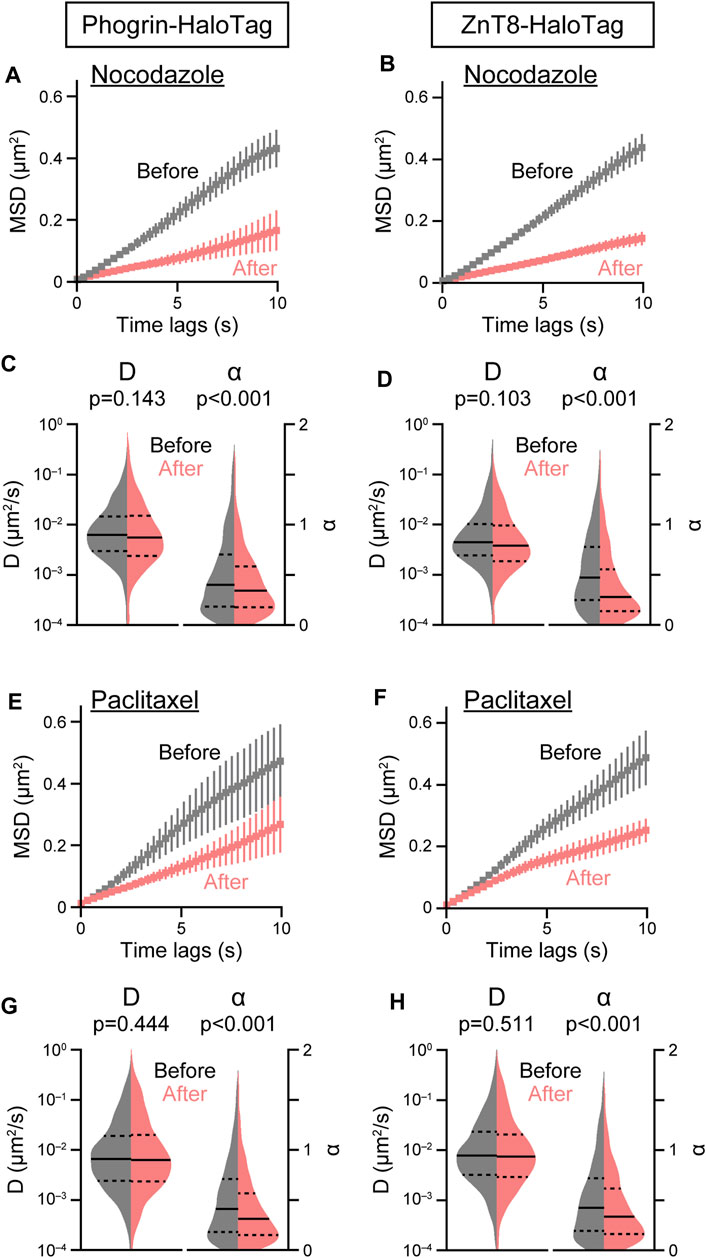
FIGURE 3. Effect of microtubule inhibitors on insulin granule movement. Effect of nocodazole (3 μM, (A–D) or paclitaxel (5 μM, (E–H) on mean MSD curves (A,B,E,F) and violin plots of D and α (C,D,G,H) in cells expressing phogrin-HaloTag (left) or ZnT8-HaloTag (right) before (gray) and 10 min after (red) treatment. Data with error bars are the mean ± SEM (n = 5–7 cells, 565–1,368 particles). Statistical significance was assessed as described in the Methods section.
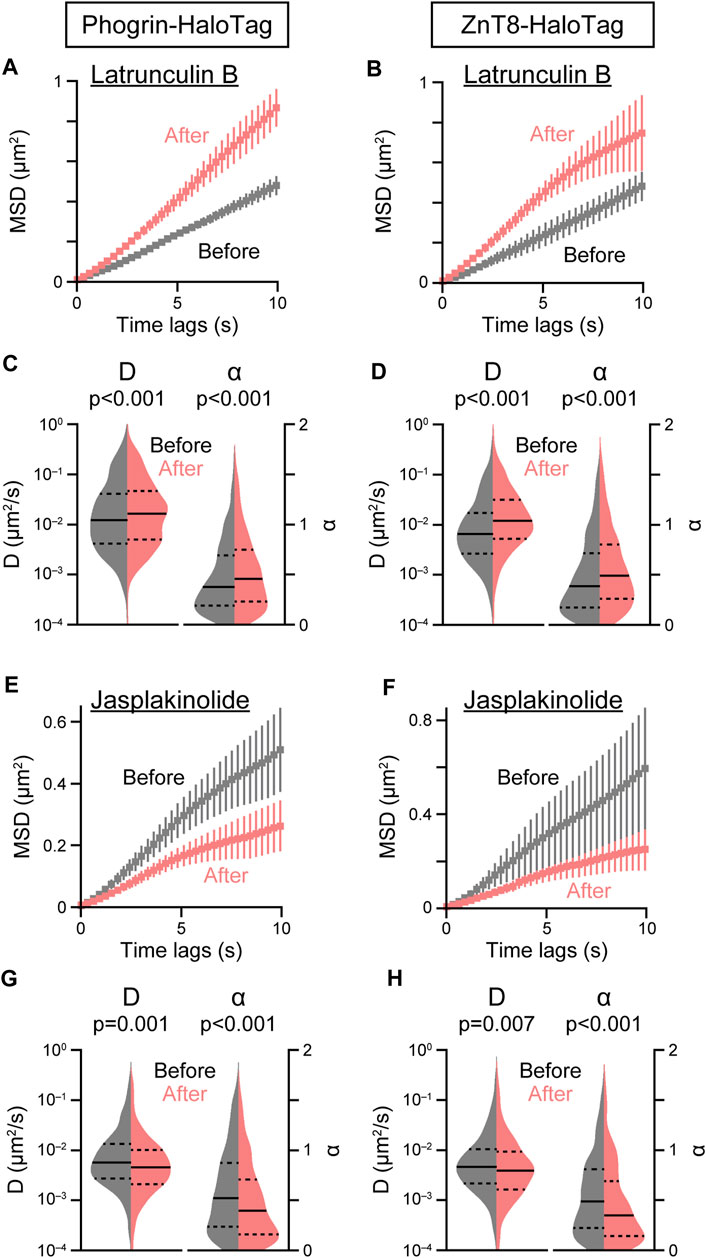
FIGURE 4. Effect of F-actin inhibitors on insulin granule movement. Effect of latrunculin B (10 μM, (A–D) or jasplakinolide (1 μM, (E–H) on the mean MSD curves (A,B,E,F) and violin plots of D and α (C,D,G,H) in cells expressing phogrin-HaloTag (left) or ZnT8-HaloTag (right) before (gray) and 5 min after (red) treatment. Data with error bars are the mean ± SEM (n = 4–9 cells, 539–1,554 particles). Statistical significance was assessed as described in the Methods section.
2.3 Pathophysiological relevance of cytoskeleton-dependent insulin granule behavior
We finally analyzed intracellular behavior of insulin granules under glucolipotoxic conditions by chronically treating INS-1 cells with high concentrations of glucose and palmitate (Pasquier et al., 2019). High glucose itself facilitated insulin granule behavior (Figures 5A–C). Palmitate suppressed insulin granule behavior regardless of glucose concentration, but more strongly in the presence of high concentration of glucose (Figures 5A–C). Interestingly, the cells chronically treated with high glucose and palmitate displayed massive F-actin architectures (Figure 5D), which may at least in part explain the suppression of insulin granule behavior. We observed no obvious changes in microtubule architectures in cells expressing tubulin-EGFP treated with high glucose and palmitate (Figure 5E).
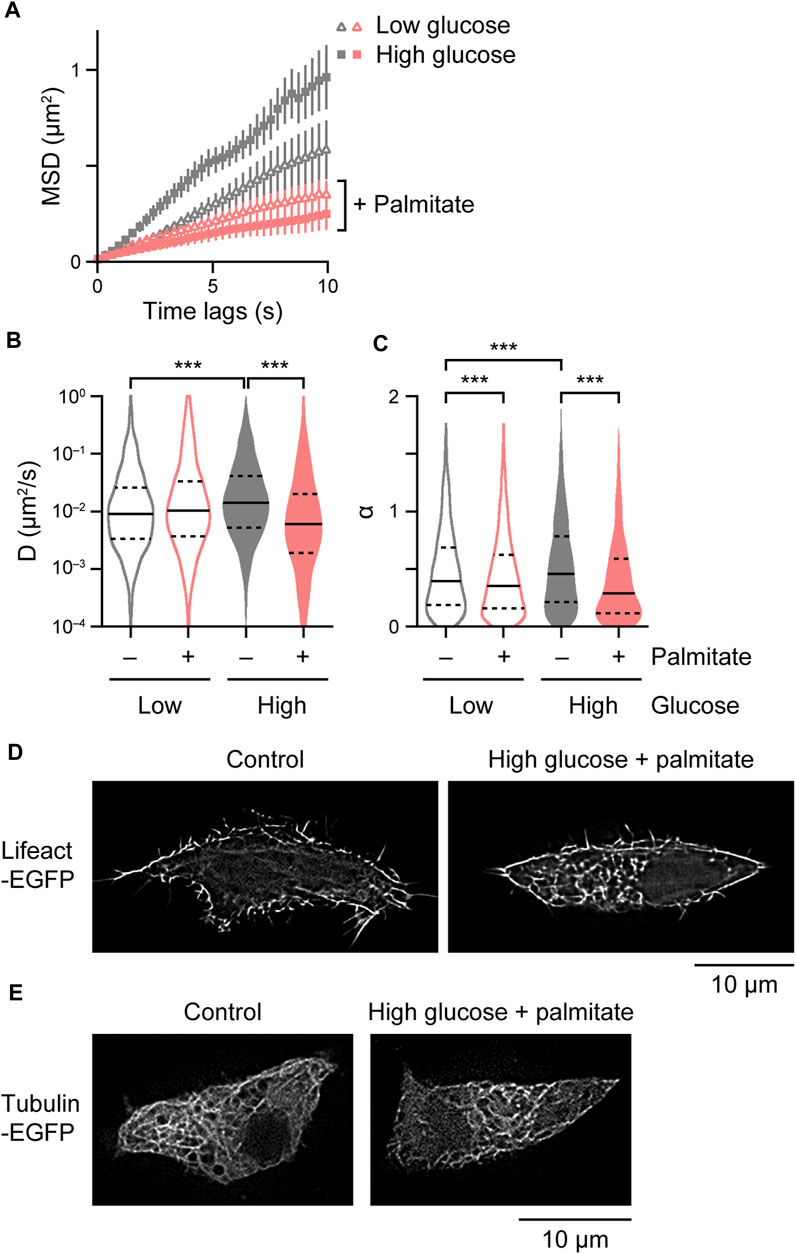
FIGURE 5. Derangement of insulin granule behavior and cytoskeletal architectures under glucolipotoxic models. (A–C) Mean MSD curves (A) and violin plots of D (B) and α (C) in cells expressing ZnT8-HaloTag treated with 2.8 mM or 33.3 mM D-glucose and/or 0.4 mM palmitate for 16–20 h (n = 18–28 cells, 2,363–3,160 particles). Statistical significance was assessed as described in the Materials and methods section. ***p < 0.001. (D,E) SRRF images in cells expressing Lifeact-EGFP (D) and tubulin-EGFP (E) treated with 2.8 mM (left) or 33.3 mM D-glucose and 0.4 mM palmitate for 16–20 h (right).
3 Discussion
In the current study, we proposed a high precision approach for analyzing insulin granule behavior located in relatively deep subcellular regions based on single molecule imaging of QDs of the insulin granule membrane proteins, phogrin and ZnT8. This approach is based on our previously reported study, in which we analyzed intracellular behavior of myosin motors by taking advantage of the relatively simple methodology involving the electroporation of cells expressing HaloTag-fused proteins seeded on standard glass-bottom dishes (Hatakeyama et al., 2017). Although tracking of intracellular insulin granules in live cells employing conventional fluorescent molecules have been performed in this (Supplementary Figures S1, S2) and previous studies (Ivarsson et al., 2004; Tabei et al., 2013), temporal resolution of these approaches was inevitably limited compared with our proposed approach using QDs. This limitation has resulted in the preferential analysis of relatively slow-moving granules. Furthermore, images acquired with such conventional molecules tend to contain crowded signals derived from many fluorescent molecules within limited regions, making it difficult to precisely resolve individual granules. Methods based on TIRF microscopy (Heaslip et al., 2014; Hoboth et al., 2015) can analyze insulin granule behavior at high temporal resolution, but this approach also has limitations as it can only detect granule movement within the subplasmalemmal space. Our current approach overcomes these limitations and enables the analysis of insulin granule behavior deep inside cells with high temporal resolution. Although our current analysis is mainly based on ensemble behavior of intracellular insulin granules as in analysis based on image correlation spectroscopy (Ferri et al., 2019; 2021), our HaloTag/QD-based approach allows us to directly compare intracellular behavior between molecules localized to punctate structures, such as insulin granule membrane proteins, and molecules showing a diffuse localization, such as the control HaloTag, with the same accuracy without any assumptions (Figure 2; Supplementary Figure S1). In the present study, insulin granules exhibited a grossly facilitative behavior compared with the control HaloTag proteins, but with smaller
We should note that there is room for improvement to our current approach. In the present study, we analyzed insulin granule movement in an INS-1 insulinoma cell line, but physiologically, it would be critical to analyze higher-order samples, such as pancreatic islet cells. We have successfully introduced QDs into pancreatic islet cells (Hatakeyama et al. unpublished data). In terms of analysis in these higher-order cells, three-dimensional analyses of granule movement would be desirable, whereas our current approach acquires time series data in two-dimensional images. Although three-dimensional image acquisition with high temporal resolution is challenging, various methods for three-dimensional tracking have been proposed (Shen et al., 2017; Gardini et al., 2018; Liebel et al., 2020). Combining these techniques with our approach will provide further insight into the behavior of insulin granules. Physiologically, important questions remain including 1) how physiological stimuli, such as glucose and incretin hormones, affect insulin granule behavior and 2) how granule behavior and exocytosis are related. For the former issue, prolonged treatment of high glucose facilitated insulin granule behavior (although it should be noted that the concentration was supraphysiological) (Figure 5), indicating glucose can regulate insulin granule behavior. Insulin granule behavior just beneath the plasma membrane has been shown to be facilitated by acute glucose stimulation (Heaslip et al., 2014; Hoboth et al., 2015), and it is imperative to use our approach to analyze the effects of acute glucose stimulation on insulin granule behavior and cytoskeletal dynamics inside the cells. For the latter issue, because QDs that have a broad absorption spectrum and a large Stokes shift can be visualized concurrently with various other fluorescent molecules (Hatakeyama et al., 2017; 2022), simultaneous detection of intracellular granule movement and exocytotic processes may be possible by employing QDs and extracellular polar tracers (Takahashi et al., 2004; Hatakeyama et al., 2006; Shin et al., 2018), respectively. Finally, although our estimation of the behavioral parameters,
Overall, our approach can provide detailed information regarding intracellular insulin granule mobilization, and we believe our approach will shed new light on the regulatory mechanisms of intracellular insulin granule mobilization and has important implications for understanding the pathogenesis of diabetes.
4 Materials and methods
4.1 Cell lines
INS-1 cells were grown at 37°C in a 5% CO2/95% air in RPMI1640 containing 10% FBS, 1 mM sodium pyruvate, 50 μM 2-mercaptoethanol, 10 mM HEPES, and 1% penicillin/streptomycin (100 U/mL penicillin and 100 μg/mL streptomycin). Plasmids were transfected into cells via reverse transfection method with Lipofectamine 3,000 and Opti-MEM I in glass-bottom dishes (thickness 0.17 mm, Matsunami-glass). In some experiments, the cells were stained with 0.5 μM HaloTag TMR ligand (Promega). All imaging experiments were performed 24 h after transfection.
4.2 Plasmids
Human insulin transcript variant 1 (GenBank accession #AB587580) was amplified from the pFN21AB8864 vector (Promega) with primers 5′-CGATGAATTCGCCACCATGGCCCTGTGGATGCGC-3' (forward) and 5′-TCGTCTCGAGGTTGCAGTAGTTCTCCAGC-3' (reverse). Rat phogrin (GenBank accession #z50735) was amplified from phogrin-EGFP-N1 (Pouli et al., 1998) (kindly provided by Prof. Guy A. Rutter) with primers 5′-CTTCGAATTCGCCACCATGGGGCTACCGCTCCC-3' (forward) and 5-CGACCTCGAGCTGGGGAAGGGCCTTCAG-3' (reverse). The human zinc transporter transcript variant 1 (GenBank accession #NM173851) was amplified from the Zinc transporter 8 human tagged ORF clone (Origene) with primers 5′-GCCGAATTCGCCACCATGGAGTTTCTTGAAAGAACG-3' (forward) and 5′-GCGTCTCGAGGTCACAGGGGTCTTCACAG-3' (reverse). All three constructs were modified with an EcoRI site and a Kozak sequence at the N-terminus and an XhoI site at the C-terminus. The amplified products were digested with EcoRI/XhoI and inserted into the multiple cloning site of the pHTC HaloTAG CMV neo vector to generate the pHTC-insulin-HaloTag, pHTC-phogrin-HaloTag, and pHTC-ZnT8-HaloTag vectors. EGFP was amplified from the phogrin-EGFP-N1 vector as a template with primers 5′-GGCTGTCTACTCTGGAGATTTCCGGTGGCGGCAGCGGAGGATCCGGCGGAACATGTACACCGCTGAGCGCCACCATGGTGAGCAAGGGCGAG-3' (forward) and 5′-AGTCGCGGCCGCTTTACTTGTAC-3' (reverse), and an AccI site and linker were added. The amplified product was digested with AccI/NotI and inserted into the C-terminus of the pHTC-phogrin-HaloTag vector to create the pHTC-phogrin-HaloTag-EGFP vector. Then, the pHTC-phogrin-HaloTag-EGFP vector was digested with EcoRI/XhoI, and phogrin was replaced with ZnT8 to generate the pHTC-ZnT8-HaloTag-EGFP vector.
4.3 Conjugation of the HaloTag ligand with QDs and electroporation
Conjugation of the HaloTag ligand with QDs was performed with a HaloTag succinimidyl ester (O2) ligand and Qdot ITK amino (PEG) QD655 as previously described (Hatakeyama et al., 2017) with slight modification. For electroporation of the QD-conjugated HaloTag ligand, the cells on the glass-bottom dish were immersed in Opti-MEM I containing 5 nM of QD-conjugated HaloTag ligand and electroporated with a CUY21EDIT II electroporator and an LF513-5 electrode by applying a pulse of 200 V for 10 ms, followed by five pulses at ±30 mV for 10 ms at 50 ms intervals. The cells were then washed and cultured overnight in culture medium.
4.4 Immunofluorescence and colocalization analysis
Immunofluorescence was performed with standard protocols. The cells labelled with HaloTag TMR ligand were fixed, permeabilized, treated with anti-insulin antibodies (Cell Signaling), and stained with Alexa 647-conjugated anti-rabbit IgG (Abcam). For colocalization analysis, background fluorescence of the acquired images was measured within the cell-free area adjacent to the cell of interest and its mean + 3SD value was subtracted from the entire image. Colocalization coefficient was obtained with Coloc2 plug-in of Fiji ImageJ (Schindelin et al., 2012).
4.5 Imaging and particle tracking
All imaging experiments were performed with an inverted microscope (IX81 or IX83) equipped with an EMCCD camera (iXon ultra), a spinning disk confocal unit (CSU-X1), a z-drift compensator (IX81-ZDC2 or IX3-ZDC2), SRRF-stream module (Andor) and an oil-immersion objective lens (UPLSAPO100xO, NA1.4) at approximately 30°C with both a stage heater and a lens heater (TOKAI HIT). Images were acquired with iQ software (Andor). The bathing solution for imaging experiments consisted of 150 mM NaCl, 5 mM KCl, 2 mM CaCl2, 1 mM MgCl2, 10 mM HEPES-NaOH (pH 7.4) and 2.8 mM D-glucose unless otherwise indicated. For QD imaging, excitation was 532 or 555 nm, and the fluorescence was acquired through a 655/15 bandpass filter (Semrock) at 33 frames/s for 30 s. Pixel sizes were approximately 0.082 μm/pixel (Hatakeyama et al., 2023). For TMR imaging, excitation was 532 or 555 nm, and the fluorescence was acquired through a 594/40 bandpass filter (Semrock) at 2 frames/s for 120 s (Ono et al., 2023). All imaging was performed at a depth of 1-2 μm above the glass surface. Single-particle tracking was performed with the TrackMate plugin (Tinevez et al., 2017) of Fiji ImageJ with subpixel accuracy. For QDs, we used LoG detector with blob diameter of 12 pixels, simple LAP tracker with linking, gap-closing max distances of 6 pixels, gap-closing max frame of 5, selected spots with Quality values > 2, and tracks containing >30 positions for subsequent analysis. For TMR, we used LoG detector with blob diameter of 6 pixels, simple LAP tracker with linking max distances of 6 pixels, set Quality values in which there were no spots with Signal-to-Noise Ratio values of <0, and selected tracks containing >10 positions for subsequent analysis. Based on the tracks, we calculated the MSD of the particles with a slightly modified script of the @msdanalyzer (Tarantino et al., 2014). MSD was calculated as follows:
where
where
The exponent
4.6 Preparation of palmitate/BSA-complex solution
Palmitate/BSA-complex solution was prepared as described previously (Cousin et al., 2001). Briefly, 100 mM palmitate was prepared in 0.1 M NaOH at 70°C. In parallel, 5% FFA-free BSA solution was prepared in serum-free RPMI1640 medium at 56°C. One mM palmitate/5% BSA solution was prepared by adding an appropriate amount of palmitate solution dropwise to 5% BSA solution at 56°C, then vortex mixed for 10 s followed by a further 10-min incubation at 56°C. The palmitate/BSA complex solution was filtered and diluted 1:5 in serum-free RPMI1640 to a final concentration of 0.4 mM palmitate/1% BSA. Imaging experiments were performed after 16–20 h treatment of palmitate/BSA in the continuous presence of palmitate/BSA.
4.7 Statistical analysis
The statistical significance of the observed differences between two conditions was determined by the randomization test using Shiny apps (https://huygens.science.uva.nl/) at https://thenode.biologists.com/user-friendly-p-values/research/. A p-value less than 0.05 was considered statistically significant.
Data availability statement
The raw data supporting the conclusion of this article will be made available by the authors, without undue reservation.
Ethics statement
Ethical approval was not required for the studies on animals in accordance with the local legislation and institutional requirements because only commercially available established cell lines were used.
Author contributions
HH: Conceptualization, Data curation, Formal Analysis, Funding acquisition, Investigation, Methodology, Resources, Software, Validation, Visualization, Writing–original draft, Writing–review and editing. TO: Investigation, Resources, Visualization, Writing–review and editing. SO: Investigation, Writing–review and editing. YM: Resources, Writing–review and editing. NT: Conceptualization, Data curation, Formal Analysis, Funding acquisition, Investigation, Methodology, Project administration, Resources, Supervision, Validation, Visualization, Writing–original draft, Writing–review and editing.
Funding
The author(s) declare financial support was received for the research, authorship, and/or publication of this article. This work was supported in part by grants from the Japan Society for the Promotion of Science (nos 20K07280 to NT and 21K06773 to HH), Astellas Foundation for Research on Metabolic Disorders and the Naito Grant for the advancement of natural science (to NT), and the Takeda Science Foundation (to HH).
Acknowledgments
We are grateful to Prof. Claes B. Wollheim for providing INS-1 cells, Prof. Guy A. Rutter for providing phogrin-EGFP-N1 plasmids, and Prof. Koji Takano for providing excitation light source, respectively.
Conflict of interest
The authors declare that the research was conducted in the absence of any commercial or financial relationships that could be construed as a potential conflict of interest.
Publisher’s note
All claims expressed in this article are solely those of the authors and do not necessarily represent those of their affiliated organizations, or those of the publisher, the editors and the reviewers. Any product that may be evaluated in this article, or claim that may be made by its manufacturer, is not guaranteed or endorsed by the publisher.
Supplementary material
The Supplementary Material for this article can be found online at: https://www.frontiersin.org/articles/10.3389/fphys.2023.1287275/full#supplementary-material
References
Arts M., Smal I., Paul M. W., Wyman C., Meijering E. (2019). Particle mobility analysis using deep learning and the moment scaling spectrum. Sci. Rep. 9, 17160. doi:10.1038/s41598-019-53663-8
Asfari M., Janjic D., Meda P., Li G., Halban P. A., Wollheim C. B. (1992). Establishment of 2-mercaptoethanol-dependent differentiated insulin-secreting cell lines. Endocrinology 130, 167–178. doi:10.1210/endo.130.1.1370150
Aunis D., Bader M. F. (1988). The cytoskeleton as a barrier to exocytosis in secretory cells. J. Exp. Biol. 139, 253–266. doi:10.1242/jeb.139.1.253
Chimienti F., Devergnas S., Favier A., Seve M. (2004). Identification and cloning of a beta-cell-specific zinc transporter, ZnT-8, localized into insulin secretory granules. Diabetes 53, 2330–2337. doi:10.2337/diabetes.53.9.2330
Cousin S. P., Hugl S. R., Wrede C. E., Kajio H., Myers M. G., Rhodes C. J. (2001). Free fatty acid-induced inhibition of glucose and insulin-like growth factor I-induced deoxyribonucleic acid synthesis in the pancreatic beta-cell line INS-1. Endocrinology 142, 229–240. doi:10.1210/endo.142.1.7863
Das R., Cairo C. W., Coombs D. (2009). A hidden Markov model for single particle tracks quantifies dynamic interactions between LFA-1 and the actin cytoskeleton. PLoS Comput. Biol. 5, e1000556. doi:10.1371/journal.pcbi.1000556
Dean P. M. (1973). Ultrastructural morphometry of the pancreatic β-cell. Diabetologia 9, 115–119. doi:10.1007/BF01230690
Elsner M., Hashimoto H., Simpson J. C., Cassel D., Nilsson T., Weiss M. (2003). Spatiotemporal dynamics of the COPI vesicle machinery. EMBO Rep. 4, 1000–1004. doi:10.1038/sj.embor.embor942
Ferri G., Digiacomo L., Lavagnino Z., Occhipinti M., Bugliani M., Cappello V., et al. (2019). Insulin secretory granules labelled with phogrin-fluorescent proteins show alterations in size, mobility and responsiveness to glucose stimulation in living beta-cells. Sci. Rep. 9, 2890. doi:10.1038/s41598-019-39329-5
Ferri G., Tesi M., Pesce L., Bugliani M., Grano F., Occhipinti M., et al. (2021). Spatiotemporal correlation spectroscopy reveals a protective effect of peptide-based GLP-1 receptor agonism against lipotoxicity on insulin granule dynamics in primary human beta-cells. Pharmaceutics 13, 1403. doi:10.3390/pharmaceutics13091403
Gardini L., Calamai M., Hatakeyama H., Kanzaki M., Capitanio M., Pavone F. S. (2018). Three-dimensional tracking of quantum dot-conjugated molecules in living cells. Methods Mol. Biol. 1814, 425–448. doi:10.1007/978-1-4939-8591-3_26
Gomi H., Mizutani S., Kasai K., Itohara S., Izumi T. (2005). Granuphilin molecularly docks insulin granules to the fusion machinery. J. Cell Biol. 171, 99–109. doi:10.1083/jcb.200505179
Gustafsson N., Culley S., Ashdown G., Owen D. M., Pereira P. M., Henriques R. (2016). Fast live-cell conventional fluorophore nanoscopy with ImageJ through super-resolution radial fluctuations. Nat. Commun. 7, 12471. doi:10.1038/ncomms12471
Hatakeyama H., Kishimoto T., Nemoto T., Kasai H., Takahashi N. (2006). Rapid glucose sensing by protein kinase A for insulin exocytosis in mouse pancreatic islets. J. Physiol.-Lond. 570, 271–282. doi:10.1113/jphysiol.2005.096560
Hatakeyama H., Kobayashi K., Kanzaki M. (2022). Three live-imaging techniques for comprehensively understanding the initial trigger for insulin-responsive intracellular GLUT4 trafficking. iScience 25, 104164. doi:10.1016/j.isci.2022.104164
Hatakeyama H., Ono S., Oshima T., Takahashi N. (2023). Role of F-actin in intracellular insulin granule behavior analyzed by single-particle tracking. Proceedings of the 100th Annual Meeting of The Physiological Society of Japan. J. Physiol. Sci. 73 (Suppl 1), 11. doi:10.1186/s12576-023-00867-3
Hatakeyama H., Nakahata Y., Yarimizu H., Kanzaki M. (2017). Live-cell single-molecule labeling and analysis of myosin motors with quantum dots. Mol. Biol. Cell 28, 173–181. doi:10.1091/mbc.E16-06-0413
Hatakeyama H., Takahashi N., Kishimoto T., Nemoto T., Kasai H. (2007). Two cAMP-dependent pathways differentially regulate exocytosis of large dense-core and small vesicles in mouse beta-cells. J. Physiol. 582, 1087–1098. doi:10.1113/jphysiol.2007.135228
Heaslip A. T., Nelson S. R., Lombardo A. T., Beck Previs S., Armstrong J., Warshaw D. M. (2014). Cytoskeletal dependence of insulin granule movement dynamics in INS-1 beta-cells in response to glucose. PLoS One 9, e109082. doi:10.1371/journal.pone.0109082
Hoboth P., Muller A., Ivanova A., Mziaut H., Dehghany J., Sonmez A., et al. (2015). Aged insulin granules display reduced microtubule-dependent mobility and are disposed within actin-positive multigranular bodies. Proc. Natl. Acad. Sci. U A 112, E667–E676. doi:10.1073/pnas.1409542112
Howell S. L., Tyhurst M. (1982). Microtubules, microfilaments and insulin-secretion. Diabetologia 22, 301–308. doi:10.1007/BF00253571
Ivarsson R., Jing X., Waselle L., Regazzi R., Renström E. (2005). Myosin 5a controls insulin granule recruitment during late-phase secretion. Traffic 6, 1027–1035. doi:10.1111/j.1600-0854.2005.00342.x
Ivarsson R., Obermuller S., Rutter G. A., Galvanovskis J., Renström E. (2004). Temperature-sensitive random insulin granule diffusion is a prerequisite for recruiting granules for release. Traffic 5, 750–762. doi:10.1111/j.1600-0854.2004.00216.x
Kahn S. E. (2001). Clinical review 135: the importance of beta-cell failure in the development and progression of type 2 diabetes. J. Clin. Endocrinol. Metab. 86, 4047–4058. doi:10.1210/jcem.86.9.7713
Kasai K., Fujita T., Gomi H., Izumi T. (2008). Docking is not a prerequisite but a temporal constraint for fusion of secretory granules. Traffic 9, 1191–1203. doi:10.1111/j.1600-0854.2008.00744.x
Lacy P. E., Howell S. L., Young D. A., Fink C. J. (1968). New hypothesis of insulin secretion. Nature 219, 1177–1179. doi:10.1038/2191177a0
Liebel M., Ortega Arroyo J., Beltran V. S., Osmond J., Jo A., Lee H., et al. (2020). 3D tracking of extracellular vesicles by holographic fluorescence imaging. Sci. Adv. 6, eabc2508. doi:10.1126/sciadv.abc2508
Malaisse-Lagae F., Amherdt M., Ravazzola M., Sener A., Hutton J. C., Orci L., et al. (1979). Role of microtubules in the synthesis, conversion, and release of (pro)insulin. A biochemical and radioautographic study in rat islets. J. Clin. Invest. 63, 1284–1296. doi:10.1172/JCI109423
Matsuda Y., Hanasaki I., Iwao R., Yamaguchi H., Niimi T. (2018). Estimation of diffusive states from single-particle trajectory in heterogeneous medium using machine-learning methods. Phys. Chem. Chem. Phys. 20, 24099–24108. doi:10.1039/c8cp02566e
Monnier N., Barry Z., Park H. Y., Su K.-C., Katz Z., English B. P., et al. (2015). Inferring transient particle transport dynamics in live cells. Nat. Methods 12, 838–840. doi:10.1038/nmeth.3483
Müller A., Schmidt D., Xu C. S., Pang S., D’Costa J. V., Kretschmar S., et al. (2020). 3D FIB-SEM reconstruction of microtubule–organelle interaction in whole primary mouse β cells. J. Cell Biol. 220, e202010039. doi:10.1083/jcb.202010039
Nelson S. R., Ali M. Y., Trybus K. M., Warshaw D. M. (2009). Random walk of processive, quantum dot-labeled myosin Va molecules within the actin cortex of COS-7 cells. Biophys. J. 97, 509–518. doi:10.1016/j.bpj.2009.04.052
Newby J. M., Schaefer A. M., Lee P. T., Forest M. G., Lai S. K. (2018). Convolutional neural networks automate detection for tracking of submicron-scale particles in 2D and 3D. Proc. Natl. Acad. Sci. U A 115, 9026–9031. doi:10.1073/pnas.1804420115
Olofsson C. S., Gopel S. O., Barg S., Galvanovskis J., Ma X., Salehi A., et al. (2002). Fast insulin secretion reflects exocytosis of docked granules in mouse pancreatic B-cells. Pflugers Arch. 444, 43–51. doi:10.1007/s00424-002-0781-5
Ono S., Hatakeyama H., Oshima T., Takahashi N. (2023). Live-imaging analysis of F-actin actions on intracellular insulin granule behavior. Proceedings of the 100th Annual Meeting of The Physiological Society of Japan. J. Physiol. Sci. 73 (Suppl 1), 11. doi:10.1186/s12576-023-00867-3
Orci L., Amherdt M., Malaisse-Lagae F., Rouiller C., Renold A. E. (1973). Insulin release by emiocytosis: demonstration with freeze-etching technique. Science 179, 82–84. doi:10.1126/science.179.4068.82
Pasquier A., Vivot K., Erbs E., Spiegelhalter C., Zhang Z., Aubert V., et al. (2019). Lysosomal degradation of newly formed insulin granules contributes to beta cell failure in diabetes. Nat. Commun. 10, 3312. doi:10.1038/s41467-019-11170-4
Persson F., Linden M., Unoson C., Elf J. (2013). Extracting intracellular diffusive states and transition rates from single-molecule tracking data. Nat. Methods 10, 265–269. doi:10.1038/nmeth.2367
Pierobon P., Achouri S., Courty S., Dunn A. R., Spudich J. A., Dahan M., et al. (2009). Velocity, processivity, and individual steps of single myosin V molecules in live cells. Biophys. J. 96, 4268–4275. doi:10.1016/j.bpj.2009.02.045
Pinaud F., Michalet X., Iyer G., Margeat E., Moore H. P., Weiss S. (2009). Dynamic partitioning of a glycosyl-phosphatidylinositol-anchored protein in glycosphingolipid-rich microdomains imaged by single-quantum dot tracking. Traffic 10, 691–712. doi:10.1111/j.1600-0854.2009.00902.x
Pouli A. E., Emmanouilidou E., Zhao C., Wasmeier C., Hutton J. C., Rutter G. A. (1998). Secretory-granule dynamics visualized in vivo with a phogrin-green fluorescent protein chimaera. Biochem. J. 333 (1), 193–199. doi:10.1042/bj3330193
Rorsman P., Rentröm E. (2003). Insulin granule dynamics in pancreatic beta cells. Diabetologia 46, 1029–1045. doi:10.1007/s00125-003-1153-1
Schindelin J., Arganda-Carreras I., Frise E., Kaynig V., Longair M., Pietzsch T., et al. (2012). Fiji: an open-source platform for biological-image analysis. Nat. Methods 9, 676–682. doi:10.1038/nmeth.2019
Seino S., Shibasaki T., Minami K. (2011). Dynamics of insulin secretion and the clinical implications for obesity and diabetes. J. Clin. Invest. 121, 2118–2125. doi:10.1172/JCI45680
Shen H., Tauzin L. J., Baiyasi R., Wang W., Moringo N., Shuang B., et al. (2017). Single particle tracking: from theory to biophysical applications. Chem. Rev. 117, 7331–7376. doi:10.1021/acs.chemrev.6b00815
Shin W., Ge L., Arpino G., Villarreal S. A., Hamid E., Liu H., et al. (2018). Visualization of membrane pore in live cells reveals a dynamic-pore theory governing fusion and endocytosis. Cell 173, 934–945. doi:10.1016/j.cell.2018.02.062
Sprague B. L., Pego R. L., Stavreva D. A., McNally J. G. (2004). Analysis of binding reactions by fluorescence recovery after photobleaching. Biophys. J. 86, 3473–3495. doi:10.1529/biophysj.103.026765
Tabei S. M., Burov S., Kim H. Y., Kuznetsov A., Huynh T., Jureller J., et al. (2013). Intracellular transport of insulin granules is a subordinated random walk. Proc. Natl. Acad. Sci. U A 110, 4911–4916. doi:10.1073/pnas.1221962110
Takahashi N., Hatakeyama H., Okado H., Miwa A., Kishimoto T., Kojima T., et al. (2004). Sequential exocytosis of insulin granules is associated with redistribution of SNAP25. J. Cell Biol. 165, 255–262. doi:10.1083/jcb.200312033
Takahashi N., Sawada W., Noguchi J., Watanabe S., Ucar H., Hayashi-Takagi A., et al. (2015). Two-photon fluorescence lifetime imaging of primed SNARE complexes in presynaptic terminals and beta cells. Nat. Commun. 6, 8531. doi:10.1038/ncomms9531
Tarantino N., Tinevez J. Y., Crowell E. F., Boisson B., Henriques R., Mhlanga M., et al. (2014). TNF and IL-1 exhibit distinct ubiquitin requirements for inducing NEMO-IKK supramolecular structures. J. Cell Biol. 204, 231–245. doi:10.1083/jcb.201307172
Thurmond D. C., Gonelle-Gispert C., Furukawa M., Halban P. A., Pessin J. E. (2003). Glucose-stimulated insulin secretion is coupled to the interaction of actin with the t-SNARE (target membrane soluble N-ethylmaleimide-sensitive factor attachment protein receptor protein) complex. Mol. Endocrinol. 17, 732–742. doi:10.1210/me.2002-0333
Tinevez J. Y., Perry N., Schindelin J., Hoopes G. M., Reynolds G. D., Laplantine E., et al. (2017). TrackMate: an open and extensible platform for single-particle tracking. Methods 115, 80–90. doi:10.1016/j.ymeth.2016.09.016
Varadi A., Tsuboi T., Johnson-Cadwell L. I., Allan V. J., Rutter G. A. (2003). Kinesin I and cytoplasmic dynein orchestrate glucose-stimulated insulin-containing vesicle movements in clonal MIN6 beta-cells. Biochem. Biophys. Res. Commun. 311, 272–282. doi:10.1016/j.bbrc.2003.09.208
Varadi A., Tsuboi T., Rutter G. A. (2005). Myosin Va transports dense core secretory vesicles in pancreatic MIN6 beta-cells. Mol. Biol. Cell 16, 2670–2680. doi:10.1091/mbc.e04-11-1001
Wasmeier C., Hutton J. C. (1996). Molecular cloning of phogrin, a protein-tyrosine phosphatase homologue localized to insulin secretory granule membranes. J. Biol. Chem. 271, 18161–18170. doi:10.1074/jbc.271.30.18161
Xu S., Nam S. M., Kim J.-H., Das R., Choi S.-K., Nguyen T. T., et al. (2015). Palmitate induces ER calcium depletion and apoptosis in mouse podocytes subsequent to mitochondrial oxidative stress. Cell Death Dis. 6, e1976. doi:10.1038/cddis.2015.331
Keywords: insulin granules, single-molecule analysis, cytoskeleton, actin, microtubules
Citation: Hatakeyama H, Oshima T, Ono S, Morimoto Y and Takahashi N (2023) Single-molecule analysis of intracellular insulin granule behavior and its application to analyzing cytoskeletal dependence and pathophysiological implications. Front. Physiol. 14:1287275. doi: 10.3389/fphys.2023.1287275
Received: 01 September 2023; Accepted: 20 November 2023;
Published: 06 December 2023.
Edited by:
Kazunori Kanemaru, Nihon University, JapanReviewed by:
Zita Balklava, Aston University, United KingdomHerbert Gaisano, University of Toronto, Canada
Copyright © 2023 Hatakeyama, Oshima, Ono, Morimoto and Takahashi. This is an open-access article distributed under the terms of the Creative Commons Attribution License (CC BY). The use, distribution or reproduction in other forums is permitted, provided the original author(s) and the copyright owner(s) are credited and that the original publication in this journal is cited, in accordance with accepted academic practice. No use, distribution or reproduction is permitted which does not comply with these terms.
*Correspondence: Hiroyasu Hatakeyama, aGF0YWtlQG1lZC5raXRhc2F0by11LmFjLmpw; Noriko Takahashi, bnRha2FoYXNAbWVkLmtpdGFzYXRvLXUuYWMuanA=