 Felix Plappert
 Gunnar Engström
 Pyotr G. Platonov
 Mikael Wallman
 Frida Sandberg
- 1Department of Biomedical Engineering, Lund University, Lund, Sweden
- 2Department of Clinical Sciences, Cardiovascular Research–Epidemiology, Malmö, Sweden
- 3Department of Cardiology, Clinical Sciences, Lund University, Lund, Sweden
- 4Fraunhofer-Chalmers Centre, Department of Systems and Data Analysis, Gothenburg, Sweden
Introduction: Information about autonomic nervous system (ANS) activity may offer insights about atrial fibrillation (AF) progression and support personalized AF treatment but is not easily accessible from the ECG. In this study, we propose a new approach for ECG-based assessment of respiratory modulation in atrioventricular (AV) nodal refractory period and conduction delay.
Methods: A 1-dimensional convolutional neural network (1D-CNN) was trained to estimate respiratory modulation of AV nodal conduction properties from 1-minute segments of RR series, respiration signals, and atrial fibrillatory rates (AFR) using synthetic data that replicates clinical ECG-derived data. The synthetic data were generated using a network model of the AV node and 4 million unique model parameter sets. The 1D-CNN was then used to analyze respiratory modulation in clinical deep breathing test data of 28 patients in AF, where an ECG-derived respiration signal was extracted using a novel approach based on periodic component analysis.
Results: We demonstrated using synthetic data that the 1D-CNN can estimate the respiratory modulation from RR series alone with a Pearson sample correlation of r = 0.805 and that the addition of either respiration signal (r = 0.830), AFR (r = 0.837), or both (r = 0.855) improves the estimation.
Discussion: Initial results from analysis of ECG data suggest that our proposed estimate of respiration-induced autonomic modulation, aresp, is reproducible and sufficiently sensitive to monitor changes and detect individual differences. However, further studies are needed to verify the reproducibility, sensitivity, and clinical significance of aresp.
1 Introduction
Atrial fibrillation (AF) is the most common supraventricular tachyarrhythmia (Hindricks et al., 2020). Characteristic of AF is an uncoordinated atrial electrical activation that results in increased and irregular ventricular activity. Atrial fibrillation poses a significant burden to patients, physicians, and healthcare systems globally, and is associated with substantial morbidity and mortality. The recently updated guideline for the diagnosis and management of AF emphasizes that AF is a progressive disease that requires a variety of strategies at different stages, from prevention, lifestyle and risk factor modification, screening and therapy (Joglar et al., 2023). In this context, monitoring of pathophysiological changes associated with AF progression in individual patients can be valuable for the management of persistent AF.
There is a bidirectional relationship between AF and autonomic nervous system (ANS) dysfunction (Linz et al., 2019; Malik et al., 2022). The ANS contributes to the maintenance of AF (Shen and Zipes, 2014; Joglar et al., 2023) and the presence of AF promotes atrial neural remodeling and deficiencies in autonomic afferent reflexes (Wasmund et al., 2003; Yu et al., 2014; Malik et al., 2022). For example, AF patients have shown impaired sensitivity in the arterial baroreceptor reflex, a mechanism that buffers acute changes in arterial blood pressure by modulating both the parasympathetic and sympathetic nervous systems (van den Berg et al., 2001; Miyoshi et al., 2020; Ferreira et al., 2023). Conversely, the restoration of sinus rhythm has been shown to improve the baroreceptor sensitivity (Field et al., 2016), and baroreceptor activation therapy has restored sinus rhythm in a recent case study (Wang et al., 2023).
In normal sinus rhythm (NSR), autonomic dysfunction can be assessed by measuring the heart rate variability (Sassi et al., 2015; Shaffer and Ginsberg, 2017), quantifying autonomic modulation of the sinoatrial (SA) node. However, during AF, the heart rate is instead determined by the rate of fibrillation and the subsequent atrioventricular (AV) nodal modulation, raising the need for alternative approaches to assess autonomic dysfunction. Since the AV node, much like the SA node, is densely innervated by the ANS (George et al., 2017; Hanna et al., 2021), it is an attractive substitute for the assessment of autonomic function under AF. However, the relation between cardiac ANS modulation and AV nodal function under AF is far more complex than that between ANS modulation and SA node function during NSR. This calls for more sophisticated, model-based methods of analysis.
The AV node is characterized by its dual-pathway physiology allowing for parallel conduction of impulses where the two pathways have different electrophysiological properties (George et al., 2017). The fast pathway (FP) exhibits a shorter conduction delay and longer refractory period compared to the slow pathway (SP) (George et al., 2017). The AV nodal refractory period and conduction delay are influenced by the previous activity of conducted and blocked impulses (George et al., 2017; Billette and Tadros, 2019). There have been several AV node models proposed that describe different characteristics of the AV nodal structure and electrophysiology (Cohen et al., 1983; Mangin et al., 2005; Rashidi and Khodarahmi, 2005; Lian et al., 2006; Climent et al., 2011b; Masè et al., 2015; Henriksson et al., 2016; Inada et al., 2017; Wallman and Sandberg, 2018; Karlsson et al., 2021), but our previously proposed model (Plappert et al., 2022) is the first to address autonomic modulation of the AV nodal refractory period and conduction delay. We showed that ANS-induced changes during tilt could be better replicated when scaling the refractory period and conduction delay with a constant factor. Because respiration is a powerful modulator of the reflex control systems, to a large extent via effects on the baroreflex (Piepoli et al., 1997), abnormal respiration-induced autonomic modulation is often an early sign of autonomic dysfunction (Bernardi et al., 2001). For the monitoring of cardiac autonomic modulation in AF patients, the assessment of respiration-induced autonomic modulation seems well-suited because respiration is always present and can be extracted from ECG signals (Varon et al., 2020). Building on the previous AV node model extension, the respiration-induced autonomic modulation could be incorporated by time-varying changes in the modulation of AV nodal refractory period and conduction delay.
Machine learning is vibrant in the field of cardiac electrophysiology with a rapidly growing number of applications (Trayanova et al., 2021). However, one main challenge is the acquirement of large amounts of data for proper training and validation. In recent years, a few studies have been performed in which synthetic data has been generated for the training of neural networks which are then used on clinical data. For example, synthetic images were generated to train neural networks to track cardiac motion and calculate cardiac strain (Loecher et al., 2021), estimate tensors from free-breathing cardiac diffusion tensor imaging (Weine et al., 2022), and predict end-diastole volume, end-systole volume, and ejection fraction (Gheorghita et al., 2022). Furthermore, synthetic photoplethysmography (PPG) signals were generated to detect bradycardia and tachycardia (Sološenko et al., 2022), and synthetic electrocardiogram (ECG) signals were generated to detect r-waves during different physical activities and atrial fibrillation (Kaisti et al., 2023), and to predict the ventricular origin in outflow tract ventricular arrhythmias (Doste et al., 2022).
This study aims to develop and evaluate a method to extract respiration-induced autonomic modulation in the AV node conduction properties from ECG data in AF. We present a novel approach to extract respiration signals from several ECG leads based on the periodic component analysis (Sameni et al., 2008). In addition, we present a novel extension to our previously proposed AV node network model accounting for respiration-induced autonomic modulation of AV nodal refractory period and conduction delay. Furthermore, we estimate the magnitude of respiration-induced autonomic modulation using a 1-dimensional convolutional neural network that was trained on synthetic 1-min segments of RR series, respiration signals, and average atrial fibrillatory rate which replicate clinical data. The trained network was used to analyze data from 28 AF patients performing a deep breathing task including slow metronome breathing at a respiration rate of 6 breaths/min. During NSR, slower breathing causes an increased respiration-induced autonomic modulation with a maximum HRV response typically observed at a respiration rate of 6 breaths/min (Russo et al., 2017). Hence, we hypothesize that the respiration-induced autonomic modulation in the AV node conduction properties is strengthened during the deep breathing task.
2 Materials and methods
First, the clinical deep breathing test data from patients in atrial fibrillation is described in Section 2.1. In Section 2.2, the extraction of RR series and atrial fibrillatory rate (AFR) from ECG are described. Moreover, Section 2.2 covers the extraction of ECG-derived respiration (EDR) signals using a novel approach based on periodic component analysis. A description of the extended AV network model accounting for respiration-induced autonomic modulation is given in Section 2.3, as well as a description of how the simulated datasets are generated. In Section 2.4, the architecture of a 1-dimensional convolutional neural network (1D-CNN) that is used to estimate the magnitude of respiratory modulation from ECG recordings is described together with the training and testing of the neural network. Finally, the CNN is used to estimate the respiration-induced autonomic modulation from the clinical ECG-derived features and the estimates are analyzed.
2.1 ECG data
The dataset of the clinical deep breathing test consisted of 12-lead ECG recordings with a sampling rate of 500 Hz from individuals with AF participating in the SCAPIS study (Bergström et al., 2015). The participants in the SCAPIS study were from the Swedish general population aged 50–64 years. A subset of the SCAPIS cohort (5136 participants) performed a deep breathing test (Engström et al., 2022). Of this subset, 28 participants with complete data were in AF at the time of recording (Abdollahpur et al., 2022). The clinical characteristics of that subset are listed in Table 1. The deep breathing test started with the participants resting in a supine position while breathing normally for 5 minutes. Following this, the participants performed slow metronome breathing at a respiration rate of 0.1 Hz for 1 minute. During the slow metronome breathing, a nurse guided the participants to inhale for 5 seconds and exhale for 5 seconds, for a total of six breathing cycles.
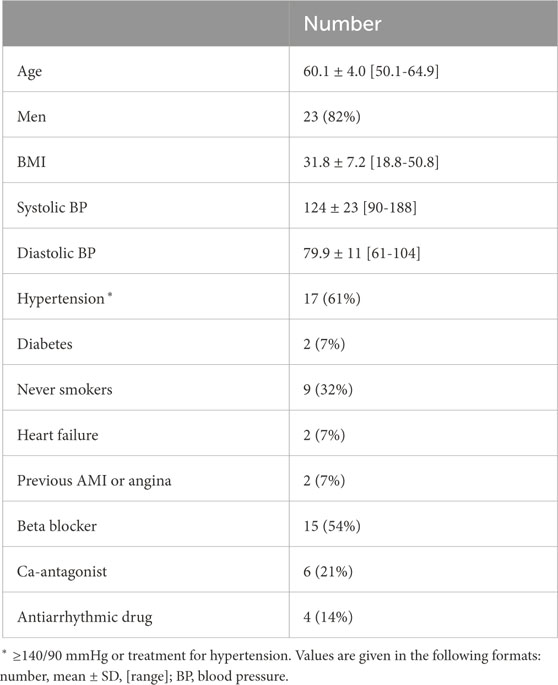
Table 1. Clinical characteristics of study population.
2.2 ECG data processing
2.2.1 Extraction of RR series
ECG preprocessing and QRS complex detection were performed using the CardioLund ECG parser (www.cardiolund.com). The CardioLund ECG parser classified QRS complexes based on their QRS morphology. Only QRS complexes with dominant QRS morphology were considered in the computation of the RR series.
The RR series were computed from intervals between R-peaks taken from consecutive QRS complexes with dominant QRS morphology, and the time of each RR interval was set to the time of the first R-peak in each interval. The resulting non-uniformly sampled RR series were interpolated to a uniform sampling rate of 4 Hz using piecewise cubic Hermite polynomials as implemented in MATLAB (‘pchip’, version R2023a, RRID:SCR_001622).
2.2.2 Estimation of atrial fibrillatory rate
The AFR was used to obtain information about the atrial arrival process. Briefly, the estimation of the AFR involved the extraction of an f-wave signal by means of spatiotemporal QRST-cancellation (Stridh and Sörnmo, 2001) and estimation of an f-wave frequency trend by fitting two complex exponential functions to the extracted f-wave signal from ECG lead V1 as proposed in (Henriksson et al., 2018). The two exponential functions were characterized by a fundamental frequency f and its second harmonic, respectively; f was fitted within the range
2.2.3 Extraction of lead-specific EDR signals
All steps of the extraction algorithm that are described in the following were applied to 1-min segments of the lead-specific EDR signals taken from a 1-min running window. The lead-specific EDR signals were computed with the slope range method (Kontaxis et al., 2020) for the eight ECG leads V1-V6, I, and II. Only eight out of 12 ECG leads were used, because the information in the leads III, aVF, aVL, and aVR can also be derived from lead I and II. The slope range method uses the peak-to-peak difference in the first derivative of the QRS complex to quantify the variations in the QRS morphology that are assumed to reflect the respiratory activity and are caused, for example, by periodic changes in electrode positions relative to the heart.
Only QRS complexes with dominant QRS morphology (cf. Section 2.2.1) were considered when applying the slope-range method. Further, a QRS complex was excluded as an outlier from analysis if the slope range value of any of the leads was outside the mean ± 3 std of the slope range values of that lead. The lead-specific non-uniformly sampled EDR signals were interpolated to a uniform sampling rate of 4 Hz using the modified Akima algorithm as implemented in MATLAB (‘makima’, version R2023a, RRID:SCR_001622). A matrix containing the resampled lead-specific EDR signals
Algorithm 1.Extraction of joint-lead EDR signals.
for all Xi in
Xi is whitened according to Eq. 1 to obtain Zi
for all τj∈[10, 40] do
obtain wj by solving the generalized eigenvalue problem of matrix pair
compute ϵ(wj, τj, Zi) according to Eq. 2
end for
end for
compute
for all Zi in
for all τj∈[10, 40] do
if ϵ(wj, τj, Zi) ≤ ϵ(wj, τj−1, Zi) ∨ τj= = 10 then
if ϵ(wj, τj, Zi) ≤ ϵ(wj, τj+1, Zi) ∨ τj= = 40 then
add τj to
end if
end if
end for
set τresp as value in
obtain wresp by solving the generalized eigenvalue problem of matrix pair
fresp,i= fs/τresp
end for
2.2.4 Extraction of joint-lead EDR signals
The joint-lead EDR signal was extracted from X using a modified version of the periodic component analysis (πCA) (Sameni et al., 2008), summarized in Algorithm 1. The matrix X was whitened for its elements to be uncorrelated and to have unit variance. The whitened lead-specific EDR signals Z were computed as
where D is the diagonal matrix of eigenvalues of the covariance matrix
The outputs of the πCA are a joint-lead EDR signal s of dimension 1 × N and its corresponding lag τ. The assumption of the πCA is that
where s(n) is the n:th element of s. We solved the generalized eigenvalue problem (GEP) of the lag-dependent matrix pair
As τ is unknown, ϵ(w, τ, Z) was minimized for all integer values of τ between 10 and 40, corresponding to respiration rates between 0.1 and 0.4 Hz. To improve the robustness of the πCA for signals with low quality, a τ* was determined in an intermediate step that corresponds to a global minimum of ϵ(w, τ, Z) over all 1-min segments in
2.2.5 Estimates from clinical data
The joint-lead EDR signal extraction from Section 2.2.4 was applied to all 1-min segments X in
2.3 Simulated data
2.3.1 Network model of the human atrioventricular node
The atrioventricular node is modeled by a network of 21 nodes (cf. Figure 1). The presented AV node model was initially proposed in (Wallman and Sandberg, 2018), updated with minor modifications in (Karlsson et al., 2021), and extended using constant scaling factors AR and AD for the refractory period and conduction delay to account for the effect of changes in autonomic modulation in (Plappert et al., 2022). The slow pathway (SP) and fast pathway (FP) are described by two chains of 10 nodes each, which are only connected at their last nodes. Impulses enter the AV node model simultaneously at the first node of each pathway. Within the pathways and between their last nodes, the impulses are conducted bidirectionally to allow for retrograde conduction. The last nodes of the two pathways are connected to an additional coupling node (CN), through which the impulses leave the model.
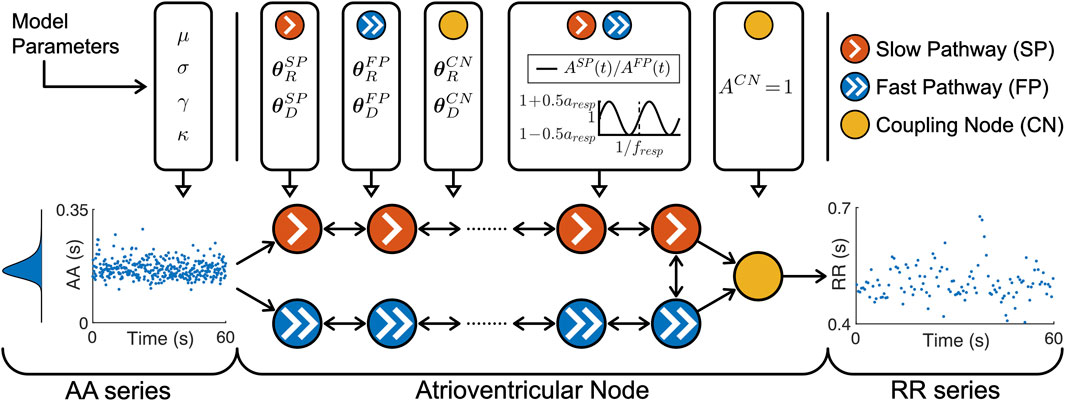
Figure 1. A schematic representation of the AV node model. Retrograde conduction was possible within the AV node model. For simplicity, only a subset of the ten nodes in each pathway is shown. Note that the atrioventricular node used different
Each node represents a section of the AV node and is characterized by an individual refractory period
Where P ∈ {SP, FP, CN} denotes the pathway. The refractory period and conduction delay are defined by fixed model parameters for the refractory period
The scaling factor AP(t) accounts for the effect of changes in autonomic modulation on the refractory period
with a constant respiratory frequency fresp and peak-to-peak amplitude aresp. The scaling factor of the refractory period and conduction delay of the CN is described by ACN = 1 and not modulated by respiration.
The electrical excitation propagation through the AV node is modeled as a series of impulses that can either be conducted or blocked by a node. An impulse is conducted to all adjacent nodes, if the interval Δtk between the k:th impulse arrival time tk and the end of the (k–1):th refractory period, computed as
is positive. Then, the time delay between the arrival of an impulse at a node and its transmission to all adjacent nodes is given by the conduction delay
The input to the AV node mode is a series of atrial impulses during AF, with inter-arrival times modeled according to a Pearson Type IV distribution (Climent et al., 2011a). The AA series is generated with a point process with independent inter-arrival times and is completely characterized by the four parameters of the Pearson Type IV distribution, namely, the mean μ, standard deviation σ, skewness γ and kurtosis κ.
The output of the AV node model is a series of ventricular impulses, where
2.3.2 Simulation of AV nodal conduction
For the training and validation, a dataset with 2 million unique parameter sets was generated. This dataset was divided into 20 datasets with 100,000 parameter sets each, where a dataset was either used for training or validation of one of ten realizations of the convolutional neural network (CNN) that is described in Section 2.4.2. Simulations were performed with each parameter set using the AV node model described in Section 2.3.1. For each simulation, a series of 11,000 AA intervals was generated using the Pearson Type IV distribution, defined by the four parameters μ, σ, γ, and κ. The parameter μ was randomly drawn from
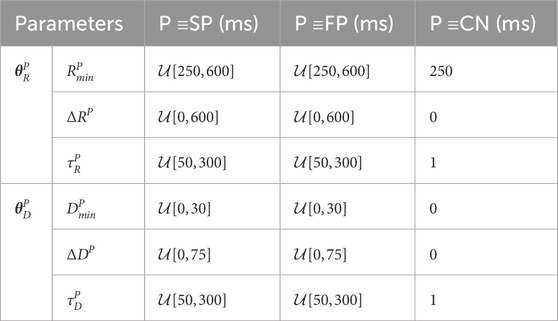
Table 2. AV Node model parameters used for simulated data.
When sampling, initially a value for aresp was drawn from a uniform distribution. To exclude non-physiological parameter sets from the dataset, we resampled the rest of the parameters until the following five selection criteria were met: 1) the slow pathway in every parameter set must have a higher conduction delay
Similar to the clinical data described in Section 2.2.1, RR series were computed from intervals between the simulated ventricular impulses, and the time of each RR interval sample was set to the time of the first ventricular impulse. The resulting non-uniformly sampled RR series were interpolated to a uniform sampling rate of 4 Hz using piecewise cubic hermite interpolating polynomials as implemented in MATLAB (‘pchip’, version R2023a, RRID:SCR_001622). The simulated RR series were cut into 1-min segments of length N = 240, resulting in RR series
2.3.3 Modelling respiratory signals
For the modeling of the respiratory signals resembling joint-lead EDR signals (cf. Section 2.2.4), we start with the underlying assumption that respiration can be described according to m(t) = sin(2πtfresp), i.e., by a sine wave oscillating at the respiratory frequency fresp. Eight identical lead-specific EDR signals
Next,
2.4 Estimation of respiratory modulation
2.4.1 Training and estimation using a linear regression model
A linear regression model is used here to estimate the peak-to-peak amplitude of respiration-induced autonomic modulation aresp. The linear regression model
2.4.2 Architecture of 1-dimensional convolutional neural network
To estimate the peak-to-peak amplitude of the respiration-induced autonomic modulation, aresp, a 1D-CNN architecture was used as illustrated in Figure 2. The CNN architecture consists of five convolution layers, where each layer l was composed of 100 1D-CNN filters with kernel size
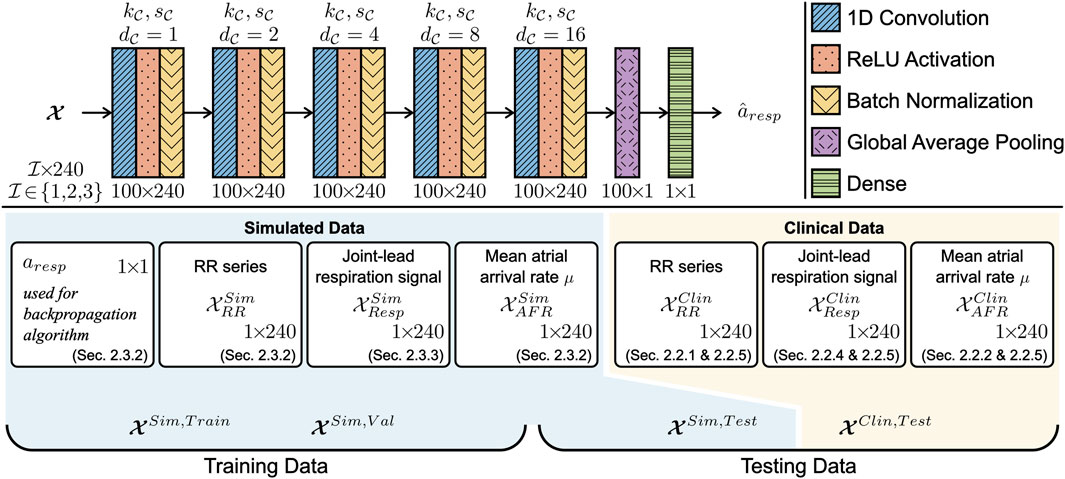
Figure 2. The CNN was composed of five 1D convolution layers with 100 filters each. The convolution layers had a kernel size
2.4.3 Training the convolutional neural network
For each CNN version, i.e.,
2.4.4 Estimation of respiratory modulation in simulated data
The performance of the CNN on simulated data was assessed for
In addition, the performance was assessed over a range of respiration frequencies fresp and characteristics of non-periodicity in the respiration signal ϵ(w, τ, Z), here denoted ϵ. To produce local RMSE estimates
In the present study, all versions of the CNN were trained and tested using 1-min segments, with one exception: An additional CNN
2.4.5 Estimation of respiratory modulation in clinical data
The CNN
3 Results
3.1 Analysis of clinical data
The length of the interpolated RR series varied between patients depending on the duration of the recordings; during normal breathing, the length of the RR series was in the range between 288 s and 328 s; during deep breathing, the length of the RR series was in the range between 57 s and 72 s. Statistics quantifying the clinical dataset are shown in Table 3. In accordance with the exclusion criteria defined in Section 2.2.5, 98 out of 120 non-overlapping 1-min segments remained in the normal breathing data and 22 out of 28 1-min segments remained in the deep breathing data. Typical examples of a clinical ECG-derived RR series
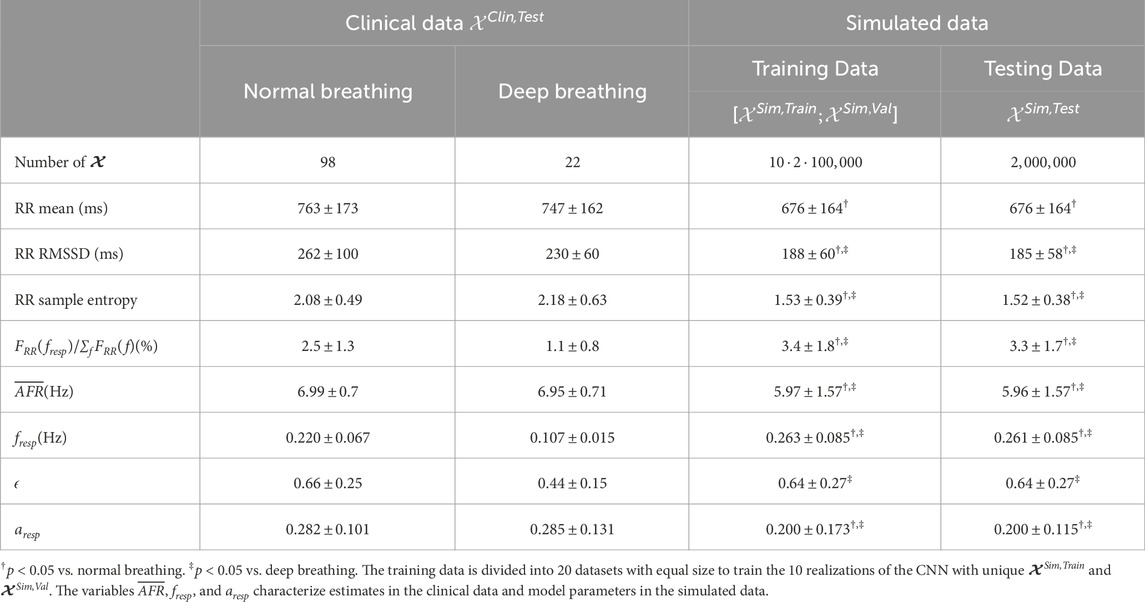
Table 3. Characteristics of clinical and simulated data.
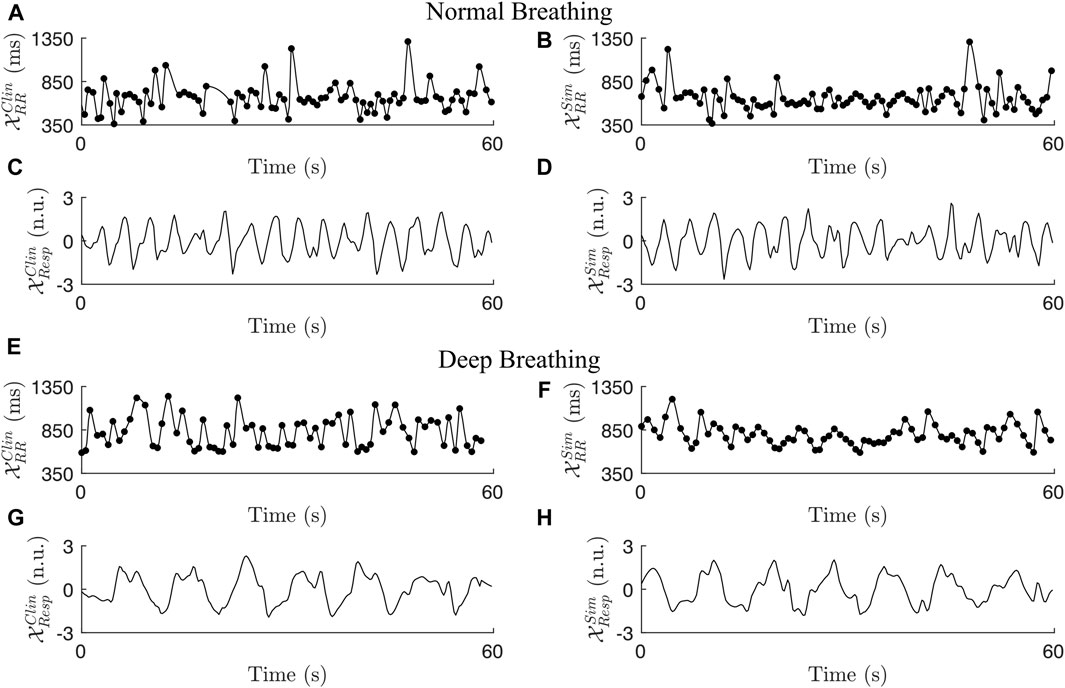
Figure 3. Two examples of clinical RR series (A + E), simulated RR series (B + F), clinical respiration signals (C + G), and simulated respiration signals (D + H) during normal breathing (A–D) and deep breathing (E–H).
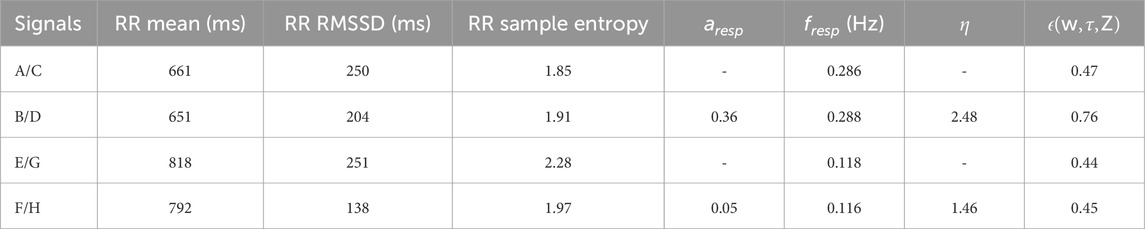
Table 4. Characteristics of the clinical and simulated examples shown in Figure 3.
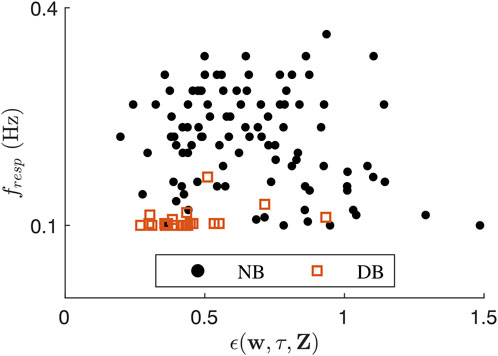
Figure 4. Scatter plot showing ϵ(w, τ, Z) over
3.2 Simulated RR series and respiration signals
The statistics quantifying
Examples of a simulated RR series
3.3 Accuracy of convolutional neural network
All CNNs
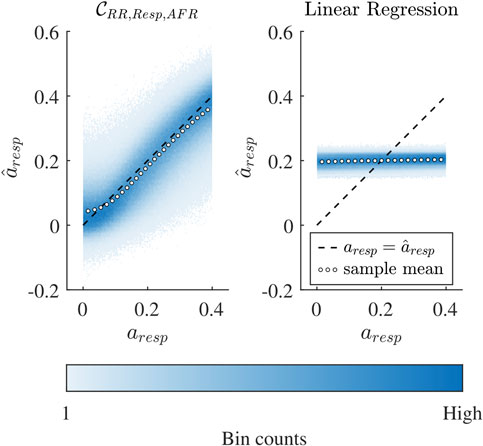
Figure 5. Binned scatter plot of estimated
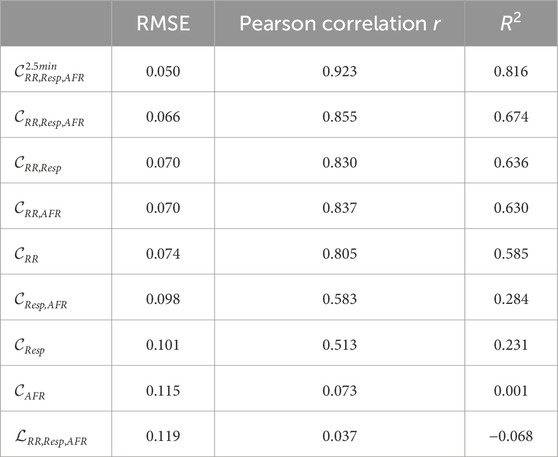
Table 5. RMSE, Pearson sample correlation and R2 of the seven CNN versions and linear regression
For
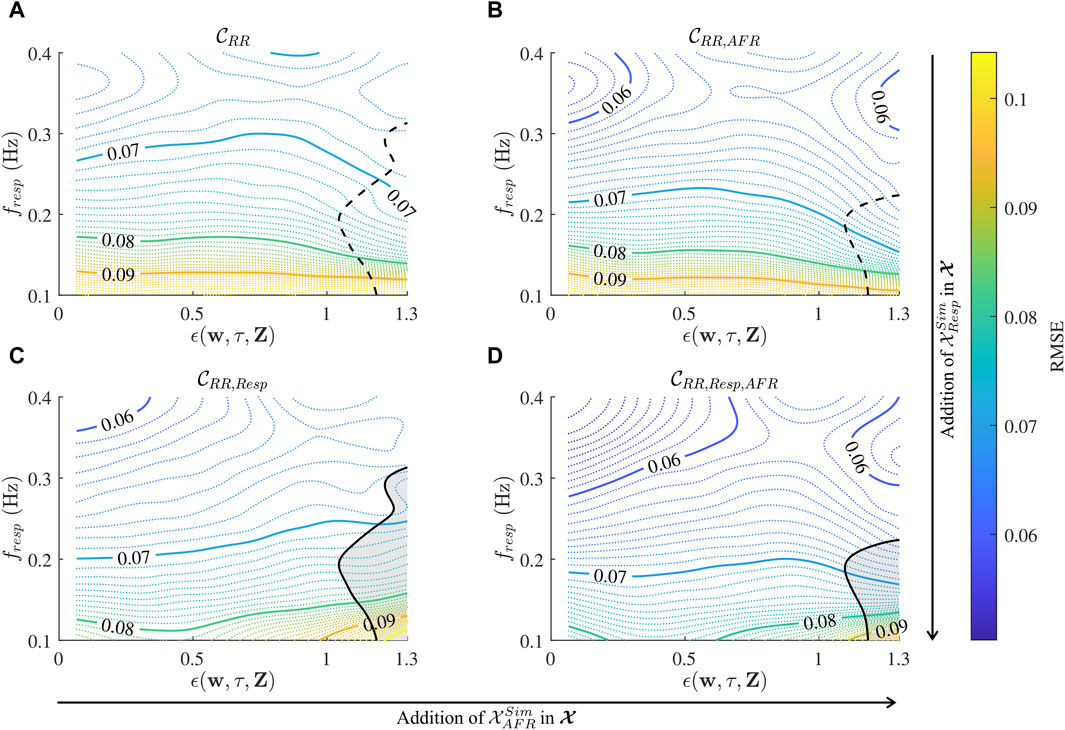
Figure 6. Contour plot of local RMSE estimates over a range of
The accuracy of the CNN improves with longer input data, indicated by the fact that the RMSE of
3.4 Estimation of respiration-induced autonomic modulation in clinical data
The CNN
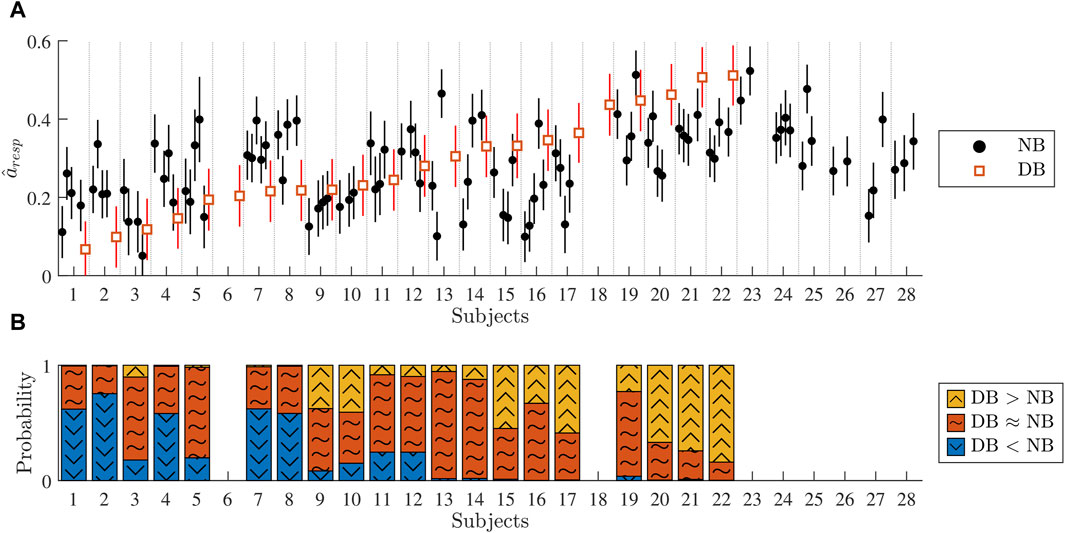
Figure 7. (A) Black dots correspond to the estimated
The vertical lines around
4 Discussion
To address the need for assessing autonomic dysfunction in patients with persistent AF, we developed a method to extract respiration-induced autonomic modulation in the AV node conduction properties from ECG data in AF. We focused on respiration-induced autonomic modulation because respiration is always present, respiration can be extracted from ECG signals, and abnormal respiration-induced autonomic modulation is often an early sign of autonomic dysfunction (Bernardi et al., 2001). To achieve this we extended our AV node model (Plappert et al., 2022) to account for respiration-induced autonomic modulation by including a time-varying scaling factor in the formulations of the AV nodal refractory period and conduction delay. We trained a 1D-CNN on simulated 1-min segments of RR series, respiration signals, and mean arrival rate of atrial impulses which replicate clinical data to estimate the peak-to-peak amplitude of respiration-induced autonomic modulation aresp. We evaluated the network on simulated data and the results indicated that aresp can be estimated with an RMSE of 0.066, corresponding to a sixth of the expected range for aresp between 0 and 0.4. Previous studies indicate that AF progression is linked to impaired baroreflex sensitivity (van den Berg et al., 2001; Field et al., 2016; Miyoshi et al., 2020; Ferreira et al., 2023; Wang et al., 2023). Additionally, in healthy subjects, the baroreflex is a major contributor to respiration-induced autonomic modulation (Piepoli et al., 1997). Together, this suggests that our proposed estimate for respiration-induced autonomic modulation, aresp, holds potential as a marker for AF progression. However, further studies are needed to confirm this relationship.
Initial results from analysis of clinical ECG data from patients in AF (cf. Figure 7A) indicate that during normal breathing,
In our previous model formulation, we accounted for the autonomic modulation by introducing constant scaling factors for the refractory period and conduction delay (Plappert et al., 2022). With the scaling of AV nodal conduction properties, it was shown that the incorporation of ANS-induced changes in the model allowed better replication of several statistical properties of clinical RR series obtained from tilt tests. In the present study, this approach was further developed by using a time-varying scaling factor AP(t) to account for respiration-induced autonomic modulation in AV nodal conduction properties based on the assumption that some degree of respiration-induced autonomic modulation generally influences RR series characteristics during AF. We model respiration-induced autonomic modulation as a joint increase in AV nodal refractoriness and conduction delay in response to exhalation and a joint decrease in AV nodal refractoriness and conduction delay in response to inhalation. It is known that respiration modulates the parasympathetic activity, where inspiration decreases vagal activity and expiration increases vagal activity (Katona et al., 1970; Russo et al., 2017). Many electrophysiological (EP) studies have demonstrated that an increase in parasympathetic activity causes an increase in AV nodal conduction delay; studies in dogs reported an increased conduction delay with vagal stimulation (Irisawa et al., 1971; Spear and Moore, 1973; Martin, 1975; Nayebpour et al., 1990; Pirola and Potter, 1990; Goldberger et al., 1999) and acetylcholine administration (Priola et al., 1983). Furthermore, an increase in parasympathetic activity with vagal stimulation in dogs has been demonstrated to increase the AV nodal refractory period (Spear and Moore, 1973; Nayebpour et al., 1990; Goldberger et al., 1999). For a decrease in parasympathetic activity with atropine, EP studies demonstrate that the AV nodal conduction delay decreases in dogs (Irisawa et al., 1971) and humans (Lister et al., 1965; Akhtar et al., 1974), and the AV nodal refractory period also decreases in humans (Akhtar et al., 1974).
The assumption that some degree of respiration-induced autonomic modulation generally influences the RR series characteristics during AF is also indicated by the fact that some AF patients display clear fluctuations in their RR series matching their respiration frequency (Rawles et al., 1989; Chandler and Trewby, 1994; Nagayoshi et al., 1997). Such fluctuations could also be seen in simulated RR series for some AV node model parameter sets. During model development, we noticed that an increase in aresp leads to an increase in the relative contribution of the respiration frequency in the frequency spectrum of the RR series with zero-mean FRR(fresp)/∑fFRR(f) and an increase in the sample entropy of the RR series. We also noticed that an increase in fresp leads to a decrease in FRR(fresp)/∑fFRR(f) and an increase in the sample entropy of the RR series. When averaging over several realizations of RR series (data not shown), FRR(fresp)/∑fFRR(f) could be clearly seen for most of the parameter sets but is usually masked in individual RR series segments by the irregularity of the RR series. Using cross-spectral analysis, no simple linear relationship has been found between respiration signal and RR series in AF patients, but a linear relationship was shown in NSR (Pitzalis et al., 1999). A possible reason for this is that the relationship between the RR series and respiration-induced autonomic modulation in AV nodal conduction properties during AF is complex and non-linear, emphasizing the need for a model-based approach. Besides some indications of fluctuations in the RR series, for most of the patients reported in (Rawles et al., 1989; Chandler and Trewby, 1994; Nagayoshi et al., 1997; Pitzalis et al., 1999; Pacchia et al., 2011) and also for the clinical data used in this study, no fluctuations in the RR series matching their respiration frequency were found. To match FRR(fresp)/∑fFRR(f) in the clinical data which was always below 7%, parameter sets with a higher relative peak spectral energy were excluded from the simulated data (criterion 5 in Section 2.3.2). The RR series characteristics of the simulated data differed significantly from both the normal breathing and deep breathing data (cf. Table 3). Simulated data with RR series characteristics more similar to the clinical data could be generated by imposing stricter exclusion criteria, e.g., increasing the lower bounds for irregularity and variability set by criteria 3 and 4 in Section 2.3.2. However, the simulated data still included signals resembling the clinical data, and the wider range of characteristics likely improved the CNN training by facilitating generalization across a broader range of RR-series. Nevertheless, it is assumed that by the sheer size of the simulated datasets and the conservative model parameter ranges, there will be simulated RR series in the dataset that resemble the clinical data.
The lead-specific respiration signals were computed using the slope range method which was designed for ECG data during AF (Kontaxis et al., 2020) and found to be one of the best performing and simplest methods for lead-specific respiration signal extraction (Varon et al., 2020). The result of the lead-specific respiration signal extraction can be improved when combining respiration signals from multiple ECG leads with a joint-lead respiration signal. Previously, the principal component analysis (PCA) has been used to extract joint-lead respiration signals from the clinical data used in this study (Abdollahpur et al., 2022). However, the principal components were sensitive to high variance noise as the PCA is based on second-order statistics. To address this issue, we developed a novel approach for robust fusion of lead-specific respiration signals based on the πCA (Sameni et al., 2008). Under the assumption that the respiration signal has a periodic structure where the respiration frequency and volume between breaths are constant, the πCA is more suitable for the extraction of joint-lead respiration signals compared to other blind-source separation methods, such as the PCA and basic independent component analysis (ICA). This is because the πCA finds the linear mixture of lead-specific respiration signals with maximal periodic structure, whereas the PCA and basic ICA are based on second-order and fourth-order statistics, respectively. We assume that the respiration frequency and volume between breaths do not vary much in 1-min segments, making the πCA a suitable approach for the extraction of short joint-lead respiration signals. However, considering that the CNN
The comparison between the CNN
In this study, we only investigate the performance of one basic CNN architecture. While some variations on this were tested during the neural network development, no extensive investigation has been performed and there is always the possibility that alternative architectures or algorithms may further increase the performance for the present task. For instance, a recent study suggests that combining the regression loss with a classification loss during training might improve regression results on imbalanced data (Pintea et al., 2023). The CNN described in this study requires the RR series for the estimation of aresp and the mean atrial arrival rate always improved the estimation. In this evaluation, however, μ was set to the correct value; we did not account for estimation errors that are most likely present in real data since AFR provides a crude estimate of the atrial arrival rate. Moreover, the addition of the respiration signal only improves the estimation when of sufficient quality as quantified by ϵ. The linear dependence between η and ϵ supports our assumption of ϵ as a marker of respiration signal quality (cf. Section 3.2). Whereas the addition of the respiration signal and mean atrial arrival rate can improve the estimation of
The performance of the CNN is dependent on fresp and ϵ (cf. Figure 6), where fresp appears to have a larger impact on the performance than ϵ. The marker of respiration signal quality ϵ was not used as an exclusion criterion for 1-min segments, because the addition of
There are several limitations of the present study. We assume for simplicity that the variations in AV nodal refractoriness are similar to the variations in AV nodal conduction delay. We also assume that the variations in AV nodal refractoriness and conduction delay are similar between SP and FP. Moreover, the model does not include phase shifts between the RR series and respiration signal for different respiration frequencies (Angelone and Coulter, 1964), or effects of respiration volume (Grossman and Taylor, 2007). Hence, a different scaling for the refractory period and conduction delay, a different scaling for the SP and FP, a phase shift between the RR series and respiration signal, and an inclusion of respiration volume might form interesting directions for future model improvements. We did not account for respiration-induced modulation in the AA series, because the modulation is small during AF (Celotto et al., 2020; Abdollahpur et al., 2022). When choosing the bounded uniform distribution of aresp for the training and testing dataset, we made a tradeoff between bias and variance. The reason why aresp was randomly drawn from
5 Conclusion
We presented an extended AV node model that accounts for respiration-induced autonomic modulation in conduction delay and refractory period. We trained a 1D-CNN to estimate the respiration-induced autonomic modulation in the AV node with simulated RR series, respiration signal, and mean atrial arrival rate which replicates clinical ECG-derived data. Using simulated data, we demonstrated that the respiration-induced autonomic modulation can be estimated using the 1D-CNN from RR series alone and that the estimation is improved when adding a respiration signal and AFR. Initial results from analysis of ECG data from 20 patients performing a deep breathing task suggest that our proposed estimate of respiration-induced autonomic modulation aresp, is reproducible and sufficiently sensitive to monitor changes and to detect individual differences. A reduced estimate of aresp may possibly indicate some degree of autonomic dysfunction. However, further studies are needed to verify the reproducibility, sensitivity, and clinical significance of aresp.
Data availability statement
The datasets presented in this article are not readily available because they are owned by SCAPIS. Requests to access the datasets should be directed toaW5mb0BzY2FwaXMub3Jn(www.scapis.org/data-access/). The code for the model together with a user example can be found at https://github.com/PlappertF/ECG-based_estimation_of_respiration-induced_autonomic_modulation_of_AV_nodal_conduction_during_AF.
Ethics statement
The studies involving humans were approved by the ethics committee at Lund University (2016/1031). The studies were conducted in accordance with the local legislation and institutional requirements. The participants provided their written informed consent to participate in this study.
Author contributions
FP: Conceptualization, Data curation, Formal Analysis, Investigation, Methodology, Software, Validation, Visualization, Writing–original draft, Writing–review and editing. GE: Writing–review and editing, Data curation. PP: Writing–review and editing, Conceptualization, Funding acquisition, Methodology. MW: Conceptualization, Funding acquisition, Methodology, Writing–review and editing, Formal Analysis, Investigation, Project administration, Supervision, Validation, Writing–original draft. FS: Conceptualization, Formal Analysis, Funding acquisition, Investigation, Methodology, Project administration, Resources, Supervision, Validation, Writing–original draft, Writing–review and editing.
Funding
The author(s) declare that financial support was received for the research, authorship, and/or publication of this article. The research was supported by the Swedish Research Council (grant VR 2019–04272), the Crafoord Foundation (grant 20200605), and the Swedish Heart-Lung foundation (no 2020-0173). The computations were enabled by resources provided by the National Academic Infrastructure for Supercomputing in Sweden (NAISS) and the Swedish National Infrastructure for Computing (SNIC) at Lund University partially funded by the Swedish Research Council through grant agreements no. 2022-06725 and no. 2018-05973. The Swedish Heart and Lung foundation was the main funding body of the SCAPIS cohort. SCAPIS was also supported by grants from the Knut and Alice Wallenberg Foundation, the Swedish Research Council, and Sweden’s Innovation agency.
Conflict of interest
The authors declare that the research was conducted in the absence of any commercial or financial relationships that could be construed as a potential conflict of interest.
Publisher’s note
All claims expressed in this article are solely those of the authors and do not necessarily represent those of their affiliated organizations, or those of the publisher, the editors and the reviewers. Any product that may be evaluated in this article, or claim that may be made by its manufacturer, is not guaranteed or endorsed by the publisher.
Supplementary material
The Supplementary Material for this article can be found online at: https://www.frontiersin.org/articles/10.3389/fphys.2024.1281343/full#supplementary-material
References
Abdollahpur M., Engström G., Platonov P. G., Sandberg F. (2022). A subspace projection approach to quantify respiratory variations in the f-wave frequency trend. Front. Physiol. 13, 976925. doi:10.3389/fphys.2022.976925
Akhtar M., Damato A. N., Caracta A. R., Batsford W. P., Josephson M. E., Lau S. H. (1974). Electrophysiologic effects of atropine on atrioventricular conduction studied by his bundle electrogram. Am. J. Cardiol. 33, 333–343. doi:10.1016/0002-9149(74)90313-0
Angelone A., Coulter N. A. (1964). Respiratory sinus arrhythmia: a frequency dependent phenomenon. J. Appl. Physiol. 19, 479–482. doi:10.1152/jappl.1964.19.3.479
Bergström G., Berglund G., Blomberg A., Brandberg J., Engström G., Engvall J., et al. (2015). The Swedish CArdioPulmonary BioImage Study: objectives and design. J. Intern. Med. 278, 645–659. doi:10.1111/joim.12384
Bernardi L., Porta C., Gabutti A., Spicuzza L., Sleight P. (2001). Modulatory effects of respiration. Auton. Neurosci. 90, 47–56. doi:10.1016/S1566-0702(01)00267-3
Billette J., Tadros R. (2019). An integrated overview of AV node physiology. Pacing Clin. Electrophysiol. 42, 805–820. doi:10.1111/pace.13734
Celotto C., Sánchez C., Mountris K. A., Abdollahpur M., Sandberg F., Laguna P., et al. (2020). Relationship between atrial oscillatory acetylcholine release pattern and f-wave frequency modulation: a computational and experimental study. Comput. Cardiol., 1–4. doi:10.22489/CinC.2020.303
Chandler S. T., Trewby P. N. (1994). Is respiratory sinus arrhythmia present in atrial fibrillation? a study using two quantitative methods. Med. Eng. Phys. 16, 334–337. doi:10.1016/1350-4533(94)90061-2
Climent A. M., Atienza F., Millet J., Guillem M. S. (2011a). Generation of realistic atrial to atrial interval series during atrial fibrillation. Med. Biol. Eng. Comput. 49, 1261–1268. doi:10.1007/s11517-011-0823-2
Climent A. M., Guillem M. S., Zhang Y., Millet J., Mazgalev T. N. (2011b). Functional mathematical model of dual pathway AV nodal conduction. Am. J. Physiol. Heart Circ. Physiol. 300, 1393–1401. doi:10.1152/ajpheart.01175.2010
Cohen R. J., Berger R. D., Dushane T. E. (1983). A quantitative model for the ventricular response during atrial fibrillation. IEEE Trans. Biomed. Eng. 30, 769–781. doi:10.1109/TBME.1983.325077
Doste R., Lozano M., Jimenez-Perez G., Mont L., Berruezo A., Penela D., et al. (2022). Training machine learning models with synthetic data improves the prediction of ventricular origin in outflow tract ventricular arrhythmias. Front. Physiol. 12, 909372. doi:10.3389/fphys.2022.909372
Engström G., Hamrefors V., Fedorowski A., Persson A., Johansson M. E., Ostenfeld E., et al. (2022). Cardiovagal function measured by the deep breathing test: relationships with coronary atherosclerosis. J. Am. Heart Assoc. 11, e024053. doi:10.1161/JAHA.121.024053
Ferreira M., Laranjo S., Cunha P., Geraldes V., Oliveira M., Rocha I. (2023). Orthostatic stress and baroreflex sensitivity: a window into autonomic dysfunction in lone paroxysmal atrial fibrillation. J. Clin. Med. 12, 5857. doi:10.3390/jcm12185857
Field M. E., Wasmund S. L., Page R. L., Hamdan M. H. (2016). Restoring sinus rhythm improves baroreflex function in patients with persistent atrial fibrillation. J. Am. Hear. Assoc. 5, e002997. doi:10.1161/jaha.115.002997
George S. A., Faye N. R., Murillo-Berlioz A., Lee K. B., Trachiotis G. D., Efimov I. R. (2017). At the atrioventricular crossroads: dual pathway electrophysiology in the atrioventricular node and its underlying heterogeneities. Arrhythm. Electrophysiol. Rev. 6, 179–185. doi:10.15420/aer.2017.30.1
Gheorghita B. A., Itu L. M., Sharma P., Suciu C., Wetzl J., Geppert C., et al. (2022). Improving robustness of automatic cardiac function quantification from cine magnetic resonance imaging using synthetic image data. Sci. Rep. 12, 2391. doi:10.1038/s41598-022-06315-3
Goldberger J. J., Kadish A. H., Johnson D., Qi X. (1999). New technique for vagal nerve stimulation. J. Neurosci. Methods. 91, 109–114. doi:10.1016/S0165-0270(99)00085-0
Grossman P., Taylor E. W. (2007). Toward understanding respiratory sinus arrhythmia: relations to cardiac vagal tone, evolution and biobehavioral functions. Biol. Psychol. 74, 263–285. doi:10.1016/j.biopsycho.2005.11.014
Hanna P., Dacey M. J., Brennan J., Moss A., Robbins S., Achanta S., et al. (2021). Innervation and neuronal control of the mammalian sinoatrial node a comprehensive atlas. Circ. Res. 128, 1279–1296. doi:10.1161/CIRCRESAHA.120.318458
Henriksson M., Corino V. D., Sörnmo L., Sandberg F. (2016). A statistical atrioventricular node model accounting for pathway switching during atrial fibrillation. IEEE Trans. Biomed. Eng. 63, 1842–1849. doi:10.1109/TBME.2015.2503562
Henriksson M., Petrėnas A., Marozas V., Sandberg F., Sörnmo L. (2018). Model-based assessment of f-wave signal quality in patients with atrial fibrillation. IEEE Trans. Biomed. Eng. 65, 2600–2611. doi:10.1109/TBME.2018.2810508
Hindricks G., Potpara T., Dagres N., Arbelo E., Bax J. J., Blomström-Lundqvist C., et al. (2020). 2020 ESC Guidelines for the diagnosis and management of atrial fibrillation developed in collaboration with the European Association for Cardio-Thoracic Surgery (EACTS): the Task Force for the diagnosis and management of atrial fibrillation of the European Society of Cardiology (ESC) Developed with the special contribution of the European Heart Rhythm Association (EHRA) of the ESC. Eur. Heart J. 42, 373–498. doi:10.1093/eurheartj/ehaa612
Inada S., Shibata N., Iwata M., Haraguchi R., Ashihara T., Ikeda T., et al. (2017). Simulation of ventricular rate control during atrial fibrillation using ionic channel blockers. J. Arrhythm. 33, 302–309. doi:10.1016/j.joa.2016.12.002
Irisawa H., Caldwell W. M., Wilson M. F. (1971). Neural regulation of atrioventricular conduction. Jpn. J. Physiol. 21, 15–25. doi:10.2170/jjphysiol.21.15
Joglar J. A., Chung M. K., Armbruster A. L., Benjamin E. J., Chyou J. Y., Cronin E. M., et al. (2023). 2023 ACC/AHA/ACCP/HRS guideline for the diagnosis and management of atrial fibrillation A report of the American college of cardiology/American heart association joint committee on clinical practice guidelines. J. Am. Coll. Cardiol. 83, 109–279. doi:10.1016/j.jacc.2023.08.017
Kaisti M., Laitala J., Wong D., Airola A. (2023). Domain randomization using synthetic electrocardiograms for training neural networks. Artif. Intell. Med. 143, 102583. doi:10.1016/j.artmed.2023.102583
Karlsson M., Sandberg F., Ulimoen S. R., Wallman M. (2021). Non-invasive characterization of human AV-Nodal conduction delay and refractory period during atrial fibrillation. Front. Physiol. 12, 728955. doi:10.3389/fphys.2021.728955
Katona P. G., Poitras J. W., Barnett G. O., Terry B. S. (1970). Cardiac vagal efferent activity and heart period in the carotid sinus reflex. Am. J. Physiol. 218, 1030–1037. doi:10.1152/ajplegacy.1970.218.4.1030
Kontaxis S., Lázaro J., Corino V. D., Sandberg F., Bailón R., Laguna P., et al. (2020). ECG-derived respiratory rate in atrial fibrillation. IEEE Trans. Biomed. Eng. 67, 905–914. doi:10.1109/TBME.2019.2923587
Lian J., Müssig D., Lang V. (2006). Computer modeling of ventricular rhythm during atrial fibrillation and ventricular pacing. IEEE Trans. Biomed. Eng. 53, 1512–1520. doi:10.1109/TBME.2006.876627
Linz D., Elliott A. D., Hohl M., Malik V., Schotten U., Dobrev D., et al. (2019). Role of autonomic nervous system in atrial fibrillation. Int. J. Cardiol. 287, 181–188. doi:10.1016/j.ijcard.2018.11.091
Lister J. W., Stein E., Kosowsky B. D., Lau S. H., Damato A. N. (1965). Atrioventricular conduction in man: effect of rate, exercise, isoproterenol and atropine on the P-R interval. Am. J. Cardiol. 16, 516–523. doi:10.1016/0002-9149(65)90028-7
Loecher M., Perotti L. E., Ennis D. B. (2021). Using synthetic data generation to train a cardiac motion tag tracking neural network. Med. Image Anal. 74, 102223. doi:10.1016/j.media.2021.102223
Malik V., Elliott A. D., Thomas G., Mishima R. S., Pitman B., Middeldorp M. E., et al. (2022). Autonomic afferent dysregulation in atrial fibrillation. JACC Clin. Electrophysiol. 8, 152–164. doi:10.1016/j.jacep.2021.10.010
Mangin L., Vinet A., Pagé P., Glass L. (2005). Effects of antiarrhythmic drug therapy on atrioventricular nodal function during atrial fibrillation in humans. Europace 7, S71–S82. doi:10.1016/j.eupc.2005.03.016
Marmerstein J. T., McCallum G. A., Durand D. M. (2021). Direct measurement of vagal tone in rats does not show correlation to HRV. Sci. Rep. 11, 1210. doi:10.1038/s41598-020-79808-8
Martin P. (1975). Dynamic vagal control of atrial-ventricular condition: theoretical and experimental studies. Ann. Biomed. Eng. 3, 275–295. doi:10.1007/BF02390973
Masè M., Marini M., Disertori M., Ravelli F. (2015). Dynamics of AV coupling during human atrial fibrillation: role of atrial rate. Am. J. Physiol. Heart Circ. Physiol. 309, H198–H205. doi:10.1152/ajpheart.00726.2014
Miyoshi M., Kondo H., Ishii Y., Shinohara T., Yonezu K., Harada T., et al. (2020). Baroreflex sensitivity in patients with atrial fibrillation. J. Am. Hear. Assoc. 9, e018019. doi:10.1161/jaha.120.018019
Nagayoshi H., Janota T., Hnatkova K., Camm A. J., Malik M. (1997). Autonomic modulation of ventricular rate in atrial fibrillation. Am. J. Physiol. Heart Circ. Physiol. 272, H1643–H1649. doi:10.1152/ajpheart.1997.272.4.H1643
Nayebpour M., Talajic M., Villemaire C., Nattel S. (1990). Vagal modulation of the rate-dependent properties of the atrioventricular node. Circ. Res. 67, 1152–1166. doi:10.1161/01.RES.67.5.1152
Ottaviani M. M., Wright L., Dawood T., Macefield V. G. (2020). In vivo recordings from the human vagus nerve using ultrasound-guided microneurography. J. Physiol. 598, 3569–3576. doi:10.1113/JP280077
Pacchia C. F., Kline G. P., Hamdan M. H., Clark K. G., Clark M. G., Smith M. L. (2011). Oscillatory vagal maneuvers produce ventricular entrainment in patients with atrial fibrillation. Clin. Auton. Res. 21, 325–332. doi:10.1007/s10286-011-0117-7
Patros M., Ottaviani M. M., Wright L., Dawood T., Macefield V. G. (2022). Quantification of cardiac and respiratory modulation of axonal activity in the human vagus nerve. J. Physiol. 600, 3113–3126. doi:10.1113/JP282994
Piepoli M., Sleight P., Leuzzi S., Valle F., Spadacini G., Passino C., et al. (1997). Origin of respiratory sinus arrhythmia in conscious humans. An important role for arterial carotid baroreceptors. Circ 95, 1813–1821. doi:10.1161/01.CIR.95.7.1813
Pintea S. L., Lin Y., Dijkstra J., van Gemert J. C. (2023). A step towards understanding why classification helps regression. 2023 IEEE/CVF Int. Conf. Comput. Vis. (ICCV), 19915–19924. doi:10.1109/ICCV51070.2023.01828
Pirola F. T., Potter E. K. (1990). Vagal action on atrioventricular conduction and its inhibition by sympathetic stimulation and neuropeptide Y in anaesthetised dogs. J. Auton. Nerv. Syst. 31, 1–12. doi:10.1016/0165-1838(90)90166-g
Pitzalis M. V., Massari F., Forleo C., Fioretti A., Colombo R., Balducci C., et al. (1999). Respiratory systolic pressure variability during atrial fibrillation and sinus rhythm. Hypertension 34, 1060–1065. doi:10.1161/01.HYP.34.5.1060
Plappert F., Wallman M., Abdollahpur M., Platonov P. G., Östenson S., Sandberg F. (2022). An atrioventricular node model incorporating autonomic tone. Front. Physiol. 13, 976468. doi:10.3389/fphys.2022.976468
Priola D. V., Curtis M. B., Anagnostelis C., Martinez E. (1983). Altered nicotinic sensitivity of AV node in surgically denervated canine hearts. Am. J. Physiol. 245, 27–32. doi:10.1152/ajpheart.1983.245.1.H27
Rashidi A., Khodarahmi I. (2005). Nonlinear modeling of the atrioventricular node physiology in atrial fibrillation. J. Theor. Biol. 232, 545–549. doi:10.1016/j.jtbi.2004.08.033
Rawles J. M., Pai G. R., Reid S. R. (1989). Paradoxical effect of respiration on ventricular rate in atrial fibrillation. Clin. Sci. 76, 109–112. doi:10.1042/cs0760109
Russo M. A., Santarelli D. M., O’Rourke D. (2017). The physiological effects of slow breathing in the healthy human. Breathe (Sheff) 13, 298–309. doi:10.1183/20734735.009817
Sameni R., Jutten C., Shamsollahi M. B. (2008). Multichannel electrocardiogram decomposition using periodic component analysis. IEEE Trans. Biomed. Eng. 55, 1935–1940. doi:10.1109/TBME.2008.919714
Sassi R., Cerutti S., Lombardi F., Malik M., Huikuri H. V., Peng C.-K., et al. (2015). Advances in heart rate variability signal analysis: joint position statement by the e-cardiology ESC working group and the European heart rhythm association co-endorsed by the asia pacific heart rhythm society. Europace 17, 1341–1353. doi:10.1093/europace/euv015
Shaffer F., Ginsberg J. P. (2017). An overview of heart rate variability metrics and norms. Front. Public Health 5, 258. doi:10.3389/fpubh.2017.00258
Shen M. J., Zipes D. P. (2014). Role of the autonomic nervous system in modulating cardiac arrhythmias. Circ. Res. 114, 1004–1021. doi:10.1161/CIRCRESAHA.113.302549
Smith L. N. (2017). Cyclical learning rates for training neural networks. 2017 IEEE Winter Conf. Appl. Comput. Vis. (WACV), 464–472. doi:10.1109/WACV.2017.58
Sološenko A., Paliakaitė B., Marozas V., Sörnmo L. (2022). Training convolutional neural networks on simulated photoplethysmography data: application to bradycardia and tachycardia detection. Front. Physiol. 13, 928098. doi:10.3389/fphys.2022.928098
Spear J. F., Moore E. N. (1973). Influence of brief vagal and stellate nerve stimulation on pacemaker activity and conduction within the atrioventricular conduction system of the dog. Circ. Res. 32, 27–41. doi:10.1161/01.RES.32.1.27
Stridh M., Sörnmo L. (2001). Spatiotemporal QRST cancellation techniques for analysis of atrial fibrillation. Ieee. Trans. Biomed. Eng. 48, 105–111. doi:10.1109/10.900266
Świt P., Pollap A., Orzeł J. (2023). Spectroscopic determination of acetylcholine (ACh): a representative review. Top. Curr. Chem. 381, 16. doi:10.1007/s41061-023-00426-9
Tan A. Y., Zhou S., Ogawa M., Song J., Chu M., Li H., et al. (2008). Neural mechanisms of paroxysmal atrial fibrillation and paroxysmal atrial tachycardia in ambulatory canines. Circ 118, 916–925. doi:10.1161/CIRCULATIONAHA.108.776203
Trayanova N. A., Popescu D. M., Shade J. K. (2021). Machine learning in arrhythmia and electrophysiology. Circ. Res. 128, 544–566. doi:10.1161/CIRCRESAHA.120.317872
van den Berg M. P., Hassink R. J., Tuinenburg A. E., van Sonderen E. F. L. P., Lefrandt J. D., de Kam P. J., et al. (2001). Quality of life in patients with paroxysmal atrial fibrillation and its predictors: importance of the autonomic nervous system. Eur. Hear. J. 22, 247–253. doi:10.1053/euhj.2001.2180
Varon C., Morales J., Lázaro J., Orini M., Deviaene M., Kontaxis S., et al. (2020). A comparative study of ECG-derived respiration in ambulatory monitoring using the single-lead ECG. Sci. Rep. 10, 5704. doi:10.1038/s41598-020-62624-5
Wallman M., Sandberg F. (2018). Characterisation of human AV-nodal properties using a network model. Med. Biol. Eng. Comput. 56, 247–259. doi:10.1007/s11517-017-1684-0
Wang D., Veltmann C., Bauersachs J., Duncker D. (2023). Antiarrhythmic effects of baroreceptor activation therapy in chronic heart failure: a case report. Eur. Hear. J. - Case Rep. 7, ytad520. doi:10.1093/ehjcr/ytad520
Wasmund S. L., Li J.-M., Page R. L., Joglar J. A., Kowal R. C., Smith M. L., et al. (2003). Effect of atrial fibrillation and an irregular ventricular response on sympathetic nerve activity in human subjects. Circ 107, 2011–2015. doi:10.1161/01.cir.0000064900.76674.cc
Weine J., van Gorkum R. J., Stoeck C. T., Vishnevskiy V., Kozerke S. (2022). Synthetically trained convolutional neural networks for improved tensor estimation from free-breathing cardiac DTI. Comput. Med. Imaging Graph. 99, 102075. doi:10.1016/j.compmedimag.2022.102075
Keywords: atrial fibrillation, atrioventricular node, autonomic nervous system dysfunction, respiration-induced autonomic modulation, convolutional neural network, deep breathing test, network model, ECG
Citation: Plappert F, Engström G, Platonov PG, Wallman M and Sandberg F (2024) ECG-based estimation of respiration-induced autonomic modulation of AV nodal conduction during atrial fibrillation. Front. Physiol. 15:1281343. doi: 10.3389/fphys.2024.1281343
Received: 22 August 2023; Accepted: 08 April 2024;
Published: 08 May 2024.
Edited by:
Fernando Soares Schlindwein, University of Leicester, United KingdomReviewed by:
Julien Oster, Institut National de la Santé et de la Recherche Médicale (INSERM), FranceCees A. Swenne, Leiden University Medical Center (LUMC), Netherlands
Copyright © 2024 Plappert, Engström, Platonov, Wallman and Sandberg. This is an open-access article distributed under the terms of the Creative Commons Attribution License (CC BY). The use, distribution or reproduction in other forums is permitted, provided the original author(s) and the copyright owner(s) are credited and that the original publication in this journal is cited, in accordance with accepted academic practice. No use, distribution or reproduction is permitted which does not comply with these terms.
*Correspondence: Felix Plappert, ZmVsaXgucGxhcHBlcnRAYm1lLmx0aC5zZQ==
†These authors share last authorship