 Cleiton A. Libardi1*
 Joshua S. Godwin2
 Tanner M. Reece3
 Carlos Ugrinowitsch4,5
 Trent J. Herda6
 Michael D. Roberts2*
- 1MUSCULAB–Laboratory of Neuromuscular Adaptations to Resistance Training, Department of Physical Education, Federal University of Sao Carlos, Sao Carlos, Brazil
- 2School of Kinesiology, Auburn University, Auburn, AL, United States
- 3Program in Physical Therapy, Washington University School of Medicine, St. Louis, MO, United States
- 4School of Physical Education and Sport, University of Sao Paulo, Sao Paulo, Brazil
- 5Department of Health Sciences and Human Performance, The University of Tampa, Tampa, FL, United States
- 6Department of Health, Sport, and Exercise Sciences, University of Kansas, Lawrence, KS, United States
Blood flow restriction applied during low-load resistance training (LL-BFR) induces a similar increase in the cross-sectional area of muscle fibers (fCSA) compared to traditional high-load resistance training (HL-RT). However, it is unclear whether LL-BFR leads to differential changes in myofibrillar spacing in muscle fibers and/or extracellular area compared to HL-RT. Therefore, this study aimed to investigate whether the hypertrophy of type I and II fibers induced by LL-BFR or HL-RT is accompanied by differential changes in myofibrillar and non-myofibrillar areas. In addition, we examined if extracellular spacing was differentially affected between these two training protocols. Twenty recreationally active participants were assigned to LL-BFR or HL-RT groups and underwent a 6-week training program. Muscle biopsies were taken before and after the training period. The fCSA of type I and II fibers, the area occupied by myofibrillar and non-myofibrillar components, and extracellular spacing were analyzed using immunohistochemistry techniques. Despite the significant increase in type II and mean (type I + II) fCSA (p < 0.05), there were no significant changes in the proportionality of the myofibrillar and non-myofibrillar areas [∼86% and ∼14%, respectively (p > 0.05)], indicating that initial adaptations to LL-BFR are primarily characterized by conventional hypertrophy rather than disproportionate non-myofibrillar expansion. Additionally, extracellular spacing was not significantly altered between protocols. In summary, our study reveals that LL-BFR, like HL-RT, induces skeletal muscle hypertrophy with proportional changes in the areas occupied by myofibrillar, non-myofibrillar, and extracellular components.
Introduction
Resistance training has been extensively documented to increase cellular and tissue-level hypertrophy in skeletal muscle (Roberts et al., 2023). Blood flow restriction applied during low-load resistance training (LL-BFR) is an effective strategy to increase the cross-sectional area of muscle fibers (fCSA) (i.e., muscle hypertrophy) (Patterson et al., 2019). Recently, we demonstrated that LL-BFR induces similar hypertrophy of type I and II fibers compared to traditional high-load resistance training (HL-RT), regardless of sex (Reece et al., 2023). Although muscle fiber hypertrophy is similar between LL-BFR and HL-RT, the differential expansion of the myofibrillar (e.g., myosin heavy chain and light chain isoforms, various actin isoforms, z-line proteins, etc.) and non-myofibrillar components (e.g., intracellular fluids, sarcoplasmic proteins and enzymes, glycogen, mitochondria, etc.) may be influenced by these different training protocols. Moreover, no study has aimed to examine if myofiber spacing is differentially affected by these training protocols.
There has been a renewed interest in examining myofibrillar adaptations to resistance training (Jorgenson et al., 2020; Roberts et al., 2020; Roberts et al., 2023). MacDougall et al. (MacDougall et al., 1982) used electron microscopy investigation to show that longer-term resistance training disproportionately increases sarcoplasmic spacing. Contrary to this finding, more recent evidence suggests traditional HL-RT typically induces a proportional expansion in the myofibrillar and non-myofibrillar areas of muscle fibers (Wang et al., 1993; Fox et al., 2021; Ruple et al., 2021; Vann et al., 2022). Additionally, an increase in myofibrillar number, but not size, has been shown to accompanies the increases in fCSA with weeks of resistance training (Jorgenson et al., 2023). However, select evidence suggests that non-myofibrillar area expansion may predominate during muscle fiber hypertrophy in resistance training protocols that diverge from traditional methods (e.g., an unconventional or very high-volume training paradigms) (Haun et al., 2019; Fox et al., 2021; Vann et al., 2022). Despite extensive research into these intracellular changes in recent years, little is known regarding how LL-BFR affects these features in muscle fibers.
To the best of our knowledge, only one study has explored the effects of LL-BFR on intracellular myofibril content. Wilburn et al. (2021) conducted a case study composed by a single exercise session in which one of the subject’s legs underwent LL-BFR, while the contralateral leg was subjected to HL-RT. Vastus lateralis muscle biopsies were obtained before and 30 min after each exercise protocol. The primary findings indicated that the LL-BFR protocol induced acute myofibrillar alterations in a wave-like pattern, likely attributed to the pouches formed by fluid accumulation in the sarcoplasm, which appeared to disrupt the linear alignment of sarcomeres. Additionally, muscle damage (i.e., Z-disc disruption, thick and thin filament rupture) was not observed to the same extent as with HL-RT. These findings suggest that, at least acutely, fluid accumulation induced by LL-BFR may cause changes in the non-myofibrillar area distinct from HL-RT. However, it remains unknown whether these acute changes demonstrated by Wilburn et al. (2021) are also observed a LL-BFR training period.
Therefore, the aim of the present study was to investigate whether the hypertrophy of type I and II fibers induced by LL-BFR or HL-RT is accompanied by differential changes in myofibrillar and non-myofibrillar areas. We additionally examined if extracellular spacing was differentially affected between these two training paradigms. We hypothesized that there would be a decrease in myofibrillar area and an increase in non-myofibrillar area with type I and II fCSA increases following LL-BFR. In contrast, we hypothesized that HL-RT would promote conventional hypertrophy, consistent with findings from previous studies (Fox et al., 2021; Ruple et al., 2021; Vann et al., 2022). Finally, we hypothesized that extracellular area would be greater following LL-BFR.
Methods
Participants
This study was a secondary analysis from a subset of participants from a study that was reviewed and approved by the institutional review board for human subjects (IRB Study no. 00147374). The study conformed to the standards set by the latest revisions of the Declaration of Helsinki and was registered as a clinical trial before the recruitment of the first participant (25 June 2021, NCT04938947). All participants read and signed an informed consent form before the start of the experimental protocol. Ten women (22 ± 5 years old, 71.1 ± 12.3 kg, 166 ± 9.1 cm, 25.8 ± 4.5 kg/m2) and 10 men (21.5 ± 2 years old, 78.4 ± 19.7 kg, 179 ± 7.3 cm, 24.4 ± 5.4 kg/m2) who were engaged in recreational activities (e.g., jogging and intramural sports), excluding resistance training, were eligible to participate in the study. All participants were free from cardiometabolic diseases or medical conditions that precluded the collection of muscle biopsies.
Experimental design
More detail regarding the experimental design can be found in our parent publication (Reece et al., 2023). Before resistance training ensued, muscle biopsies were obtained from the vastus lateralis of the right leg. Participants were then assigned to either the LL-BFR (n = 11, 5 female) group or the HL-RT (n = 9, 5 female) group. Training was performed 3 days a week for 6 weeks. Two to 7 days after the last training session, participants post-intervention muscle biopsies were obtained.
Muscle biopsies
Participants were positioned supine on a table and given a subcutaneous lidocaine (1%, 1.5 mL) injection above the skeletal muscle fascia at the collection site. After a 5-min wait for the anesthetic to take effect, a precise pilot incision was made using a sterile surgical blade. A 5-gauge Bergstrom biopsy needle, following Evans et al. (1982), was used to extract approximately 50–80 mg of skeletal muscle tissue with suction. Afterward, the harvested tissue was carefully cleaned of residual blood and connective tissue, was preserved in freezing media for histological analysis (Tissue-Tek®, Sakura Finetek Inc.; Torrance, CA, United States), frozen in liquid nitrogen-cooled isopentane, and stored at −80°C until shipment to Auburn University for sectioning and histology.
LL-BFR and HL-RT protocols
Training protocols are described in detail in Reece et al. (2023). Briefly, each session consisted of three sets of bilateral leg extensions performed to the point of muscular failure. The HL-RT consisted of 3 x 8–12 repetitions (∼80% 1RM) with a 2-min rest interval between sets. In the LL-BFR group, the participants performed three sets to failure using a constant load equivalent to 30% of their 1RM with a 1-min rest interval between sets. These participants utilized 10-cm-wide BFR cuffs (SmartTools, Strongsville, OH) applied to the proximal regions of both legs. The cuff pressure was set at 50% of each participant’s estimated arterial occlusion pressure (AOP), determined based on their thigh circumference, ranging from 100 to 180 mmHg (Loenneke et al., 2012). Cuffs remained inflated following specific instructions until the end of the final set of each training session.
Immunohistochemistry for determining fiber type and phalloidin-actin staining
Initially, the fCSA of types I and II was determined as previously described by our laboratory (Vann et al., 2020). To determine the myofibril area per fiber, F-actin labeling with Alexa Fluor 594-conjugated (AF594) phalloidin was executed in accordance with established protocols as previously described (Gokhin et al., 2008; Duddy et al., 2015; Haun et al., 2019). This staining procedure facilitated the distinction of the sarcolemma (visualized through the FITC filter) and myofibrils (observed via the Texas Red filter). Multiple 20× images section were obtained and the quantification of myofibril area per fiber was conducted utilizing ImageJ software developed by the National Institutes of Health (NIH) according to procedures previously carried out in our laboratory (Fox et al., 2021; Ruple et al., 2021; Michel et al., 2023). In brief, the image scale in ImageJ was set to 0.451 μm per pixel. Images were then separated into RGB channels, and the red channel containing phalloidin staining was converted to grayscale. The threshold function was applied to create a binary black-and-white image distinguishing stained and unstained fiber areas. Individual fibers were then outlined, and myofibril areas were expressed as a percentage of the total fiber area. These values were reported as the percentage of myofibril content within each fiber or as the total contractile protein per fiber (i.e., % myofibril per myofiber × fiber cross-sectional area). Thus, we assumed that changes in proportion of myofibril and non-myofibril of the total muscle fiber cross-section area indicated changes in the areas of the fractions. A visual representation of this image analysis is illustrated in Figure 1 of the results section. To obtain the extracellular area, type I and II fibers were imaged together with their extracellular spaces (intracellular + extracellular area). Then, total area values obtained were subtracted from the fCSA of all fibers. The resultant values were considered extracellular area. The coefficient of variation obtained from the typical error as 0.35% for the intracellular area and 0.0007% for the extracellular area.
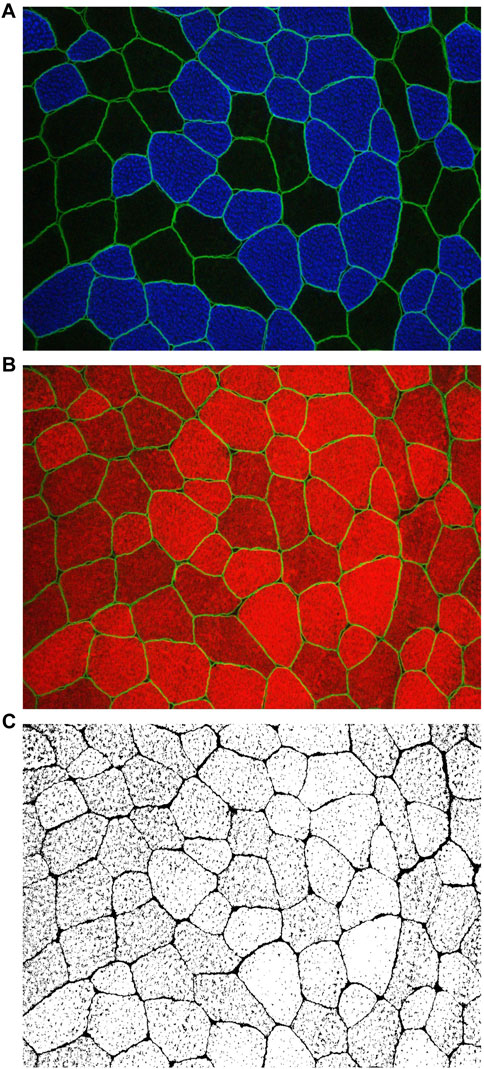
FIGURE 1. Utilizing images obtained through MyoVision software, the cross-sectional area (fCSA) of both type I and type II muscle fibers was calculated (A) Digital images were captured using a fluorescence microscope equipped with a ×20 objective lens (Nikon Instruments, Melville, NY, United States). This staining method facilitated the discrimination of type I fibers, identified by blue cell bodies (detected through the FITC filter), and type II fibers, characterized by unmarked black cell bodies. Additionally, dystrophin was stained bright green. Representative images at ×20 magnification of the phalloidin staining are presented in (B, C) ImageJ software was employed for image processing, allowing the separation of images into RGB channels. Subsequently, the red channel containing phalloidin staining (B) was converted to grayscale for further analysis (C). In (C), the myofibrillar area within myofibers is depicted in white, while non-myofibrillar area is rendered in black.
Statistical analyses
A mixed model, assuming group and time as fixed factors and subjects as a random factor, was implemented for the analysis of all variables. In the case of significant F values, a Tukey adjustment was used for multiple comparison purposes. The significance level was set at p < 0.05. In addition, the effect sizes (ES) and respective confidence intervals (CI) of the differences between the delta change (Post—Pre) of all variables in each group were calculated according to Hedges and Olkin (Hedges and Olkin, 1985). Positive and negative CIs not crossing zero (0) were considered significant (Nakagawa and Cuthill, 2007).
Results
Fiber cross-sectional area (fCSA)
There was no significant group vs. time interaction (F[1, 17] = 0.14; p = 0.71) or group main effect (F[1, 17] = 0.17; p = 0.68) for mean fCSA. However, a main effect of time was observed (F[1, 17] = 7.80; p = 0.01). Similarly, only a time effect (F[1, 16.9] = 6.02; p = 0.02) was observed for type II fCSA, with no significant group vs. time interaction (F[1, 16.9] = 1.45; p = 0.24) or group main effect (F[1, 17.4] = 0.00; p = 0.95). For type I fCSA, no effect of group (F[1, 17] = 0.22; p = 0.64), time (F[1, 17] = 2.34; p = 0.14) or group vs. time interaction (F[1, 17] = 1.15; p = 0.29) was observed. Additionally, the 95% CI of ES of the differences between delta changes for type I, type II and mean fCSA indicated no significant differences between groups (Figure 2; Figure 3). The mean and standard deviation values are presented in Table 1.
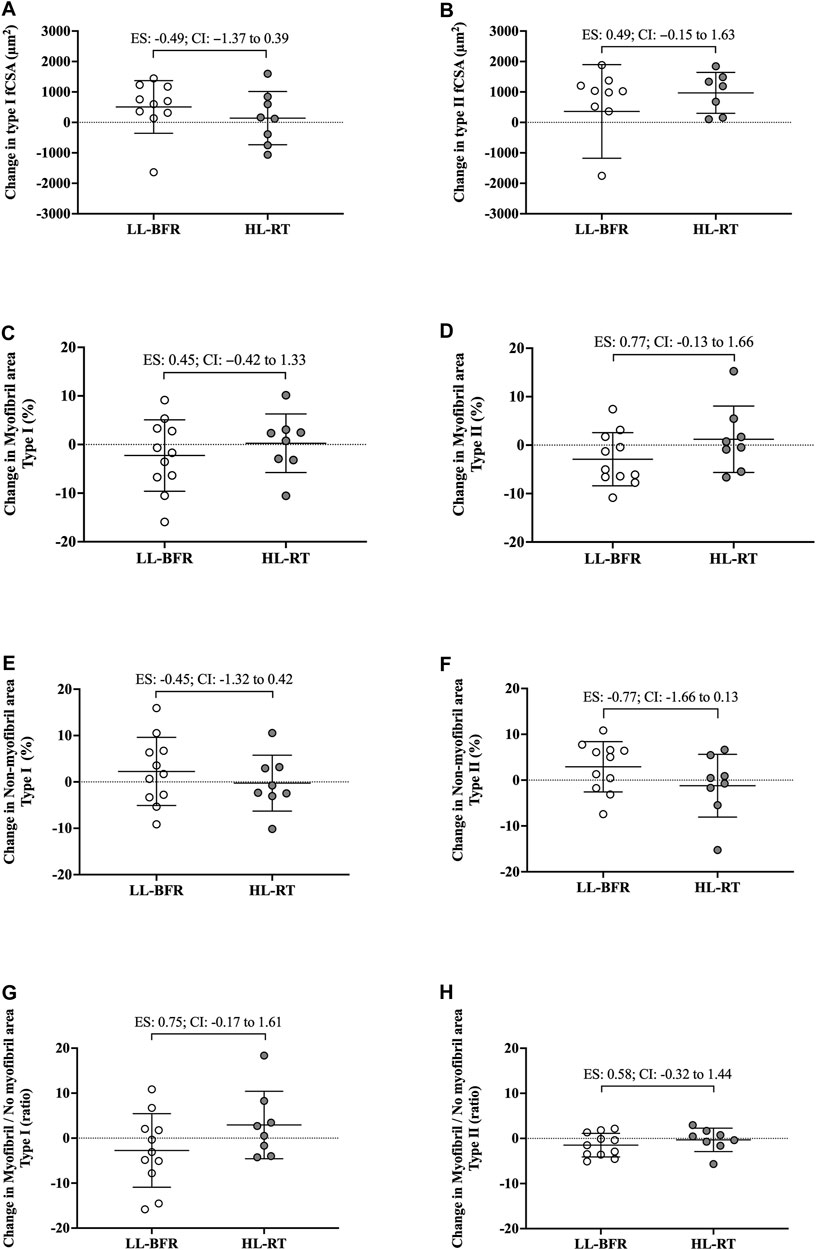
FIGURE 2. Changes in the cross-sectional area (fCSA), myofibrillar and non-myofibrillar area of type I [(A, C, E), respectively] and type II [(B, D, F), respectively] fibers and the ratio of the myofibrillar and non-myofibrillar area of type I (G) and II (H) fibers. LL-BFR: blood flow restriction applied during low-load resistance training; HL-RT, high load resistance training; ES, effect size; CI, confidence interval.
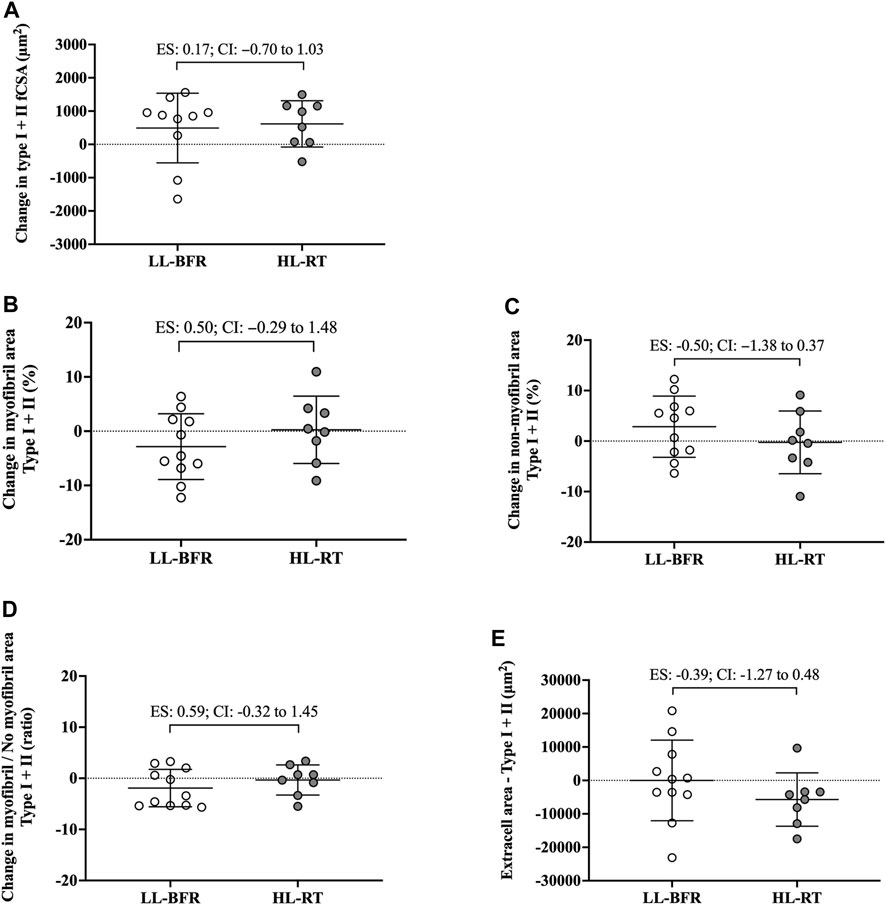
FIGURE 3. Changes in the cross-sectional area (fCSA), myofibrillar and non-myofibrillar area of type I + II fibers [(A–C), respectively], ratio of the myofibrillar and non-myofibrillar area of fibers type I + II (D) and extracellular space of type I + II fibers (E). LL-BFR: blood flow restriction applied during low-load resistance training; HL-RT, high load resistance training; ES, effect size; CI, confidence interval.
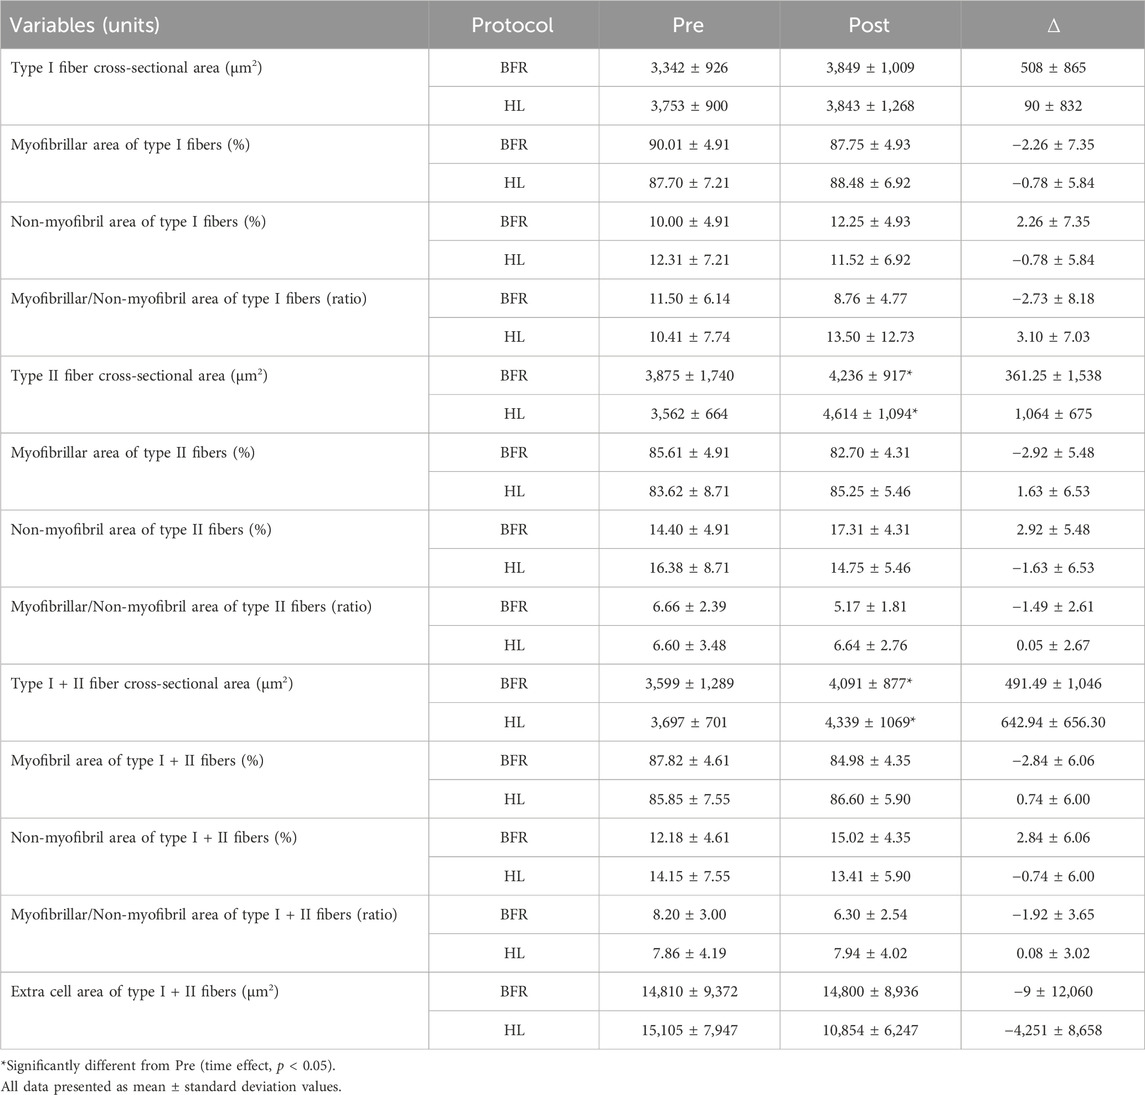
TABLE 1. Cross-sectional area and content of muscle fibers.
Myofibrillar and non-myofibrillar areas of muscle fibers
Type I fibers
No group vs. time interaction or main effect of group and time was observed for myofibrillar area (F[1, 18] = 1.02; p = 0.32; F[1, 18] = 0.13; p = 0.72; F[1, 18] = 0.24; p = 0.63, respectively), non-myofibrillar area (F[1, 18] = 1.02; p = 0.32; F[1, 18] = 0.13; p = 0.72; F[1, 18] = 0.24; p = 0.63, respectively), and myofibrillar/non-myofibrillar area ratio (F[1, 18] = 2.83; p = 0.10; F[1, 18] = 0.32; p = 0.57; F[1, 18] = 0.01; p = 0.92, respectively). Additionally, the 95% CI of ES of the differences between delta changes for myofibrillar and non-myofibrillar areas for type I fibers indicated no significant differences between groups (Figure 2; Figure 3). The mean and standard deviation values for type I fibers are presented in Table 1.
Type II fibers
No group vs. time interaction or main effect of group and time was observed for myofibrillar area (F[1, 18] = 2.88; p = 0.10; F[1, 18] = 0.01; p = 0.90; F[1, 18] = 0.23; p = 0.63, respectively), non-myofibrillar area (F[1, 18] = 2.88; p = 0.10; F[1, 18] = 0.02; p = 0.90; F[1, 18] = 0.23; p = 0.63, respectively), and myofibrillar/non-myofibrillar area ratio (F[1, 18] = 1.68; p = 0.21; F[1, 18] = 0.47; p = 0.50; F[1, 18] = 1.47; p = 0.24, respectively). The mean and standard deviation values for type II fibers are presented in Table 1. The 95% CI of ES analysis revelated no significant differences between groups for changes in myofibrillar and non-myofibrillar areas for type II fibers (Figure 2; Figure 3).
Mean fibers (type I + II)
No group vs. time interaction or main effect of group and time was observed for myofibrillar area (F[1, 18] = 1.75; p = 0.20; F[1, 18] = 0.01; p = 0.93; F[1, 18] = 0.60; p = 0.44, respectively), non-myofibrillar area (F[1, 18] = 1.94; p = 1.75; F[1, 18] = 0.01; p = 0.93; F[1, 18] = 0.60; p = 0.44, respectively), myofibrillar/non-myofibrillar area ratio (F[1, 18] = 1.73; p = 0.20; F[1, 18] = 0.23; p = 0.63; F[1, 18] = 1.46; p = 0.24, respectively) and extracellular space (F[1, 18] = 0.78; p = 0.38; F[1, 18] = 0.40; p = 0.53; F[1, 18] = 0.79; p = 0.38, respectively). Additionally, the 95% CI of ES analysis indicated no significant differences between groups for changes in myofibrillar and non-myofibrillar areas and extra cell space for mean fibers (Figure 2; Figure 3). The mean and standard deviation values are presented in Table 1.
Discussion
In this study, we employed histology techniques to investigate whether LL-BFR or HL-RT induces differential changes in the myofibrillar areas of type I and II muscle fibers and extracellular spacing. Contrary to our initial hypothesis, our findings indicate that myofibrillar and non-myofibrillar areas within muscle fibers exhibited proportional expansion in response to an increase in fCSA, independent of training protocols. Additionally, our data revealed that there was no significant change in the extracellular area surrounding muscle fibers. These observations are the first to show that shorter-term LL-BFR and HL-RT promote similar morphological changes in the muscle tissue of previously untrained males and females.
It has been suggested that skeletal muscle hypertrophy induced by mechanical overload can be attributed mainly to the proportional increase in contractile and non-contractile components of myofibers (Jorgenson et al., 2020; Roberts et al., 2023). This phenomenon has been termed conventional hypertrophy (Roberts et al., 2020). In the present study, the HL-RT group showed an increase of ∼17% in fCSA (type I + II). Notably, the myofibrillar area remained at ∼86%, while the non-myofibrillar area remained at ∼14%. These results are consistent with previous studies that estimated the area occupied by myofibrils to be ∼85% of the intracellular space (MacDougall et al., 1982; Alway et al., 1988; Claassen et al., 1989; Ruple et al., 2021). Furthermore, this proportionality appears to be maintained after an HL-RT program performed for ∼10 weeks as reported in prior research (Fox et al., 2021; Ruple et al., 2021).
Conventional hypertrophy, or the proportional increase in myofibrillar area with an increase in fCSA, has recently been challenged by studies that demonstrated sarcoplasmic expansion after some resistance training protocols. For example, Fox et al. (2021) compared traditional HL-RT with a protocol with frequent manipulation of resistance training variables (e.g., load, sets, muscle action, and rest). In contrast to what was observed after HL-RT, the protocol with variation in exercise stimulus induced an increase in the non-myofibrillar area after 16 resistance training sessions. This phenomenon was also demonstrated by Haun et al. (2019) when conducting a study with a very high volume (i.e., number of sets). Taken together, these findings suggest that unconventional training paradigms appear to induce an expansion of non-myofibrillar components (i.e., sarcoplasm). Based on these observations, as well as the acute promotion of fluid accumulation in the sarcoplasm by BFR (Wilburn et al., 2021), our hypothesis was that LL-BFR training would lead to a disproportionate increase in non-myofibrillar area with hypertrophy of type I and II fibers. However, we observed that both protocols led to conventional hypertrophy, and this could be attributed to several possible explanations. First, there is a lack of agreement between acute and chronic responses after LL-BFR. The absence of studies examining myofibrillar and non-myofibrillar components of skeletal muscle using histological techniques makes it difficult to analyze whether persistent intracellular stability after LL-BFR is a prevalent phenomenon. Despite this, some studies have indirectly investigated fluid shifts using ultrasound. In this regard, greater acute cellular swelling was observed when measuring muscle thickness at multiple time points (0 min, 15 min, 60 min, 180 min, and 48 h) following LL-BFR compared to HL-RT (Farup et al., 2015; Freitas et al., 2017). However, these differences were not observed after 16 training sessions (Farup et al., 2015). As the greater early muscle thickness for LL-BFR is unlikely to be primarily due to increased muscle damage induced by this training protocol (Patterson et al., 2019; Wilburn et al., 2021), it is plausible to suggest that the increase in intracellular or extracellular fluid following sessions may subside over time (Reidy et al., 2017). Second, evidence indicates that sarcoplasmic expansion is more frequently observed in well-trained individuals when they engage in an unconventional training regimen compared to novices (MacDougall et al., 1982; Haun et al., 2019; Fox et al., 2021). There is speculation that a threshold for the accumulation of myofibrillar proteins may develop with years of training (Roberts et al., 2020). As a result, muscle fiber hypertrophy might occur through an increase in non-contractile components, strategically preparing muscle cells for the eventual incorporation of myofibrils (Roberts et al., 2020). Hence, the phenomenon of sarcoplasmic expansion following LL-BFR may be a transient occurrence, or one primarily observed in well-trained individuals. Thus, further research is needed to add clarity in this regard.
There are notable limitations to the current study. First, is the limited number of participants. Additionally, phalloidin staining was used for extrapolating myofibril data. Notably, this technique yields a relatively crude two-dimensional rendering of myofiber characteristics and does not take into consideration three-dimensional features that may have been affected (e.g., myofibril branching) (Willingham et al., 2020). It is important to emphasize that we assessed changes in the proportion of myofibril and non-myofibril within muscle fiber cross-sectional area, and not the actual area of each fraction. Moreover, the Hornberger laboratory recently developed an immunofluorescent myofibril imaging technique using deconvolution (termed FIM-ID) that provides exceptional resolution of myofibril number and sizing (Jorgenson et al., 2023). Given that we did not preserve the current tissue accordingly to perform this technique, future examination using a similar study design and said methods are needed. Finally, the limited 18 training sessions warrants further discussion. Indeed, evidence from past shorter-term interventions suggests that 14–21 training sessions is minimally needed to reliably detect myofiber hypertrophy (Goreham et al., 1999; Damas et al., 2016; Mesquita et al., 2023), and this certainly warrants a longer-term intervention with the current training protocols. However, despite the limited training duration, interesting differences between protocols were evident. First, although the CI of ES crossed zero for all variables analyzed, data in Figure 2B show that pre-to-post intervention change scores in type II fCSA between training paradigms presented a moderate effect (ES: 0.73, CI: −0.10–1.70) whereby values were lower in the LL-BFR protocol versus HL-RT protocol (change scores were 19.9% versus 29.3%, respectively). Second, data in Figure 2D show that the pre-to-post intervention change scores in type II myofibrillar spacing between training paradigms presented a moderate effect (ES: 0.77, CI: −0.13–1.66) whereby values were lower in the LL-BFR protocol versus HL-RT protocol (change scores were −2.92% versus 1.63%, respectively). A potential interpretation of these effect sizes is that: 1) longer-term LL-BFR training may be needed to produce comparable type II fiber hypertrophy, and 2) continued type II fiber hypertrophy with LL-BFR may eventually lead to a disproportionate increase in non-myofibrillar spacing. However, given that this speculation is based on moderate effect sizes observed after 18 training sessions with multiple biopsy (acute and chronic) sampling throughout are needed.
Conclusion
In summary, the novel preliminary data demonstrate that 6 weeks of LL-BFR and HL-RT result in proportional expansion in both myofibrillar and non-myofibrillar areas, contributing to the hypertrophy of type II fibers. Given the stated limitations, longer-duration protocols with more advanced imaging techniques (e.g., three-dimensional SEM or FIM-ID) are needed to fully delineate how LL-BRF training affects cellular morphology.
Data availability statement
The original contributions presented in the study are included in the article/Supplementary Material, further inquiries can be directed to the corresponding authors.
Ethics statement
The studies involving humans were approved by the University of Kansas (IRB Study no. 00147374). The studies were conducted in accordance with the local legislation and institutional requirements. The participants provided their written informed consent to participate in this study.
Author contributions
CL: Formal Analysis, Methodology, Writing–original draft, Writing–review and editing. JG: Formal Analysis, Investigation, Methodology, Writing–review and editing. TR: Conceptualization, Investigation, Methodology, Writing–review and editing, Formal Analysis. CU: Formal Analysis, Methodology, Writing–review and editing. TH: Conceptualization, Funding acquisition, Investigation, Methodology, Resources, Supervision, Writing–review and editing. MR: Data curation, Formal Analysis, Funding acquisition, Investigation, Methodology, Resources, Supervision, Writing–original draft, Writing–review and editing.
Funding
The author(s) declare financial support was received for the research, authorship, and/or publication of this article. This work was made possible by a Master’s Level Graduate Research Grant from the National Strength and Conditioning Association (Grant ID: 1002814). Additionally, this work was supported by an NIH-funded predoctoral fellowship to TR (NIH T32007434), the São Paulo Research Foundation (#2020/13613–4 to CL), and the National Council for Scientific and Technological Development (CL Grant no. 302801/2018-9; and CU Grant no. 303085/2015-0). Article publishing charges were provided through the Auburn University School of Kinesiology.
Acknowledgments
The authors would like to thank Mackenzie N. Bohn, Catherine E. Arnold, Tera M. Hawes, Gabrielle R. Dorsen, and C. J. Cleary for their help with data collection and training.
Conflict of interest
The authors declare that the research was conducted in the absence of any commercial or financial relationships that could be construed as a potential conflict of interest.
Publisher’s note
All claims expressed in this article are solely those of the authors and do not necessarily represent those of their affiliated organizations, or those of the publisher, the editors and the reviewers. Any product that may be evaluated in this article, or claim that may be made by its manufacturer, is not guaranteed or endorsed by the publisher.
References
Alway S. E., MacDougall J. D., Sale D. G., Sutton J. R., McComas A. J. (1988). Functional and structural adaptations in skeletal muscle of trained athletes. J. Appl. Physiol. 64, 1114–1120. doi:10.1152/jappl.1988.64.3.1114
Claassen H., Gerber C., Hoppeler H., Luthi J. M., Vock P. (1989). Muscle filament spacing and short-term heavy-resistance exercise in humans. J. Physiol. 409, 491–495. doi:10.1113/jphysiol.1989.sp017509
Damas F., Phillips S. M., Libardi C. A., Vechin F. C., Lixandrao M. E., Jannig P. R., et al. (2016). Resistance training-induced changes in integrated myofibrillar protein synthesis are related to hypertrophy only after attenuation of muscle damage. J. Physiol. 594, 5209–5222. doi:10.1113/JP272472
Duddy W., Duguez S., Johnston H., Cohen T. V., Phadke A., Gordish-Dressman H., et al. (2015). Muscular dystrophy in the mdx mouse is a severe myopathy compounded by hypotrophy, hypertrophy and hyperplasia. Skelet. Muscle 5, 16. doi:10.1186/s13395-015-0041-y
Evans W. J., Phinney S. D., Young V. R. (1982). Suction applied to a muscle biopsy maximizes sample size. Med. Sci. Sports Exerc 14, 100–102. doi:10.1249/00005768-198214010-00018
Farup J., de Paoli F., Bjerg K., Riis S., Ringgard S., Vissing K. (2015). Blood flow restricted and traditional resistance training performed to fatigue produce equal muscle hypertrophy. Scand. J. Med. Sci. Sports 25, 754–763. doi:10.1111/sms.12396
Fox C. D., Mesquita P. H. C., Godwin J. S., Angleri V., Damas F., Ruple B. A., et al. (2021). Frequent manipulation of resistance training variables promotes myofibrillar spacing changes in resistance-trained individuals. Front. Physiol. 12, 773995. doi:10.3389/fphys.2021.773995
Freitas E. D. S., Poole C., Miller R. M., Heishman A. D., Kaur J., Bemben D. A., et al. (2017). Time course change in muscle swelling: high-intensity vs Blood flow restriction exercise. Int. J. Sports Med. 38, 1009–1016. doi:10.1055/s-0043-118342
Gokhin D. S., Ward S. R., Bremner S. N., Lieber R. L. (2008). Quantitative analysis of neonatal skeletal muscle functional improvement in the mouse. J. Exp. Biol. 211, 837–843. doi:10.1242/jeb.014340
Goreham C., Green H. J., Ball-Burnett M., Ranney D. (1999). High-resistance training and muscle metabolism during prolonged exercise. Am. J. Physiol. 276, E489–E496. doi:10.1152/ajpendo.1999.276.3.E489
Haun C. T., Vann C. G., Osburn S. C., Mumford P. W., Roberson P. A., Romero M. A., et al. (2019). Muscle fiber hypertrophy in response to 6 weeks of high-volume resistance training in trained young men is largely attributed to sarcoplasmic hypertrophy. PLoS One 14, e0215267. doi:10.1371/journal.pone.0215267
Jorgenson K. W., Hibbert J. E., Sayed R. K. A., Lange A. N., Godwin J. S., Mesquita P. H. C., et al. (2023). A novel imaging method (FIM-ID) reveals that myofibrillogenesis plays a major role in the mechanically induced growth of skeletal muscle. bioRxiv 2023.09.13.557204, Available at: https://doi.org/10.1101/2023.09.13.557204.
Jorgenson K. W., Phillips S. M., Hornberger T. A. (2020). Identifying the structural adaptations that drive the mechanical load-induced growth of skeletal muscle: a scoping review. Cells 9, 1658. doi:10.3390/cells9071658
Loenneke J. P., Fahs C. A., Rossow L. M., Sherk V. D., Thiebaud R. S., Abe T., et al. (2012). Effects of cuff width on arterial occlusion: implications for blood flow restricted exercise. Eur. J. Appl. Physiol. 112, 2903–2912. doi:10.1007/s00421-011-2266-8
MacDougall J. D., Sale D. G., Elder G. C., Sutton J. R. (1982). Muscle ultrastructural characteristics of elite powerlifters and bodybuilders. Eur. J. Appl. Physiol. Occup. Physiol. 48, 117–126. doi:10.1007/BF00421171
Mesquita P. H. C., Godwin J. S., Ruple B. A., Sexton C. L., McIntosh M. C., Mueller B. J., et al. (2023). Resistance training diminishes mitochondrial adaptations to subsequent endurance training in healthy untrained men. J. Physiol. 601, 3825–3846. doi:10.1113/JP284822
Michel J. M., Godwin J. S., Plotkin D. L., Mesquita P. H. C., McIntosh M. C., Ruple B. A., et al. (2023). Proteolytic markers associated with a gain and loss of leg muscle mass with resistance training followed by high-intensity interval training. Exp. Physiol. 108, 1268–1281. doi:10.1113/EP091286
Nakagawa S., Cuthill I. C. (2007). Effect size, confidence interval and statistical significance: a practical guide for biologists. Biol. Rev. Camb Philos. Soc. 82, 591–605. doi:10.1111/j.1469-185X.2007.00027.x
Patterson S. D., Hughes L., Warmington S., Burr J., Scott B. R., Owens J., et al. (2019). Blood flow restriction exercise: considerations of methodology, application, and safety. Front. Physiol. 10, 533. doi:10.3389/fphys.2019.00533
Reece T. M., Godwin J. S., Strube M. J., Ciccone A. B., Stout K. W., Pearson J. R., et al. (2023). Myofiber hypertrophy adaptations following 6 weeks of low-load resistance training with blood flow restriction in untrained males and females. J. Appl. Physiol. 134, 1240–1255. doi:10.1152/japplphysiol.00704.2022
Reidy P. T., Borack M. S., Markofski M. M., Dickinson J. M., Fry C. S., Deer R. R., et al. (2017). Post-absorptive muscle protein turnover affects resistance training hypertrophy. Eur. J. Appl. Physiol. 117, 853–866. doi:10.1007/s00421-017-3566-4
Roberts M. D., Haun C. T., Vann C. G., Osburn S. C., Young K. C. (2020). Sarcoplasmic hypertrophy in skeletal muscle: a scientific “unicorn” or resistance training adaptation? Front. Physiol. 11, 816. doi:10.3389/fphys.2020.00816
Roberts M. D., McCarthy J. J., Hornberger T. A., Phillips S. M., Mackey A. L., Nader G. A., et al. (2023). Mechanisms of mechanical overload-induced skeletal muscle hypertrophy: current understanding and future directions. Physiol. Rev. 103, 2679–2757. doi:10.1152/physrev.00039.2022
Ruple B. A., Godwin J. S., Mesquita P. H. C., Osburn S. C., Sexton C. L., Smith M. A., et al. (2021). Myofibril and mitochondrial area changes in type I and II fibers following 10 Weeks of resistance training in previously untrained men. Front. Physiol. 12, 728683. doi:10.3389/fphys.2021.728683
Vann C. G., Osburn S. C., Mumford P. W., Roberson P. A., Fox C. D., Sexton C. L., et al. (2020). Skeletal muscle protein composition adaptations to 10 Weeks of high-load resistance training in previously-trained males. Front. Physiol. 11, 259. doi:10.3389/fphys.2020.00259
Vann C. G., Sexton C. L., Osburn S. C., Smith M. A., Haun C. T., Rumbley M. N., et al. (2022). Effects of high-volume versus high-load resistance training on skeletal muscle growth and molecular adaptations. Front. Physiol. 13, 857555. doi:10.3389/fphys.2022.857555
Wang N., Hikida R. S., Staron R. S., Simoneau J. A. (1993). Muscle fiber types of women after resistance training--quantitative ultrastructure and enzyme activity. Pflugers Arch. 424, 494–502. doi:10.1007/BF00374913
Wilburn D. T., Machek S. B., Zechmann B., Willoughby D. S. (2021). Comparison of skeletal muscle ultrastructural changes between normal and blood flow-restricted resistance exercise: a case report. Exp. Physiol. 106, 2177–2184. doi:10.1113/EP089858
Keywords: vascular occlusion, myofibers, myofibrils, extracellular matrix, exercise
Citation: Libardi CA, Godwin JS, Reece TM, Ugrinowitsch C, Herda TJ and Roberts MD (2024) Effects of low-load resistance training with blood flow restriction on muscle fiber myofibrillar and extracellular area. Front. Physiol. 15:1368646. doi: 10.3389/fphys.2024.1368646
Received: 11 January 2024; Accepted: 05 February 2024;
Published: 20 February 2024.
Edited by:
J. Derek Kingsley, Kent State University, United StatesReviewed by:
Yu Lun Tai, The University of Texas Rio Grande Valley, United StatesMatthew J. Gage, University of Massachusetts Lowell, United States
Copyright © 2024 Libardi, Godwin, Reece, Ugrinowitsch, Herda and Roberts. This is an open-access article distributed under the terms of the Creative Commons Attribution License (CC BY). The use, distribution or reproduction in other forums is permitted, provided the original author(s) and the copyright owner(s) are credited and that the original publication in this journal is cited, in accordance with accepted academic practice. No use, distribution or reproduction is permitted which does not comply with these terms.
*Correspondence: Cleiton A. Libardi, Yy5saWJhcmRpQHVmc2Nhci5icg==; Michael D. Roberts, bWRyMDAyNEBhdWJ1cm4uZWR1