 Lan Wang
 Huimeng Li
 Xinyuan Guo
 Xiaoqin Wang
- 1Hubei University of Chinese Medicine, Wuhan, China
- 2Hubei Provincial Hospital of Traditional Chinese Medicine, Wuhan, China
- 3Affiliated Hospital of Hubei University of Chinese Medicine, Hubei Key Laboratory of Theory and Application Research of Liver and Kidney in Traditional Chinese Medicine, Wuhan, China
- 4Hubei Shizhen Laboratory, Wuhan, China
Background: Diabetic kidney disease (DKD), with its complex pathogenesis, is the most important cause of end-stage renal disease and has become an urgent public health problem worldwide. Heterogeneous nuclear ribonucleoprotein F (hnRNP-F) is a member of a subfamily of widely expressed nuclear heterogeneous ribonucleoproteins with biological roles in regulating gene expression and variable splicing. Some studies have investigated hnRNP-F in DKD. However, its potential mechanism in renal intrinsic cells has rarely been reported. Therefore, it is necessary to further investigate its potential mechanism in DKD in the search for novel ideas for new therapeutic targets for DKD.
Methods: In this study, hnRNP-F was overexpressed in human renal proximal tubular epithelial (HK-2) cells cultured in high-glucose conditions, while an empty vector was transfected into HK-2 cells as a control group (NC). Meanwhile, to avoid any osmotic stress that might be caused by the use of high sugar, we also added mannose as a non-osmotic control. RNA-seq was utilized to generate transcriptome data following hnRNP-F overexpression, allowing for the analysis of differential gene expression and alternative splicing events influenced by hnRNP-F overexpression. Similarly, we overexpressed hnRNP-F in mouse podocyte clone 5 (MPC5) cells and verified the relevant indicators using Western blotting (WB) under high-glucose and high-mannitol conditions, respectively. We also downloaded the CLIP-seq data of hnRNP-F in human 293T cells from the Gene Expression Omnibus (GEO) database. Through integrative analysis of RNA-seq and CLIP-seq, we tried to identify a set of potential direct targets of hnRNP-F in cells.
Results: In this study, RNA sequencing (RNA-seq) was utilized to demonstrate that the upregulation of hnRNP-F in HK-2 cells cultured under high-glucose conditions resulted in a substantial decrease in the expression of genes associated with the inflammatory response and suppression of the TNFα-NFκB signaling pathway. This was also verified in MPC5 cells. By analyzing CLIP-seq and RNA-seq data, we found that hnRNP-F may inhibit gene expression by binding to lncRNA SNHG1. Conversely, this upregulation led to a significant increase in alternative splicing events of genes implicated in DKD, such as hnRNPA2B1, OSML, UGT2B7, TRIP6, and IRF3. Combining CLIP-seq data, we found that hnRNP-F binds to and regulates variable splicing of the hnRNP protein family and splicing factors. This result suggests that hnRNP-F may regulate alternative splicing through the coordinated action of multiple splicing factors.
Conclusion: hnRNP-F has dual functions in mRNA transcriptional and post-transcriptional levels and may bind with lncRNA SNHG1 to negatively regulate the transcription of genes involved in the TNFα/NFκB signaling pathway. Meanwhile, hnRNP-F may function in the co-regulation of alternative splicing events in cells by interacting with ZFP36 to form a complex.
1 Introduction
Diabetic kidney disease (DKD) is a global public health problem and an important cause of chronic kidney disease (CKD), leading to end-stage renal disease, and urgently needs our in-depth research and effective response (Chen et al., 2020; Barrera-Chimal and Jaisser, 2020). Various factors are implicated in DKD progression, including autoimmunity, inflammation, renal fibrosis, renal hemodynamic alterations, mitochondrial dysfunction, abnormalities in glucolipid metabolism, oxidative stress, and epigenetic inheritance (Tuttle et al., 2022; Lin et al., 2018). Therefore, drugs targeting inflammatory and fibrotic pathways have important therapeutic implications in DKD research (Lytvyn et al., 2020).
Heterogeneous nuclear ribonucleoprotein F (hnRNP-F) is a subfamily of widely expressed hnRNPs. The proteins of this subfamily are RNA-binding proteins (RBPs) that interact with heterogeneous nuclear RNAs. In addition, as splicing factors, hnRNPs are involved in various aspects of RNA metabolism, including alternative splicing of target RNAs, polyadenylation, sequence editing, RNA transport, RNA stabilization and degradation, intracellular localization, and translational control (Smith et al., 2021; Huang et al., 2017; Ladd, 2016). Alternative splicing (AS) is a major mechanism for generating multiple structurally and functionally different proteins from a single gene, greatly expanding proteome diversity (Cheng et al., 2021). In humans, approximately 95% of multiexon genes undergo AS, and a recent study demonstrated that splice isoform switching is critical in the various kidney diseases, especially in DKD (Zhou et al., 2024; Liao et al., 2024).
Based on the biological role of hnRNP-F in regulating gene expression and AS, its role in DKD has gradually received attention. At present, scholars have confirmed the closer link between hnRNP-F and DKD to varying degrees in various experiments. For example, in patients with type 2 diabetes, the protein levels of hnRNP-F have significantly decreased in renal cortex tissues. It shows that hnRNP-F is involved in mediating insulin inhibition of Bcl2 modifier expression and diabetic tubulopathy (Ghosh et al., 2019). hnRNP-F protects the kidney from oxidative stress and nephropathy by stimulating Sirtuin-1 expression and signaling in diabetic mice (Ghosh et al., 2019). Overexpression of hnRNP-F attenuates TGF-β1-induced diabetic kidney injury in mice, mainly by stimulating renal Ace-2 gene expression (Lo et al., 2015). hnRNP-F was recently found to have a protective effect against podocyte injury, and hnRNP-F deficiency promotes podocyte pathology through activation of Mettl14 expression and inhibition of Sirt1 expression by its nuclear translocation (Liao et al., 2024).
In the study of DKD, HK-2 cells, as a model of human proximal tubular epithelial cells, are widely used to investigate the mechanisms of diabetes-induced tubular damage and potential therapeutic strategies (Darshi et al., 2024). In the present study, renal tubular epithelial cells (HK2) overexpressing hnRNP-F were cultured in high-glucose conditions, while a control group (NC) was similarly exposed to high-glucose. Mannitol was added to the media as an osmotic control. Subsequently, transcriptome data were acquired through RNA sequencing (RNA-seq) following the overexpression of hnRNP-F under high-glucose conditions. The expression of differentially expressed genes linked to inflammation was confirmed in both db/db and db/m mouse models. Additionally, overexpression of hnRNP-F in conditionally immortalized mouse podocyte cell line (Clone 5) (MPC5) confirmed its inhibitory effect on the TNF-α/NF-κB inflammatory signaling pathway. This approach enabled the analysis of differential gene expression and AS events influenced by the overexpression of hnRNP-F. Furthermore, the anti-inflammatory effect of hnRNP-F has been experimentally demonstrated under LPS stimulation. The results show that hnRNP-F broadly regulates gene expression and alternative splicing related to diabetic nephropathy, particularly in inflammation-related pathways, offering new insights into DKD gene regulation.
2 Materials and methods
2.1 Cell lines and cell culture
HK-2 cells (Cell Bank of China Academy of Sciences) were cultured in DMEM/F12 (Gibco) supplemented with 10% FBS (Gibco) and 1% penicillin/streptomycin (MilliporeSigma). MPC-5 cells (Procell) were maintained in RPMI 1640 (Procell) containing 10% FBS (Gibco) and 1% penicillin/streptomycin (MilliporeSigma). Both cell lines were incubated at 37 °C under 5% CO2. Upon reaching 50% confluency, cells were treated with 30 mM high-glucose (HG; MilliporeSigma) for 72 h. Mannitol (MilliporeSigma) served as an osmotic control. LPS (Solarbio) was dissolved in sterile PBS to prepare a 10-mg/mL stock solution. HK-2 cells (10 μg/mL) and MPC5 cells (45 μg/mL) were treated with these LPS solutions for 24 h to model cell injury. Cells were subsequently harvested for Western blot analysis of target protein expression.
2.2 hnRNP-F was overexpressed in HK-2 and MPC5 cell lines
We employed four parallel wells for each group of HK-2 cells: HK-2 cells transfected with the control lentivirus were cultured in a high-glucose medium containing 30 mM glucose (HG-NC) for 72 h, while a separate group of control lentivirus-transfected HK-2 cells was cultured in a medium containing 30 mM mannitol to serve as an osmotic control (OS-NC). Similarly, HK-2 cells transfected to overexpress the hnRNP-F lentivirus (Gene ID:98758, Lentiviral expression vector LV5) were maintained in a 30 mM glucose medium (HG-OE) and in a mannitol medium (OS-OE) for 72 h, respectively. MPC5 cells were cultured under HG conditions (30 mM, 72 h), mannitol treatment (30 mM, 72 h), or LPS stimulation (10 μg/mL, 24 h) and then transfected with an hnRNP-F overexpressing plasmid packaged in a lentiviral vector (Gene ID: 98758, vector name: HBLV-ZsGreen-PURO).
2.3 Reverse transcription quantitative real-time PCR (RT-qPCR)
Total RNA was isolated from the renal cortex and cells separately using the TRIzol method, and 1 μL of total RNA was used as the template, reverse-transcribed to cDNA, and continued to be amplified by using cDNA as the template, sequentially, at 95 °C for 3 min, 1 cycle, 95 °C for 10 s, and 62 °C for 40 s, for a total of 40 cycles. The mRNA levels of HG-NC and HG-OE were determined using the 2−ΔΔCT method, with β-actin and GAPDH serving as internal references. Similarly, mRNA levels in renal tissues of db/db and db/m mice were calculated. The specific primer sequences are shown in Table 1.
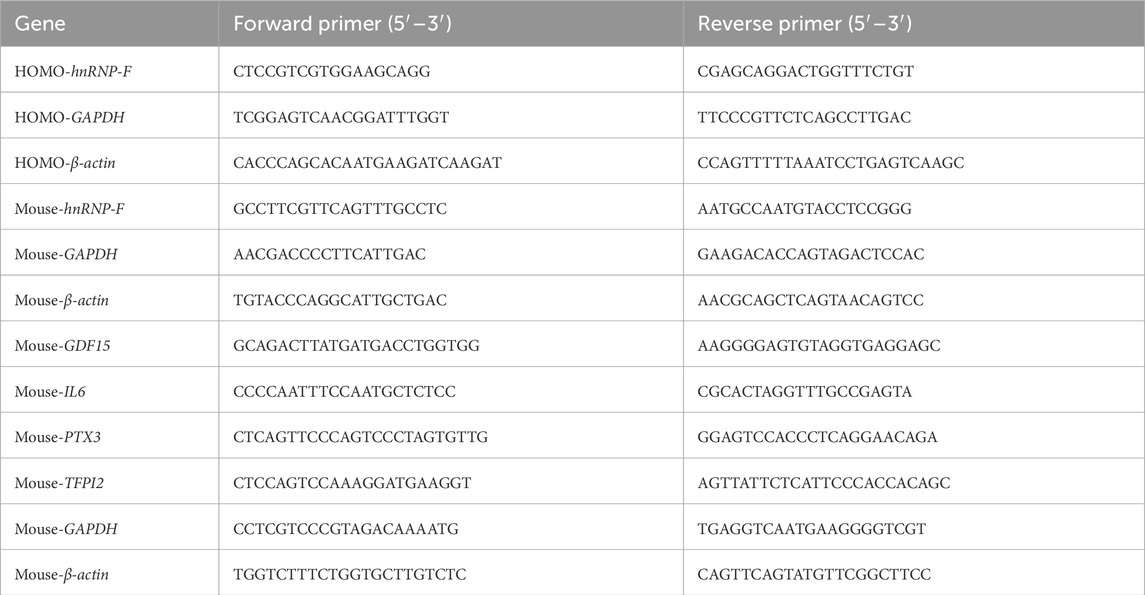
Table 1. Primer sequences for qRT-PCR.
2.4 Co-immunoprecipitation (Co-IP)
After extracting the proteins from the cells OE-hnRNP-F and the NC HK-2 cells, the lysates were pre-cleared with rabbit IgG (3 μg/mg protein) and protein A/G magnetic beads. Then, they were incubated overnight at 4 °C with anti-hnRNP-F or control IgG (3 μg/mg protein). The complexes were captured with fresh magnetic beads (20 μL/500 μL lysate, room temperature for 2 h), washed three times with lysis buffer, and eluted in 1× Laemmli buffer (95 °C, 5 min) for immunoblotting.
2.5 Western blotting analysis
Total protein lysates (30 µg/lane) from cells or renal tissues were separated by 10% SDS-PAGE and transferred to PVDF membranes (Millipore). After blocking with 5% non-fat milk/TBST for 1 hour, the membranes were incubated overnight at 4°C with the following primary antibodies:hnRNP-F, β-actin, GAPDH (1:5000; Proteintech, 67701-1-Ig, 20536-1-AP, 60004-1-Ig), p-p65 (1:500; Invitrogen, MA5-15160), p65 (1:5000; Abclonal, A19653) and TNF-α (1:1000; Abcam, ab183218). Following TBST washes (3 × 10 min), membranes were incubated 1 h with HRP-conjugated secondary antibodies: Goat anti-mouse, Goat anti-rabbit (1:1000; Proteintech, SA00001-1, SA00001-2). Signals were detected by ECL (Proteintech, P0018S) and quantified using ImageJ (NIH, v1.53e), normalized to β-actin/GAPDH.
2.6 RNA extraction and sequencing
All RNA was processed with RQ1 DNase (Promega) to remove DNA. The quality and quantity of the purified RNA were determined by measuring the absorbance at 260 nm/280 nm (A260/A280) utilizing SmartSpec Plus (BioRad). RNA integrity was further verified by 1.5% agarose gel electrophoresis.
For each sample, 1 μg of total RNA was used for RNA-seq library preparation. mRNAs were captured by VAHTS mRNA capture beads (Vazyme, N401). The purified RNA was treated with RQ1 DNase (Promega) to remove DNA before being used for directional VAHTS with a Universal V8 RNA-seq Library Prep Kit for Illumina (NR605). Polyadenylated mRNAs were purified and fragmented. Fragmented mRNAs were converted into double-stranded cDNA. Following end repair and A tailing, the DNAs were ligated to Adapter (N323). After purification of the ligation product and size fractioning to 300–500 bps, the ligated products were amplified and purified, then quantified and stored at −80 °C before sequencing. The strand marked with dUTP (the second cDNA strand) is not amplified, allowing strand-specific sequencing.
For high-throughput sequencing, the libraries were prepared following the manufacturer’s instructions and applied to an Illumina NovaSeq 6000 system for 150-nt paired-end sequencing.
2.7 RNA-seq raw data cleaning and alignment
First, raw reads containing more than 2-N bases were discarded. Then, adapters and low-quality bases were trimmed from raw sequencing reads using FASTX-Toolkit (Version 0.0.13). The short reads less than 16 nt were dropped as well. Afterward, clean reads were aligned to the GRCh38 genome by HISAT2 (Kim et al., 2015), allowing four mismatches. Uniquely mapped reads were used for gene read number counting and FPKM calculation (fragments per kilobase of transcript per million fragments mapped) (Trapnell et al., 2010).
2.8 Differentially expressed genes (DEG) analysis
The R Bioconductor package DESeq2 was applied to screen out the differentially expressed genes (DEGs) (Love et al., 2014). The P-value for correction <0.05 and fold change ≥2 or ≤0.5 were set as the cut-off criteria for identifying DEGs.
2.9 Batch effect correction and quality control
To minimize potential batch effects and technical variability in RNA-seq data, we applied ComBat_seq, an empirical Bayes method implemented in the “suva” R package, to adjust for known batch information across samples while preserving biological variance. Prior to batch correction, principal component analysis (PCA) was performed to visualize sample clustering and assess batch-related variation. After correction, PCA and hierarchical clustering confirmed improved consistency within experimental groups.
2.10 Alternative splicing analysis
The AS events and regulated alternative splicing events (RAS) between OE-hnRNP-F and NC samples were defined and quantified by using the splice sites usage variation analysis (SUVA) pipeline as described previously. Differential splicing of each pair of cells was analyzed. The frequency and reads proportion of the SUVA AS event (pSAR) of each AS event were calculated. For alternative splicing validation, we performed RT-qPCR on independent samples (n = 3 biological replicates) to confirm SUVA predictions, reporting both p-values and AS ratios in supplementary GraphPad data.
2.11 Functional enrichment analysis
In order to sort out functional categories of DEGs, Gene Ontology (GO) terms and KEGG pathways were identified using the KOBAS 2.0 server (Xie et al., 2011). The hypergeometric test and the Benjamini–Hochberg FDR controlling procedure were used to define the enrichment of each term.
2.12 Gene set enrichment analysis (GSEA)
GSEA is an analytical method for genome-wide expression profile microarray data. By comparing genes with predefined gene sets, it can identify functional enrichment. A gene set means a group of genes sharing localization, pathways, functions, or other features. GSEA was conducted using the clusterProfiler package (version 4.6.2). The fold change of gene expression between the Mets group and the Primary group was calculated, and the gene list was generated in accordance with the change of |log2FC|. Afterward, we utilized GSEA-based enriched HALLMARK gene sets of the Molecular Signature Database.
2.13 CLIP-seq data analysis
Public sequence data files of CLIP-seq data of hnRNP-F in human 293T cells from GSE34993 were downloaded from the Sequence Read Archive (SRA). After reads were aligned onto the genome, only uniquely mapped reads were used for the following analysis. The “ABLIRC” strategy was used to identify the binding regions of RBP on the genome (Xia et al., 2017). Reads with at least 1-bp overlap were clustered as peaks. For each gene, computational simulation was used to randomly generate reads with the same number and lengths as reads in peaks. The output reads were further mapped to the same genes to generate random max peak heights from overlapping reads. The whole process was repeated 500 times. All the observed peaks with heights higher than those of random max peaks (*P < 0.05) were selected. The target genes of hnRNP-F were finally determined by the peaks, and the binding motifs were called by HOMER software (Heinz et al., 2010).
2.14 Other statistical analyses
Principal component analysis (PCA) was performed by the R package factoextra (https://cloud.r-project.org/package=factoextra) to show the clustering of samples with the first two components. After controlling the reads by tags per million TPM) of each gene in samples, an in-house script (sogen) was used for visualization of next-generation sequence data and genomic annotations. The pheatmap package (https://cran.r-project.org/web/packages/pheatmap/index.html) in R was used to perform the clustering based on Euclidean distance.
2.15 Animal experiments
Seven-week-old male db/db mice (C57BLKS/J background, 12 weeks old, mean body weight: 45.2 ± 3.1 g) and their db/m littermates were purchased from GemPharmatech Co., Ltd. (Chengdu, China) and maintained in the specific pathogen-free (SPF) animal facility at Hubei University of Chinese Medicine (Wuhan, China). All experimental procedures involving animals were performed in strict compliance with the institutional guidelines and approved by the Animal Ethics Committee of Hubei University of Chinese Medicine (Approval No. HUCMS00303837). DKD modeling success was defined by (1) fasting blood glucose ≥16.7 mmol/L for three consecutive tests, (2) urine output >150% of controls, and (3) persistent proteinuria (Wang et al., 2021).
2.16 Statistical analysis
All results are presented as the average value plus or minus the standard deviation (SD). Statistical analyses were performed using GraphPad Prism 10.1.2 software (GraphPad, San Diego, CA). Differences between experimental groups were evaluated using either a paired two-tailed Student’s t-test or one-way ANOVA followed by Bonferroni’s post hoc test for multiple comparisons. A P-value of ≤0.05 was considered statistically significant.
3 Results
3.1 Effect of high-glucose on hnRNP-F protein level in HK2 cells
In cells treated under normal glucose and hypertonic conditions, there was no significant difference in hnRNP-F protein levels between the two groups (P > 0.05). However, in HK-2 cells cultured with HG concentrations, hnRNP-F levels were significantly reduced (**P < 0.01) (Figures 1A–C). Western blot analysis demonstrated that high-glucose downregulated hnRNP-F expression. Mannitol, used as an osmotic control, exhibited no significant effect on hnRNP-F gene expression. Consistent with protein-level observations, RT-qPCR confirmed significant upregulation of hnRNP-F mRNA in high-glucose-treated HK-2 cells (*P < 0.05 vs. control) (Figures 1D,E), while treatment with equiosmolar mannitol showed no comparable effect (P > 0.05).
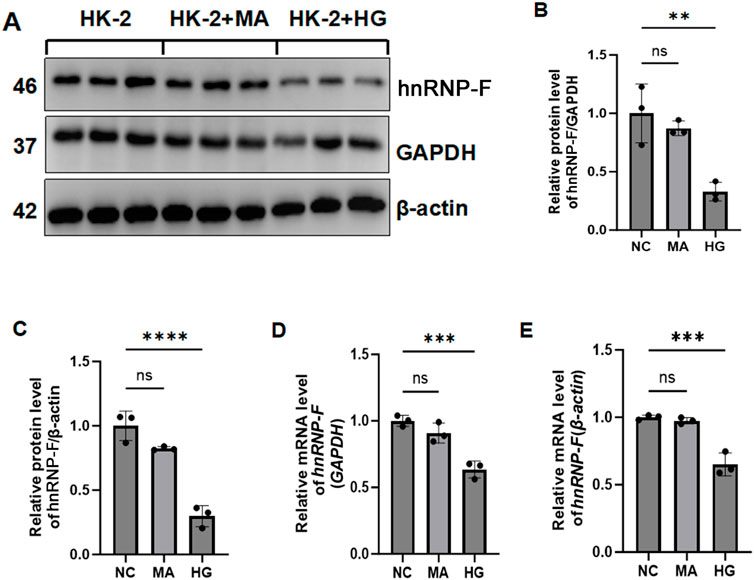
Figure 1. hnRNP-F expression in HK-2 cells under HG and hyperosmotic conditions. (A) Representative immunoblots of hnRNP-F protein in Con, Normal glucose (5.5 mM); HG, High-glucose (30 mM); Man, Hyperosmotic control (mannitol, 30 mM). (B,C) Quantitative analysis of hnRNP-F protein normalized to GAPDH or β-actin. (D,E) hnRNP-F mRNA levels normalized to GAPDH or β-actin by RT-qPCR. Error bars represent mean ± SEM. Statistical comparisons were performed using one-way ANOVA with post hoc tests; **P < 0.01, ***P < 0.001, ****P < 0.0001; ns: not significant.
3.2 Overexpression of hnRNP-F regulates gene expression in high-glucose-treated renal tubular epithelial cells
Overexpression of hnRNP-F was constructed in HK2 cells cultured in a HG environment. qPCR results showed that hnRNP-F gene expression levels were upregulated in HK-2 cells after infection with overexpression of the hnRNP-F lentivirus (Figure 2A). To comprehensively investigate the hnRNP-F-mediated transcriptional regulation in high-glucose (HG) conditions, we constructed cDNA libraries prepared from control and hnRNP-F-overexpression cells (three biological replicates), which were incubated in high-glucose and mannitol. After removing adapters and contaminating sequences, we obtained a total of 742.7 million high-quality reads from each sample (Supplementary Table S2). Approximately 91.2%–96.39% paired-end reads per sample were then aligned to the human GRCH38 genome. RNA-seq yielded robust expression for 18,051 genes (Supplementary Table S3). PCA was carried out and revealed excellent clustering of expression gene changes between the OE-hnRNP-F HK-2 cells and control samples for different treatment conditions (Figure 2B). To evaluate the dynamics of gene expression between OE-hnRNP-F vs. Ctrl cells, we compared expression among all pairwise combinations of the samples using DESeq2 (Love et al., 2014).
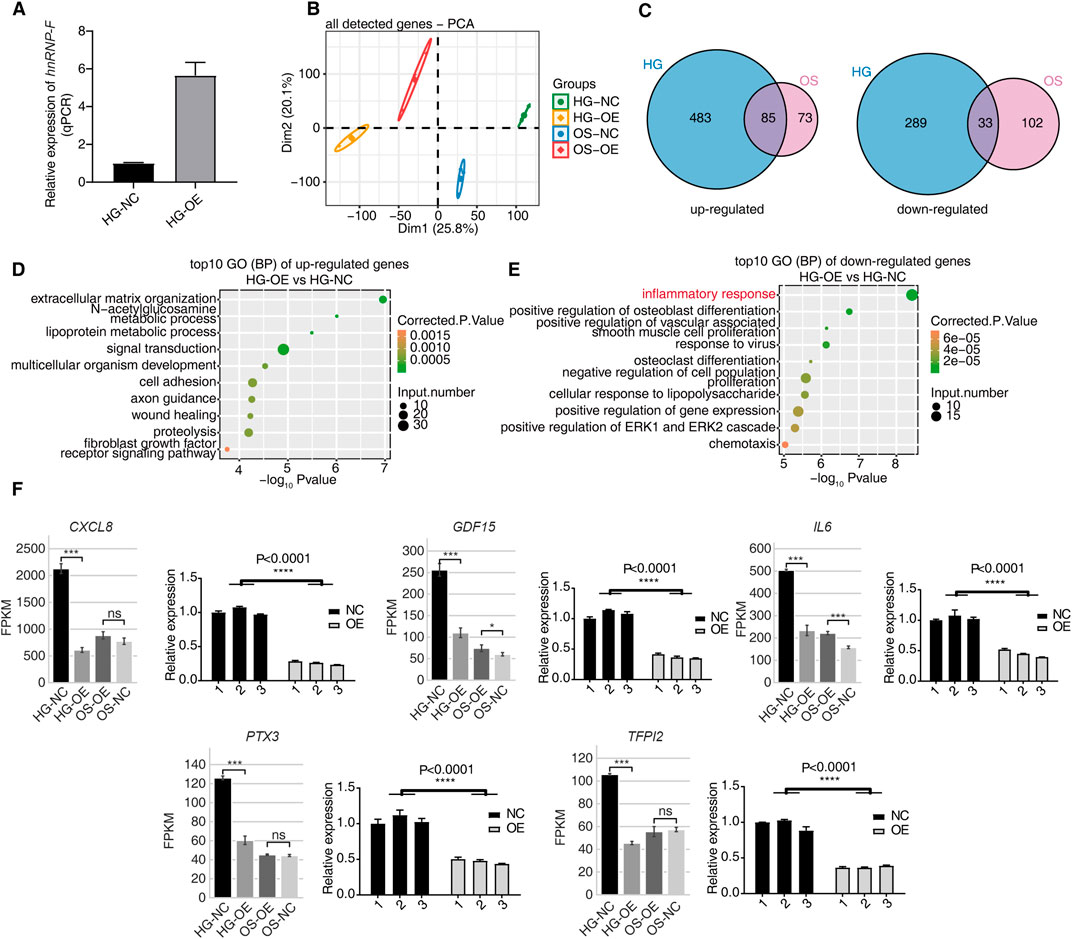
Figure 2. hnRNP-F regulates gene expression in HK-2 cells. (A) Verification of hnRNP-F mRNA expression in OE-hnRNP-F and NC HK2 cells under high-glucose conditions (HG-NC vs. HG-OE) using RT-qPCR. (B) Principal component analysis (PCA) of all samples based on normalized gene expression levels, showing clustering of HG-NC, HG-OE, OS-NC, and OS-OE groups. (C) Venn diagrams showing the overlap of differentially expressed genes (DEGs) between high-glucose (HG) and osmolality-control (OS) conditions. Left: upregulated genes; right: downregulated genes. (D) Dot plot displaying the top 10 enriched Gene Ontology (GO) biological process (BP) terms among upregulated genes in HG-OE vs. HG-NC. (E) Dot plot displaying the top 10 enriched GO biological process (BP) terms among downregulated genes in HG-OE vs. HG-NC. (F) Expression profiles of selected inflammation-related DEGs (CXCL8, GDF15, IL6, PTX3, and TFPI2) across four groups, shown as FPKM values from RNA-seq (left) and validated by RT-qPCR (right). Error bars represent mean ± SEM. Statistical comparisons were performed using one-way ANOVA with post hoc tests; *P < 0.05, **P < 0.01, ***P < 0.001, and ****P < 0.0001; ns, not significant.
OE-hnRNP-F affects many gene expressions under HG conditions. A total of 890 DEGs were obtained (P-value of <0.05, fold change ≥2, or ≤0.5, FDR ≤0.05), of which 568 genes were upregulated and 322 genes were downregulated (Supplementary Table S4). Mannitol treatment was found to affect the expression of some genes (Supplementary Table S5), while the number of DEGs was larger in HK-2 cells treated with high-glucose than in HK-2 cells treated with mannitol. A Venn diagram illustrating the profiles of DEGs reveals an overlap between glucose and mannitol treatment (Figure 2C). This analysis displays unique and overlapping sets of DEGs in hnRNP-F overexpressing cells under HG treatment. Venn diagram analysis revealed an intersection of 118 genes between the high-glucose-treated and mannitol-treated OE-hnRNP-F HK-2 cells. Mannitol did not drastically affect overall gene expression when used as an osmolar control treatment.
To correlate the hnRNP-F-regulated gene expression and biological functions under high-glucose, we subjected all 890 DEGs to GO annotation (Supplementary Tables S6, S7). In the biological processes (BPs) of GO analysis, the upregulated genes in the OE-hnRNP-F samples were highly enriched in the “extracellular matrix organization” and “cell adhesion” processes (Figure 2D). The downregulated genes were mainly enriched in the inflammatory response and other related biological processes, as well as “regulation of insulin secretion,” “response to ischemia,” “regulation of insulin secretion,” positive regulation of angiogenesis,” and “response to hypoxia,” which are closely related to the pathogenesis of DKD (Figure 2E; Supplementary Table S7). Among these, the decreased expression of inflammation-related genes was of particular interest. Representative genes from inflammatory-related genes (CXCL8, IL6, GDF15, PTX3, and TFPI2) were selected for RT-qPCR validation of their mRNA levels. CXCL8 and IL6 were found to be enriched in the tumor necrosis factor pathway (Supplementary Table S6). KEGG pathway enrichment analysis was also performed (Supplementary Figures S1A,B; Supplementary Table S8). The downregulated genes were also enriched in the TNF signaling pathway (Supplementary Figure S1B). The GO enrichment pathway of differentially expressed genes following mannitol treatment in HK-2 cells with hnRNP-F overexpression differs from that observed under HG conditions (Supplementary Figures S1C,D). Compared with HK-2 cells treated with HG and transfected with the empty vector (HG-NC group), overexpression of hnRNP-F could significantly downregulate the expression of CXCL8, IL6, GDF15, PTX3, and TFPI2 (****P < 0.0001). The qPCR results were consistent with RNA sequencing data (Figure 2F). The primers are listed in Supplementary Table S1. In the hyperosmotic mannitol control condition, the overexpression of hnRNP-F resulted in the significant downregulation of only two genes, IL6 and GDF15. This suggests that the upregulation of hnRNP-F under normoglycemic conditions did not exert any significant effect. However, under hyperglycemic conditions, it led to a marked reduction in the expression of genes associated with the inflammatory response, particularly those involved in the TNF signaling pathway and the pathogenesis of DKD.
3.3 Overexpression of hnRNP-F downregulates the transcription of genes involved in the TNF signaling pathway under HG conditions
We performed GSEA of genes differentially expressed upon hnRNP-F overexpression under high-glucose. The overexpression of hnRNP-F resulted in a significant inhibition of the TNFα/NFκB signaling pathway (Figure 3A). As demonstrated in Figure 3B, the upregulation of hnRNP-F resulted in a notable decrease in the expression of PTX3 and IL6, both of which are genes associated with the TNFα/NFκB signaling pathway. Even in the hypertonic control of mannitol, overexpression of hnRNP-F inhibited the expression of these genes. The findings indicated that the upregulation of hnRNP-F suppressed the transcription of genes associated with the TNF signaling pathway, such as CXCL8, IL6, and PTX3.
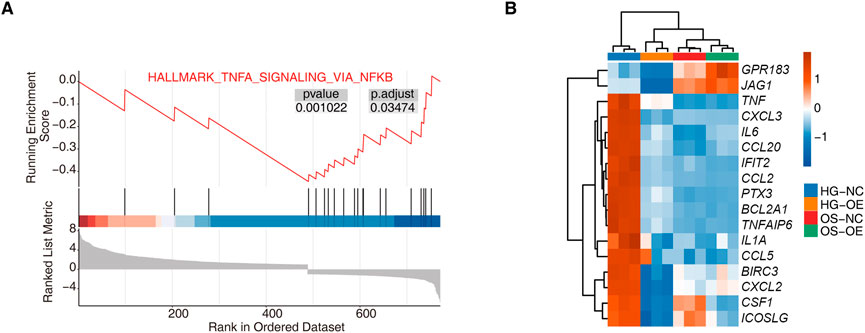
Figure 3. GSEA analysis for hnRNP-F overexpression in HK-2 cells. (A) Enrichment plot from gene set enrichment analysis (GSEA) showing significant negative enrichment of TNFα signaling via the NFκB pathway (HALLMARK_TNFα_SIGNALING_VIA_NFκB) in the HG-OE vs. the HG-NC group. (B) Hierarchical clustering heatmap showing the expression levels of TNFα/NFκB pathway-related genes across four sample groups: HG-NC, HG-OE, OS-NC, and OS-OE. Red and blue represent relative up- and downregulation, respectively.
3.4 Identification that hnRNP-F regulates alternative splicing events in HK-2 cells under high-glucose conditions
Given the multi-functional nature of hnRNP-F as an RNA-binding protein, our analysis also encompasses the impact of hnRNP-F on the regulation of AS events. We obtained a total of 125 million uniquely mapped reads from each sample, in which 33.15%–44.04% were junction reads (Supplementary Table S2). We analyzed the RNA-seq data using the software SUVA (9). Our analysis revealed the presence of distinct alternative splicing events (ASEs) and regulated alternative splicing events (RASEs) among the OE-hnRNP-F and control cells in the HG and mannitol-treated groups. Specifically, alt3p and alt5p were the main ASEs and RASEs between OE-hnRNP-F and control cells (Figure 4A; Supplementary Figure S3A; Supplementary Table S9. The SUVA-identified ASEs corresponded to the classical ASEs. hnRNP-F overexpression processing in HG cultured HK-2 cells resulted in a large number of differential variable splicing events, with a total of 1,158 significant RASEs detected. The main variable splicing event types included 65 3pMXE, 66 5pMXE, 230 A3SS, 27 A3SS&ES, 177 A5SS, 52 A5SS&ES, 261 ES, 4 IntronR, 67 MXE, and 209 cassette exons (Figure 4B; Supplementary Table S9). Mannitol treatment mainly affects the AS events of A3SS and ES (Supplementary Figure S3B; Supplementary Table S9). Figure 3C illustrates the presence of novel splicing events among the RASEs under HG conditions, a finding that aligns with the results observed following mannitol treatment (Supplementary Figure S3C). These findings suggest that the overexpression of hnRNP-F can modulate intracellular alternative splicing in response to hypertonic treatment conditions.
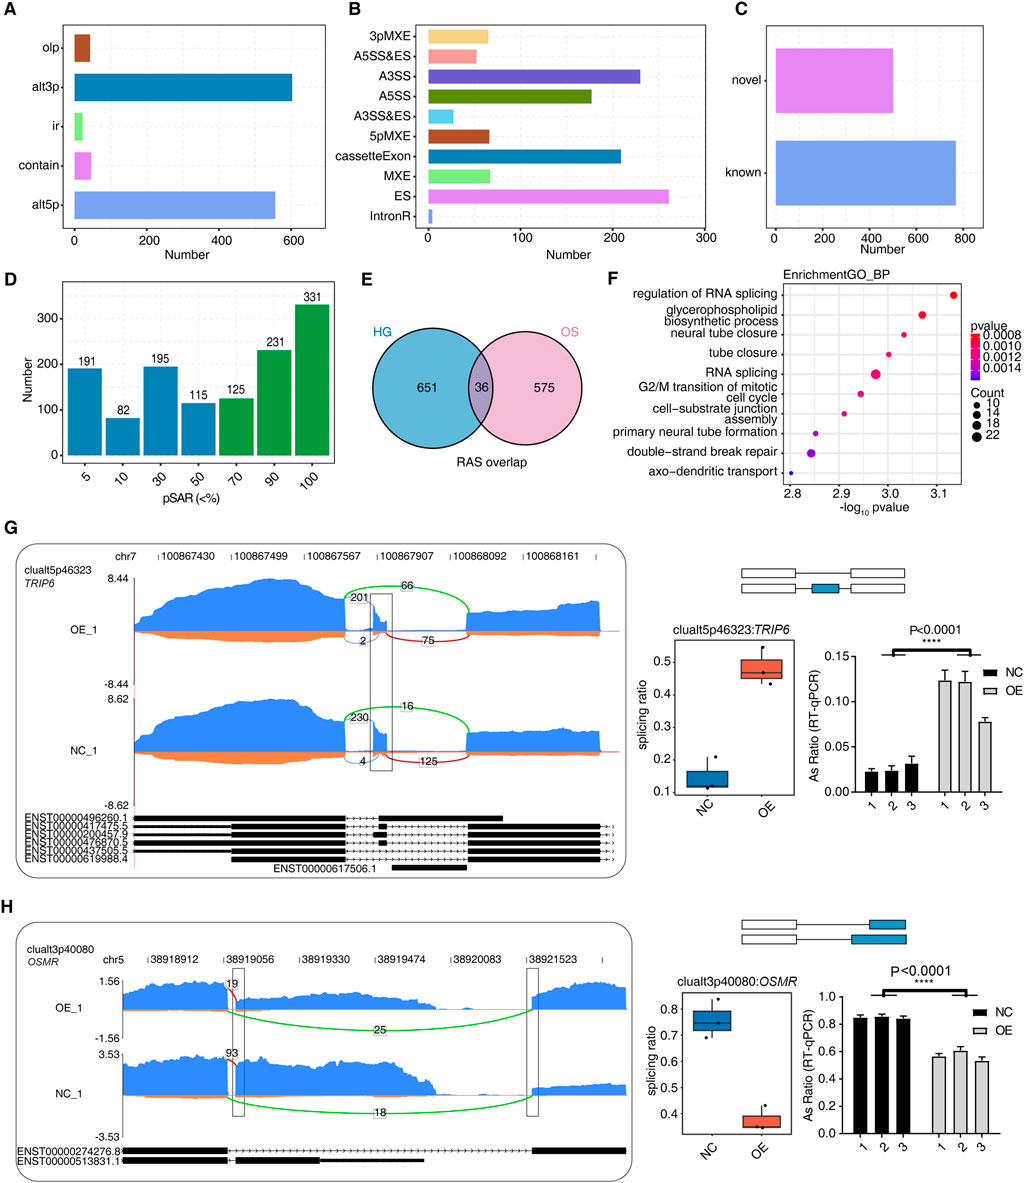
Figure 4. hnRNP-F regulates alternative splicing events in HK-2 cells. (A) Bar plot showing the number of regulated alternative splicing (RAS) events among OE and NC samples detected by SUVA. (B) Bar plot categorizing splice junctions constituting RAS events detected by SUVA into classical alternative splicing (AS) event types and displaying the number of each type. (C) Bar plot showing the number of known and novel RAS events. (D) Bar plot showing the number of RAS events with different abundances (pSAR) among all RAS with a frequency ≥50%. RAS with pSAR ≥50% are further analyzed and marked in red. (E) Venn diagram showing the overlap of high-confidence RAS events (pSAR ≥ 50%) identified under high-glucose (HG) and osmolality-control (OS) conditions. (F) The top 10 most enriched Gene Ontology (GO) terms related to biological processes are visualized for genes involved in RAS when comparing OE and NC samples. (G) Visualization of the read distribution of TRIP6 in AS event clualt5p46323 from different groups, with splice junctions (SJs) labeled with SJ read numbers and the altered exon marked with a box. RNA-seq and RT-qPCR validation of the splicing ratio profile of the splicing event shown on the right. ****P < 0.0001. (H) Visualization of the read distribution of OSMR in AS event clualt3p40080 from different groups, with splice junctions labeled with SJ read numbers and altered splice sites marked with a box. RNA-seq and RT-qPCR validation of the splicing ratio profile of the splicing event shown on the right. ****P < 0.0001.
Due to a splicing event involving two transcripts, which may account for a very small proportion of the entire gene expression, our study focused on identifying the more dominant transcripts in splicing events. We specifically quantified the number of splicing events with varying proportions of RASEs in the region covered by all reads. We also excluded splicing events with a low proportion (pSAR<50%). A total of 687 events with pSAR>50% were detected in overexpression hnRNP-F cells treated with high-glucose (Figure 4D). A total of 611 events were detected in the cells treated with mannitol (Supplementary Figure S3D). While a diversity of AS events was observed in cells treated with mannitol, the functional disparities in these splicing events between the two groups were pronounced when compared to the HG group. Notably, only 36 AS events were common to both treatment conditions (Figure 4E). This result indicated that overexpressed hnRNP-F HK-2 cells have a distinct AS profile in response to HG exposure. Gene Ontology biological process (GO-BP) enrichment analysis revealed that the HG group exhibited significant alterations in alternative splicing, predominantly enriched in pathways related to “regulation of RNA splicing” and “RNA splicing” (Figure 4F). The AS events of the mannitol group were mainly enriched in the “microvillus assembly” and “epithelial tube formation” pathway (Supplementary Figure S3E). To validate the accuracy of the predicted hnRNP-F-regulated ASEs selected from the RNA-seq data under the HG condition, two RASEs were selected for verification. The ratio of variable splicing events occurring in the gene OSMR (alt3p) decreased in the OE-HNRNP-F group (Figure 4H), and increased in the gene TRIP6 (alt5p) (Figure 4G), as expected. We present the designed PCR primer pairs in Supplementary Table S1. TRIP6 mediates inflammatory response and renal fibrosis in diabetic nephropathy (Lin et al., 2021).
3.5 hnRNP-F CLIP-seq reads revealed that hnRNP-F bound to splicing factors and regulated alternative splicing events
The hnRNP-F CLIP-seq data in human 293T cells were obtained from the SRA database accession number GSE34993. These data were utilized to identify transcripts that interact with hnRNP-F in cells. Only reads that mapped uniquely were included in the subsequent analysis. Comparisons between the control group and the IP groups revealed that the reads in the latter were predominantly enriched in noncoding exons, introns, and the 3′UTR region (Figure 5A). RNA-binding proteins that bind to the 3′UTR region often have an impact on RNA stability, suggesting that hnRNP-F may influence RNA stability.
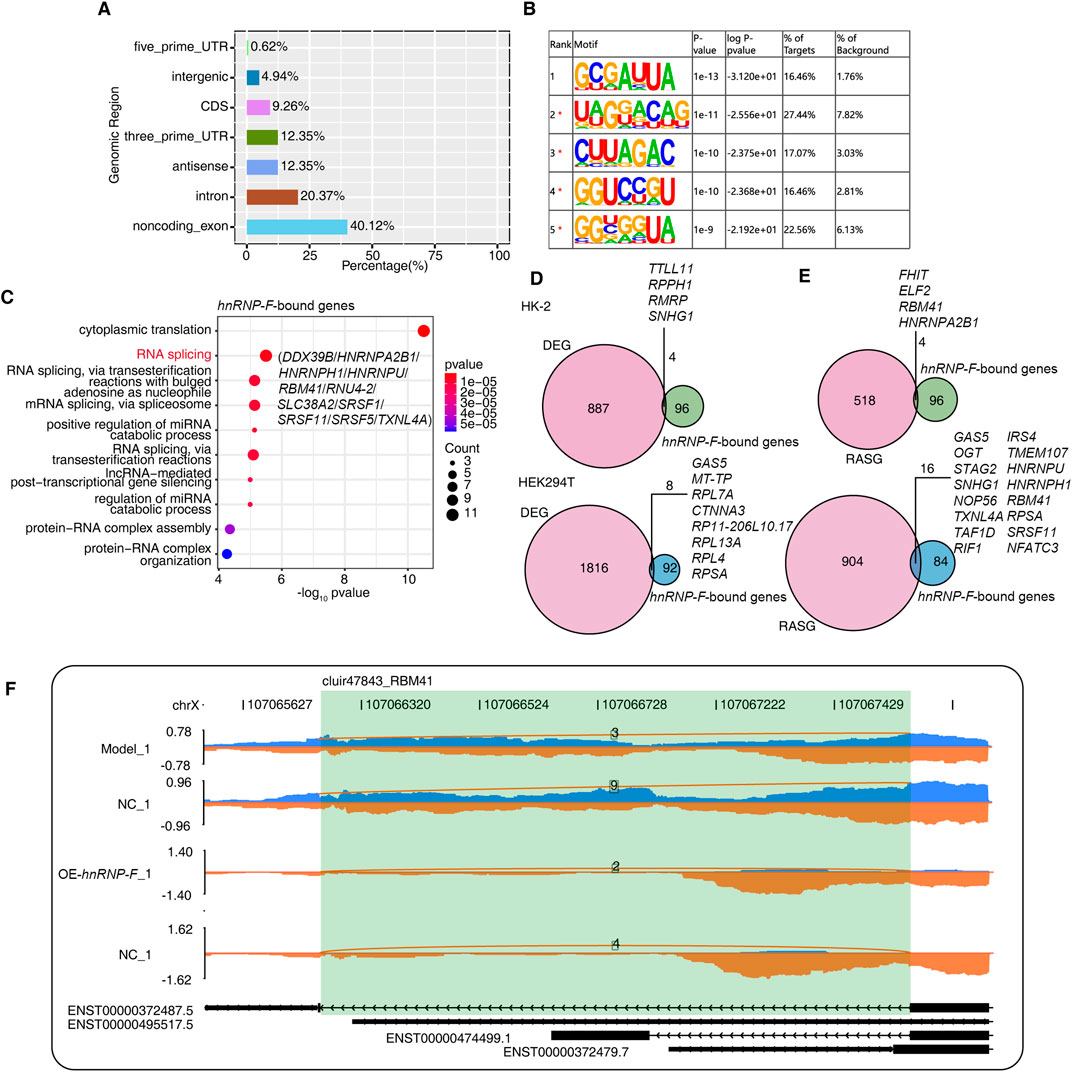
Figure 5. hnRNP-F binds to other splicing factors and regulates alternative splicing of RBM41. (A) Bar plot showing the distribution of genomic regions of HNRNP-F-bound peaks. (B) The five most enriched motif sequences among the HNRNP-F-bound peaks were identified using HOMER software. (C) Dot plot showing the top 10 enriched GO biological processes of genes bound by HNRNP-F. (D) Venn diagram illustrating the overlap between HNRNP-F-bound genes and HNRNP-F-regulated differentially expressed genes (DEGs) in HK-2 cells and 293T cells (Up HK-2 cells; Down 293T cells). (E) Venn diagram illustrating the overlap between HNRNP-F-bound genes and HNRNP-F-regulated alternatively spliced genes in HK-2 cells and 293T cells (Up HK-2 cells; Down 293T cells). (F) Visualization of the read distribution of RBM41 in the AS event cluir47843 from different groups, with splice junctions labeled with the SJ read number. The model and NC were derived from the RNA-seq data of 293T cells, while OE-HNRNP-F and NC were derived from the RNA-seq data of HK-2 cells.
Hypergeometric Optimization of Motif EnRichment (HOMER v4.11, http://homer.ucsd.edu/homer/) was employed for motif analysis of the specific binding peaks identified in the experimental samples. The motif enrichment analysis of the immunoprecipitation (IP) groups revealed enrichment of the UA-rich motif 5′-UUA-3′ in the hnRNP-F-bound motif (Figure 5B). Subsequently, the gene sequences corresponding to the bound peak clusters were aligned with the GO database for annotation, which indicated enrichment ion the RNA splicing process. These primarily included the heterogeneous ribonucleoprotein (HNRNP) family as well as SRSF splicing factors, including HNRNPA2B1, HNRNPH, HNRNPU, SRSF1, SRSF5, and SRSF11 (Figure 5C). Studies have shown that HNRNPA2B1-binding motifs were UA rich (Wu et al., 2018).
Next, we asked whether differences in hnRNP-F binding genes were associated with different gene expressions. We performed gene-based differential binding analyses. We separately analyzed the transcriptome data of hnRNP-F in human 293T cells (GSE34995) and the transcriptome data of hnRNP-F in HK-2 cells that we independently measured. The results showed that hnRNP-F-binding genes overlap with differently expressed genes. Of particular interest was the observation that the lncRNA SNHG1, when bound by hnRNP-F in 293T cells, exhibited differential expression in HK-2 cells overexpressing hnRNP-F (OE-hnRNP-F). Otherwise, in 293T cells, the lncRNA SNHG1 underwent alternative splicing (Figures 5D,E). We also performed an association analysis utilizing CLIP-seq and AS methodologies, which revealed that AS events occurred in four gene regions where hnRNP-F binds in HK-2 and in 16 gene regions in 293T cells (Figure 5E). The AS events of gene RBM41 were detected in both cells (Figure 5E). The analysis of distribution maps indicated that the overexpression of hnRNP-F in HK-2 cells led to a diverse intron retention (ir) AS event of RBM41. Similarly, in 293T cells with hnRNP-F knockdown, an ir AS event was also observed in RBM41. There is an hnRNP-F bound site near the splicing site (Figure 5F). The findings suggest that hnRNP-F can interact with RBM41. The interaction between hnRNP-F and RBM41 results in the production of a truncated transcript of RBM41. Our hypothesis posits that the truncated transcript generated by RBM41 could potentially influence the AS events. Nonetheless, given that the experiment conducted in 293T cells involved the knockdown of hnRNP-F and was characterized by a relatively low sequencing depth, this AS event warrants further experimental investigation.
3.6 Experimental validation of hnRNP-F-regulated differential gene expression in a db/db mouse model
Initially, we observed a significant reduction in the levels of hnRNP-F protein in the kidney of db/db mice compared to db/m controls (***P < 0.001) (Figures 6A–C). Subsequently, we validated the differentially expressed genes identified through RNA-seq (DEGs: CXCL8, GDF15, IL6, PTX3, and TFPI2) by RT-qPCR. Notably, CXCL8 is a chemokine specific to humans and lacks a direct ortholog in mice, which precludes its validation in murine models. Compared to db/m controls, db/db mice demonstrated significantly elevated renal expression of genes associated with inflammation (GDF15, IL6, PTX3, and TFPI2, ****P < 0.0001) (Figures 6D–G), suggesting their critical roles in the progression of DKD. The downregulation of hnRNP-F protein may have facilitated the upregulation of these genes in the db/db mouse model.
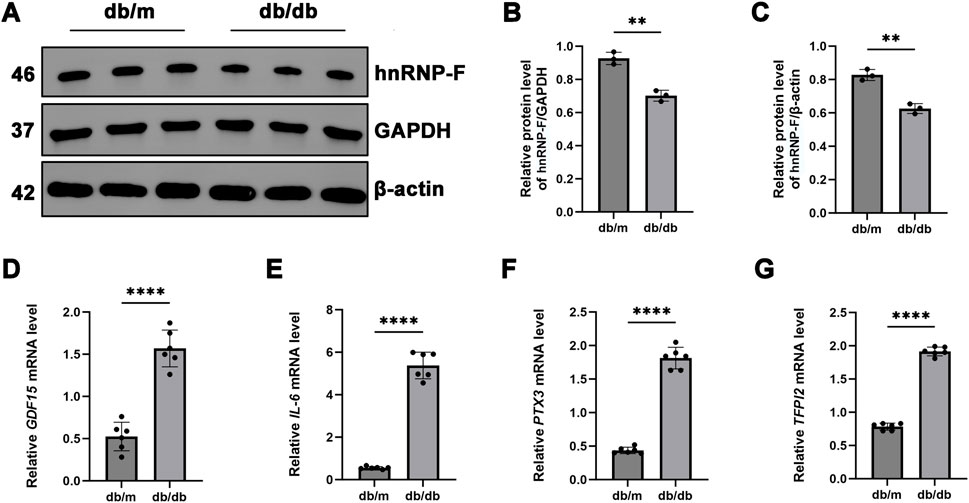
Figure 6. Expression of hnRNP-F in the kidneys of db/db mice and validation of its differentially expressed genes. (A) Representative immunoblot images showing hnRNP-F protein expression in the kidneys of db/db and db/m mice. (B,C) Quantification of hnRNP-F protein levels normalized to GAPDH or β-actin as internal controls. (D–G) mRNA levels of hnRNP-F-modulated differentially expressed genes quantified by RT-qPCR. Error bars represent mean ± SEM. Statistical comparisons were performed using one-way ANOVA with post hoc tests; **P < 0.01, ****P < 0.0001; ns: not significant.
3.7 hnRNP-F overexpression exerts anti-inflammatory effects in MPC5 cells under HG conditions
Under HG conditions, MPC-5 cells demonstrated a significant reduction in hnRNP-F protein levels (**P < 0.01), with minimal correlation to hyperosmolarity induced by mannitol (Figures 7A–E). In cells stably transfected to overexpress hnRNP-F (validated by immunoblotting) (Figures 7F,G), TNF-α expression was significantly attenuated in HG conditions (*P < 0.05) (Figures 7H,K), and NF-κB p-p65 phosphorylation was notably suppressed (**P < 0.01) (Figures 7H–J).
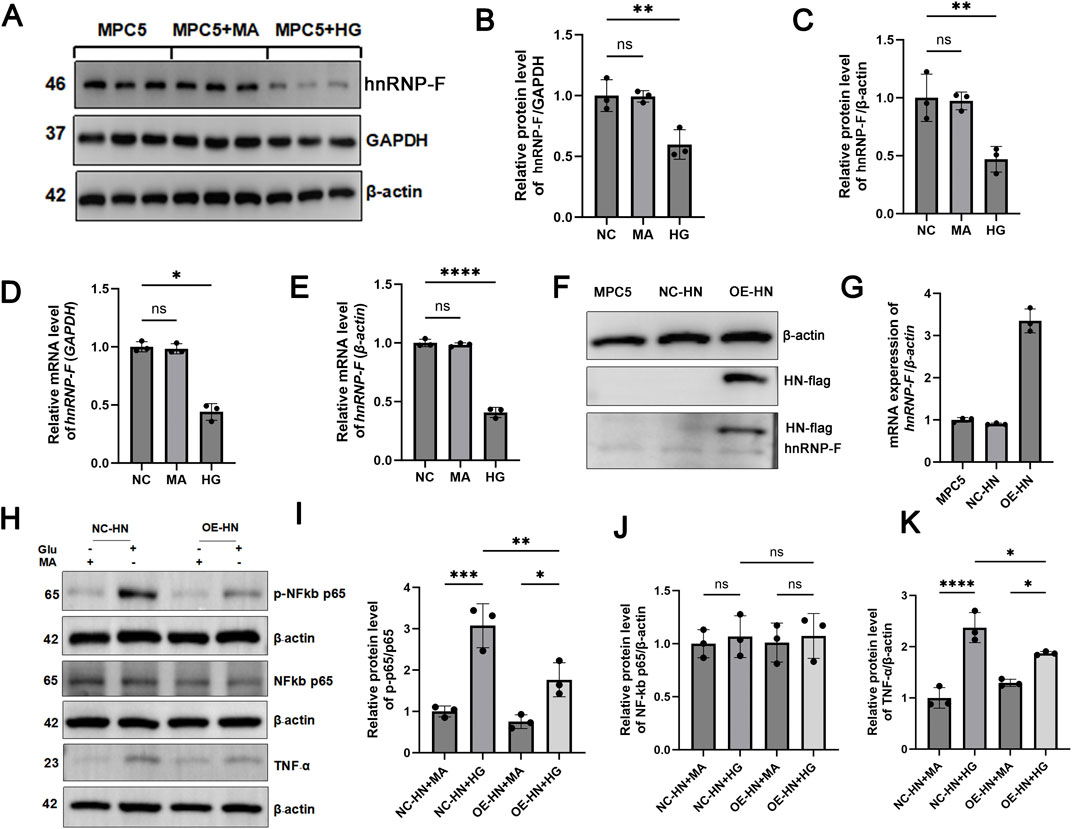
Figure 7. Role of hnRNP-F in MPC-5 cells under high-glucose and its regulation of TNF-α/NF-κB signaling. (A) Representative Western blot analysis of hnRNP-F protein in NG: Normal glucose (5.5 mM), HG: High-glucose (30 mM), Man: Hyperosmotic control (mannitol, 30 mM). (B,C) Quantitative analysis of hnRNP-F protein normalized to GAPDH or β-actin. (D,E) hnRNP-F mRNA levels normalized to GAPDH or β-actin by RT-qPCR. (F) hnRNP-F protein in vector-transfected (NC) and hnRNP-F-overexpressing (OE) MPC-5 cells under high-glucose. (G) hnRNP-F mRNA levels in NC and OE cells under high-glucose. (H) Western blot analysis of TNF-α/NF-κB pathway components in NC and OE cells: TNF-α, Total p65, Phospho-p65 (Ser536). (I) Quantitative analysis of Phospho-p65/total p65 ratio. (J) Quantitative analysis of p65/β-actin. (K) Quantitative analysis of TNF-α/β-actin. Error bars represent mean ± SEM. Statistical comparisons were performed using one-way ANOVA with post hoc tests; *P < 0.05, **P < 0.01, ***P < 0.001, and ****P < 0.0001; ns, not significant.
3.8 Effect of LPS on hnRNP-F expression and anti-inflammatory effects of hnRNP-F overexpression in LPS-treated MPC5 cells
Under LPS-induced inflammatory conditions, hnRNP-F protein levels were significantly decreased in both HK-2 cells and MPC-5 podocytes (*P < 0.001; P < 0.01; Figures 8A–F). In MPC-5 cells stably transfected to overexpress hnRNP-F, TNF-α expression was markedly attenuated (*P < 0.05) (Figure 8I), and NF-κB p-p65/p65 was significantly suppressed (**P < 0.01) (Figures 8G,H) under LPS exposure.
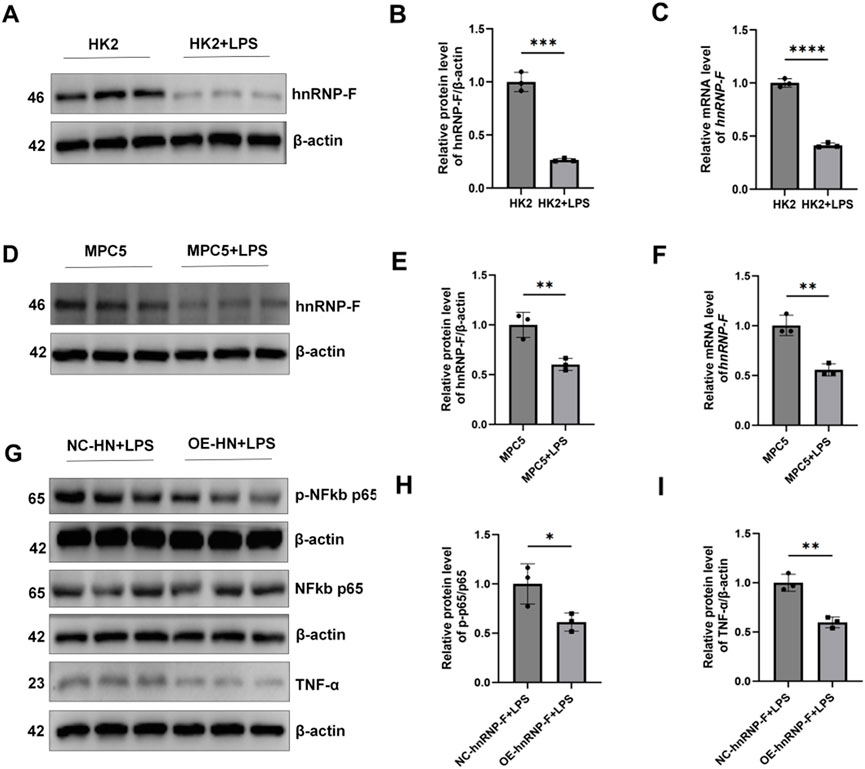
Figure 8. Expression of hnRNP-F in HK2 cells and MPC-5 cells under LPS conditions and its regulation of the TNF-α/NF-κB signaling pathway in MPC-5 cells. (A) Representative immunoblot images of hnRNP-F protein expression in HK-2 cells under LPS conditions (10 µg/mL) and normal conditions. (B) Quantitative analysis of hnRNP-F protein normalized to β-actin in HK-2 cells under normal and LPS conditions. (C) hnRNP-F mRNA levels in HK-2 cells under normal and LPS conditions were quantified by RT-qPCR and normalized to β-actin. (D) Representative immunoblot images of hnRNP-F protein expression in MPC5 cells under LPS conditions (45 µg/mL) and normal conditions. (E) Quantitative analysis of hnRNP-F protein normalized to β-actin in MPC5 cells under normal and LPS conditions. (F) hnRNP-F mRNA levels in MPC5 cells under normal and LPS conditions were quantified by RT-qPCR and normalized to β-actin. (G) Western blot of TNF-α/NF-κB pathway components in NC-hnRNP-F and OE-hnRNP-F MPC5 cells: TNF-α, total p65, phosphorylated p65 (Ser536). (H) Quantitative analysis of the phosphorylated p65/total p65 ratio in MPC5 cells under basal and LPS conditions. (I) Quantitative analysis of TNF-α/β-actin in MPC5 cells under basal and LPS conditions. Error bars represent mean ± SEM. Statistical comparisons were performed using one-way ANOVA with post hoc tests; *P < 0.05, **P < 0.01, ***P < 0.001, ****P < 0.0001; ns, not significant.
3.9 hnRNP-F is physically associated with ZFP36 to form a complex that regulates gene expression and alternative splicing
To elucidate the mechanistic role of hnRNP-F in transcriptional repression, we conducted Co-IP experiments to examine the hnRNP-F interactome in vivo. In these experiments, HK-2 cells were engineered to stably overexpress hnRNP-F. Total protein lysates were subjected to immunoprecipitation using antibodies specific to hnRNP-F, followed by WB with antibodies targeting ZFP36, HNRNPH, and FOXP3 (Figure 9). The Co-IP analysis using hnRNP-Fantibodies, followed by WB with ZFP36 antibodies, demonstrated a physical association between hnRNP-F and ZFP36. The ZFP36 gene, also known as tristetraprolin (TTP), is a crucial RNA-binding protein that plays a vital role in various biological processes. ZFP36 modulates mRNA stability through its interaction with AU-rich elements (AREs) within mRNA, consequently affecting gene expression and cellular function (Makita et al., 2021). Furthermore, empirical evidence suggests that ZFP36 plays a substantial role in the regulation of alternative splicing (Tu et al., 2019; Chan et al., 2025). We speculate that hnRNP-F and ZFP36 form a complex that regulates gene expression and alternative splicing.
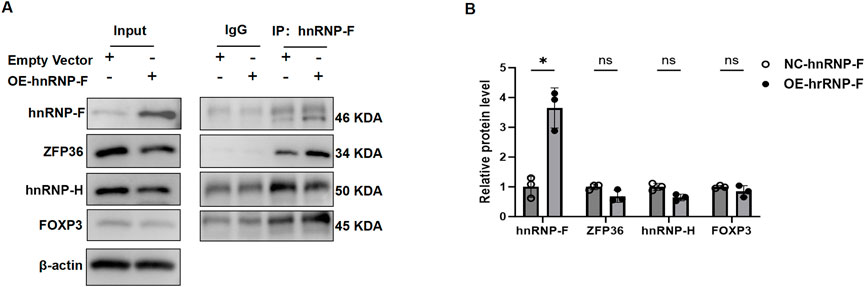
Figure 9. hnRNP-F associates with ZFP36 to form a complex that modulates gene expression and splicing. (A) Co-IP assays in HK-2 cells transfected with empty vector (NC) or hnRNP-F overexpression plasmid (OE-hnRNP-F). Whole-cell lysates (Input) and immunoprecipitated complexes (IP: α-hnRNP-F) were probed for hnRNP-F (46-/50-kDa isoforms), ZFP36 (34 kDa), and FOXP3 (45 kDa). IgG served as a negative control, and β-actin (42 kDa) was the loading control. (B) Quantitative analysis of protein enrichment in Co-IP complexes. Relative protein levels were normalized to IgG control (mean ± SD; n = 3). **P < 0.01 vs. NC group; ns: not significant (P > 0.05), two-tailed Student’s t-test.
4 Discussion
The pathophysiology of DKD involves multiple pathways, such as hemodynamic, metabolic, and inflammatory pathways. Targeting inflammatory and fibrotic pathways may have important therapeutic implications in DKD research (Matoba et al., 2019). Therefore, it is necessary to further investigate its molecular regulatory mechanism in cells associated with DKD to provide new ideas for finding new therapeutic targets for DKD.
As an RNA-binding protein, hnRNP-F is capable of binding to mRNA and participating in the post-transcriptional regulation of target genes, and it is known to modulate the expression of target genes. Abnormal expression of hnRNP-F has been reported to have a significant effect on the progression of diabetic nephropathy, and high expression of hnRNP-F may have a better protective effect. In patients with type 2 diabetes, the protein levels of hnRNP-F have significantly decreased in renal cortex tissues, but the role of hnRNP-F in renal tubular epithelial cell mechanisms remains unclear (Liao et al., 2024). RNA-seq analysis in this study demonstrated that hnRNP-F broadly modulates high-glucose-induced differential gene expression and alternative splicing in HK-2 cells. Downregulation of hnRNP-F expression under HG conditions or in DKD was subsequently confirmed across HK-2 cells, MPC5 cells, and db/db mouse models. Furthermore, lentivirus-mediated hnRNP-F overexpression in MPC5 cells significantly suppressed the TNF-α/NF-κB signaling pathway. The expression and synthesis of TNF-α, a potent inflammatory factor, are not only limited to hematopoietic cells, but also can be produced by renal intrinsic cells, such as mesangial cells, endothelial cells, tubular epithelial cells, etc. (Jevnikar et al., 1991; Sugimoto et al., 1999). TNF-α plays an activating role in renal intrinsic cells, including a second messenger system, transcription factors, and cytokines, and participates in the synthesis of inflammatory mediators and tissue-compatible complexes (Vielhauer et al., 2005). It has been demonstrated that insulin-resistant diabetic patients have increased serum levels of TNF-α (Iwata et al., 2001), and the levels of TNF-α in the blood or glomerular cells are considered to correlate with the damage to the tethered cells in patients with DKD. Being a pleiotropic transcription factor, NF-κB is a regulatory hub for thylakoid cells to express a variety of immune-inflammation-related genes, and is intimately implicated in thylakoid cell proliferation and secretion of inflammatory factors (Evans et al., 2002). Numerous studies have shown that NF-κB may accelerate the progression of DKD by regulating inflammation; for example, it has been shown that NF-κB mediates high-glucose-induced inflammatory response and ECM accumulation in glomerular mesangial cells (Chen et al., 2016; Liu et al., 2019).
We considered that the significant downregulation of CXCL8, IL6, GDF15, PTX3, and TFPI2 warranted additional focus. Existing studies have reported that inhibition of CXCL8 attenuates high-glucose-induced renal tubular cell-mediated inflammation and apoptosis in diabetic kidney disease (Bai et al., 2022). Significantly, activation of CXCL8 has been demonstrated to heighten TNF-α-induced inflammatory responses (Huang et al., 2018). IL-6 signaling is known to be involved in the core inflammatory response in the progression of DKD (Feigerlová and Battaglia-Hsu, 2017). As is known, TNF-α inhibits the transcription factors resulting in the production of IL-6 (Tanaka et al., 2014). Growth differentiation factor-15 (GDF-15) increases the likelihood of DKD by affecting reno-protective factors with anti-inflammatory activity (Delrue et al., 2023). GDF-15 inhibits inflammation by reducing the infiltration of inflammatory cells, diminishing the secretion of cytokines and chemokines, and attenuating macrophage and T cell activity to suppress the release of TNF-α, IL-6, and IL-1β (Tang et al., 2024). In addition, it has been shown that TNF-α could increase the transcriptional activity of GDF-15 by potentiating multiple signal transduction pathways, especially the classical NF-κB and MAPK pathways (Adela et al., 2015).
Two other genes, PTX3 and TFPI2, were also involved in the DKD pathological process. PTX3 induces mitochondrial dysfunction and renal tubular cell senescence via β-linker activation, leading to renal fibrosis (Luo et al., 2023). It was reported that TFPI2 can regulate the endothelial–mesenchymal transition and the TGF-β2 signaling pathway and is a potential promoter of DKD pathogenesis (Guan et al., 2022). We also downloaded the CLIP-seq data of hnRNP-F and found that hnRNP-F and lncRNA SNHG1 had the potential to combine. Meanwhile, the expression of lncRNA SNHG1 was downregulated after hnRNP-F overexpression. SNHG1 is an annotated lncRNA, which is mainly localized in the nucleus. It is well established that SNHG1 interacts with the promoter regions of its downstream genes to enhance their expression (Li et al., 2020; Sun et al., 2017). The present study demonstrates that overexpression of hnRNP-F results in decreased levels of SNHG1 expression. Additionally, the expression of certain TNFα-related genes is suppressed following hnRNP-F overexpression. These findings suggest a potential interaction between hnRNP-F and SNHG1 in regulating the transcription of these target genes.
Our present experiments revealed that hnRNP-F combined with lncRNA SNHG1 in high-glucose-induced renal tubular epithelial cells significantly reduced the expression of genes associated with the TNFα/NFκB signaling pathway or with DKD pathogenesis (Figure 3). The mechanism of this transcriptional repression requires further investigation. Undoubtedly, previous studies indicate that hnRNP-F interacts with multiple proteins, including hnRNP-H, FOXP3, and tristetraprolin (TTP, also known as ZFP36) (Reznik et al., 2014). Co-IP assays performed in HK2 cells confirmed a physical interaction between hnRNP-F and ZFP36 (*P < 0.05 vs. IgG control). However, no interaction was detected between hnRNP-F and FOXP3. While hnRNP-H co-precipitated with hnRNP-F, its comigration with the antibody heavy chain (∼50 kDa) precluded definitive assessment of this interaction. Notably, overexpression of hnRNP-F did not significantly alter the protein levels of ZFP36, FOXP3, or hnRNP-H, as determined by densitometric analysis (Figure 10). A prior study suggested that hnRNP-F acts as a co-factor with TTP to increase ARE-mRNA decay. The current study hypothesizes that hnRNP-F and TTP form a complex mediated by SNHG1 to regulate gene expression. Nevertheless, further experimental evidence is necessary to substantiate this conclusion.
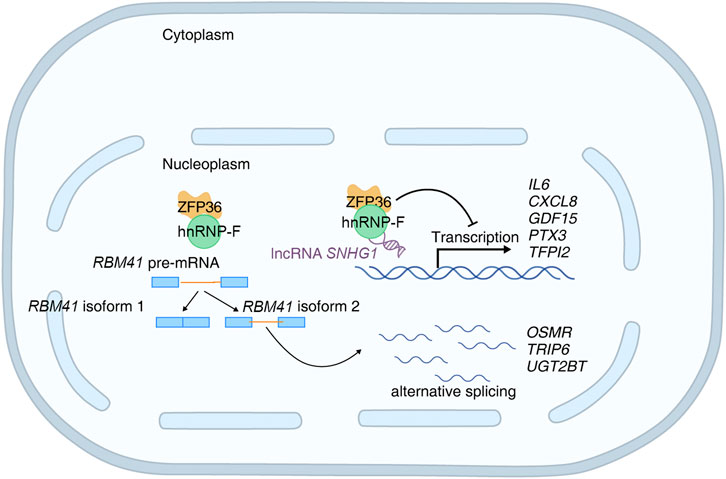
Figure 10. Schematic diagram of hnRNP-F-mediated regulation of gene expression and alternative splicing in high-glucose.
hnRNP-F, as a coregulator of alternative splicing, always interacts with other RNA-binding proteins, including RBM41. We found that hnRNP-F overexpression notably promotes several alternative RNA-binding protein splicings. We observed that hnRNP-F-dependent alternative splicing of RBM41 generates a short isoform in hnRNP-F overexpression cells. RBM41 is the paralog of U11/U12-65K, a known unique component of the U11/U12 di-snRNP. Both proteins utilize their highly similar C-terminal RRM domains to bind the 3′-terminal stem-loops in U12 and U6atac snRNAs with comparable affinity. Recent studies identify RBM41 as a novel, unique protein component of the minor spliceosome, functioning in post-splicing steps and the disassembly process of the minor spliceosome (Norppa et al., 2024; Taira et al., 2025). It is speculated that hnRNP-F may affect the alternative splicing of RBM41, thereby influencing the overall post-transcriptional regulatory pattern within the cell.
We also found that hnRNP-F overexpression significantly alters variable exons of OSMR and UGT2B7. OSMR is a receptor for OSM, and OSM signaling plays a role in fibrosis, including inflammation, vascular dysfunction, and fibroblast activation (Stawski and Trojanowska, 2019). Miroslav Dostalek et al. discovered that diabetes reduces UGT2B7 enzymatic activity in the kidney (Dostalek et al., 2011).
hnRNP-F also affects the inclusion or deletion of exons in some genes, resulting in transcripts of different lengths, like gene TRIP6 and IRF3. TRIP6 mediates inflammatory response and fibrosis in diabetic nephropathy (Lin et al., 2021). As a key molecule in the interferon gene/interferon regulatory factor 3 (STING/IRF3) signaling pathway, IRF3 is involved in mediating the inflammatory response at different stages of DKD progression (El-Deeb et al., 2023). Analysis of CLIP-seq data from hnRNP-F showed that hnRNP-F specifically binds to some hnRNP family proteins and splicing factors. Based on the above results, we speculated that hnRNP-F may mediate variable splicing in high-glucose-induced HK2 cells through interaction with hnRNP family proteins (Figure 5).
In summary, hnRNP-F could have dual functions in mRNA transcriptional and post-transcriptional levels. We find that hnRNP-F may bind with lncRNA SNHG1 to negatively regulate the transcription of genes involved in the TNFα/NFκB signaling pathway. Interestingly, hnRNP-F also regulates the alternative splicing of hnRNP proteins and splicing factors. This finding suggests that hnRNP-F may play a role in DKD by regulating the differential expression and variable splicing of genes associated with diabetic nephropathy, especially genes associated with inflammatory response; however, its exact mechanism requires further experimental verification.
Data availability statement
The data presented in the study are deposited in the GEO repository, accession numbers GSE273001 and GSE299230.
Ethics statement
Ethical approval was not required for the studies on humans in accordance with the local legislation and institutional requirements because only commercially available established cell lines were used. The animal study was approved by the Animal Ethics Committee of Hubei University of Chinese Medicine (Approval No. HUCMS00303837). The study was conducted in accordance with the local legislation and institutional requirements.
Author contributions
LW: Formal analysis, Funding acquisition, Project administration, Supervision, Writing – original draft, and Writing – review and editing. HL: Data curation, Formal analysis, Methodology, Software, Validation, Visualization, Writing – original draft. XG: Data curation, Software, Visualization, Investigation, Writing – original draft. XW: Conceptualization, Funding acquisition, Project administration, Resources, Supervision, Writing – review and editing.
Funding
The author(s) declare that financial support was received for the research and/or publication of this article. This study was supported by the Joint Fund Project of Hubei Provincial Natural Science Foundation (2022CFD021), the Research Project of Hubei Provincial Administration of Traditional Chinese Medicine (ZY 2023F003), and the National Natural Science Foundation of China (82374384).
Conflict of interest
The authors declare that the research was conducted in the absence of any commercial or financial relationships that could be construed as a potential conflict of interest.
Generative AI statement
The author(s) declare that no Generative AI was used in the creation of this manuscript.
Publisher’s note
All claims expressed in this article are solely those of the authors and do not necessarily represent those of their affiliated organizations, or those of the publisher, the editors and the reviewers. Any product that may be evaluated in this article, or claim that may be made by its manufacturer, is not guaranteed or endorsed by the publisher.
Supplementary material
The Supplementary Material for this article can be found online at: https://www.frontiersin.org/articles/10.3389/fphys.2025.1475441/full#supplementary-material
References
Adela R., Banerjee S. K. (2015). GDF-15 as a target and biomarker for diabetes and cardiovascular diseases: a translational prospective. J. Diabetes Res. 2015, 490842. doi:10.1155/2015/490842
Bai Y., Li H., Dong J. (2022). Up-regulation of miR-20a weakens inflammation and apoptosis in high-glucose-induced renal tubular cell mediating diabetic kidney disease by repressing CXCL8 expression. Arch. Physiol. Biochem. 128 (6), 1603–1610. doi:10.1080/13813455.2020.1785506
Barrera-Chimal J., Jaisser F. (2020). Pathophysiologic mechanisms in diabetic kidney disease: a focus on current and future therapeutic targets. Diabetes Obes. Metab. 22 (Suppl. 1), 16–31. doi:10.1111/dom.13969
Chan T. S., Lee K. L., Hung C. S., Chiang H. P., Chung C. C., Liang Y. C. (2025). ZFP36L1 and ZFP36L2 reduce cyclin D1 expression by decreasing expression of E2F1 and long 3'UTR isoform of CCND1 transcripts. Mol. Cell Biochem. 480 (3), 1685–1699. doi:10.1007/s11010-024-05087-w
Chen J., Hou X. F., Wang G., Zhong Q. X., Liu Y., Qiu H. H., et al. (2016). Terpene glycoside component from Moutan Cortex ameliorates diabetic nephropathy by regulating endoplasmic reticulum stress-related inflammatory responses. J. Ethnopharmacol. 193, 433–444. doi:10.1016/j.jep.2016.09.043
Chen Y., Lee K., Ni Z., He J. C. (2020). Diabetic kidney disease: challenges, advances, and opportunities. Kidney Dis. (Basel) 6 (4), 215–225. doi:10.1159/000506634
Cheng C., Liu L., Bao Y., Yi J., Quan W., Xue Y., et al. (2021). SUVA: splicing site usage variation analysis from RNA-seq data reveals highly conserved complex splicing biomarkers in liver cancer. RNA Biol. 18 (Suppl. 1), 157–171. doi:10.1080/15476286.2021.1940037
Darshi M., Kugathasan L., Maity S., Sridhar V. S., Fernandez R., Limonte C. P., et al. (2024). Glycolytic lactate in diabetic kidney disease. JCI Insight 9 (11), e168825. doi:10.1172/jci.insight.168825
Delrue C., Speeckaert R., Delanghe J. R., Speeckaert M. M. (2023). Growth differentiation factor 15 (GDF-15) in kidney diseases. Adv. Clin. Chem. 114, 1–46. doi:10.1016/bs.acc.2023.02.003
Dostalek M., Court M. H., Hazarika S., Akhlaghi F. (2011). Diabetes mellitus reduces activity of human UDP-glucuronosyltransferase 2B7 in liver and kidney leading to decreased formation of mycophenolic acid acyl-glucuronide metabolite. Drug Metab. Dispos. 39 (3), 448–455. doi:10.1124/dmd.110.036608
El-Deeb O. S., Hafez Y. M., Eltokhy A. K., Awad M. M., El-Shaer R. A. A., Abdel Ghafar M. T., et al. (2023). Stimulator of interferon genes/interferon regulatory factor 3 (STING-IRF3) and inflammasome-activation mediated pyroptosis biomarkers: a network of integrated pathways in diabetic nephropathy. J. Diabetes Metab. Disord. 22 (2), 1471–1480. doi:10.1007/s40200-023-01270-w
Evans J. L., Goldfine I. D., Maddux B. A., Grodsky G. M. (2002). Oxidative stress and stress-activated signaling pathways: a unifying hypothesis of type 2 diabetes. Endocr. Rev. 23 (5), 599–622. doi:10.1210/er.2001-0039
Feigerlová E., Battaglia-Hsu S. F. (2017). IL-6 signaling in diabetic nephropathy: from pathophysiology to therapeutic perspectives. Cytokine Growth Factor Rev. 37, 57–65. doi:10.1016/j.cytogfr.2017.03.003
Ghosh A., Zhao S., Lo C. S., Maachi H., Chenier I., Lateef M. A., et al. (2019). Heterogeneous nuclear ribonucleoprotein F mediates insulin inhibition of Bcl2-Modifying factor expression and tubulopathy in diabetic kidney. Sci. Rep. 9 (1), 6687. doi:10.1038/s41598-019-43218-2
Guan G., Xie J., Dai Y., Han H. (2022). TFPI2 suppresses the interaction of TGF-β2 pathway regulators to promote endothelial-mesenchymal transition in diabetic nephropathy. J. Biol. Chem. 298 (3), 101725. doi:10.1016/j.jbc.2022.101725
Heinz S., Benner C., Spann N., Bertolino E., Lin Y. C., Laslo P., et al. (2010). Simple combinations of lineage-determining transcription factors prime cis-regulatory elements required for macrophage and B cell identities. Mol. Cell 38 (4), 576–589. doi:10.1016/j.molcel.2010.05.004
Huang H., Zhang J., Harvey S. E., Hu X., Cheng C. (2017). RNA G-quadruplex secondary structure promotes alternative splicing via the RNA-binding protein hnRNPF. Genes Dev. 31 (22), 2296–2309. doi:10.1101/gad.305862.117
Huang Z., Du G., Huang X., Han L., Han X., Xu B., et al. (2018). The enhancer RNA lnc-SLC4A1-1 epigenetically regulates unexplained recurrent pregnancy loss (URPL) by activating CXCL8 and NF-kB pathway. EBioMedicine 38, 162–170. doi:10.1016/j.ebiom.2018.11.015
Iwata M., Haruta T., Usui I., Takata Y., Takano A., Uno T., et al. (2001). Pioglitazone ameliorates tumor necrosis factor-alpha-induced insulin resistance by a mechanism independent of adipogenic activity of peroxisome proliferator--activated receptor-gamma. Diabetes 50 (5), 1083–1092. doi:10.2337/diabetes.50.5.1083
Jevnikar A. M., Brennan D. C., Singer G. G., Heng J. E., Maslinski W., Wuthrich R. P., et al. (1991). Stimulated kidney tubular epithelial cells express membrane associated and secreted TNF alpha. Kidney Int. 40 (2), 203–211. doi:10.1038/ki.1991.201
Kim D., Langmead B., Salzberg S. L. (2015). HISAT: a fast spliced aligner with low memory requirements. Nat. methods 12 (4), 357–360. doi:10.1038/nmeth.3317
Ladd A. N. (2016). New insights into the role of RNA-Binding proteins in the regulation of heart development. Int. Rev. Cell Mol. Biol. 324, 125–185. doi:10.1016/bs.ircmb.2015.12.009
Li B., Li A., You Z., Xu J., Zhu S. (2020). Epigenetic silencing of CDKN1A and CDKN2B by SNHG1 promotes the cell cycle, migration and epithelial-mesenchymal transition progression of hepatocellular carcinoma. Cell Death Dis. 11 (10), 823. doi:10.1038/s41419-020-03031-6
Liao M. C., Lo C. S., Pang Y. C., Yang W. X., Su K., Zhao X. P., et al. (2024). Heterogeneous nuclear ribonucleoprotein F deficiency in mouse podocyte promotes podocytopathy mediated by methyltransferase-like 14 nuclear translocation resulting in Sirtuin 1 gene inhibition. Transl. Res. 267, 1–9. doi:10.1016/j.trsl.2024.01.002
Lin Y. C., Chang Y. H., Yang S. Y., Wu K. D., Chu T. S. (2018). Update of pathophysiology and management of diabetic kidney disease. J. Formos. Med. Assoc. 117 (8), 662–675. doi:10.1016/j.jfma.2018.02.007
Lin Y., Shao Z., Zhao M., Li J., Xu X. (2021). PTPN14 deficiency alleviates podocyte injury through suppressing inflammation and fibrosis by targeting TRIP6 in diabetic nephropathy. Biochem. Biophys. Res. Commun. 550, 62–69. doi:10.1016/j.bbrc.2020.12.030
Liu Z., Han Y., Zhao F., Zhao Z., Tian J., Jia K. (2019). Nobiletin suppresses high-glucose-induced inflammation and ECM accumulation in human mesangial cells through STAT3/NF-κB pathway. J. Cell Biochem. 120 (3), 3467–3473. doi:10.1002/jcb.27621
Lo C. S., Shi Y., Chang S. Y., Abdo S., Chenier I., Filep J. G., et al. (2015). Overexpression of heterogeneous nuclear ribonucleoprotein F stimulates renal Ace-2 gene expression and prevents TGF-β1-induced kidney injury in a mouse model of diabetes. Diabetologia 58 (10), 2443–2454. doi:10.1007/s00125-015-3700-y
Love M. I., Huber W., Anders S. (2014). Moderated estimation of fold change and dispersion for RNA-seq data with DESeq2. Genome Biol. 15 (12), 550–21. doi:10.1186/s13059-014-0550-8
Luo P., Zhang H., Liang Y., Li X., Wen Z., Xia C., et al. (2023). Pentraxin 3 plays a key role in tubular cell senescence and renal fibrosis through inducing β-catenin signaling. Biochim. Biophys. Acta Mol. Basis Dis. 1869 (7), 166807. doi:10.1016/j.bbadis.2023.166807
Lytvyn Y., Bjornstad P., van Raalte D. H., Heerspink H. L., Cherney D. Z. I. (2020). The new biology of diabetic kidney disease-mechanisms and therapeutic implications. Endocr. Rev. 41 (2), 202–231. doi:10.1210/endrev/bnz010
Makita S., Takatori H., Nakajima H. (2021). Post-transcriptional regulation of immune responses and inflammatory diseases by RNA-binding ZFP36 family proteins. Front. Immunol. 12, 711633. doi:10.3389/fimmu.2021.711633
Matoba K., Takeda Y., Nagai Y., Kawanami D., Utsunomiya K., Nishimura R. (2019). Unraveling the role of inflammation in the pathogenesis of diabetic kidney disease. Int. J. Mol. Sci. 20 (14), 3393. doi:10.3390/ijms20143393
Norppa A. J., Chowdhury I., van Rooijen L. E., Ravantti J. J., Snel B., Varjosalo M., et al. (2024). Distinct functions for the paralogous RBM41 and U11/U12-65K proteins in the minor spliceosome. Nucleic Acids Res. 52 (7), 4037–4052. doi:10.1093/nar/gkae070
Reznik B., Clement S. L., Lykke-Andersen J. (2014). hnRNP F complexes with tristetraprolin and stimulates ARE-mRNA decay. PLoS One 9 (6), e100992. doi:10.1371/journal.pone.0100992
Smith J. M., Sandow J. J., Webb A. I. (2021). The search for RNA-binding proteins: a technical and interdisciplinary challenge. Biochem. Soc. Trans. 49 (1), 393–403. doi:10.1042/BST20200688
Stawski L., Trojanowska M. (2019). Oncostatin M and its role in fibrosis. Connect. Tissue Res. 60 (1), 40–49. doi:10.1080/03008207.2018.1500558
Sugimoto H., Shikata K., Wada J., Horiuchi S., Makino H. (1999). Advanced glycation end products-cytokine-nitric oxide sequence pathway in the development of diabetic nephropathy: aminoguanidine ameliorates the overexpression of tumour necrosis factor-alpha and inducible nitric oxide synthase in diabetic rat glomeruli. Diabetologia 42 (7), 878–886. doi:10.1007/s001250051241
Sun Y., Wei G., Luo H., Wu W., Skogerbø G., Luo J., et al. (2017). The long noncoding RNA SNHG1 promotes tumor growth through regulating transcription of both local and distal genes. Oncogene 36 (49), 6774–6783. doi:10.1038/onc.2017.286
Taira Y., Zhu L., Fukunaga R. (2025). RNA-binding protein Miso/CG44249 is crucial for minor splicing during oogenesis in Drosophila. RNA 31 (6), 822–835. doi:10.1261/rna.080311.124
Tanaka T., Narazaki M., Kishimoto T. (2014). IL-6 in inflammation, immunity, and disease. Cold Spring Harb. Perspect. Biol. 6 (10), a016295. doi:10.1101/cshperspect.a016295
Tang Y., Liu T., Sun S., Peng Y., Huang X., Wang S., et al. (2024). Role and mechanism of growth differentiation factor 15 in chronic kidney disease. J. Inflamm. Res. 17, 2861–2871. doi:10.2147/JIR.S451398
Trapnell C., Williams B. A., Pertea G., Mortazavi A., Kwan G., Van Baren M. J., et al. (2010). Transcript assembly and quantification by RNA-Seq reveals unannotated transcripts and isoform switching during cell differentiation. Nat. Biotechnol. 28 (5), 511–515. doi:10.1038/nbt.1621
Tu Y., Wu X., Yu F., Dang J., Wang J., Wei Y., et al. (2019). Tristetraprolin specifically regulates the expression and alternative splicing of immune response genes in HeLa cells. BMC Immunol. 20 (1), 13. doi:10.1186/s12865-019-0292-1
Tuttle K. R., Agarwal R., Alpers C. E., Bakris G. L., Brosius F. C., Kolkhof P., et al. (2022). Molecular mechanisms and therapeutic targets for diabetic kidney disease. Kidney Int. 102 (2), 248–260. doi:10.1016/j.kint.2022.05.012
Vielhauer V., Stavrakis G., Mayadas T. N. (2005). Renal cell-expressed TNF receptor 2, not receptor 1, is essential for the development of glomerulonephritis. J. Clin. Invest. 115 (5), 1199–1209. doi:10.1172/JCI23348
Wang L., Zhu G., Wang X. (2021). Renal protective effects of Shenyuan Granules on db/db diabetic nephropathy mice based on TGF-β1/Egr1 signaling pathway regulated by Klotho. China J. Tradit. Chin. Med. Pharm. 36 (08), 5033–5036.
Wu B., Su S., Patil D. P., Liu H., Gan J., Jaffrey S. R., et al. (2018). Molecular basis for the specific and multivariant recognitions of RNA substrates by human hnRNP A2/B1. Nat. Commun. 9 (1), 420. doi:10.1038/s41467-017-02770-z
Xia H., Chen D., Wu Q., Wu G., Zhou Y., Zhang Y., et al. (2017). CELF1 preferentially binds to exon-intron boundary and regulates alternative splicing in HeLa cells. Biochim. Biophys. Acta Gene Regul. Mech. 1860 (9), 911–921. doi:10.1016/j.bbagrm.2017.07.004
Xie C., Mao X., Huang J., Ding Y., Wu J., Dong S., et al. (2011). KOBAS 2.0: a web server for annotation and identification of enriched pathways and diseases. Nucleic acids Res. 39 (Suppl. l_2), W316–W322. doi:10.1093/nar/gkr483
Zhou A. X., Jeansson M., He L., Wigge L., Tonelius P., Tati R., et al. (2024). Renal endothelial single-cell transcriptomics reveals spatiotemporal regulation and divergent roles of differential gene transcription and alternative splicing in Murine Diabetic Nephropathy. Int. J. Mol. Sci. 25 (8), 4320. doi:10.3390/ijms25084320
Keywords: hnRNP-F, diabetic kidney disease, RNA-seq, differential gene expression, variable splicing, TNFα-NFκB signaling pathway
Citation: Wang L, Li H, Guo X and Wang X (2025) Integrative RNA-seq and CLIP-seq analysis reveals hnRNP-F regulation of TNFα/NFκB signaling in high-glucose conditions. Front. Physiol. 16:1475441. doi: 10.3389/fphys.2025.1475441
Received: 03 August 2024; Accepted: 30 July 2025;
Published: 09 September 2025.
Edited by:
Komuraiah Myakala, Georgetown University Medical Center, United StatesReviewed by:
Ramdas Bhat, Department of Pharmacology at Srinivas College of Pharmacy, IndiaSandrine Ettou, Ingenia Therapeutics, United States
Copyright © 2025 Wang, Li, Guo and Wang. This is an open-access article distributed under the terms of the Creative Commons Attribution License (CC BY). The use, distribution or reproduction in other forums is permitted, provided the original author(s) and the copyright owner(s) are credited and that the original publication in this journal is cited, in accordance with accepted academic practice. No use, distribution or reproduction is permitted which does not comply with these terms.
*Correspondence: Xiaoqin Wang, d2FuZ3hpYW9xaW5AaGJodGNtLmNvbQ==
†These authors have contributed equally to this work and share first authorship