 Mostafa Abdollahpur1*†
 Chiara Celotto2,3†
 Carlos Sánchez2,3
 Felix Plappert1
 Sten Östenson4
 Pyotr G. Platonov5
 Pablo Laguna2,3
 Esther Pueyo2,3
 Frida Sandberg1
- 1Department of Biomedical Engineering, Lund University, Lund, Sweden
- 2BSICoS Group, Aragon Institute of Engineering Research (I3A) and IIS Aragón, University of Zaragoza, Zaragoza, Spain
- 3Centro de Investigación Biomédica en Red en Bioingeniería, Biomateriales y Nanomedicina (CIBER-BBN), Zaragoza, Spain
- 4Department of Internal Medicine and Department of Clinical Physiology, Central Hospital Kristianstad, Kristianstad, Sweden
- 5Department of Cardiology, Clinical Sciences and Center for Integrative Electrocardiology at Lund University (CIEL), Lund, Sweden
Introduction: This study explores transient and stationary effects of sympathetic and parasympathetic stimulation on f-wave characteristics in atrial fibrillation (AF) patients undergoing a tilt test. Transient phase is defined as the initial 2-minute interval following each postural change, reflecting immediate autonomic adaptation, whereas steady phase refers to the subsequent interval (from 3 minutes post-change until phase end) representing a stable autonomic state.
Methods: Our primary aim is to investigate how the two branches of the autonomic nervous system (ANS) influence the f-wave frequency time series (
Results: Analysis of the clinical data showed a decrease in
Discussion: These results suggest that changes in f-wave frequency characteristics during HUT and HDT could be linked to changes in sympathetic activity, with parasympathetic activity possibly modulating the effects of sympathetic activity rather than being an independent driver of fibrillatory rate changes.
1 Introduction
Atrial fibrillation (AF) is the most prevalent cardiac arrhythmia characterized by irregular and rapid electrical impulses in the atria, leading to ineffective atrial contractions. This condition disrupts the heart’s normal rhythm posing serious health risks, including stroke, heart failure and decreased quality of life. As the incidence of AF continues to rise globally, understanding the mechanisms underlying this condition becomes increasingly important (Hindricks et al., 2021). However, despite advancements in the treatment of AF, identifying the most suitable therapy for each individual patient remains challenging (Hindricks et al., 2021; Joglar et al., 2024). The pathophysiology of AF is complex and involves various modulators that act via multiple mechanisms. Several studies have described a role of the autonomic nervous system (ANS) in the onset and perpetuation of AF (Gould et al., 2006; Chen et al., 2014; Vandenberk et al., 2023).
In healthy subjects, the sympathetic and parasympathetic branches of the ANS work together in coordination, with sympathetic activation increasing heart rate and contractility, and parasympathetic activation decreasing them. An imbalance in the activity of the ANS can lead to electrical instability in the heart, both acting as an AF trigger and contributing to the AF substrate required for the perpetuation of AF (Dimmer et al., 1998; Herweg et al., 1998; Fioranelli et al., 1999; Tomita et al., 2003; Chang et al., 2016). Therefore, assessing ANS activity in AF patients could be highly relevant, as inter-patient variability in ANS activity might contribute to explain the large differences in the effectiveness of anti-AF therapies between patients and might help in the development of personalized treatments.
Parasympathetic stimulation (PSS) triggers the release of the neurotransmitter acetylcholine (ACh). ACh binds to muscarinic receptors in atrial myocytes, ultimately causing the activation of a specific subset of potassium channels known as G protein-activated inwardly rectifying potassium channels. The ACh-activated potassium current, denoted as IKACh, is involved in the slowing of the impulse formation at the sinoatrial node (SAN), leading to bradycardia, and in the shortening of the action potential (AP) duration (APD) and the hyperpolarization of the resting membrane potential in atrial myocytes. These effects, which are concentration-dependent, enhance the dispersion of refractoriness in atrial tissue and render the atria more susceptible to reentry and AF by reducing the wavelength of reentry (Rohr et al., 1998). Conversely, sympathetic stimulation (SS) increases the firing rate of the SAN and causes a variety of changes in the activity of atrial myocytes by activating the
During AF, the P waves of the ECG, representative of atrial activation, are replaced with irregular and erratic waveforms of smaller amplitude denoted f-waves (Sornmo, 2018). With the aim to characterize the atrial electrical activity during AF, the f-wave frequency has received considerable clinical attention (Lankveld et al., 2014; Platonov et al., 2014). Particularly, the atrial dominant frequency, often referred to as the atrial fibrillatory rate and here denoted as
Also, we conducted computational simulations to shed light on the mechanisms underlying those findings (Celotto et al., 2022; Celotto et al., 2024). We evaluated the role of the spatiotemporal release pattern of ACh, considered to vary in phase with inspiration and expiration, in modulating the f-wave frequency and reported that changes in the ACh concentrations were linearly correlated with changes in the f-wave frequency.
A common way used in clinical settings to assess autonomic function is the tilt test, which can provide valuable information about the ability of the ANS to regulate blood pressure and heart rate in response to postural changes (Freeman, 2006). A study examined changes in the f-wave frequency in response to changes in ANS activity induced by head-down tilt (HDT) and head-up tilt (HUT) in 40 patients with psAF and reported a reduction in the f-wave frequency during HDT compared to the baseline (B) and an increase in f-wave frequency in response to HUT (Östenson et al., 2017). Our further analysis of the data from that study showed that a change in the sign of the derivative of the population averaged f-wave frequency trends is noticeable after the initial 2 min of each 5-minute tilt phase (Plappert et al., 2022). This may indicate an initial transient response of the ANS (Fois et al., 2022), after which the system begins to return to baseline.
In this study, we investigated the relationship between autonomic influences and changes in
To provide further insight into the autonomic modulation of changes in heart rate and f-wave characteristics, we developed 2D and 3D atrial computational models under different combinations of cholinergic and
2 Materials and methods
The description of the clinical tilt test data is provided in Section 2.1. A brief description of the methods for ECG-based estimation of heart rate
2.1 Materials
The present study is based on analysis of data acquired in a previous study (Östenson et al., 2017) where patients admitted with persistent AF and planned for elective cardioversion were screened for participation. Patients with abnormal levels of thyroid hormones, severe renal failure requiring dialysis, or heart valve disease were excluded as well as were patients ablated for AF or on any of the Class I or Class III antiarrhythmic drugs. The 40 patients that were included in that study were all on anticoagulant therapy. Table 1 lists the clinical characteristics of this population. Standard 12-lead ECGs, sampled at 1 kHz, were recorded in three different phases: 5 minutes in the baseline supine rest (B) position (0°), 5 minutes in the HDT position (−30°), and 5 minutes in the HUT position (+60°), respectively. Details about the tilt test protocol can be found in Östenson et al. (2017). In this study, we analyzed ECG recordings from a subgroup of 29 patients, since 11 patients were excluded due to missing ECG data. This subgroup is consistent with the subgroup previously examined in Plappert et al. (2022).
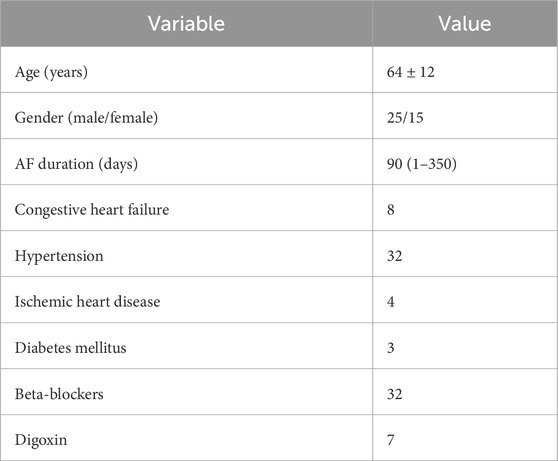
Table 1. Clinical characteristics of the original study population (Östenson et al., 2017).
2.2 ECG preprocessing
The ECG preprocessing, ectopic beat detection, and QRST cancellation were performed using the
2.3 Estimation of the f-wave frequency trend from patients’ ECGs
A harmonic f-wave model was used to estimate the high-resolution trend of the f-wave frequency,
The model parameters
To assess the accuracy of the fitted model, a signal quality index
where
2.4 Respiratory f-wave modulation
An orthogonal subspace projection technique (Varon et al., 2019) was used to extract respiration-related fluctuations in the
With
Then,
where
The average peak amplitude in
Furthermore, to quantify the relative contribution of respiration to the variations in
2.5 2D and 3D human atrial electrophysiological models
Computational models of human atrial electrical activity were built to run simulations that could aid in the interpretation of the clinical data recorded during tilt tests in patients with psAF. Stationary conditions with different levels of SS and PSS were simulated to gain insight into their contribution to f-wave frequency characteristics.
Human atrial electrical activity was simulated both in 2D square sheets of tissue as well as in 3D biatrial anatomical models representative of psAF. The 2D models represented square pieces of 7 × 7
In the 3D models, we used longitudinal conductivity values and transverse to longitudinal conductivity ratios adapted from (Ferrer et al., 2015), as detailed in (Celotto et al., 2024). With these conductivity values in healthy atrial tissue (without fibrosis and without electrical remodeling), the total activation time (TAT) was 130 ms, which is consistent with values reported in the literature. Introducing electrical remodeling caused a slight increase in TAT to 134 ms. Additional incorporation of fibrosis elevated TAT to 180 ms, consistent with findings from (Wesselink et al., 2022) in patients with psAF. In the 2D models, we applied the same longitudinal conductivity values and transverse-to-longitudinal conductivity ratios as those used in the left atrial (LA) region of the 3D model. This configuration resulted in a longitudinal conduction velocity (CV) of 94.12 cm/s without fibrosis and 58 cm/s with fibrosis. These findings are consistent with values reported in previous studies involving patients with and without AF (Bayer et al., 2019).
The electrophysiological activity of human atrial cardiomyocytes was described by the Courtemanche AP model (Courtemanche et al., 1998). All the myocardial nodes in the 2D tissue mesh were assigned with the same electrophysiological characteristics representative of LA tissue. In the 3D models, the Courtemanche model was adapted to represent different atrial regions by varying the ionic current conductances as in Ferrer et al. (2015). These adjustments were made based on experimental observations regarding AP morphology and duration reported in several studies (Wang et al., 1990; 1993; Li et al., 2001; Cha et al., 2005; Seemann et al., 2006).
Parasympathetic stimulation effects were described by introducing the ACh-activated potassium current
Since the simulations aimed to replicate conditions similar to those observed in psAF patients, both electrical and structural remodeling (Sanders et al., 2003) was incorporated into the models, as follows. Electrical remodeling associated with psAF was represented by reducing the conductances of Ito, ICaL and the ultrarapid delayed rectifier potassium current (IKur) by 50%, 70% and 50%, respectively, as in Courtemanche (1999), by increasing the conductance of the inward rectifier potassium current (IK1) by 100% (Dobrev et al., 2001), and by increasing the conductance of IKs by 100% (González de la Fuente et al., 2013). To incorporate psAF-induced structural remodeling in the 2D and 3D models, we introduced 20% diffuse fibrosis based on the ranges reported experimentally (Platonov et al., 2011). Specifically, we randomly selected 20% of the nodes based on a uniform distribution and we assigned them the MacCannell active fibroblast computational model (MacCannell et al., 2007). The fibroblast-fibroblast gap-junctional conductance was reduced 4-fold with respect to the myocyte-myocyte conductance. When myocytes were coupled to fibroblasts, the junctional conductance was linearly adjusted depending on the number of fibroblasts coupled to a myocyte.
2.6 Simulated ACh and Iso release patterns
In both the 2D and 3D models, 30% of nodes were randomly chosen to be either ACh- or Iso-release nodes. This resulted in four possible scenarios: nodes that released only ACh, nodes that released only Iso, nodes that released both Iso and ACh and nodes that released neither Iso nor ACh.
To model the respiratory modulation of ACh concentration, the temporal pattern of ACh release was modeled as cyclically varying following a sinusoidal waveform with a frequency equal to the average respiration frequency measured in patients (0.14 Hz), see Table 2. A mean ACh level of 0.05
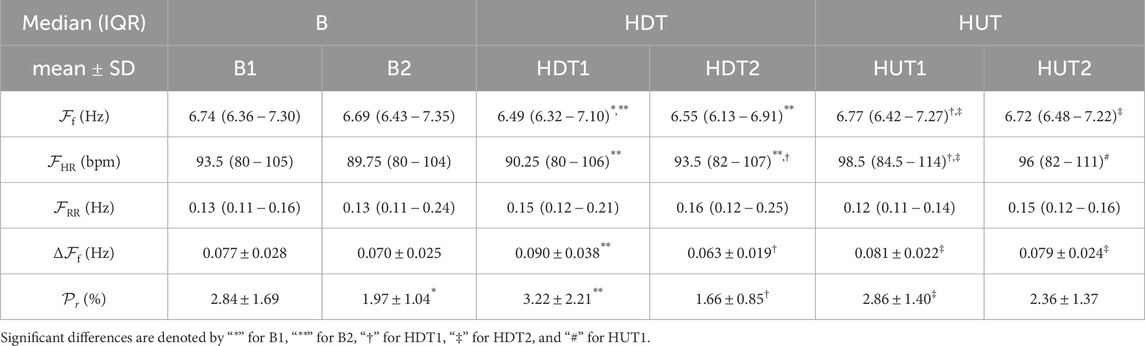
Table 2. Results of the evaluated parameters
2.7 Numerical methods and simulations
To establish steady-state conditions, single cells were paced at a fixed cycle length (CL) of 800 ms over a period of 16 min (Celotto et al., 2024). The resulting steady-state values of the cellular model’s state variables were used to initialize the multi-cellular models.
In the 2D models, four stimuli at a CL of 800 ms were administered at the lower edge of the 2D tissue to pre-excite the model. Subsequently, a cross-stimulation protocol (S1-S2) was employed to induce a rotor. The first stimulus (S1) was applied at the lower edge of the tissue, while the second stimulus (S2) was applied onto a 3.5 by 3.5 cm square at the bottom right corner.
In the 3D whole-atria models, an S1-S2 protocol was applied to trigger arrhythmias too. The S1 stimulus was administered at a line connecting the region between the superior and inferior left pulmonary veins with the area between the right pulmonary veins. Subsequently, the S2 stimulus was applied parallel to the first one starting from the inferior left PV and covering only half of the length of the S1 line (Celotto et al., 2024).
Following the delivery of the S1 stimulus, the simulations were conducted for a duration of 24 s, and results are presented for the last 10 s.
In both the 2D and 3D simulations, the S1-S2 intervals varied mainly based on the underlying Iso concentration, ranging from 130 ms at Iso = 0
Electrical propagation in the atria was described by the monodomain model and solved with the Finite Element Method in combination with the operator splitting numerical scheme using the software ELVIRA (Heidenreich et al., 2010).
2.8 Estimation of the simulated atrial activation frequency trend
From the simulations, transmembrane voltage time series were extracted from 169 uniformly distributed points in the 2D tissue models and 223 points manually selected to be approximately uniformly distributed in the 3D whole-atria models. For each extracted point
The simulated instantaneous frequency,
2.9 Statistical analysis
The Lilliefors test was employed to assess the normality of the data. Results for Gaussian-distributed variables are presented as mean
Figure 1 illustrates the comparisons that were performed in the study. Specifically, we compared each sub-phase (transient and steady-state) with the immediately preceding sub-phase. Additionally, we compared each steady-state phase with the previous steady-state one and each transient phase with the previous transient one.
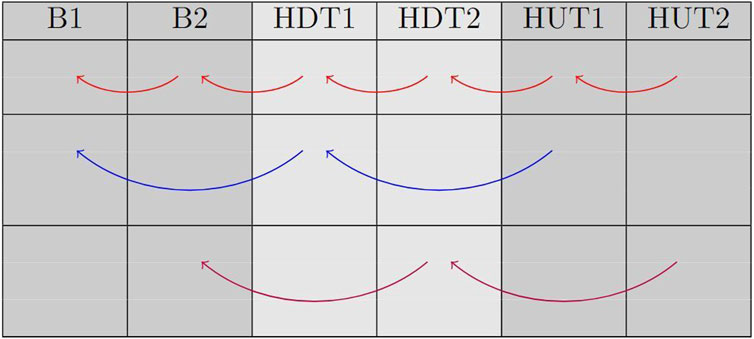
Figure 1. This table displays the comparisons that were made between phases. Red arrows represent comparisons between each sub-phase and the previous one; blue arrows represent comparison between transient phases; magenta arrows represent comparison between steady-state phases.
3 Results
An example of an original ECG signal and the corresponding extracted f-wave signal, estimated f-wave frequency trend
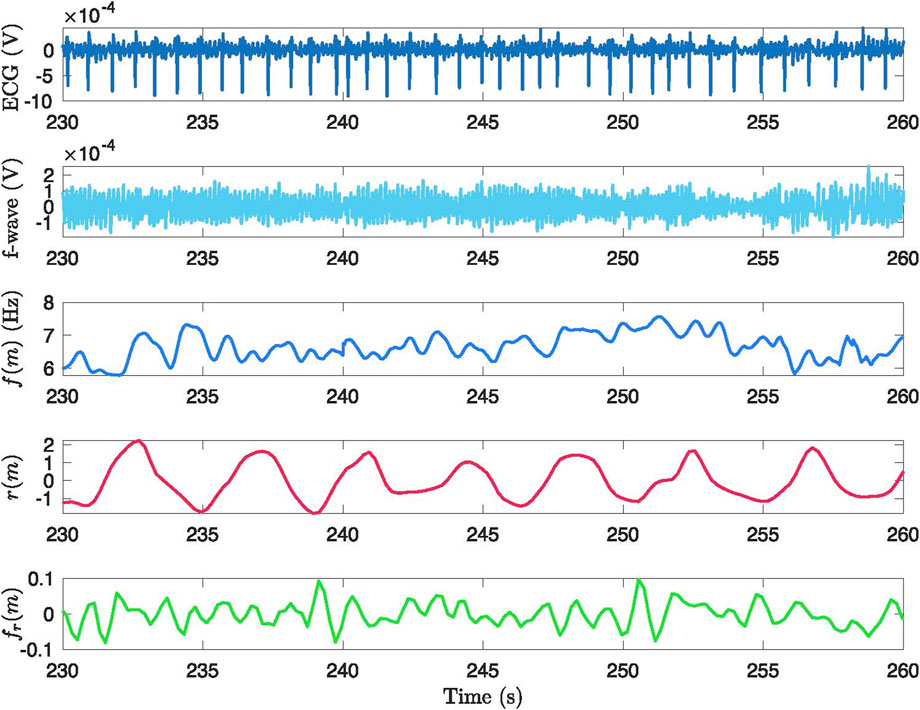
Figure 2. Example of the signal processing methodology applied to a 30-second segment from phase B2. The figure presents: (1) the original ECG signal, (2) the ECG signal after preprocessing and QRST cancellation, (3) the extracted
The estimated f-wave frequency trend
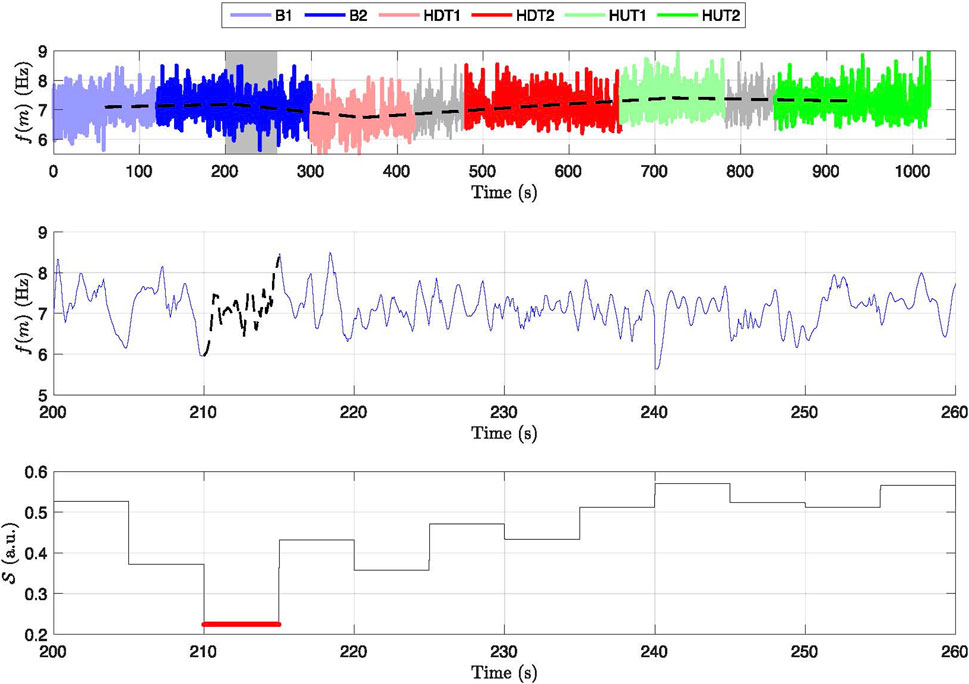
Figure 3. Frequency variation and signal quality across different phases for a subject. Top panel: Displays the frequency trend,
3.1 Heart rate and f-wave frequency
Five out of the 29 patients were excluded entirely from further analysis based on the exclusion criteria outlined in Section 2.3 and thus the results are based on 24 patients. For the remaining 24 patients, 2.2% of the 5-s segments in B1, 1.7% in B2, 0.8% in HDT1, 2.9% in HDT2, 4.3% in HUT1, and 1.9% in HUT2 exhibited
Table 2, first row, shows the results for
The subplots (a) and (b) of Figure 4 show the values of
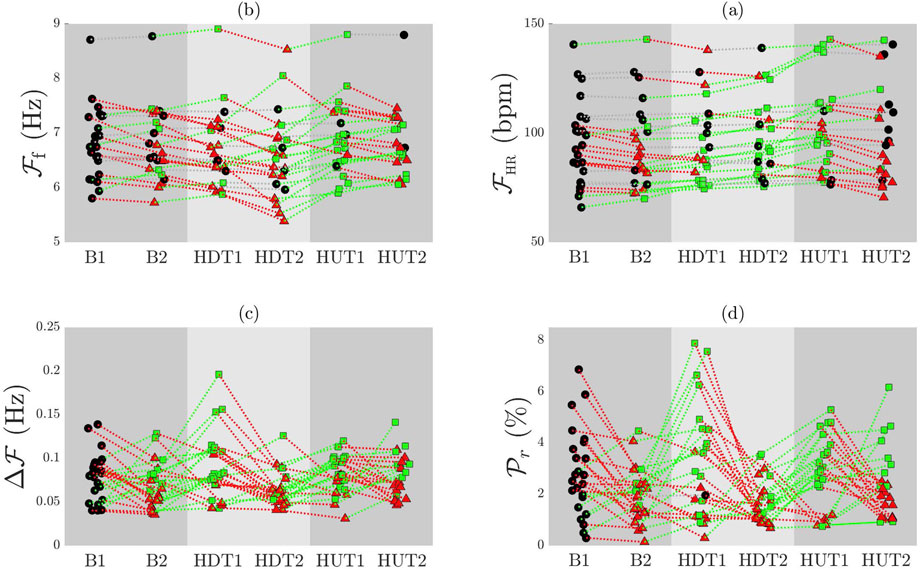
Figure 4. Individual patient trends for
3.2 Respiration related f-wave variation and its relative power
The third row of Table 2 presents the results for the respiration rate
The subplots (c) and (d) of Figure 4 illustrate the comparison of
3.3 The f-wave frequency analysis from computational simulations
In the 2D tissue models, a single stable rotor was initiated after application of the S1-S2 protocol, while in the 3D biatrial models, S1-S2 stimulation was able to generate multiple stable rotors, as illustrated in Figure 5 and in the videos provided in the Supplementary Material. An increase in the number of stable rotors (from 1 to 3) was observed when adding 0.005 or 1
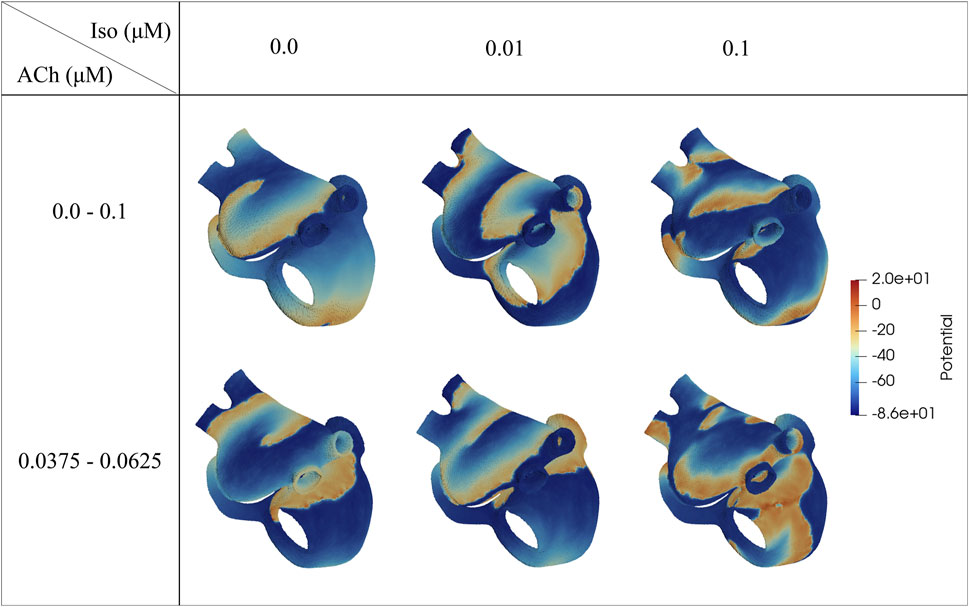
Figure 5. Voltage maps representative of the induced fibrillatory pattern after application of S1-S2 stimulation. The ACh values represent the range of variation (
Table 3 reports the values of
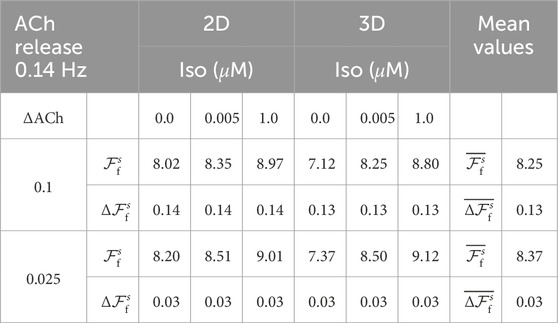
Table 3.
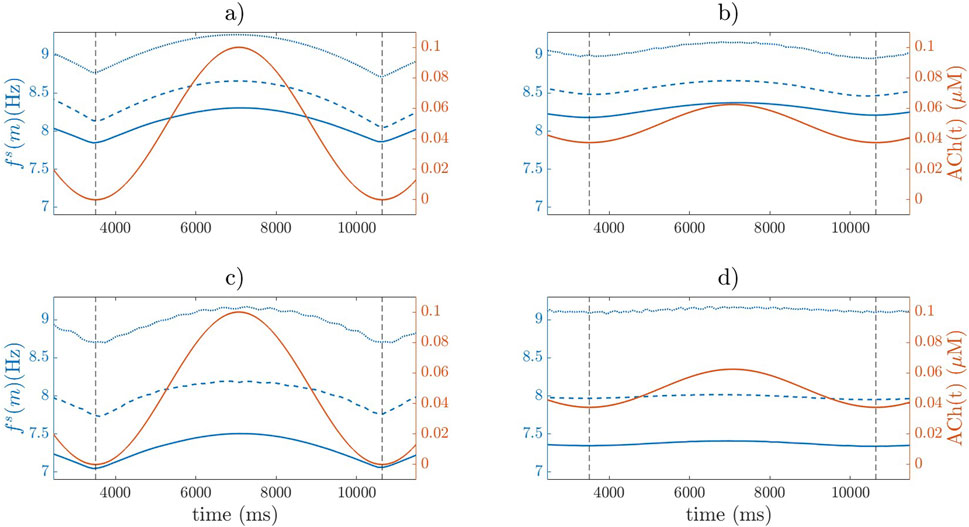
Figure 6.
Regarding the variations in
4 Discussion
In this study, we analyzed ECGs of psAF patients undergoing a tilt table test and we computationally simulated the electrophysiology of the human atria to assess the relationship between ANS activity and f-wave frequency characterization.
We decided to analyze phases by distinguishing between transient and steady-state responses to postural changes in patients. In the study by Fois et al. (2022), the transient phases lasted approximately 1–1.5 min. In our dataset, these phases seemed to conclude around the 2-min mark. To avoid potentially overestimating the transient effects, we opted to consider slightly longer transient durations potentially including some of the steady-state.
Based on the analysis of the clinical data, substantial changes in
Generally, the behavior of
Through simulations, we found that increasing or decreasing the Iso concentration caused a corresponding increase or decrease in
A large number of studies have postulated an increase in SS during HUT in subjects in sinus rhythm (SR) (Cooke et al., 1999; Furlan et al., 2000; Whittle et al., 2022). This could be explained by the fact that during the transition to the HUT position, there is a sudden decrease in venous return, prompting a compensatory response from the sympathetic nervous system to maintain blood pressure. In our study, this observation is further reinforced in the context of AF. Specifically, the increase in
Although there is scarce research on the autonomic effects during HDT, some studies in SR have associated the slowing of
During HDT2, we observed a decrease in
The inclusion of simulations in our study provided useful insights into the expected direction of the changes in the mean f-wave frequency and the magnitude of respiratory modulation during PSS and SS.
We did not incorporate studies involving direct microneurography measurements of sympathetic activity or in vivo ACh concentration changes during maneuvers such as tilt testing for model validation, as we could not identify studies specifically linking tilt testing, microneurography, and AF. Instead, we based our validation on more global electrophysiological markers, such as CV and total atrial activation time (Bayer et al., 2019; Sanders et al., 2003), as well as f-wave frequencies (Stridh et al., 2003; Holmqvist et al., 2005), which have been extensively studied in relation to autonomic modulation and AF.
The simulation methods employed in this study build upon well-established modeling approaches that have been previously validated in the literature. The Courtemanche model and its adaptations have been widely used to simulate atrial electrophysiology, including the effects of autonomic modulation (Courtemanche et al., 1998). The ionic current modifications used to implement the effects of ACh and
The observed discrepancies in the absolute values in clinical data and simulations (around 2 Hz in
In this regard, we performed one additional simulation at the 2D level (Supplementary Figure S1 in the Supplementary Material). Particularly, we reduced the level of psAF electrical remodeling by 50%, resulting in an increase in APD90 of the baseline AP (no ACh, no Iso) of 25%. These modifications led to a reduction in
Furthermore, while in the simulations the modulation of the fibrillatory rate is determined only by ACh and Iso, in the clinical signals the changes in the f-wave frequency characteristics in response to HDT and HUT can possibly be attributed to additional factors beyond the ANS modulation. Among such factors, mechanical stretch and mechano-electrical feedback should be considered, as they have been reported to exert significant contribution to atrial electrical activity in patients with atrial flutter (Mase, et al., 2009; Ravelli et al., 2008; Waxman et al., 1991). A study conducted by Waxman et al. (1991) examined various interventions, including passive upright tilting, the strain phase of the Valsalva maneuver and expiration, and all of them were found to reduce the cardiac size. Interestingly, regardless of the autonomic activity, these interventions were found to independently increase the rate of atrial flutter. Similarly, Ravelli et al. (2008) found that acute atrial stretch caused by ventricular contractions and respiratory movements resulted in a shortening of the atrial flutter CL in humans. Importantly, even after blocking autonomic influences, oscillations in the atrial flutter CL were still present, further supporting the idea that factors beyond autonomic activity contribute to these oscillations.
The simulation results suggest that impaired sympathetic activity leads to a reduced increase in
From a clinical point of view, by elucidating the specific effects of sympathetic and parasympathetic activity on f-wave frequency modulation, clinicians could tailor pharmacological interventions targeting the ANS more effectively. For example, medications that selectively modulate sympathetic or parasympathetic activity could be prescribed based on an individual patient’s autonomic profile, potentially leading to improved rhythm control and symptom management (Vandenberk et al., 2023; Chen et al., 2014). Additionally, autonomic modulation of
4.1 Limitations
Some limitations of this study should be acknowledged to provide direction for further work.
One of the main limitations of the present study is the small sample size. The results suggest that changes in
This study analyzed ECG recordings from a subset of 24 patients from an original cohort of 40 patients (Östenson et al., 2017). The exclusion was based on the availability and quality of ECG signals: 11 patients were excluded due to missing ECG recordings, and 5 additional patients were excluded due to insufficient ECG signal quality for f-wave analysis. Although excluding low-quality ECGs improves the reliability of the results, it also limits the representativeness of our sample in relation to the full 40-patient cohort (cf. Table1).
The dataset did not provide access to individual patient data, such as age, sex, AF duration, comorbidities and use of drugs. These factors are known to influence the ANS, and hence lack of detailed patient information hampers a deeper exploration of how these factors might interact with the autonomic responses measured, potentially affecting the interpretation and applicability of our results.
Given that 80% of the original 40-patient cohort were diagnosed with hypertension and treated with
Another limitation of this study is the absence of a direct ground truth measurement for respiration, as we did not use an independent reference method (e.g., spirometry or respiratory belts) to validate the ECG-derived respiratory signal. While the ECG-derived respiratory signal has been widely used in prior studies (Kontaxis et al., 2019) and provides valuable insights into respiration-related cardiac modulation, it remains an indirect estimate, and potential inaccuracies cannot be entirely ruled out. Additionally, the observed respiratory rate (0.13 Hz) is lower than typical resting respiration rates. Several physiological factors, including the use of beta-blockers, the supine position during tilt-table testing, and the controlled quiet room environment, likely contributed to a slower spontaneous breathing rate. Despite these plausible explanations, the lack of direct respiratory measurements prevents us from direct verification of this effect. Future studies incorporating simultaneous direct respiratory monitoring would help validate and refine the precision of the ECG-derived respiration analysis in similar patient populations.
Focusing on the simulations, due to a lack of reported knowledge on the spatial distribution of sympathetic and parasympathetic innervation in the atria, we simply considered a random distribution of an equal number of sympathetic and parasympathetic nodes, to provide some evidence for the effects of the cholinergic and
Our computational models are deterministic and based on averaged patient data. Thus, they do not reproduce all the spectra of inter-patient variability but are representative of a mean psAF patient. Particularly, the use of a single anatomical model and a single model describing cellular electrophysiology may not have fully captured the inter-patient variability observed in the clinical scenario. Further investigations using other computational AP models with different steady-state APD values, as well as using populations of models, could be conducted to assess the impact of AP properties on f-wave frequency characterizations. Furthermore, AF-related structural remodeling of the atria may present with various alterations such as an enlarged atrial chamber, hypertrophy of cardiomyocytes, increased mismatch between epicardial and endocardial myofibers’ orientations, changes in atrial wall thickness and, notably, an increased amount of fibrotic or connective tissue (Wyse et al., 2014; Schotten et al., 2011; Heijman et al., 2016). We represented psAF-related structural remodeling by a combination of gap junction remodeling, modeled through tissue conductance reduction in fibrotic regions, and fibroblast proliferation. Future studies incorporating different degrees of fibrosis as well as other psAF characteristics not accounted for in our model could delve deeper into the collective impact of these factors on
Finally, our current computational models do not allow us to assess the effects of ACh and Iso on
5 Conclusion
The findings of this study suggest that elevated and reduced sympathetic activity following HUT and HDT, respectively, could contribute to the increase and decrease in
Data availability statement
The data analyzed in this study is subject to the following licenses/restrictions: The data is owned by the Department of Cardiology, Clinical Sciences, Lund University, Sweden. Requests to access these datasets should be directed to cHlvdHIucGxhdG9ub3ZAbWVkLmx1LnNl.
Ethics statement
The studies involving humans were approved by Regionala Etikprövningsnämnden i Lund. The studies were conducted in accordance with the local legislation and institutional requirements. The participants provided their written informed consent to participate in this study.
Author contributions
MA: Conceptualization, Writing – original draft, Writing – review and editing. CC: Conceptualization, Writing – original draft, Writing – review and editing. CS: Conceptualization, Supervision, Writing – review and editing. FP: Writing – review and editing. SÖ: Writing – review and editing. PP: Supervision, Writing – review and editing. PL: Conceptualization, Supervision, Writing – review and editing. EP: Conceptualization, Supervision, Writing – review and editing. FS: Conceptualization, Supervision, Writing – review and editing.
Funding
The author(s) declare that financial support was received for the research and/or publication of this article. This work was supported by the European Union’s Horizon 2020 research and innovation programme under the Marie Sklodowska-Curie grant agreement No. 766082, the Swedish Research Council (grant VR2019-04272) and the Crafoord Foundation (grant 20200605), by Ministerio de Ciencia e Innovación, Spain, through projects PID2022-140556OB-I00 and TED2021-130459B-I00 and by European Social Fund (EU) and Aragón Government through projects LMP94_21, LMP141_21 and BSICoS group T39_23R.
Conflict of interest
The authors declare that the research was conducted in the absence of any commercial or financial relationships that could be construed as a potential conflict of interest.
Publisher’s note
All claims expressed in this article are solely those of the authors and do not necessarily represent those of their affiliated organizations, or those of the publisher, the editors and the reviewers. Any product that may be evaluated in this article, or claim that may be made by its manufacturer, is not guaranteed or endorsed by the publisher.
Supplementary material
The Supplementary Material for this article can be found online at: https://www.frontiersin.org/articles/10.3389/fphys.2025.1498426/full#supplementary-material
Footnotes
1In the original publication Abdollahpur et al. (2022), this
References
Abdollahpur M., Engström G., Platonov P. G., Sandberg F. (2022). A subspace projection approach to quantify respiratory variations in the f-wave frequency trend. Front. Physiology 1929. doi:10.3389/fphys.2022.976925
Abdollahpur M., Holmqvist F., Platonov P. G., Sandberg F. (2021). Respiratory induced modulation in f-wave characteristics during atrial fibrillation. Front. Physiology 12, 653492. doi:10.3389/fphys.2021.653492
Bailon R., Sörnmo L., Laguna P. (2006). A robust method for ECG-based estimation of the respiratory frequency during stress testing. IEEE Trans. bio-medical Eng. 53, 1273–1285. doi:10.1109/TBME.2006.871888
Bayer J. D., Boukens B. J., Krul S. P. J., Roney C. H., Driessen A. H. G., Berger W. R., et al. (2019). Acetylcholine delays atrial activation to facilitate atrial fibrillation. Front. Physiology 10, 1105. doi:10.3389/fphys.2019.01105fphys.2019.01105
Celotto C., Sánchez C., Abdollahpur M., Sandberg F., Laguna P., Pueyo E. (2023) “Dependence of atrial fibrillatory rate variations induced by head-up/down tilt-test on autonomic action,” in 2023 computing in Cardiology (CinC), 50. IEEE, 1–4.
Celotto C., Sanchez C., Abdollahpur M., Sandberg F., Rodriguez J. F., Laguna P., et al. (2022). Effects of acetylcholine release spatial distribution on the frequency of atrial reentrant circuits: a computational study. Comput. Cardiol. (CinC) 498, 1–4. doi:10.22489/CinC.2022.396
Celotto C., Sánchez C., Abdollahpur M., Sandberg F., Rodriguez Mstas J. F., Laguna P., et al. (2024). The frequency of atrial fibrillatory waves is modulated by the spatiotemporal pattern of acetylcholine release: a 3D computational study. Front. Physiology 14, 1189464. doi:10.3389/fphys.2023.1189464
Cha T.-J., Ehrlich J. R., Zhang L., Chartier D., Leung T. K., Nattel S. (2005). Atrial tachycardia remodeling of pulmonary vein cardiomyocytes: comparison with left atrium and potential relation to arrhythmogenesis. Circulation 111, 728–735. doi:10.1161/01.CIR.0000155240.05251.D0
Chang H.-Y., Lo L. W., Chou Y. H., Lin W. L., Lin Y. J., Yamada S., et al. (2016). Effect of vagotomy on the activity of cardiac autonomic ganglia: insight from left atrial high density frequency mapping. Int. J. Cardiol. 220, 435–439. doi:10.1016/j.ijcard.2016.06.1832016.06.183
Chelu M. G., Sarma S., Sood S., Wang S., Van Oort R. J., Skapura D. G., et al. (2009). Calmodulin kinase ii–mediated sarcoplasmic reticulum ca 2+ leak promotes atrial fibrillation in mice. J. Clin. investigation 119, 1940–1951. doi:10.1172/jci37059
Chen P.-S., Chen L. S., Fishbein M. C., Lin S.-F., Nattel S. (2014). Role of the autonomic nervous system in atrial fibrillation: pathophysiology and therapy. Circulation Res. 114, 1500–1515. doi:10.1161/CIRCRESAHA.114.303772
Cooke W. H., Hoag J. B., Crossman A. A., Kuusela T. A., Tahvanainen K. U., Eckberg D. L. (1999). Human responses to upright tilt: a window on central autonomic integration. J. Physiology 517 (Pt 2), 617–628. doi:10.1111/j.1469-7793.1999.0617t.x
Courtemanche M., Ramirez R. J., Nattel S. (1998). Ionic mechanisms underlying human atrial action potential properties: insights from a mathematical model. Am. J. Physiology-Heart Circulatory Physiology 275, H301–H321. doi:10.1152/ajpheart.1998.275.1.H301
Courtemanche M., Ramirez R. J., Nattel S. (1999). Ionic targets for drug therapy and atrial fibrillation-induced electrical remodeling: insights from a mathematical model. Cardiovasc. Res. 42, 477–489. doi:10.1016/S0008-6363(99)00034-6
Dimmer C., Tavernier R., Gjorgov N., Van Nooten G., Clement D. L., Jordaens L. (1998). Variations of autonomic tone preceding onset of atrial fibrillation after coronary artery bypass grafting. Am. J. Cardiol. 82, 22–25. doi:10.1016/s0002-9149(98)00231-8
Dobrev D., Graf E., Wettwer E., Himmel H., Hala O., Doerfel C., et al. (2001). Molecular basis of downregulation of g-protein–coupled inward rectifying k+ current (Ik, ach) in chronic human atrial fibrillation: decrease in girk4 mrna correlates with reduced Ik, ach and muscarinic receptor–mediated shortening of action potentials. Circulation 104, 2551–2557. doi:10.1161/hc4601.099466
Ferrer A., Sebastián R., Sánchez-Quintana D., Rodríguez J. F., Godoy E. J., Martínez L., et al. (2015). Detailed anatomical and electrophysiological models of human atria and torso for the simulation of atrial activation. PloS One 10, e0141573. doi:10.1371/journal.pone.0141573
Fioranelli M., Piccoli M., Mileto G. M., Sgreccia F., Azzolini P., Risa M. P., et al. (1999). Analysis of heart rate variability five minutes before the onset of paroxysmal atrial fibrillation. Pacing Clin. Electrophysiol. PACE 22, 743–749. doi:10.1111/j.1540-8159.1999.tb00538.x
Fois M., Maule S. V., Giudici M., Valente M., Ridolfi L., Scarsoglio S. (2022). Cardiovascular response to posture changes: multiscale modeling and in vivo validation during head-up tilt. Front. Physiology 13, 826989. doi:10.3389/fphys.2022.826989
Freeman R. (2006). Assessment of cardiovascular autonomic function. Clin. Neurophysiol. 117, 716–730. doi:10.1016/j.clinph.2005.09.027
Furlan R., Porta A., Costa F., Tank J., Baker L., Schiavi R., et al. (2000). Oscillatory patterns in sympathetic neural discharge and cardiovascular variables during orthostatic stimulus. Circulation 101, 886–892. doi:10.1161/01.cir.101.8.8868.886
González de la Fuente M., Barana A., Gomez R., Amoros I., Dolz-Gaiton P., Sacristan S., et al. (2013). Chronic atrial fibrillation up-regulates β1-adrenoceptors affecting repolarizing currents and action potential duration. Cardiovasc. Res. 97, 379–388. doi:10.1093/cvr/cvs313
Gould P. A., Yii M., McLean C., Finch S., Marshall T., Lambert G. W., et al. (2006). Evidence for increased atrial sympathetic innervation in persistent human atrial fibrillation. Pacing Clin. Electrophysiol. PACE 29, 821–829. doi:10.1111/j.1540-8159.2006.00447.x
Heidenreich E. A., Ferrero J. M., Doblaré M., Rodríguez J. F. (2010). Adaptive macro finite elements for the numerical solution of monodomain equations in cardiac electrophysiology. Ann. Biomed. Eng. 38, 2331–2345. doi:10.1007/s10439-010-9997-2
Heijman J., Algalarrondo V., Voigt N., Melka J., Wehrens X. H., Dobrev D., et al. (2016). The value of basic research insights into atrial fibrillation mechanisms as a guide to therapeutic innovation: a critical analysis. Cardiovasc. Res. 109, 467–479. doi:10.1093/cvr/cvv275
Henriksson M., Petrenas A., Marozas V., Sandberg F., Sornmo L. (2018a). Model-based assessment of f-wave signal quality in patients with atrial fibrillation, IEEE Trans. Biomed. Eng., Model-based Assess. f-wave signal Qual. patients Atr. fibrillation 65, 2600–2611. doi:10.1109/TBME.2018.2810508
Henriksson M., Petrenas A., Marozas V., Sandberg F., Sornmo L. (2018b). Model-based assessment of f-wave signal quality in patients with atrial fibrillation. IEEE Trans. Biomed. Eng. 65, 2600–2611. doi:10.1109/TBME.2018.28105082018.2810508
Herweg B., Dalal P., Nagy B., Schweitzer P. (1998). Power spectral analysis of heart period variability of preceding sinus rhythm before initiation of paroxysmal atrial fibrillation. Am. J. Cardiol. 82, 869–874. doi:10.1016/s0002-9149(98)00494-9
Hindricks G., Potpara T., Dagres N., Arbelo E., Bax J. J., Blomström-Lundqvist C., et al. (2021). 2020 esc guidelines for the diagnosis and management of atrial fibrillation developed in collaboration with the european association for cardio-thoracic surgery (eacts) the task force for the diagnosis and management of atrial fibrillation of the european society of cardiology (esc) developed with the special contribution of the european heart rhythm association (ehra) of the esc. Eur. heart J. 42, 373–498. doi:10.1093/eurheartj/ehaa612
Holmqvist F., Stridh M., Waktare J. E. P., Brandt J., Sörnmo L., Roijer A., et al. (2005). Rapid fluctuations in atrial fibrillatory electrophysiology detected during controlled respiration. Am. J. Physiology-Heart Circulatory Physiology 289, H754–H760. doi:10.1152/ajpheart.00075.2005ajpheart.00075.2005
Joglar J. A., Chung M. K., Armbruster A. L., Benjamin E. J., Chyou J. Y., Cronin E. M., et al. (2024). 2023 ACC/AHA/ACCP/HRS guideline for the diagnosis and management of atrial fibrillation: a report of the American college of cardiology/American heart association joint committee on clinical practice guidelines. Circulation 149, e1–e156. doi:10.1161/CIR.0000000000001193
Kneller J., Zou R., Vigmond E. J., Wang Z., Leon L. J., Nattel S. (2002). Cholinergic atrial fibrillation in a computer model of a two-dimensional sheet of canine atrial cells with realistic ionic properties. Circulation Res. 90, E73–E87. doi:10.1161/01.RES.0000019783.88094.BA
Kontaxis S., Lázaro J., Corino V. D., Sandberg F., Bailón R., Laguna P., et al. (2019). ECG-derived respiratory rate in atrial fibrillation. IEEE Trans. Biomed. Eng. 67, 905–914. doi:10.1109/TBME.2019.2923587
Lankveld T. A. R., Zeemering S., Crijns H. J. G. M., Schotten U. (2014). The ECG as a tool to determine atrial fibrillation complexity. Heart British Card. Soc. 100, 1077–1084. doi:10.1136/heartjnl-2013-305149
Li D., Zhang L., Kneller J., Nattel S. (2001). Potential ionic mechanism for repolarization differences between canine right and left atrium. Circulation Res. 88, 1168–1175. doi:10.1161/hh1101.091266
MacCannell K., Bazzazi H., Chilton L., Shibukawa Y., Clark R. B., Giles W. R. (2007). A mathematical model of electrotonic interactions between ventricular myocytes and fibroblasts. Biophysical J. 92, 4121–4132. doi:10.1529/biophysj.106.101410
Malhotra V., Thakare A. E., Hulke S. M., Wakode S. L., Parashar R., Ravi N. (2021). Effect of head down tilt on heart rate variability. J. Fam. Med. Prim. Care 10, 439–442. doi:10.4103/jfmpc.jfmpc_1642_20
Manabe N., Foldes F. F., Torocsik A., Nagashima H., Goldiner P. L., Vizi E. S. (1991). Presynaptic interaction between vagal and sympathetic innervation in the heart: modulation of acetylcholine and noradrenaline release. J. Aut. Nerv. Syst. 32, 233–242. doi:10.1016/0165-1838(91)90117-l
Mase M., Disertori M., Ravelli F. (2009). Cardiorespiratory interactions in patients with atrial flutter. J. Appl. Physiology Bethesda, Md. 106 (106), 29–39. doi:10.1152/japplphysiol.91191.2008
Mase M., Glass L., Ravelli F. (2008). A model for mechano-electrical feedback effects on atrial flutter interval variability. Bull. Math. Biol. 70, 1326–1347. doi:10.1007/s11538-008-9301-x
Nair S. S., Govindankutty M. M., Balakrishnan M., Prasad K., Sathyaprabha T. N., Udupa K. (2023). Investigation of autonomic dysfunction in alzheimer’s disease-a computational model-based approach. Brain Sci. 13, 1322. doi:10.3390/brainsci13091322
Östenson S., Corino V. D. A., Carlsson J., Platonov P. G. (2017). Autonomic influence on atrial fibrillatory process: head-up and head-down tilting. Ann. Noninvasive Electrocardiol. 22, e12405. doi:10.1111/anec.12405
Park J., Lee C., Leshem E., Blau I., Kim S., Lee J. M., et al. (2019). Early differentiation of long-standing persistent atrial fibrillation using the characteristics of fibrillatory waves in surface ECG multi-leads. Sci. Rep. 9, 2746. doi:10.1038/s41598-019-38928-6
Pizzo E., Berrettoni S., Kaul R., Cervantes D. O., Di Stefano V., Jain S., et al. (2022). Heart rate variability reveals altered autonomic regulation in response to myocardial infarction in experimental animals. Front. Cardiovasc. Med. 9, 843144. doi:10.3389/fcvm.2022.843144
Plappert F., Engstrom G., Platonov P. G., Wallman M., Sandberg F. (2024). ECG-based estimation of respiration-induced autonomic modulation of AV nodal conduction during atrial fibrillation. Front. Physiology 15, 1281343. doi:10.3389/fphys.2024.1281343
Plappert F., Wallman M., Abdollahpur M., Platonov P. G., Östenson S., Sandberg F. (2022). An atrioventricular node model incorporating autonomic tone. Front. Physiology 13, 976468. doi:10.3389/fphys.2022.976468
Platonov P. G., Corino V. D. A., Seifert M., Holmqvist F., Sornmo L. (2014). Atrial fibrillatory rate in the clinical context: natural course and prediction of intervention outcome. Eur. Eur. Pacing, Arrhythm. Cardiac Electrophysiol. J. Work. Groups Cardiac Pacing, Arrhythm. Cardiac Cell. Electrophysiol. Eur. Soc. Cardiol. 16 (Suppl. 4), iv110–iv119. doi:10.1093/europace/euu249
Platonov P. G., Mitrofanova L. B., Orshanskaya V., Ho S. Y. (2011). Structural abnormalities in atrial walls are associated with presence and persistency of atrial fibrillation but not with age. J. Am. Coll. Cardiol. 58, 2225–2232. doi:10.1016/j.jacc.2011.05.061
Porta A., Marchi A., Bari V., Catai A. M., Guzzetti S., Raimondi F., et al. (2014) “Directionality in cardiovascular variability interactions during head-down tilt test,” in Annual international Conference of the IEEE Engineering in Medicine and biology society. IEEE Engineering in Medicine and biology society. Annual international conference 2014, 6008–6011. doi:10.1109/EMBC.2014.6944998
Ravelli F., Mase M., Disertori M. (2008). Mechanical modulation of atrial flutter cycle length. Prog. Biophysics Mol. Biol. 97, 417–434. doi:10.1016/j.pbiomolbio.2008.02.018
Rohr S., Kucera J. P., Kléber A. G. (1998). Slow conduction in cardiac tissue, i: effects of a reduction of excitability versus a reduction of electrical coupling on microconduction. Circulation Res. 83, 781–794. doi:10.1161/01.res.83.8.781
Sanders P., Morton J. B., Davidson N. C., Spence S. J., Vohra J. K., Sparks P. B., et al. (2003). Electrical remodeling of the atria in congestive heart failure: electrophysiological and electroanatomic mapping in humans. Circulation 108, 1461–1468. doi:10.1161/01.CIR.0000090688.49283.67
Sarmast F., Kolli A., Zaitsev A., Parisian K., Dhamoon A. S., Guha P. K., et al. (2003). Cholinergic atrial fibrillation: Ik,ACh gradients determine unequal left/right atrial frequencies and rotor dynamics. Cardiovasc. Res. 59, 863–873. doi:10.1016/s0008-6363(03)00540-61016/S0008-6363(03)00540-6
Schotten U., Verheule S., Kirchhof P., Goette A. (2011). Pathophysiological mechanisms of atrial fibrillation: a translational appraisal. Physiol. Rev. 91, 265–325. doi:10.1152/physrev.00031.2009
Seemann G., Hoper C., Sachse F. B., Dossel O., Holden A. V., Zhang H. (2006). Heterogeneous three-dimensional anatomical and electrophysiological model of human atria. Philosophical Trans. Ser. A, Math. Phys. Eng. Sci. 364, 1465–1481. doi:10.1098/rsta.2006.1781
L. Sornmo (2018). Atrial fibrillation from an engineering perspective, series in bioengineering (Springer).
Stridh M., Meurling C., Olsson B., Sornmo L. (2003). Detection of autonomic modulation in permanent atrial fibrillation. Med. and Biol. Eng. and Comput. 41, 625–629. doi:10.1007/BF02349969
Tomita T., Takei M., Saikawa Y., Hanaoka T., Uchikawa S.-I., Tsutsui H., et al. (2003). Role of autonomic tone in the initiation and termination of paroxysmal atrial fibrillation in patients without structural heart disease. J. Cardiovasc. Electrophysiol. 14, 559–564. doi:10.1046/j.1540-8167.2003.02462.x1540-8167.2003.02462.x
Vandenberk B., Haemers P., Morillo C. (2023). The autonomic nervous system in atrial fibrillation-pathophysiology and non-invasive assessment. Front. Cardiovasc. Med. 10, 1327387. doi:10.3389/fcvm.2023.13273873389/fcvm.2023.1327387
Varon C., Lázaro J., Bolea J., Hernando A., Aguiló J., Gil E., et al. (2019). Unconstrained estimation of hrv indices after removing respiratory influences from heart rate. IEEE J. Biomed. Health Inf. 23, 2386–2397. doi:10.1109/JBHI.2018.2884644
Wang Z., Fermini B., Nattel S. (1993). Sustained depolarization-induced outward current in human atrial myocytes. Evidence for a novel delayed rectifier K+ current similar to Kv1.5 cloned channel currents. Circulation Res. 73, 1061–1076. doi:10.1161/01.res.73.6.1061
Wang Z. G., Pelletier L. C., Talajic M., Nattel S. (1990). Effects of flecainide and quinidine on human atrial action potentials. Role of rate-dependence and comparison with Guinea pig, rabbit, and dog tissues. Circulation 82, 274–283. doi:10.1161/01.cir.82.1.274
Waxman M. B., Yao L., Cameron D. A., Kirsh J. A. (1991). Effects of posture, Valsalva maneuver and respiration on atrial flutter rate: an effect mediated through cardiac volume. J. Am. Coll. Cardiol. 17, 1545–1552. doi:10.1016/0735-1097(91)90645-P
Wesselink R., Neefs J., van den Berg N. W. E., Meulendijks E. R., Terpstra M. M., Kawasaki M., et al. (2022). Does left atrial epicardial conduction time reflect atrial fibrosis and the risk of atrial fibrillation recurrence after thoracoscopic ablation? post hoc analysis of the AFACT trial. BMJ open 12, e056829. doi:10.1136/bmjopen-2021-056829
Wetzel G. T., Brown J. H. (1985). Presynaptic modulation of acetylcholine release from cardiac parasympathetic neurons. Am. J. Physiology 248, H33–H39. doi:10.1152/ajpheart.1985.248.1.H331152/ajpheart.1985.248.1.H33
Whittle R. S., Keller N., Hall E. A., Vellore H. S., Stapleton L. M., Findlay K. H., et al. (2022). Gravitational dose-response curves for acute cardiovascular hemodynamics and autonomic responses in a tilt paradigm. J. Am. Heart Assoc. 11, e024175. doi:10.1161/JAHA.121.024175
Wyse D. G., Van Gelder I. C., Ellinor P. T., Go A. S., Kalman J. M., Narayan S. M., et al. (2014). Lone atrial fibrillation. J. Am. Coll. Cardiol. 63, 1715–1723. doi:10.1016/j.jacc.2014.01.023
Keywords: atrial fibrillation, autonomic nervous system, ECG processing, f-wave frequency, parasympathetic regulation, respiratory modulation
Citation: Abdollahpur M, Celotto C, Sánchez C, Plappert F, Östenson S, Platonov PG, Laguna P, Pueyo E and Sandberg F (2025) Tilt-induced changes in f-wave characteristics during atrial fibrillation: an experimental and computational investigation. Front. Physiol. 16:1498426. doi: 10.3389/fphys.2025.1498426
Received: 18 September 2024; Accepted: 23 May 2025;
Published: 13 June 2025.
Edited by:
Tomislav Stankovski, Saints Cyril and Methodius University of Skopje, North MacedoniaReviewed by:
Zoran Andrija Matić, University of Pisa, ItalyAlejandro Liberos, Universitat Politècnica de València, Spain
Pawel Stanislav Kostka, Silesian University of Technology, Poland
Copyright © 2025 Abdollahpur, Celotto, Sánchez, Plappert, Östenson, Platonov, Laguna, Pueyo and Sandberg. This is an open-access article distributed under the terms of the Creative Commons Attribution License (CC BY). The use, distribution or reproduction in other forums is permitted, provided the original author(s) and the copyright owner(s) are credited and that the original publication in this journal is cited, in accordance with accepted academic practice. No use, distribution or reproduction is permitted which does not comply with these terms.
*Correspondence: Mostafa Abdollahpur, bW9zdGFmYS5hYmRvbGxhaHB1ckBibWUubHRoLnNl
†These authors have contributed equally to this work and share first authorship