 Robert Robergs
 Bridgette O’Malley1,2
- 1School of Exercise and Nutrition Sciences, Faculty of Health, Queensland University of Technology, Kelvin Grove, QL, Australia
- 2Faculty of Health Studies, Jan Evangelista Purkyne University, Usti nadLabem, Czechia
- 3Department Of Sports Medicine and Active Health Sciences, Faculty of Medicine, Charles University, Pilsen, Czechia
- 4Queensland Academy Of Sport, Nathan, QL, Australia
Introduction: The traditional method for quantifying the kinetics of the increase in the body’s consumption of oxygen (
Methods: Fourteen highly endurance trained subjects (12 males, 2 females) completed a ramp incremental cycling protocol, as well as 8 different constant load trials at 43 to 148 % of their critical power (CP).
Results: For the initial five exercise bouts, the linear fit of the initial segment was significantly more accurate (lower standard error of estimates; SE) compared to the mono-exponential fit (p < 0.001). There were two different systematic profiles of the linear onset (LO)
Discussion: The LO
Introduction
As this research presents evidence for application of a new method for studying the whole body’s consumption of oxygen (
Hill et al. (1923) and Hill et al. (1924) applied mono-exponential curve fitting to their
The earliest study we could find that provided a mathematical function for the non-linear increase in
Margaria et al. (1965) presented a similar equation for the non-linear
where
In the 1960s, despite major limitations in research design, sample sizes, small datasets per exercise condition resulting from instrumentation and method constraints, and no rigorous elucidation of competing model scenarios, the mono-exponential model of this
where
Consequently, during this time period there were numerous limitations to the establishment of the mono-exponential model of the
Considerable research exists on
where ∆
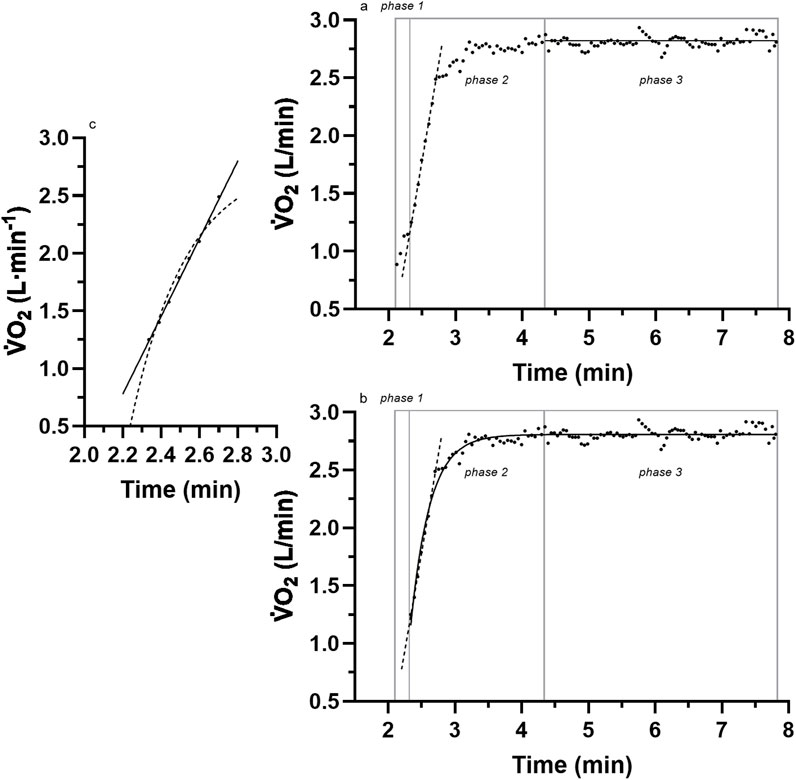
Figure 1. A sample of breath-by-breath
The persistent acceptance of the mono-exponential model is unfortunate because considerable research has produced inconsistent data (anomalies) with such a model. Whipp and Wasserman (1972) presented representative raw data from one of their subjects and revealed linear responses for the initial 1 min of the exercise transition
More recent evidence of anomalies to the initial linear segment of the mono-exponential model were reported by Hughson and Morrissey (1982) (see their Figure 2, and 2 p. 923,924) and Poole and Jones (2012) (see their Figure 5, p. 5; Figure 9, p.11), although in both instances, the anomalies remained undetected. Unfortunately, the identification and scientific investigation of the linear onset anomalies did not occur until Robergs (2014) critically commented on the methods used in research of the
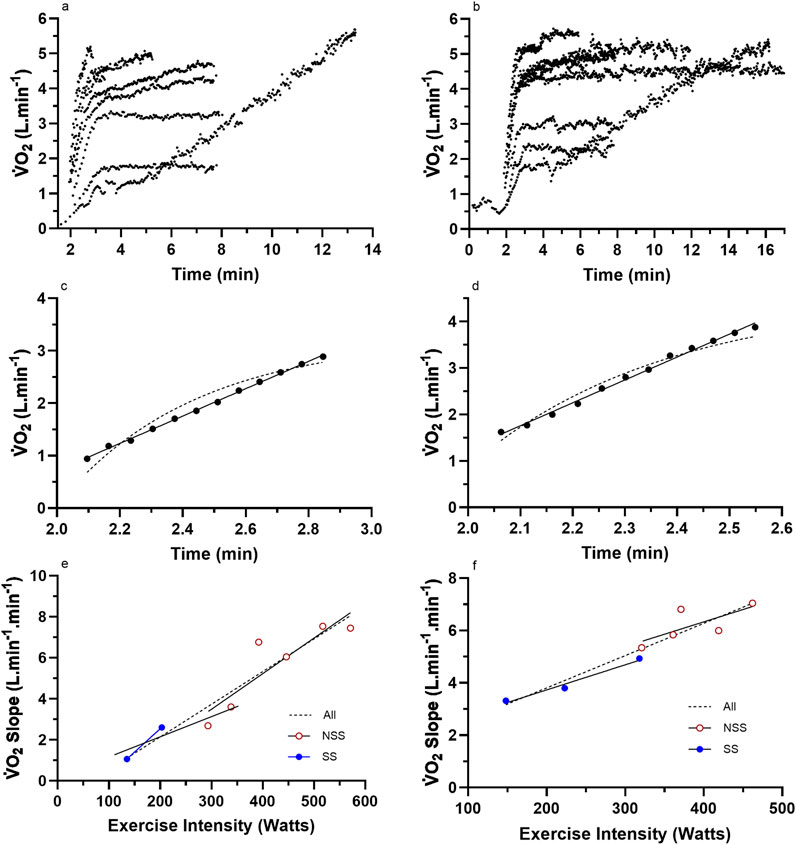
Figure 2. Representative data from two subjects for (a,b) the nine (incremental exercise to
Consequently, the purpose of this research was to further investigate the linear onset
Methods
All procedures of this research were screened and approved by the University Human Research Ethics Committee (UHREC) (ethics number 4252), which adheres to all pertinent requirements of the Declaration of Helsinki applicable to medical and non-medical research on human participants.
Participants
Prior data analyses of different physiological topics concerning this research have been published elsewhere (O’Malley et al., 2024). Participants were recruited through social media advertising and were required to be currently completing at least three 45-min cycling endurance sessions per week. Post-recruitment required further evaluation of the subjects to ascertain whether certain additional inclusion and exclusion criteria were met. Such criteria involved the absence of cardiopulmonary, metabolic, and musculoskeletal diseases or conditions, any musculoskeletal injuries, or surgical procedures within 3 months of data collection. This was aided by the completion of the Australian Adult Pre-Exercise Screening System (APSS) questionnaire (Exercise Is Medicine - Australia, 2024). Male and female participants were required to be aged 18–45 and 18–55 years, respectively, as per ACSM maximal exercise testing guidelines (Liguori et al., 2022). Subjects were also required to have no prior history or current use of tobacco smoking.
After this evaluation, 14 (12 male and 2 female) healthy subjects (Table 1) were required to provide their written informed consent to participate in the upcoming exercise trials of the study. According to preliminary sample size estimation (a priori), a total of 12 participants were deemed necessary, considering an estimated effect size of 0.5, statistical power of 0.8, and α level of 0.05 (GPower, v3.1.9.4, Universität Kiel, Germany). Nevertheless, the sample size was set at 14 to accommodate potential instances of missing data or participant withdrawal from the study.
Table 1. Descriptive characteristics of the subjects.
Testing protocols
All tests were conducted within the exercise physiology laboratory of the Institute of Health and Biomedical Innovation (IHBI) at the Queensland University of Technology. As previously explained by O’Malley et al. (2024), the testing protocol was conducted over 4 days and consisted of one familiarization session, a continuous incremental cycle ergometer ramp protocol to maximal exertion for the measurement of the maximal rate of oxygen consumption (
Familiarization session
This protocol introduced subjects to the research laboratory and involved a briefing on the exercise protocols, measurement of the subjects’ age (years), body mass (kg), height (cm), fitness level (low, moderate, and high), and resting heart rate (beats⋅min-1), and the completion of a
Prior to the commencement of the
Heart rate and electrocardiography (ECG) data were collected to monitor any adverse cardiovascular events as a direct result of severe exercise testing protocols and were measured through a 5-lead ECG configuration (Custo-Med, Ottobrunn, Germany). Post-testing protocols required the subject to perform low-intensity (∼50 W) cycling for 2 min on a cycle ergometer as an active cool-down. The subject was then instructed to dismount the ergometer and lie supine for a period of 10 min to support recovery.
LMCL and HSCL tests
All constant-intensity exercise bouts were distributed over 3 days with a minimum of 24 h between the days of testing. The LMCL bouts always preceded the HSCL bouts, and the four bouts of each category were administered in a Latin Squares order across all participants (a sequentially different order of bouts across subjects to vary the test order between subjects). On day 2 of testing (24 h following
The LMCL tests consisted of a period of 2 min of rest upon the cycle ergometer where gas exchange data were collected, followed by 2 min of unloaded cycling and 6 min of cycling at a constant power output. Following each LMCL test, participants were required to lie supine for a period of 10 min to mitigate any risk of adverse events. The HSCL tests also required participants to rest for 2 min on the cycle ergometer to collect gas exchange data to ascertain the quality of the calibration, followed by cycling at the predetermined exercise intensity. For all HSCL tests, Watts values were programmed into the electronic ergometer prior to the start of each bout, were applied automatically once the cadence exceeded 35 rev·min-1, and required ∼3 s to attain the set target value. Participants exercised until exhaustion, verified by the inability to sustain cadence within 10 rev·min-1 from their chosen target. For safety reasons, prior to allowing the participants to leave, participants were also required to lie supine for 15 min after their final HSCL test.
Throughout all trials, participants were kept unaware of the exercise intensity and elapsed time but were provided visual awareness of their cadence. When participants returned on day 3, they completed two HSCL trials and 1 LMCL trial (65% of Wpeak), and on the fourth testing day, subjects completed one remaining HSCL test and one LMCL test (75% of Wpeak).
Measurements
Pulmonary gas exchange measurements
All exercise tests were completed using an electronically braked cycle ergometer (Excalibur Sport, Corval Lode B.V., Lode Medical Technology, Groningen, the Netherlands), with gas exchange data being collected using a compliant and elastic mixing bag connected to the expired side of the mouthpiece. Expired air was constantly pumped from the mixing bag to rapid-response electronic gas analyzers (AEI Technologies, Model S-3 A and Model CD-3H, Pittsburg, PA, USA) and sampled from the analyzers for 100 m at the start of each new inhalation using a data acquisition system (National Instruments, Austin, TX) controlled by custom software (LabVIEW™, National Instruments, Austin, TX). Ventilation was measured from integrated air flow using a fast-response turbine flow transducer (Hans Rudolph-430, Van Nuys, CA, USA) connected to the inspired side of the mouthpiece and integrated into the same data acquisition system and custom software. The flow turbine processed air flow signals so that tidal volumes were included as an output analog signal (Kim and Robergs, 2012). The calibration of the breath-by-breath system was conducted prior to the ramp test using a commercial medical-grade calibration gas (room air and then 17.2% O2 and 4.13% CO2) and a 3-L syringe.
Data processing
The detection of the subjects’ VT was necessary to determine the appropriate HSCL exercise testing intensity. The detection of the subjects’ VT was established using the ventilatory equivalents method with custom-made software (LabVIEW™, National Instruments, Austin, TX, USA). This occurred by applying linear segments to three areas and subsequently adjusting them to the lowest residual error. VT was determined as the time of intersection between the baseline response (slope ∼0), also known as segment 1, and the initial deviation from baseline, also known as segment 2. The detection of this intersection required the agreement between two investigators (±10 s). This measure and method were detailed, compared to other methods, and validated by Caiozzo et al. (1982). In more recent years, the VT has been referred to as the gas exchange threshold (GET) that occurs prior to the second ventilatory breakpoint (the respiratory compensation point, RCP) (Jamnick et al., 2020; Poole et al., 2021).
The subjects’ peak power (Wpeak) was useful for the determination of the correct intensity for the LMCL exercise test (Equation 5).
where tte = time to exhaustion; resting time = total time taken for resting gas exchange data to be met; ramp function = the pre-determined ramp Wattage increment (Watts·min-1) from the test of
All data cleaning and processing was carried out using custom-developed software (LabVIEW™, National Instruments, Austin, TX, USA), in which breath-by-breath variability in the data (caused by variation in tidal volume and breathing frequency) were restrained by applying a 7-breath moving average for all data.
CP was quantified from the data for TTE and Watts from the four HSCL exercise bouts of each participant. The calculation of CP was first based on graphing the TTE (y-axis) to exercise intensity (Watts) (x-axis) using commercial graphics and curve fitting software (GraphPad Prism, V10, Boston, MA, USA). The graphical data were then fit with a one-phase exponential decay (Equation 1). The CP was computed as the Watts at the decay plateau response resulting from the increasing TTE across lower exercise intensities (Watts). For the calculation of the curvature constant (W′), the data were transformed to reciprocal values, followed by application of linear regression, where the slope of the linear response equated to W’ (Equation 6) (Jones et al., 2010; Poole et al., 2016).
Curve fitting for all relevant phases of the full VO2 dataset of each bout was also conducted using added features of the custom-developed software, in which all traditional phases were named and identified [Phase 1, Phase 2, Linear Onset (LO), Total Mono-exponential, Remainder Mono-exponential (the data from the end of the LO segment to the end of the data), and (if applicable) Slow Component]. For the purposes of this manuscript, only the LO-phase data were analyzed for all exercise bouts. For steady-state exercise bouts, mono-exponential analyses were also performed. Steady-state
The LO segment data slope was identified by the removal of the Phase 1 data, which, by definition, indicated the beginning of the Phase 2 segment. The Phase 1 data were detected through an exaggerated kinetic response that leveled to the then sustained increase in
Graphs were fitted for all subjects for the LO slope (y-axis) vs. the exercise intensity (%CP) (x-axis) from each of the LMCL and HSCL exercise bouts. Upon the completion of the LO slope analysis, each subject’s results were analyzed to gauge the general linearity vs. non-linearity of their results. Based on an increasing vs. stable or decreasing slope across the last three data points, subjects were then placed into either a “continuous” or “plateau” category (see Figures 2, 3), whereby subsequent analyses could assess the significance of group differences for pertinent variables (See Results).
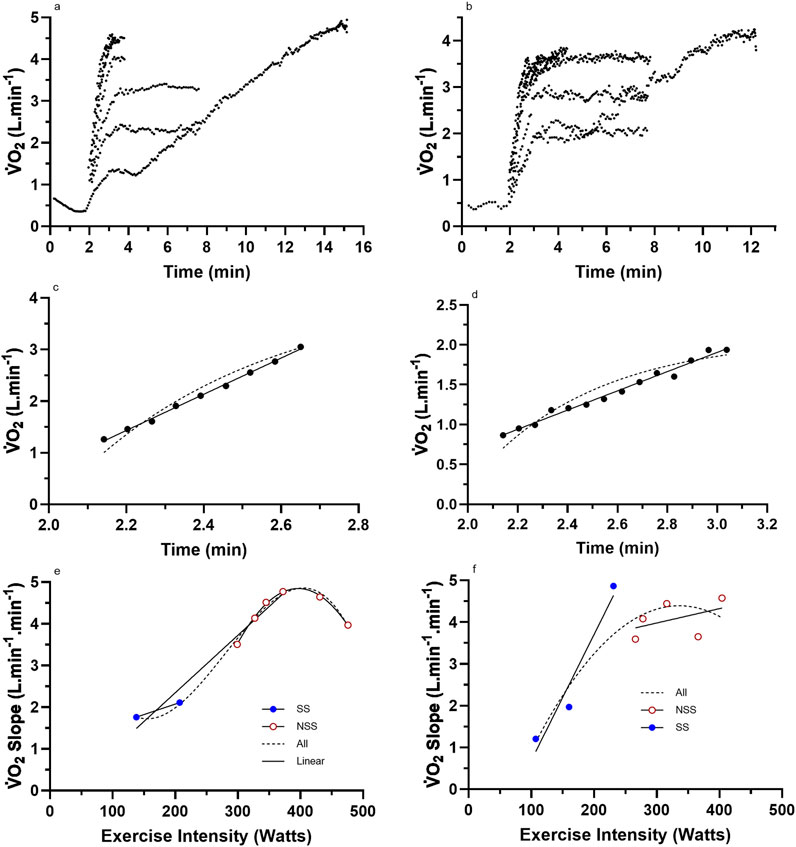
Figure 3. Representative data from two subjects for (a,b) the nine (incremental exercise to
Statistical analyses
Mean data statistical analyses were completed using IBM SPSS Statistics for Windows (Version 26.0. Armonk, NY: IBM Corp). Such analyses included a Shapiro–Wilk test for documenting the normality of the data for the dependent variables of exercise intensities expressed as %CP, the LO segment SE, for both linear and mono-exponential fits for the initial five exercise bouts (four LMCL and initial HSCL), and the linear slopes of the LO segment for all LMCL and HSCL bouts for the subjects of both the “continuous” or “plateau” groups.
A one-way repeated-measures ANOVA was used to document the extent of differences between the eight different exercise intensities. A two-way repeated-measures ANOVA was used for the SE of the LO segment across exercise intensity (five levels: four LMCL and initial HSCL bouts expressed as %CP) vs. curve fitting (two levels: linear vs. mono-exponential). A mixed-design (between–within) two-way ANOVA was used for the LO slopes across all exercise intensities (eight levels: four LMCL and four HSCL bouts expressed as %CP) vs. GROUP (two levels: “continuous” vs. “plateau”). Significance for both the one- and two-way ANOVAs was observed through the generic sphericity-assumed trait. For both two-way ANOVA analyses, if there was a non-significant interaction, main effects were interpreted. For the mixed-design two-way ANOVA, a significant interaction effect was followed by post hoc analyses using the Tukey test. The difference between “continuous” vs. “plateau” groups for selected variables of cardio-respiratory and muscular endurance fitness was investigated using one-sided unpaired t-tests.
Results
Descriptive characteristics
The descriptive data for the subjects are presented in Tables 1, 2. Note that despite the relatively high level of training of the participants, there was a large range in
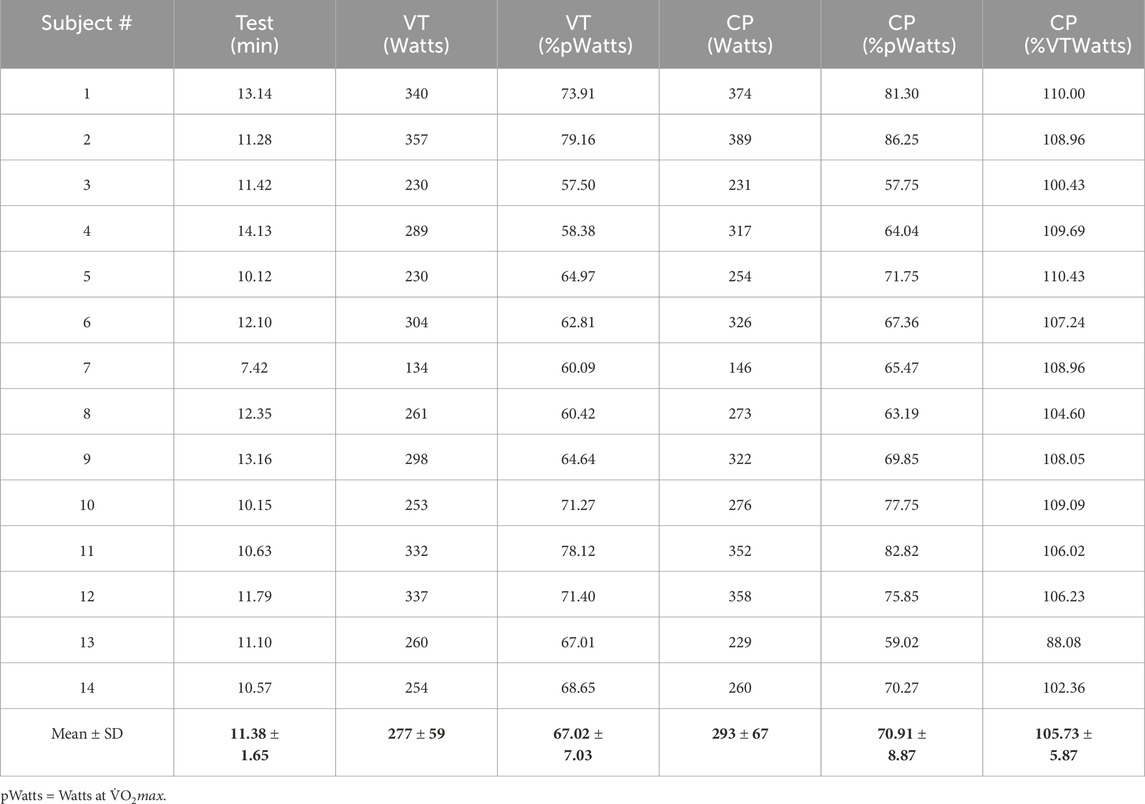
Table 2. Added variables from the incremental exercise test.
Representative subject data
Raw and processed
It is important to document the linearity of the initial segment. We refer to this as the linear onset (LO) segment, but traditional terminology would label it as the initial segment of the Phase 2 response. This linear segment across all subjects and exercise bouts (=112 data sets) consisted of 6–24 data points (=breaths) with a mean ± SD = 10.2 ± 3.0. Of the 112 datasets, 111 had statistical significance (slope different to 0.0) of p < 0.0001, while the remaining dataset had significance at p = 0.0003. This segment is clearly linear, is highly consistent across all subjects and exercise intensity trials, and consequently, represents a different physiological entity to the mono-exponential dependence of the traditional Phase 2 dataset (see the next sub-section and Discussion). From a time perspective, the data for the LO segment for mean ± SD and range (min–max) of the start (exercise commenced at 2 min) and end times, and then segment duration and range, were 2.1 ± 0.16 min (1.75–3.18 min), 2.54 ± 0.18 min (2.16–3.44 min), and 0.44 ± 0.15 (0.22–1.08 min), respectively.
The exercise intensities of the eight different bouts were expressed relative to each subject’s critical power, and these values were analyzed using repeated-measures one-way ANOVA. Results revealed an overall significance (F = 885.451; df = 1, p < 0.001), with each level of INTENSITY being significantly different (p < 0.001). Mean ± SD results for these data are 42.94 ± 5.35, 64.37 ± 8.04, 92.97 ± 11.55, 98.79 ± 10.99, 110.47 ± 9.72, 115.96 ± 11.24, 134.41 ± 12.99, and 148.36 ± 14.30 %CP. Although this analysis was expected to reveal the significance between each exercise condition, the core purpose was to quantify the percentage of the CP for each exercise condition so that the responses of the LO
Linear onset vs. mono-exponential method
The main research question concerned the comparison of the linear regression results of the LO segment to the traditional mono-exponential fit to the entire dataset of the steady-state bouts applied to the LO segment. This could not be done for the highest three exercise intensities as the
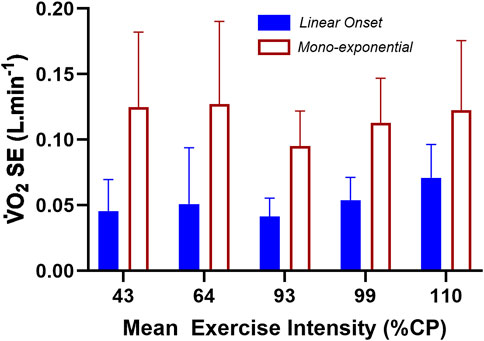
Figure 4. The standard error of the estimate (SE) results for the linear fit of the LO segment vs. the forced mono-exponential fit of the total
Results from the repeated-measures two-way ANOVA of the SE data revealed a non-significant INTENSITY main effect (F = 1.979; df = 4; p = 0.111), a significant METHOD main effect (F = 99.273; df = 1; p < 0.001), and a non-significant INTENSITY × METHOD interaction (F = 2.053; df = 4; p = 0.100). Based on the SE of the linear vs. mono-exponential fit of the LO segment data, there was a significantly lower residual error when applying linear-onset kinetics, regardless of the exercise intensity or whether the constant-load bouts were steady-state or non-steady-state.
Group data based on linear vs. non-linear
For the subjects of all Figure 2 subset data, the data responses revealed consistent linear responses for the LO
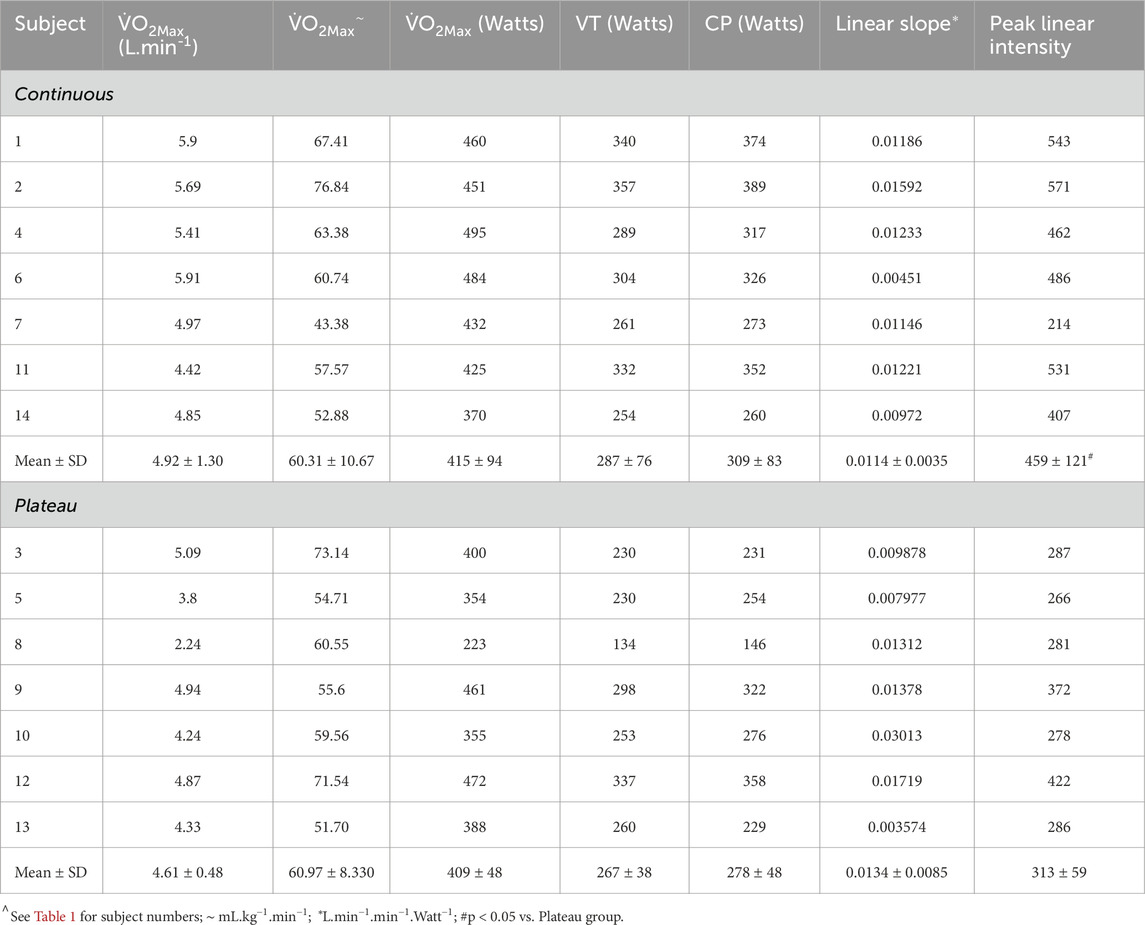
Table 3. Subject characteristics for continuous vs. plateau grouping.
An additional mixed-design (between–within) ANOVA was run for the LO
These systematic (non-random) responses reveal the presence of complex physiology that has yet to be identified in prior research on
The ANOVA results and subsequent Figure 5 show the similarity in LO
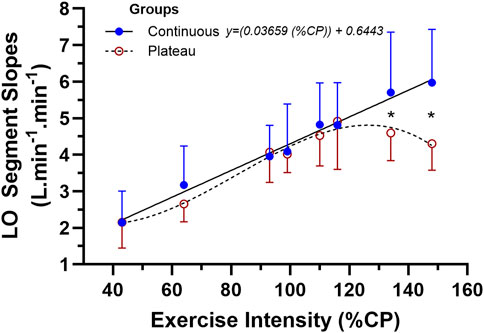
Figure 5. The mean ± SD data for the two-way mixed-design ANOVA for the linear-onset
Some of the additional descriptive data collected during this study could assist in explaining the marked group differences in LO
These are a surprising collection of results given the relatively homogenous subject sample, the unique nature of the data processing methods of this research, and the ability of the linear-onset
Discussion
Overview
This study involved two components. The first component compared the linear vs. mono-exponential fit of the LO data segment (∼1 min)
An added purpose was to further explore the utility of the LO
As previously introduced, the traditional mono-exponential model of the
The added importance of an additional feature of LO
The reduced residual error of linear-onset
McNulty and Robergs (2017) reported a statistically significant reduced SE for the linear regression model of the LO
Across the five lowest exercise intensities (43, 64, 93, 99, and 110 %CP), the
Explanation of the grouped differences in linear-onset
The results provided in Table 3 and Figures 2, 3, 5 indicate that some subjects can maintain a continual linear increase in their LO
What aspects of exercise physiology could account for these results? This exploratory study discovered highly original findings and therefore was not designed to answer this question. Future research studies need to document these physiological determinants; for now, we can only use knowledge and rationale thinking to speculate potential mechanisms. To commence this process, it is best to formulate a flow diagram of the physiology that could influence the LO
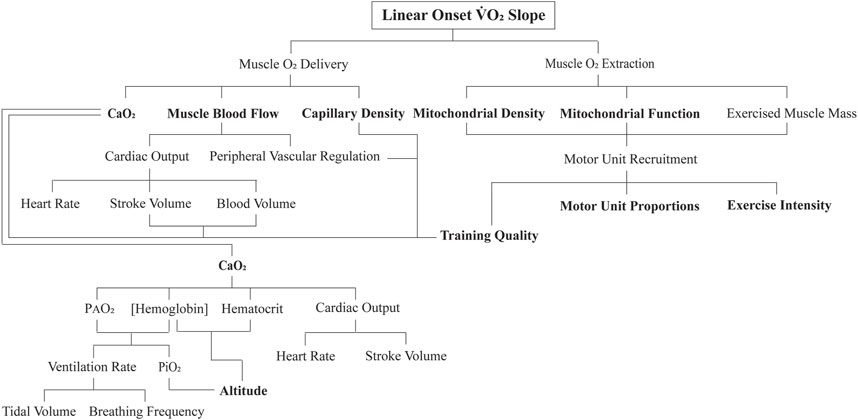
Figure 6. Flow diagram of the proposed key physiological determinants to the linear onset (LO)
To begin with, applying a higher exercise intensity for an exercise transition necessitates an increase in motor unit recruitment. During such an increasing skeletal muscle metabolic demand, there is a subconscious refinement to recruit more motor units (Hug et al., 2022). As best as we can tell from animal research, humans recruit motor units in a similar-size principle-governed manner, with slow-twitch categories of motor units recruited first, followed by a progressive additive recruitment of intermediate-twitch motor unit categories, and eventually the recruitment of pure fast-twitch glycolytic motor units (Mendell, 2005). This increasing active muscle mass, accompanied by an increasing rate of contraction frequency or contraction force for a given frequency (pertinent for this study as each subject was required to maintain the same cadence for all exercise bouts) does not require large changes in cellular metabolic regulation (Petajan, 1991). The added contracting muscle fibers add more units of
As observed in Figure 5, for the low- to moderate- and then initially non-steady-state exercise intensities, the subjects of both groups of responders had similar multiple bout LO
A potential explanation within the context of motor units could be the influence of the different genetics of the subjects to the trainability of their muscle metabolic, cardiovascular, and neuromuscular systems. Numerous studies have investigated the genomic differences between individuals that may account for changes in
Although the intent of subject recruitment was to create a comprehensive profile on highly trained subjects, individual physiological adaptations that occur as a result of training intensity may still differ between subjects, which, in turn, can account for significant differences in
These results were further reinforced by that of Lundby and Jacobs (2016) where they confirmed that exercise-induced adaptations conducive to improved mitochondrial function are dependent on the intensity of the training and are most likely explained by the improved expression of mitochondrial enzymes that accelerate aerobic metabolism. In this study, subjects were recruited based on a loose training volume measurement (minimum of 3 × 45 min cycling sessions per week), whereby the training intensity was overlooked. Therefore, while meeting our predetermined standard of “highly trained,” the underlying physiological adaptations as a direct result of the exercise they had undergone, specifically, their skeletal muscle mitochondria function, might not have been entirely indicative of a high endurance performance. Hence, the contrasting responses of the LO
Despite the prior research evidence, the results of this study are clear in revealing that the physiological determinants of the between-subject variability in the LO
Such observations and interpretations are particularly pertinent for the method and data we present for LO
There is growing interest in the modeling of exercise transitions from steady state to non-steady state (Korzeniewski and Zoladz, 2015; Dunst et al., 2025). Although this work is interesting from the perspectives of mathematics, physiology, and real-world applications, it remains constrained in relevance to the LO
At the commencement of a constant-load exercise bout ending in steady state,
In conclusion, based on the results of this study, most of the prior research works on the SC have defined it to be across all non-steady-state transitions in the heavy- to severe-intensity domains (Poole et al., 1991). For example, Jones et al. (2011) defined the
Limitations
This study has a range of limitations. The study involved highly trained participants aged 18–55 years, limiting its relevance to elite-level endurance athletes, untrained individuals, those with chronic conditions or disorders, and people outside this age group. However, as shown in Tables 1, 2, there was a wide range in data for
The issue of gender-based differences is always pertinent to address given the limited research on female subjects. As only two participants were women, despite efforts to recruit more, there is insufficient evidence to generalize the findings to all women or to be able to explore gender differences in this LO
A significant limitation is that the research was focused on cycling, making it potentially inapplicable to running or other forms of exercise. Multiple tests were conducted on designated test days, and it was assumed that the subjects' moderate to high fitness levels, in addition to the rest periods, were sufficient to ensure adequate recovery before subsequent tests and that prior exercise did not affect subsequent exercise sessions. This issue is reduced by the study’s design, which compared one method to another across multiple data sets. To minimize time-of-day errors, tests were conducted at the same time each day for each participant. The validity of the instruments, such as expired gas analysis indirect calorimetry, was ensured by calibrating the system immediately before each test and using a previously validated custom system of breath-by-breath expired gas analysis indirect calorimetry (Kim and Robergs, 2012).
Conclusions and recommendations
The study of
The current research is not only consistent with past results (McNulty and Robergs, 2017) but has also expanded them to include non-steady-state or severe exercise—once again indicating a lower SE of a linear vs. mono-exponential fit during the LO segment. When all the eight, constant-intensity LO
This study reveals potential for further physiological research into the existence of the LO segment and related kinetics from different researchers and laboratories, applied to different exercise modes, and how interventions (e.g., hypoxia, exercise modes, and exercise training) or causal comparative differences between pre-existing groups (e.g., health status, diseases, altitude acclimation, and physical fitness levels) influence LO
The results of this research, and the opportunities this creates, are exciting as they present novel opportunities to further explore the physiology of exercise during a wide range of increments in the exercise intensity. An additional benefit of this endeavor is that it reveals the discovery that can occur when science does what it should, which is to always follow evidence, and when evidence of anomalies against conventional understanding exists, to then challenge the convention (Kuhn, 1962). Such is the structure of progress in science and the responsibility of all scientists.
Data availability statement
The raw data supporting the conclusions of this article will be made available by the authors, without undue reservation.
Ethics statement
The studies involving humans were approved by the Office of Research Ethics and Integrity. The studies were conducted in accordance with the local legislation and institutional requirements. The participants provided their written informed consent to participate in this study.
Author contributions
RR: data curation, formal analysis, investigation, methodology, project administration, software, supervision, writing – original draft, and writing – review and editing. BO: data curation, investigation, methodology, and writing – review and editing. AD: formal analysis, methodology, and writing – review and editing. SD: methodology and writing – review and editing. AK: investigation, methodology, resources, and writing – review and editing.
Funding
The author(s) declare that no financial support was received for the research and/or publication of this article.
Conflict of interest
The authors declare that the research was conducted in the absence of any commercial or financial relationships that could be construed as a potential conflict of interest.
Generative AI statement
The author(s) declare that no Generative AI was used in the creation of this manuscript.
Publisher’s note
All claims expressed in this article are solely those of the authors and do not necessarily represent those of their affiliated organizations, or those of the publisher, the editors and the reviewers. Any product that may be evaluated in this article, or claim that may be made by its manufacturer, is not guaranteed or endorsed by the publisher.
References
Adami A., Pogliaghi S., De Roia G., Capelli C. (2011). Oxygen uptake, cardiac output and muscle deoxygenation at the onset of moderate and supramaximal exercise in humans. Eur. J. Appl. Physiol. 111 (7), 1517–1527. doi:10.1007/s00421-010-1786-y
Bishop D. J., Granata C., Eynon N. (2014). Can we optimise the exercise training prescription to maximise improvements in mitochondria function and content? Biochimica Biophysica Acta (BBA) - General Subj. 1840 (4), 1266–1275. doi:10.1016/j.bbagen.2013.10.012
Bottinelli R., Canepari M., Pellagrino M. A., Reggiani C. (1996). Force-velocity properties of human skeletal muscle fibres: Myosin heavy chain isoform and temperature dependence. J. Physiol. 495 (2), 573–586. doi:10.1113/jphysiol.1996.sp021617
Bottinelli R., Reggiani C. (2000). Human skeletal muscle fibres: molecular and functional diversity. Prog. Biophys. Mol. Biol. 73 (2-4), 195–262. doi:10.1016/S0079-6107(00)00006-7
Bouchard C., Sarzynski M. A., Rice T. K., Kraus W. E., Church T. S., Sung Y. J., et al. (2011). Genomic predictors of the maximal O2 uptake response to standardized exercise training programs. J. Appl. Physiol. 110 (5), 1160–1170. doi:10.1152/japplphysiol.00973.2010
Caiozzo V. J., Davis A., Ellis J. F., Azus L., Vandagriff R., Prietto C. A., et al. (1982). A comparison of gas exchange indices used to detect the anaerobic threshold. J. Appl. Physiol. 53 (5), 1184–1189. doi:10.1152/jappl.1982.53.5.1184
Colosio A. L., Caen K., Bourgois G., Boone J., Pogliaghi S. (2020). Bioenergetics of the
Dale J., Glaister M. (2018). Moderate-intensity oxygen uptake kinetics: is a mono-exponential function always appropriate to model the response? Res Quart Exerc. Sport 89 (3), 309–321. doi:10.1080/02701367.2018.1482399
Diamond L. B., Casaburi R., Wasserman K., Whipp B. J. (1977). Kinetics of gas exchange and ventilation in transitions from rest or prior exercise. J. Appl. Physiol. 43 (4), 704–708. doi:10.1152/jappl.1977.43.4.704
Di Prampero P. E., Davies C. T., Cerretelli P., Margaria R. (1970). An analysis of O2 debt contracted in submaximal exercise. J. Appl. Physiol. 29 (5), 547–551. doi:10.1152/jappl.1970.29.5.547
Dunst A. K., Hesse C., Ueberschar O. (2025). Enhancing endurance performance predictions: the role of movement velocity in metabolic simulations demonstrated by cycling cadence. Eur. J. Appl. Physiol. 125, 895–907. doi:10.1007/s00421-024-05663-4
Exercise Is Medicine - Australia (2024). Adult pre-exercise screening system (APSS). Available online at: https://exerciseismedicine.org.au/wp-content/uploads/2019/09/New-ADULT-PRE-EXERCISE-SCREENING-SYSTEM-APSS_FINAL-1.pdf.
Henry F. (1951). Aerobic oxygen consumption and alactic debt in muscular work. J. Appl. Physiology 3 (7), 427–438. doi:10.1152/jappl.1951.3.7.427
Henry F. M., DeMoor J. (1950). Metabolic efficiency of exercise in relation to work load at constant speed. J. Appl. Physiol. 2 (9), 481–487. doi:10.1152/jappl.1950.2.9.481
Hill A. V., Long C. N. H., Lupton H. (1924). Muscular exercise, lactic acid and the supply and utilisation of oxygen. Proc. R. Soc. Lond. Ser. B, Contain. Pap. a Biol. Character 97 (682), 155–176.
Hill A. V., Lupton H. (1923). Muscular exercise, lactic acid, and the supply and utilization of oxygen. Q. J. Med. 16 (62), 135–171. doi:10.1093/qjmed/os-16.62.135
Hug F., Avrillon S., Ibáñez J., Farina D. (2022). Common synaptic input, synergies and size principle: control of spinal motor neurons for movement generation. J. Physiol. 601 (1), 11–20. doi:10.1113/JP283698
Hughson R. L., Morrissey M. (1982). Delayed kinetics of respiratory gas exchange in the transition from prior exercise. J. Appl. Physiol. 52 (4), 921–929. doi:10.1152/jappl.1982.52.4.921
Jamnick N. A., Pettitt R. W., Granata C., Pyne D. B., Bishop D. J. (2020). An examination and critique of current methods to determine exercise intensity. Sports Med. 50, 1729–1756. doi:10.1007/s40279-020-01322-8
Jones A. M., Grassi B., Christensen P. M., Krustrup P., Bangsbo J., Poole D. C. (2011). Slow component of VO2 kinetics: mechanistic bases and practical applications. Med. Sci. Sports Exerc 43 (11), 2046–2062. doi:10.1249/MSS.0b013e31821fcfc1
Jones A. M., Pringle J. S. M., Carter H. (2004). “Influence of muscle fibre type and motor unit recruitment on
Jones A. M., Vanhatalo A., Burnley M., Morton H., Poole D. C. (2010). Critical power: implications for determination of VO2max and exercise tolerance. Med. Sci. Sports Exerc 42 (10), 1876–1890. doi:10.1249/MSS.0b013e3181d9cf7f
Keir D. A., Benson A. P., Love L. K., Robertson T. C., Rossiter H. B., Kowalchuk J. M. (2016). Influence of muscle metabolic heterogeneity in determining the
Kim D., Robergs R. A. (2012). Validation of a new mixing chamber system for breath-by-breath indirect calorimetry. Appl. Physiol. Nutr. Metab. 37 (1), 157–166. doi:10.1139/h11-147
Koppo K., Bouckaert J., Jones A. M. (2004). Effects of training status and exercise intensity on phase II
Korzeniewski B., Zoladz J. A. (2015). Possible mechanisms underlying slow component of
Krogh A., Lindhard J. (1913). The regulation of respiration and circulation during the initial stages of muscular work. J. Physiology 47 (1–2), 112–136. doi:10.1113/jphysiol.1913.sp001616
Kuhn T. S. (1962). The structure of scientific revolutions. 4th Edition. Chicago: University of Chicago Press. Available online at: https://psycnet.apa.org/record/1962-35001-000.
Liguori G., Feito R., Fountaine C. J., Roy B. (2022). in ACSM’s guidelines for exercise testing and prescription. 11th Edition (Philadelphia: Wolters Kluwer).
Lundby C., Jacobs R. A. (2016). Adaptations of skeletal muscle mitochondria to exercise training. Exp. Physiol. 101 (1), 17–22. doi:10.1113/EP085319
Margaria R., Manglli F., Cuttica F., Cerretelli P. (1965). The kinetics of the oxygen consumption at the onset of muscular exercise in man. Ergonomics 8 (1), 49–54. doi:10.1080/00140136508930773
McNulty C. R., Robergs R. A. (2017). New methods for processing and quantifying
Mendell L. M. (2005). The size principle: a rule describing the recruitment of motoneurons. J. Neurophysiol. 93 (6), 3024–3026. doi:10.1152/classicessays.00025.2005
O’Malley B. G. J., Robergs R. A., Astorino T. A. (2024). Increases in the incremental exercise mean response time across the steady state domain: implications for exercise testing and prescription. Sports Med. Health Sci. 6 (4), 315–323. doi:10.1016/j.smhs.2024.02.002
Petajan J. H. (1991). AAEM minimonograph #3: motor unit recruitment. Muscle and Nerve 14 (6), 489–502. doi:10.1002/mus.880140602
Poole D. C. (1994). Role of exercising muscle in slow component of
Poole D. C., Burnley M., Vanhatlo A., Rossier H. B., Jones A. M. (2016). Critical power. An important fatigue threshold in exercise physiology. Med. Sci. Sports Exerc 48 (11), 2320–2334. doi:10.1249/MSS.0000000000000939
Poole D. C., Jones A. M. (2012). Oxygen uptake kinetics. Compr. Physiol. 2 (2), 933–996. doi:10.1002/cphy.c100072
Poole D. C., Rossiter H. B., Brooks G. A., Gladden L. B. (2021). The anaerobic threshold: 50+ years of controversy. J. Physiol. 599 (3), 737–767. doi:10.1113/JP279963
Poole D. C., Schaffartzik W., Knight D. R., Derion T., Kennedy B., Guy H. J., et al. (1991). Contribution of exercising legs to the slow component of oxygen uptake kinetics in humans. J. Appl. Physiol. 71 (4), 1245–1260. doi:10.1152/jappl.1991.71.4.1245
Robergs R. A. (2014). A critical review of the history of Low-to moderate-intensity steady-state
Wells G. J., Balke B., Van Fossan D. D. (1957). Lactic acid accumulation during work: a suggested standardization of work classification. J. Appl. Physiol. 10 (1), 51–55. doi:10.1152/jappl.1957.10.1.51
Whipp B. J. (1971). Rate constant for the kinetics of oxygen uptake during light exercise. J. Appl. Physiol. 30 (2), 261–263. doi:10.1152/jappl.1971.30.2.261
Whipp B. J. (1994). The slow component of O2 uptake kinetics during heavy exercise. Med Sci Sports and Exerc 26 (11), 1319–1326. doi:10.1249/00005768-199411000-00005
Whipp B. J., Wasserman K. (1972). Oxygen uptake kinetics for various intensities of constant-load work. J. Appl. Physiol. 33 (3), 351–356. doi:10.1152/jappl.1972.33.3.351
Keywords: cycling, endurance exercise, training, plateau, critical power, oxygen consumption
Citation: Robergs R, O’Malley B, Dewilde A, D’Auria S and Krouzecky A (2025)
Received: 18 December 2024; Accepted: 26 June 2025;
Published: 15 August 2025.
Edited by:
Giuseppe D'Antona, University of Pavia, ItalyReviewed by:
Anton Ušaj, University of Ljubljana, SloveniaAlessandro L. Colosio, Laboratoire Interuniversitaire de Biologie de la Motricité, Université Jean Monnet, France
Copyright © 2025 Robergs, O’Malley, Dewilde, D’Auria and Krouzecky. This is an open-access article distributed under the terms of the Creative Commons Attribution License (CC BY). The use, distribution or reproduction in other forums is permitted, provided the original author(s) and the copyright owner(s) are credited and that the original publication in this journal is cited, in accordance with accepted academic practice. No use, distribution or reproduction is permitted which does not comply with these terms.
*Correspondence: Robert Robergs, Um9iZXJ0LlJvYmVyZ3NAdWplcC5jeg==