 Mikus Abolins-Abols
 Ray Yeager2,3,4,5
 Jay Turner
 Ted Smith
 Aruni Bhatnagar
- 1Department of Biology, University of Louisville, Louisville, KY, United States
- 2Center for Integrative Environmental Health Sciences, University of Louisville, Louisville, KY, United States
- 3Christina Lee Brown Envirome Institute, University of Louisville, Louisville, KY, United States
- 4Division of Environmental Medicine, Department of Medicine, University of Louisville, Louisville, KY, United States
- 5Superfund Research Center, University of Louisville, Louisville, KY, United States
- 6Department of Energy, Environmental and Chemical Engineering, Washington University in St. Louis, St. Louis, MO, United States
Air pollution is known to negatively affect avian health, and some air pollutants have been suggested to drive changes in bird population size at a regional level. Although several studies have investigated the effect of air pollution on bird health, how air pollution exposure is associated with avian physiology at a local scale is not known. Moreover, the extent to which avian health may be affected by vegetation, which modulates pollutant deposition and dispersion, has not been assessed. Here we combine high-resolution mapping of major air pollutants (NO2 and ultrafine particles) and vegetation types with dense spatial sampling of American robins, an urban exploiter, to ask how air pollution exposure, vegetation, and their interaction predict baseline corticosterone and bird condition. The relationships between environmental variables and physiological metrics were assessed at various distances from the capture location. We found that elevated air NO2 concentration is associated with higher baseline corticosterone levels within 500 m of the capture location. Vegetation did not modulate the relationship between corticosterone and NO2. We found sex-dependent relationships between greenness, corticosterone, and body weight. Within 20 m from the capture locations female corticosterone showed negative relationship with leaf area index, while female body weight was positivity related to the overall greenness. These relationships were absent in males. Collectively, the results of this study show that variations in air pollution and vegetation at a local intra-neighborhood scale predict fitness- and stress-related markers in an urban songbird.
Introduction
Exposure to air pollution is a critical global environmental health issue with documented adverse health effects in both human and non-human animals, including birds (Newman, 1979; Llacuna et al., 1996; Sanderfoot and Holloway, 2017; Landrigan et al., 2018). In human populations, air pollution exposure is associated with 4.5 million premature deaths per year (Landrigan et al., 2018). Air pollution is estimated to affect wildlife population sizes as well. For instance, reduction in ozone due to U.S. EPA NOx Budget Trading Program is estimated to have averted the loss of 1.5 billion birds over the last 50 years, with the strongest effect seen in small land birds (Liang et al., 2020). However, the mechanisms by which air pollution affects bird health, and the environmental factors that may mediate this relationship, are not well understood (Barton et al., 2023).
Birds have very efficient respiratory systems, characterized by unidirectional air flow and countercurrent gas exchange, which makes their respiration more susceptible to the adverse effects of particulate matter and gaseous pollution (Sanderfoot and Holloway, 2017). Although most studies investigating the effect of air pollutants on avian health show a negative effect on one or more fitness-relevant traits, important knowledge gaps persist (Barton et al., 2023). These gaps include lack of understanding of how different species respond to pollution (Salmón et al., 2018), lack of studies on particular pollutants (e.g., nitrogen dioxide), and lack of studies investigating the effect of pollution-mediating environmental factors on avian health (Barton et al., 2023).
Among the most significant air pollutants are those generated by the combustion of fossil fuels. These include nitrogen and sulfur oxides, particulate matter, volatile organic compounds (VOCs), and heavy metals (Sanderfoot and Holloway, 2017). These air pollutants can damage respiratory tissues (Rombout et al., 1991), cause oxidative stress (Herrera-Dueñas et al., 2014; Isaksson et al., 2017; Salmón et al., 2018), are associated with lower body condition (Wemer et al., 2021), and can decrease avian reproductive output (reviewed in Sanderfoot and Holloway, 2017; Barton et al., 2023). A commonly observed physiological response to pollution exposure in animals is the elevation of corticosterone levels.
Corticosterone is glucocorticoid hormone that mediates metabolism and the physiological stress-response (Romero and Butler, 2007). Corticosterone and other glucocorticoids play a number of different roles in the stress response, including preparing the organism to respond to stressors, enhancing the response to stressors, and facilitating recovery from stressors (reviewed in Sapolsky et al., 2000). In rodents, exposure to particulate matter and ozone activates stress-responsive brain regions (Sirivelu et al., 2006; Gackière et al., 2011) and increases corticosterone levels (Sirivelu et al., 2006; Martrette et al., 2011). In birds, experimental exposure to a mix VOCs and oxidizing gases (SO2, NO2) resulted in an increase in corticosterone levels in kestrels and quail (Cruz-Martinez et al., 2015). Wild tree swallow nestlings at various distances from oil sands extraction sites with different NO2 and VOC levels, however, showed no difference in corticosterone levels. Corticosterone levels have also been shown to differ across a heavy metal pollution gradient: baseline corticosterone levels have been positively associated with blood lead levels in house sparrows across an urban-rural gradient (White et al., 2022), although other studies show no relationship between corticosterone and metals pollution (Li et al., 2021). Both baseline and stress-induced corticosterone levels have also been shown to differ across a more general urban-rural gradient, although the directionality of the difference varies across species, with some species showing higher corticosterone levels in urban compared to rural areas, while others show lower or no difference in corticosterone levels in urban compared to rural areas (Deviche et al., 2023). Focusing on investigating relationships between specific stressors and corticosterone may help bring clarity to these differences.
Most field studies investigating the link between pollution and avian health measure physiological metrics and variation in pollution across a coarse urban-rural gradient. These field studies show that a strong urban-rural spatial gradient in air pollution is associated with increased oxidative stress (Herrera-Dueñas et al., 2014; Isaksson et al., 2017; Salmón et al., 2018), increased heterophil/lymphocyte ratio (Bauerová et al., 2017), elevated corticosterone (White et al., 2022), increased inflammation (Isaksson et al., 2017), shorter telomeres (Salmón et al., 2016), lower body mass (Wemer et al., 2021), and increased hemopoiesis (Li et al., 2021). However, air pollution from roadways dissipates within a couple hundred meters of the road (Baldwin et al., 2015), which can create a strong spatial heterogeneity in pollution within local urban environments. To our knowledge, it is not known whether fine-scale variation in air pollution within urban areas is associated with differences in avian health.
A contributing factor to the heterogeneity in pollution exposure in urban areas is vegetation. Vegetation can affect both the dispersal and deposition rates of air pollutants (Janhäll, 2015; Tiwari et al., 2019). The large surface area of plant leaves may facilitate increased deposition of both gaseous and particulate pollutants (Janhäll, 2015). Vegetation can also influence the movement of air and, as a consequence, the dispersion of air pollutants (Xing and Brimblecombe, 2019). The interaction between vegetation and air pollution is complex because, depending on the type of vegetation and its structure, green urban infrastructure can either decrease or increase pollutant exposure (Janhäll, 2015; Xing and Brimblecombe, 2019). To our knowledge, no study has investigated how vegetation and pollution exposure interact to mediate avian health (Barton et al., 2023).
Vegetation plays other fundamental roles in avian urban ecology in addition to its role in mediating pollutant exposure. Vegetation provides habitat for birds and modulates thermal microenvironment by providing shade (Armson et al., 2012). Vegetation also serves as a food source for frugivorous urban birds and a habitat for insectivorous bird prey. The amount and structure of vegetation may therefore affect avian health by both pollution-dependent and independent mechanisms.
Importantly, urban green infrastructure contains different types of vegetation. Grass and tree canopy, for example, may have different effects on pollution dispersal and deposition (Janhäll, 2015). These two major types of vegetation also provide different habitat and food resources for birds, differ in their ability to modulate temperature (Armson et al., 2012), and may harbor different disease vectors. Partitioning urban vegetation across different types is thus important to assess the effect of urban green infrastructure on bird health. While studies have investigated the association between different vegetation types and bird abundance (Blair, 2004), to our knowledge, no study to date has investigate how different types of vegetation are associated with physiological markers of stress and health.
In this paper we investigated the relationship between two major urban air pollutants, three urban vegetation metrics, and two fitness-related metrics (corticosterone and body weight) in a free-living common native urban songbird, the American robin (Turdus migratorius), at a densely sampled intra-neighborhood scale. Robins can be considered urban exploiters (Reale and Blair, 2005), because their density (Nelson and Nelson, 2001; Suarez-Rubio et al., 2011) and survivorship (Evans et al., 2015; Pharr et al., 2023) can be higher in urban compared to natural areas. In urban areas, however, robins have been shown to be exposed to common urban pollutants, including heavy metals (Roux and Marra, 2007; Zahor et al., 2024).
For greenness and pollution data, we leverage the ongoing large-scale experimental research effort of The Green Heart Louisville Project (GH, greenheartlouisville.com). GH is a one-of-its-kind experimental implementation of urban greenery to test the hypothesis that increasing neighborhood greenness diminishes the risk of cardiovascular disease in humans by decreasing levels of air pollution (Bhatnagar et al., 2023). GH monitors detailed measures of air quality and greenness in a 12 km2 study area in Louisville, KY, in tandem with a longitudinal clinical study assessing cardiovascular function and risk factors in area residents. To our knowledge, ours is the first attempt to assess the extent to which various greenness types, air pollutants, and their interaction predicts avian health and physiology.
Materials and methods
Study area
We followed all applicable institutional and national guidelines for the care and use of animals. This study was approved the University of Louisville IACUC (protocol number 20844) and was permitted under federal Bird Banding Permit 24288 and Kentucky Dept. Of Fish and Wildlife Resources permit SC2511071. We studied free living American robins (T. migratorius) across a contiguous 10 km2 residential neighborhood in Louisville, KY (lat: 38.190,266; long: -85.778,094) which encompasses the area of the GH project (Supplementary Figure S1). Our study area is intersected by a major six-lane highway and has high surface road coverage, resulting in a high traffic volume that increases the levels of air and noise pollution. The area has a high human population density (ca. 2,700/km2). In addition to single home residences with traditional suburban front and back yards, the area includes several city parks, schools, and local businesses.
Bird capture and sampling
We caught free-living adult robins (n = 66, 37 males, 29 females) from April 27 to 30 June 2022. We captured the birds during their morning foraging (between 6–9 a.m.), placing standard (60 mm mesh size, 12 or 18 m in length) mist nets in lawns in parks, road medians, school grounds, and private residences across the study area. Most birds (52 out of 66) were caught passively without decoys or playback, with six birds being caught at their nests and eight being caught in response to nestling and adult alarm calls. Permission was obtained from Louisville parks officials, private residence owners, or school officials before bird capture. Upon capture, we immediately collected a blood sample (75 µL) from the brachial vein. We used a 26 G needle to puncture the vein and collected blood in heparinized microcapillary tubes. Blood samples were collected between 72 and 180 s after the bird fell into the mist net. Blood samples were placed on ice and transported to the lab, where they were centrifuged for 10 min to separate red blood cells from plasma. Plasma was then aspirated and frozen at −20°C. After blood collection, we measured the weight of each bird using a 100 g spring scale, which was used as an estimate of the body condition (Green, 2001). Each bird was banded with one USGS aluminum and three plastic color leg bands. Birds were released at the capture location.
Corticosterone assays
We analyzed corticosterone concentration in the plasma using previously validated enzyme-linked immunosorbent assay for this species (Abolins-Abols and Hauber, 2020). Briefly, we suspended 10 µL plasma in 200 double-distilled water and mixed it with 1 mL diethyl ether (Fisher Scientific, E138-1). The suspension was vortexed, after which ether and aqueous phases were allowed to separate. The aqueous phase was then flash-frozen, and the ether phase decanted. The extraction procedure was repeated three times, following which ether was evaporated under a gentle stream of nitrogen. We then used a commercial corticosterone ELISA kit (Cayman Chemical, 501320) to analyze corticosterone concentration in the extract using manufacturer’s instructions. The plasma extract was suspended in 600 µL assay buffer and vortexed for 1 min before storing it at 4°C overnight. We ran the extracted samples in triplicate, using a pooled robin plasma extract as a within- and across-plate control. We measured plate absorbance at 405 nm. Data were analyzed using a eight-point logistic curve using the analysis spreadsheet provided by Cayman Chemical. Most samples fell within 20%–80% B/Bo range. The among-plate coefficient of variation was 5.79%, whereas the within-plate coefficient of variation was 6.18%. We averaged the data from the three replicates and standardized sample concentrations across plates using the mean concentration of the control samples.
Air pollution and greenness variables
We measured NO2 across the study area with a 60-site passive sampling network (Prathibha et al., 2023). We measured ultrafine particulate matter (UFP) number via mobile sampling across the study area roadway network across seasons, days of week, and times of day. For both UFP and NO2, we used a land use regression modeling approach to estimate respective spatially resolved annual concentration estimate raster surfaces across the study area (Prathibha, 2021).
To assess NDVI, we collected raster-based multispectral data at 3 m2 spatial resolution from Planet Labs DOVE satellite imagery for summer (May 1 – September 30) 2022. Prior to our collection, the raw imagery data was downscaled by Planet Labs from 3.7 to 4.1 m2 resolution to a consistent 3 m2 resolution. We excluded data from time points with >10% cloud cover, yielding 40 viable time points with a mean time between collection of 3.9 days. We calculated NDVI raster layers for each time point and then created a raster layer of the temporal mean NDVI value of all time points, for all pixels, to compile our final summer NDVI measurement. For leaf area index (LAI), we commissioned a fixed wing LiDAR data collection of the study area in the summer of 2019 and calculated LAI based on the Beer-Lambert law, described elsewhere (Yeager et al., 2023). The resulting LAI values represented estimated total leaf area, quantified as a 2-dimensional value of the 3-dimensional sum, per square meter. To identify areas of grass, we also collected seven in resolution multispectral data during the summer 2019 fixed-wing data collection (Yeager et al., 2024). From seven in imagery, we calculated NDVI, removed building and canopy footprints, and identified and extracted areas of grass based on distinct NDVI cut points that differentiates areas of grass from impervious surfaces and other vegetation. We then created a dichotomous raster surface, coded as 0 and 100 to represent grass cover at seven in resolution, to classify pixels of grass cover.
For spatial aggregation of all exposure data (NO2, UFP, NDVI, LAI, grass), we used the Focal Statistics tool in ArcGIS Pro software to create secondary raster surfaces with pixel values calculated as the mean value of the original raster surface within each given radius. The resulting secondary raster surfaces represent a mean of continuous measurement values within a given radius except for grass represented as percent coverage within respective radii. From secondary mean radii raster surfaces, we extracted radii values for each exposure at the sampling location.
Statistical analyses
All analyses were conducted in R, version 4.4.1 (R Core Team, 2024). Corticosterone values were right-skewed and were therefore natural log-transformed. Log-transformed corticosterone values showed a positive relationship with the length of time elapsed between capture and completion of the blood sample (Linear Model (LM), df = 65, slope = 0.01, multiple r2 = 0.12, p = <0.01), indicating that some individuals might have started to secrete corticosterone in response to capture stress within 3 min after capture. We therefore calculated residuals from a regression between corticosterone values and the time it took to complete the collection of the blood sample and used these residuals as the response variable in analyses of corticosterone levels. Corticosterone was not related to bird capture type (ANOVA, df = 61, F = 8.60, p = 0.52) or body weight (LM, df = 65, slope = −0.01, multiple r2 = <0.01, p = 0.54).
To ask what environmental factors best explained variation in the corticosterone residuals and body condition, we used AIC-based model selection approach followed by model averaging (Burnham et al., 2011; Symonds and Moussalli, 2011). AIC-based model selection allows for non-biased model generation for correlative datasets in natural systems (Aho et al., 2014). This approach can be especially useful when more than one independent candidate predictors may explain variation in the response variable, but where a model that includes every covariate may not necessarily be the best model. However, AIC-based model selection can produce several similar, competitive models. Model averaging of competing models allows evaluating the strength of evidence supporting a relationship between independent variables included in these competing models and the response variable. To identify the best models, we used the package MuMIn (Bartoń, 2018) to calculate the corrected Akaike information criterion (AICc) scores for linear models that contained different combinations of predictors. We then asked if the top models (within two AICc of the best model) predicted the data significantly better than a null model using likelihood ratio tests using package lmtest (Zeileis and Hothorn, 2002). We then used model averaging for the top models with a cumulative Akaike weight of 0.95 (Burnham et al., 2011; Symonds and Moussalli, 2011) to derive weighted averages of parameter and error estimate across multiple competing models.
Predictors for baseline corticosterone residuals and body weight included air pollution metrics (nitrogen dioxide levels, ultrafine particle levels), greenness metrics (normalized difference vegetation index, leaf area index, and grass cover), capture date, and bird sex. Additionally, we included interactions between all combinations of greenness metrics and air pollution metrics, because we reasoned that birds may respond to air pollution differently across a greenness gradient. We also included an interaction between sex and all environmental variables, because females are the only incubating sex and might show different space use than males during the breeding season.
American robin territory size is 0.11–0.21 ha [but can be as large as 0.84 ha (Howell, 1942; Pitts, 1984)], but their home range can encompass a much greater area [1.3–14,417.1 ha (Benson et al., 2012)]. We therefore first analyzed the relationship between the response variables and averaged environmental variables at two different radii from their capture location: 20 m (representing an area of 0.13 ha, consistent with territory size) and 500 m (78.54 ha, consistent with a small home range). Because the entire GH study area covers approximately 1,000 ha (Yeager et al., 2024), an area around the capture location with a larger radius (e.g., 1,000 m, consistent with a large robin home range) would cover most of study area and result in a loss of resolution. It is important to note, however, that we do not know if the capture location for each individual fell within its territory or how representative the capture location was of the average space use for each individual. We treat these two spatial scales as hypothesis-driven starting points in our analyses.
Following initial analyses using environmental values at 20 m and 500 m radii, we calculated standardized slope estimates for each environmental variable across these and intermediate distances (50 m, 100 m, 200 m, 300 m, 400 m) to better understand how the relationship between environmental variables and response variables (corticosterone or body weight) may change with distance. In these models, we considered each environmental variable separately. For corticosterone, we also included date as a covariate. Because model selection identified sex-dependent associations between the response variables and environmental variables, we then recalculated the effect sizes for both sexes separately.
Variance inflation analyses identified that the greenness variables were strongly correlated. In particular, in our dataset grass cover and leaf area index were strongly negatively (r = −0.75) correlated at the 20 m radius. At the 500 m radius, leaf area index was strongly positively (r = 0.76) correlated with NDVI. However, model selection is not sensitive to multicollinearity (Graham, 2003; Pipoly et al., 2022) because models are considered separately for their fit. Including collinear variables, such as leaf area index and grass cover, in the full model allows comparing the fit of smaller models with alternative collinear variables. Because more than one greenness metric was present in the top models, we report conditional (as opposed to full) model-averaged coefficients and p-values.
Results
Summary statistics
Summary statistics for the response and independent variables are reported in Supplementary Table S1. Environmental variables showed stronger variation at the smaller (20 m) radius around the capture location compared to the larger radius (500 m). At 20 m from bird capture locations, the difference between minimum and maximum greenness indices ranged from 7-fold (for NDVI) up to 120-fold (for LAI). The fold difference between minimum and maximum pollutant exposure at this radius ranged from 3.9-fold (for NO2) to 6-fold (for UFPs). At 500 m from bird capture locations, we saw lower variation in environmental variables, especially for pollutants.
Corticosterone
Our measurements of plasma corticosterone showed that in the area with a 20 m radius from the capture location, variation in baseline corticosterone was best explained by date and an interaction between sex and greenness variables (LAI or grass). After model selection, seven top models (of out 7,260 total, Supplementary Table S2) were within 2.0 AICc-s of each other, indicating that statistical support for these models was equally strong. These models included either an interaction between LAI and bird sex (increasing LAI was associated with lower corticosterone in females but not in males, Figures 1 and 2) or grass and bird sex (increasing grass area was associated higher corticosterone in females but lower corticosterone in males). Since LAI was strongly negatively associated with grass at the 20 m radius, the bird sex-dependent relationships between corticosterone and the two different greenness metrics are likely not independent but represent two alternative hypotheses. In the model with the lowest AICc, the interaction between LAI and sex was significant, as was the effect of date and the main effect of LAI (Table 1). The interaction between LAI and sex as well as and grass and sex remained significant after model averaging of the models with combined AICc weight of 0.95 (Supplementary Table S3).
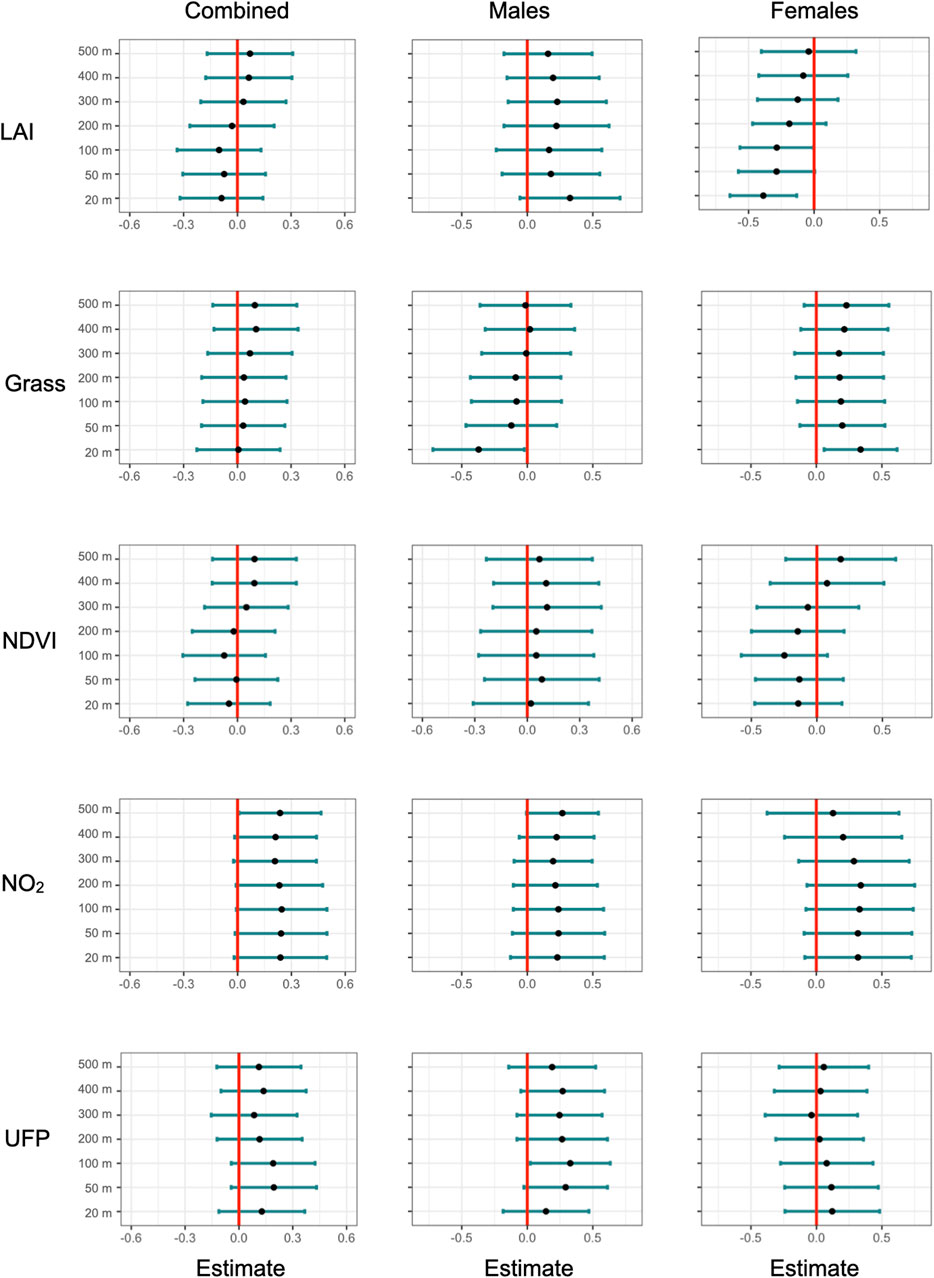
Figure 1. Standardized slope estimates of environmental variables predicting corticosterone at increasing radii from the capture location. Rows represent environmental variables, columns represent wither models with box sexes or each sex separately. Error bars represent the 95% confidence interval (CI) for the slope estimate.
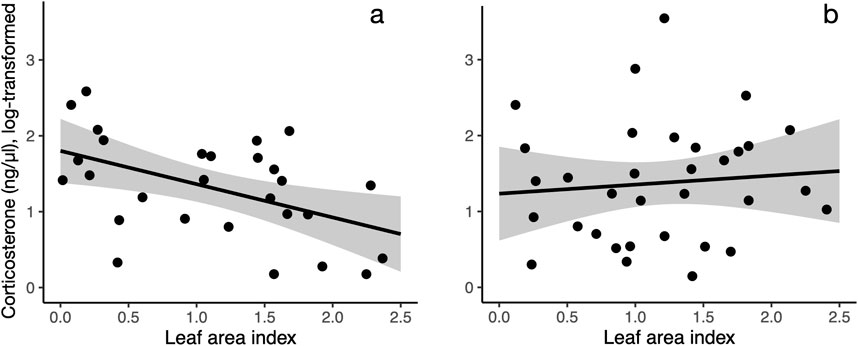
Figure 2. The relationship between corticosterone and leaf area index differs in females (a) and males (b). Leaf area index (20 m radius from capture location) is negatively correlated with corticosterone in females (a) but not in males (b). Shaded area indicates 95% confidence interval for the line.
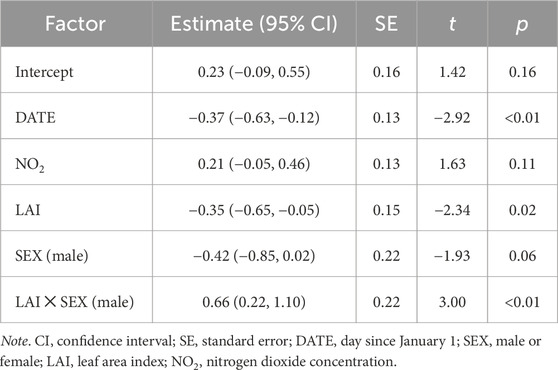
Table 1. Top model predicting corticosterone using environmental variables at 20 m radius from the capture location.
At 500 m radius from the capture location, variation in baseline corticosterone was best explained by date and NO2 concentration. After model selection, five top models (out of 7,260 total, Supplementary Table S4) were within 2.0 AICc-s of each other. These models showed that higher levels of plasma corticosterone were positively associated with ambient NO2 concentrations (Figure 1). NO2 was present in all five top models, and the relationship between corticosterone and NO2 was significant in the model with the lowest AICc (Table 2). However, the relationship between NO2 and corticosterone was not significant after model averaging of the models with combined AICc weight of 0.95 (Supplementary Table S5).
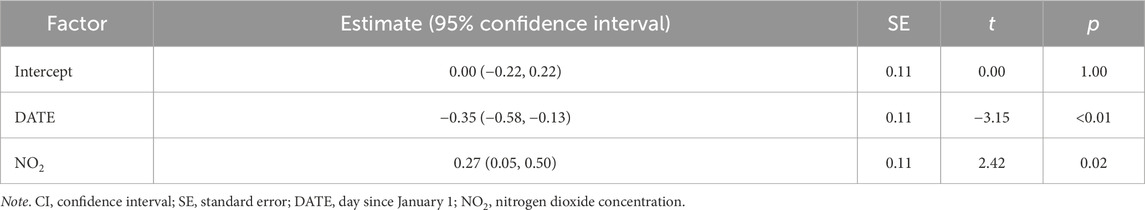
Table 2. Top model predicting corticosterone using environmental variables at 500 m radius from the capture location.
Body condition
In the area with a 20 m radius from the capture location, variation in body condition, assessed as body weight, was best explained by bird sex and its interaction with NDVI. After model selection, four top models (out of 7,260 total) were within 2.0 AICc-s of each other. All but one of the top models showed that increasing NDVI was associated with higher body weight in females but not in males (Figure 3; Supplementary Table S6). In the model with the lowest AICc (Table 3), the main effect of NDVI showed a significant positive association with body weight, but this relationship was modified by the significant negative interaction term between NDVI and male sex. The interaction between NDVI and sex remained marginally significant after model averaging of the models with the combined AICc weight of 0.95 (Supplementary Table S7). At 500 m radius from the capture location, none of top models for body weight that included environmental data were significantly better than the null model (Supplementary Figure S2; Supplementary Table S8).
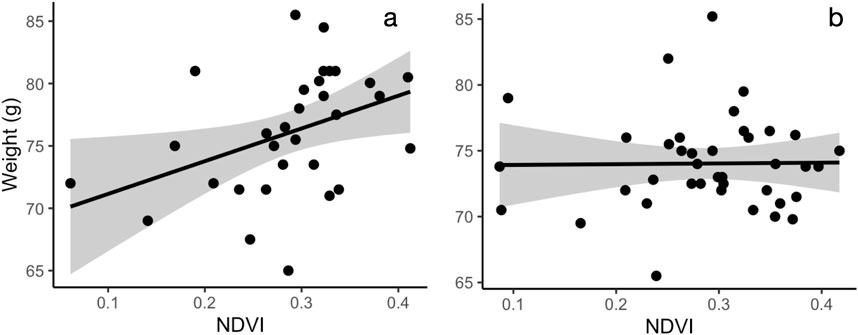
Figure 3. The relationship between body weight and NDVI in females (a) and males (b). Leaf area index (20 m radius from capture location) is positively correlated with weight in females (a) but not in males (b). Shaded area indicates 95% confidence interval for the line.
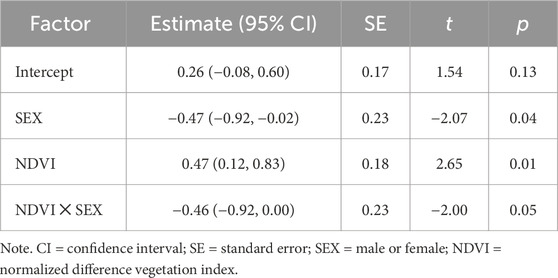
Table 3. Top model predicting body weight using environmental variables at 20 m radius from the capture location.
Discussion
In this study we show that in a native urban songbird at an intra-neighborhood scale, baseline corticosterone is negatively associated with canopy volume and positively associated with pollution exposure, while body weight has positively associated with overall greenness. However, the associations between environmental and physiological metrics depended on bird sex and the scale at which the environmental metrics were calculated.
We found the strongest associations between vegetation, body weight, and corticosterone at smaller spatial scales. This is concordant with a previous study in this species that show that robin distribution is best predicted by vegetation characteristics at a small spatial scale (Pennington and Blair, 2011). Specifically, we found that female, but not male, birds had lower baseline corticosterone in areas with high leaf area index. However, this relationship was significant only near the capture location (area with a 20 m radius around the capture location, roughly representing robin territory size, Figure 1), but was not apparent when considering the average leaf area index in areas with larger radii. Similarly, body weight was positively associated with NDVI in female, not male birds (Figure 3), and this relationship was only apparent when considering greenness near the capture location (Supplementary Figure S2).
The sex difference in the relationship between leaf area and corticosterone, and overall greenness and body condition, may be related to potentially different space use of robins in the summer. Breeding robin females spend up to 14 days incubating eggs (Vanderhoff et al., 2016) and therefore have prolonged interactions with the environment immediately around the nest. This is in contrast to male robins, which do not incubate and can move around more freely. To our knowledge, it is not known whether robin females and males use space differently when females are not incubating. However, recent studies highlight the fact that factors associated with urban development may affect male and female birds differently (Lane et al., 2023).
There are multiple possible explanations for the relationship between corticosterone levels, urban vegetation and sex. In our dataset, leaf area index was negatively correlated with grass area. Models with interactions between either bird sex and leaf area index or between sex and grass cover were within 2 AICc’s, indicating that, statistically, these models had very similar explanatory power. Higher leaf area index has been shown to be a strong driver of reduced temperatures (Hardin and Jensen, 2007; Bakhshoodeh et al., 2022), which may reduce the metabolic load of thermoregulation during warm summer days. However, data on heart rate, an indicator of metabolic rate (Steiger et al., 2009), from the same study site obtained with a different bird cohort (unpublished), suggest that high ambient temperatures within the range encountered in the neighborhood are not associated with increased metabolic rate in robins. Alternatively, higher leaf area may shield birds from potential stressors, such as humans, racoons, and domestic cats, resulting in a reduced corticosterone (Scheuerlein et al., 2001). It is also possible that the relationship between vegetation and corticosterone levels may be related to food abundance: in general, lower food availability is associated with elevated corticosterone in birds (Mench, 1991; Kitaysky et al., 2001; Lynn et al., 2003; Schoech et al., 2004). Because foliage is one of the main substrates for insect foraging by American robins (Paszkowski, 1982), increasing leaf area may be linked to higher prey abundance and, as a consequence, lower corticosterone. On the other hand, the positive association of grass area with corticosterone levels is less intuitive. One possibility is that the relationship between corticosterone and vegetation in female birds may be linked to the habitat preference of haemosporidian parasite vectors (biting midge and mosquitoes). However, studies show variable relationship between haemosporidian infection and corticosterone (Garvin and Schoech, 2006; Schoenle et al., 2017). While it is not possible to determine if leaf area or grass is driving the relationship between sex, vegetation, and corticosterone in this dataset, it is important to note that it was not the total greenness (assessed using NDVI) driving this relationship, but that corticosterone was associated with a specific type of urban vegetation. This suggests that studies in urban avian ecology should not treat vegetation as a homogenous variable but parse the effects of different vegetation types on avian physiology and health.
The positive association between the overall greenness, measured as NDVI, and female body condition, could be driven by increased food abundance in greener areas. Alternatively, heavier females might outcompete lighter females for greener territories. More generally, the alternative interpretations for these relationships highlight the inherent limitation of the correlative approach used in this study. Indeed, it is possible that these relationships are driven by another, unmeasured variable. However, we view these relationships are useful starting points for future experimental or pre-post studies.
Corticosterone levels were positively associated with elevated levels of ambient nitrogen dioxide, which is a proxy for traffic-generated pollutants. The relationship between nitrogen dioxide and corticosterone was largely the same when considering the average NO2 concentration across distances from the capture location, but model selection suggested that NO2 was an important predictor of corticosterone only when averaged across an area representative of a robin home range (area with a 500 m radius around the capture location). In these models, NO2 concentration was included in the top model, where it was significantly positively associated with corticosterone levels, irrespective of sex. However, the r2 of this model was only 0.20. Furthermore, model averaging showed that support for this relationship is weak, because the positive NO2-corticosterone association was not significant after model averaging of the top models with Akaike weight of 0.95. NO2 is a strong oxidizing agent leading to the formation of ozone through interaction with sunlight (Sicolo et al., 2010; Sanderfoot and Holloway, 2017). Ozone damages lung epithelium and causes capillary inflammation in birds (Rombout et al., 1991). Experimental exposure to a mix of air pollutants, including NO2, results in elevated corticosterone and oxidative stress markers in kestrels (Cruz-Martinez et al., 2015). While the evidence for the relationship between NO2 and corticosterone in our field study is limited, it nevertheless supports the results from experimental lab studies on the effect of NO2 on corticosterone. It is also possible that the relationship between NO2 and corticosterone is mediated by another factor related to vehicular traffic, such as traffic noise, which has been linked to changes in the hypothalamic-pituitary-adrenal axis activity in wild songbirds (Injaian et al., 2018).
Direct comparisons between avian and human health markers are not straight forward due to the differences between birds and humans in space use, diet, and physiology. However, it is important to note that in the same Green Heart Louisville (GH) study area leaf area index was negatively associated with blood pressure (Yeager et al., 2024). The overall greenness, measured as NDVI, in the GH area was associated with lower inflammation (Sears et al., 2024). NDVI was also associated with reduced sympathetic activation and inflammation city-wide in Louisville (Yeager et al., 2018). Although these associations are different from what we report here, they suggest that in both birds and humans, urban vegetation may be associated with reduced stress-response markers.
It is important to note that our findings are limited to one species in one location during the breeding season and that this study has limited sample size. A potential additional limitation of the interpretation of our results is that the environment at or around the capture area might not accurately represent the average environment the captured birds experienced. As outlined above, while robin territory size is 0.11–0.21 ha [but can be as large as 0.84 ha (Howell, 1942; Pitts, 1984)], their home ranges, which are rarely spherical, can encompass a much greater area (1.3–14,417.1 ha; Benson et al., 2012). These limitations can be addressed in future by conducting longer-term studies on incubating females, nestlings, or species with smaller home ranges.
In summary, we demonstrate that, in a native urban songbird at an intra-neighborhood level, greenness shows sex-dependent associations with body weight and corticosterone, and air pollution is positively associated with corticosterone. This suggests that avian stress physiology and fitness may differ not only across a broad urban-rural gradient, but at a much finer scale within and between neighborhoods. This, in turn, suggests that conservation efforts of urban wildlife should be directed to modifying urban green architecture and pollution dispersion.
Data availability statement
The raw data supporting the conclusions of this article will be made available by the authors, without undue reservation.
Ethics statement
The animal study was approved by University of Louisville IACUC. The study was conducted in accordance with the local legislation and institutional requirements.
Author contributions
MA-A: Conceptualization, Methodology, Visualization, Investigation, Formal Analysis, Writing – original draft. RY: Writing – original draft, Resources, Investigation, Formal Analysis. JT: Writing – review and editing, Formal Analysis, Resources. TS: Project administration, Resources, Supervision, Funding acquisition, Writing – review and editing. AB: Conceptualization, Resources, Writing – review and editing, Funding acquisition, Supervision.
Funding
The author(s) declare that financial support was received for the research and/or publication of this article. This work was supported by grants from the National Institute of Environmental Health Sciences (NIEHS R01 ES 029846, P42 ES 023716, P30 ES 030283), The Nature Conservancy, The Owsley Brown II Family Foundation, and The Kentucky Ornithological Society.
Conflict of interest
The authors declare that the research was conducted in the absence of any commercial or financial relationships that could be construed as a potential conflict of interest.
Generative AI statement
The author(s) declare that no Generative AI was used in the creation of this manuscript.
Publisher’s note
All claims expressed in this article are solely those of the authors and do not necessarily represent those of their affiliated organizations, or those of the publisher, the editors and the reviewers. Any product that may be evaluated in this article, or claim that may be made by its manufacturer, is not guaranteed or endorsed by the publisher.
Supplementary material
The Supplementary Material for this article can be found online at: https://www.frontiersin.org/articles/10.3389/fphys.2025.1603811/full#supplementary-material
References
Abolins-Abols M., Hauber M. E. (2020). Proximate predictors of variation in egg rejection behavior by hosts of avian brood parasites. J. Comp. Psychol. 134, 412–422. doi:10.1037/com0000225
Aho K., Derryberry D., Peterson T. (2014). Model selection for ecologists: the worldviews of AIC and BIC. Ecology 95, 631–636. doi:10.1890/13-1452.1
Armson D., Stringer P., Ennos A. R. (2012). The effect of tree shade and grass on surface and globe temperatures in an urban area. Urban For. Urban Green. 11, 245–255. doi:10.1016/j.ufug.2012.05.002
Bakhshoodeh R., Ocampo C., Oldham C. (2022). Thermal performance of green façades: review and analysis of published data. Renew. Sustain. Energy Rev. 155, 111744. doi:10.1016/j.rser.2021.111744
Baldwin N., Gilani O., Raja S., Batterman S., Ganguly R., Hopke P., et al. (2015). Factors affecting pollutant concentrations in the near-road environment. Atmos. Environ. 115, 223–235. doi:10.1016/j.atmosenv.2015.05.024
Bartoń K. (2018). MuMIn: multi-model inference. Available online at: https://CRAN.R-project.org/package=MuMIn (Accessed May 12, 2018).
Barton M. G., Henderson I., Border J. A., Siriwardena G. (2023). A review of the impacts of air pollution on terrestrial birds. Sci. Total Environ. 873, 162136. doi:10.1016/j.scitotenv.2023.162136
Bauerová P., Vinklerová J., Hraníček J., Čorba V., Vojtek L., Svobodová J., et al. (2017). Associations of urban environmental pollution with health-related physiological traits in a free-living bird species. Sci. Total Environ. 601–602, 1556–1565. doi:10.1016/j.scitotenv.2017.05.276
Benson T. J., Ward M. P., Lampman R. L., Raim A., Weatherhead P. J. (2012). Implications of spatial patterns of roosting and movements of american robins for west nile virus transmission. Vector-Borne Zoonotic Dis. 12, 877–885. doi:10.1089/vbz.2011.0902
Bhatnagar A., Keith R., Yeager R., Riggs D., Sears C., Bucknum B., et al. (2023). The Green Heart Project: objectives, design, and methods. medRxiv. 2023.12.05.23299461. doi:10.1101/2023.12.05.23299461
Blair R. (2004). The effects of urban sprawl on birds at multiple levels of biological organization. Ecol. Soc. 9, art2. doi:10.5751/es-00688-090502
Burnham K. P., Anderson D. R., Huyvaert K. P. (2011). AIC model selection and multimodel inference in behavioral ecology: some background, observations, and comparisons. Behav. Ecol. Sociobiol. 65, 23–35. doi:10.1007/s00265-010-1029-6
Cruz-Martinez L., Smits J. E. G., Fernie K. (2015). Stress response, biotransformation effort, and immunotoxicity in captive birds exposed to inhaled benzene, toluene, nitrogen dioxide, and sulfur dioxide. Ecotoxicol. Environ. Saf. 112, 223–230. doi:10.1016/j.ecoenv.2014.10.016
Deviche P., Sweazea K., Angelier F. (2023). Past and future: urbanization and the avian endocrine system. Gen. Comp. Endocrinol. 332, 114159. doi:10.1016/j.ygcen.2022.114159
Evans B. S., Ryder T. B., Reitsma R., Hurlbert A. H., Marra P. P. (2015). Characterizing avian survival along a rural-to-urban land use gradient. Ecology 96, 1631–1640. doi:10.1890/14-0171.1
Gackière F., Saliba L., Baude A., Bosler O., Strube C. (2011). Ozone inhalation activates stress-responsive regions of the CNS. J. Neurochem. 117, 961–972. doi:10.1111/j.1471-4159.2011.07267.x
Garvin M. C., Schoech S. J. (2006). Hormone levels and infection of haemoproteus danilewskyi in free-ranging blue jays (Cyanocitta cristata). J. Parasitol. 92, 659–662. doi:10.1645/GE-759R.1
Graham M. H. (2003). Confronting multicollinearity in ecological multiple regression. Ecology 84, 2809–2815. doi:10.1890/02-3114
Green A. J. (2001). Mass/Length Residuals: measures of body condition or generators of spurious results? Ecology 82, 1473–1483. doi:10.1890/0012-9658(2001)082[1473:MLRMOB]2.0.CO;2
Hardin P. J., Jensen R. R. (2007). The effect of urban leaf area on summertime urban surface kinetic temperatures: a Terre Haute case study. Urban For. Urban Green. 6, 63–72. doi:10.1016/j.ufug.2007.01.005
Herrera-Dueñas A., Pineda J., Antonio M. T., Aguirre J. I. (2014). Oxidative stress of House Sparrow as bioindicator of urban pollution. Ecol. Indic. 42, 6–9. doi:10.1016/j.ecolind.2013.08.014
Howell J. C. (1942). Notes on the nesting habits of the american robin (Turdus migratorius L.). Am. Midl. Nat. 28, 529–603. doi:10.2307/2420891
Injaian A. S., Taff C. C., Pearson K. L., Gin M. M. Y., Patricelli G. L., Vitousek M. N. (2018). Effects of experimental chronic traffic noise exposure on adult and nestling corticosterone levels, and nestling body condition in a free-living bird. Horm. Behav. 106, 19–27. doi:10.1016/j.yhbeh.2018.07.012
Isaksson C., Andersson M. N., Nord A., von Post M., Wang H.-L. (2017). Species-dependent effects of the urban environment on fatty acid composition and oxidative stress in birds. Front. Ecol. Evol. 5. doi:10.3389/fevo.2017.00044
Janhäll S. (2015). Review on urban vegetation and particle air pollution – deposition and dispersion. Atmos. Environ. 105, 130–137. doi:10.1016/j.atmosenv.2015.01.052
Kitaysky A. S., Wingfield J. C., Piatt J. F. (2001). Corticosterone facilitates begging and affects resource allocation in the black-legged kittiwake. Behav. Ecol. 12, 619–625. doi:10.1093/beheco/12.5.619
Landrigan P. J., Fuller R., Acosta N. J. R., Adeyi O., Arnold R., Basu N., et al. (2018). The Lancet commission on pollution and health. Lancet 391, 462–512. doi:10.1016/S0140-6736(17)32345-0
Lane S. J., VanDiest I. J., Brewer V. N., Linkous C. R., Fossett T. E., Goodchild C. G., et al. (2023). Indirect effects of urbanization: consequences of increased aggression in an urban male songbird for mates and offspring. Front. Ecol. Evol. 11, 234562. doi:10.3389/fevo.2023.1234562
Li M., Nabi G., Sun Y., Wang Y., Wang L., Jiang C., et al. (2021). The effect of air pollution on immunological, antioxidative and hematological parameters, and body condition of Eurasian tree sparrows. Ecotoxicol. Environ. Saf. 208, 111755. doi:10.1016/j.ecoenv.2020.111755
Liang Y., Rudik I., Zou E. Y., Johnston A., Rodewald A. D., Kling C. L. (2020). Conservation cobenefits from air pollution regulation: evidence from birds. Proc. Natl. Acad. Sci. U. S. A. 117, 30900–30906. doi:10.1073/pnas.2013568117
Llacuna S., Gorriz A., Riera M., Nadal J. (1996). Effects of air pollution on hematological parameters in passerine birds. Arch. Environ. Contam. Toxicol. 31, 148–152. doi:10.1007/BF00203919
Lynn S. E., Breuner C. W., Wingfield J. C. (2003). Short-term fasting affects locomotor activity, corticosterone, and corticosterone binding globulin in a migratory songbird. Horm. Behav. 43, 150–157. doi:10.1016/S0018-506X(02)00023-5
Martrette J. M., Thornton S. N., Trabalon M. (2011). Prolonged ozone exposure effects behaviour, hormones and respiratory muscles in young female rats. Physiol. Behav. 103, 302–307. doi:10.1016/j.physbeh.2011.02.024
Mench J. A. (1991). Research note: feed restriction in broiler breeders causes a persistent elevation in corticosterone secretion that is modulated by dietary tryptophan. Poult. Sci. 70, 2547–2550. doi:10.3382/ps.0702547
Nelson G. S., Nelson S. M. (2001). Bird and butterfly communities associated with two types of urban riparian areas. Urban Ecosyst. 5, 95–108. doi:10.1023/A:1022339203875
Newman J. R. (1979). Effects of industrial air pollution on wildlife. Biol. Conserv. 15, 181–190. doi:10.1016/0006-3207(79)90039-9
Paszkowski C. A. (1982). Vegetation, ground, and frugivorous foraging of the american robin. Auk 99, 701–709. doi:10.1093/auk/99.4.701
Pennington D. N., Blair R. B. (2011). Habitat selection of breeding riparian birds in an urban environment: untangling the relative importance of biophysical elements and spatial scale. Divers. Distrib. 17, 506–518. doi:10.1111/j.1472-4642.2011.00750.x
Pharr L. D., Cooper C. B., Evans B., Moorman C. E., Voss M. A., Vukomanovic J., et al. (2023). Using citizen science data to investigate annual survival rates of resident birds in relation to noise and light pollution. Urban Ecosyst. 26, 1629–1637. doi:10.1007/s11252-023-01403-2
Pipoly I., Preiszner B., Sándor K., Sinkovics C., Seress G., Vincze E., et al. (2022). Extreme hot weather has stronger impacts on avian reproduction in forests than in cities. Front. Ecol. Evol. 10, 825410. doi:10.3389/fevo.2022.825410
Prathibha P. (2021). Hyperlocal air quality exposure assessment to support health studies. Doctoral dissertation, McKelvey Sch. Eng. Theses Diss. Washington University in St. Louis. doi:10.7936/gqr6-t130
Prathibha P., Yeager R., Bhatnagar A., Turner J. (2023). Green Heart Louisville: intra-urban, hyperlocal land-use regression modeling of nitrogen oxides and ozone. medRxiv. 2023.03.03.23286765. doi:10.1101/2023.03.03.23286765
R Core Team (2024). R: a language and environment for statistical computing. Vienna, Austria: R Foundation for Statistical Computing. Available online at: https://www.R-project.org/ (Accessed May 12, 2018).
Reale J., Blair R. B. (2005). Nesting success and life-history attributes of bird communities along an urbanization gradient. Urban Habitats 3, 1–24.
Rombout P. J. A., Dormans J. A. M. A., van Bree L., Marra M. (1991). Structural and biochemical effects in lungs of Japanese quail following a 1-week exposure to ozone. Environ. Res. 54, 39–51. doi:10.1016/S0013-9351(05)80193-8
Romero L. M., Butler L. K. (2007). Endocrinology of stress. Int. J. Comp. Psychol. 20, 89–95. doi:10.46867/ijcp.2007.20.02.15
Roux K. E., Marra P. P. (2007). The presence and impact of environmental lead in passerine birds along an urban to rural land use gradient. Arch. Environ. Contam. Toxicol. 53, 261–268. doi:10.1007/s00244-006-0174-4
Salmón P., Nilsson J. F., Nord A., Bensch S., Isaksson C. (2016). Urban environment shortens telomere length in nestling great tits, Parus major. Biol. Lett. 12, 20160155. doi:10.1098/rsbl.2016.0155
Salmón P., Stroh E., Herrera-Dueñas A., von Post M., Isaksson C. (2018). Oxidative stress in birds along a NOx and urbanisation gradient: an interspecific approach. Sci. Total Environ. 622–623, 635–643. doi:10.1016/j.scitotenv.2017.11.354
Sanderfoot O. V., Holloway T. (2017). Air pollution impacts on avian species via inhalation exposure and associated outcomes. Environ. Res. Lett. 12, 083002. doi:10.1088/1748-9326/aa8051
Sapolsky R. M., Romero L. M., Munck A. U. (2000). How do glucocorticoids influence stress responses? Integrating permissive, suppressive, stimulatory, and preparative actions. Endocr. Rev. 21, 55–89. doi:10.1210/edrv.21.1.0389
Scheuerlein A., Van’t Hof T., Gwinner E. (2001). Predators as stressors? Physiological and reproductive consequences of predation risk in tropical stonechats (Saxicola torquata axillaris). Proc. R. Soc. Lond. B Biol. Sci. 268, 1575–1582. doi:10.1098/rspb.2001.1691
Schoech S. J., Bowman R., Reynolds S. J. (2004). Food supplementation and possible mechanisms underlying early breeding in the Florida Scrub-Jay (Aphelocoma coerulescens). Horm. Behav. 46, 565–573. doi:10.1016/j.yhbeh.2004.06.005
Schoenle L. A., Kernbach M., Haussmann M. F., Bonier F., Moore I. T. (2017). An experimental test of the physiological consequences of avian malaria infection. J. Anim. Ecol. 86, 1483–1496. doi:10.1111/1365-2656.12753
Sears C. G., Riggs D. W., Keith R. J., Sithu I., Yeager R., Srivastava S., et al. (2024). The effects of neighborhood greening on inflammation in the green heart project. ISEE Conf. Abstr. 2024, 2024. doi:10.1289/isee.2024.1426
Sicolo M., Tringali M., Fumagalli P., Santagostino A. (2010). Columba livia as a sentinel species for the assessment of urban air genotoxicity. Arch. Environ. Contam. Toxicol. 59, 484–491. doi:10.1007/s00244-010-9488-3
Sirivelu M. P., MohanKumar S. M. J., Wagner J. G., Harkema J. R., MohanKumar P. S. (2006). Activation of the stress axis and neurochemical alterations in specific brain areas by concentrated ambient particle exposure with concomitant allergic airway disease. Environ. Health Perspect. 114, 870–874. doi:10.1289/ehp.8619
Steiger S. S., Kelley J. P., Cochran W. W., Wikelski M. (2009). Low metabolism and inactive lifestyle of a tropical rain forest bird investigated via heart-rate telemetry. Physiol. Biochem. Zool. 82, 580–589. doi:10.1086/605336
Suarez-Rubio M., Leimgruber P., Renner S. C. (2011). Influence of exurban development on bird species richness and diversity. J. Ornithol. 152, 461–471. doi:10.1007/s10336-010-0605-x
Symonds M. R. E., Moussalli A. (2011). A brief guide to model selection, multimodel inference and model averaging in behavioural ecology using Akaike’s information criterion. Behav. Ecol. Sociobiol. 65, 13–21. doi:10.1007/s00265-010-1037-6
Tiwari A., Kumar P., Baldauf R., Zhang K. M., Pilla F., Di Sabatino S., et al. (2019). Considerations for evaluating green infrastructure impacts in microscale and macroscale air pollution dispersion models. Sci. Total Environ. 672, 410–426. doi:10.1016/j.scitotenv.2019.03.350
Vanderhoff N., Pyle P., Patten M. A., Sallabanks R., James F. C. (2016). “American Robin (Turdus migratorius), version 2.0,” in The birds of north America (Ithaca: Cornell Lab of Ornithology).
Wemer L., Hegemann A., Isaksson C., Nebel C., Kleindorfer S., Gamauf A., et al. (2021). Reduced ectoparasite load, body mass and blood haemolysis in Eurasian kestrels (Falco tinnunculus) along an urban–rural gradient. Sci. Nat. 108, 42. doi:10.1007/s00114-021-01745-x
White J. H., Heppner J. J., Ouyang J. Q. (2022). Increased lead and glucocorticoid concentrations reduce reproductive success in house sparrows along an urban gradient. Ecol. Appl. 32, e2688. doi:10.1002/eap.2688
Xing Y., Brimblecombe P. (2019). Role of vegetation in deposition and dispersion of air pollution in urban parks. Atmos. Environ. 201, 73–83. doi:10.1016/j.atmosenv.2018.12.027
Yeager R., Browning M. H. E. M., Breyer E., Ossola A., Larson L. R., Riggs D. W., et al. (2023). Greenness and equity: complex connections between intra-neighborhood contexts and residential tree planting implementation. Environ. Int. 176, 107955. doi:10.1016/j.envint.2023.107955
Yeager R., Keith R. J., Riggs D. W., Fleischer D., Browning M. H. E. M., Ossola A., et al. (2024). Intra-neighborhood associations between residential greenness and blood pressure. Sci. Total Environ. 946, 173788. doi:10.1016/j.scitotenv.2024.173788
Yeager R., Riggs D. W., DeJarnett N., Tollerud D. J., Wilson J., Conklin D. J., et al. (2018). Association between residential greenness and cardiovascular disease risk. J. Am. Heart Assoc. 7, e009117. doi:10.1161/JAHA.118.009117
Zahor D. L., Glynn K. J., Majestic B., Cornelius J. M. (2024). You are what you eat: urban soil lead predicts American robin (Turdus migratorius) blood lead in Flint, MI. Urban Ecosyst. 27, 1685–1694. doi:10.1007/s11252-024-01546-w
Keywords: greenness, air pollution, urban, ecology, avian physiology
Citation: Abolins-Abols M, Yeager R, Turner J, Smith T and Bhatnagar A (2025) Greenness and pollution exposure predict corticosterone concentration in an urban songbird. Front. Physiol. 16:1603811. doi: 10.3389/fphys.2025.1603811
Received: 01 April 2025; Accepted: 02 June 2025;
Published: 25 June 2025.
Edited by:
Karen Sweazea, Arizona State University, United StatesReviewed by:
Kendra B Sewall, Virginia Tech, United StatesVerónica Quirici, Andres Bello University, Chile
Copyright © 2025 Abolins-Abols, Yeager, Turner, Smith and Bhatnagar. This is an open-access article distributed under the terms of the Creative Commons Attribution License (CC BY). The use, distribution or reproduction in other forums is permitted, provided the original author(s) and the copyright owner(s) are credited and that the original publication in this journal is cited, in accordance with accepted academic practice. No use, distribution or reproduction is permitted which does not comply with these terms.
*Correspondence: Mikus Abolins-Abols, bS5hYm9saW5zLWFib2xzQGxvdWlzdmlsbGUuZWR1