 Shancheng He
 Xuemei Zhong2
- 1Ganzhou Key Laboratory of Respiratory Diseases, Department of Intensive Care Medicine, Ganzhou Fifth People’s Hospital, Ganzhou Institute of Respiratory Disease Prevention and Control, Ganzhou, Jiangxi, China
- 2Department of Quality Control, Second People’s Hospital of Nankang District, Ganzhou, Jiangxi, China
Background: Hypertension is a major contributing factor for cardiovascular disease. This research attempted to explicate the link between serum levels of chloride and the risk of hypertension occurrence, as well as to identify the threshold level at which the risk undergoes changes across the general population and various demographic segments.
Methods: Employing materials from the to 2017–2018 National Health and Nutrition Examination Survey (NHANES; n = 4,591), we employed multivariate regression analysis to gauge the connection between adult serum chloride concentrations and the risk of hypertension occurring. Smooth curve fitting, threshold effects, and saturation effects analyses were carried out to identify the threshold levels of chloride connected with changes in the risk of hypertension. Additionally, to further explore the complex relationship between serum chloride levels and hypertension risk, and to understand the contributions of various features within a high-performance machine learning model, we trained an XGBoost classifier to predict hypertension status and utilized SHAP (SHapley Additive exPlanations) values for interpretation.
Results: A substantial connection was acquired between serum chloride levels and the risk of hypertension. After adjusting for variables, the multivariate logistic regression analysis demonstrated a U-shaped connection (OR = 0.94, 95% CI: 0.92–0.97, P < 0.0001). Below 103 mmol/L, the risk of hypertension decreased with increasing chloride levels (OR = 0.906, 95% CI = 0.877–0.936, P < 0.0001), demonstrating a 9.4% decline in the likelihood of hypertension per 1 mmol/L rise in chloride. Conversely, above 103 mmol/L, the risk grew with higher chloride concentrations (OR = 1.119, 95% CI = 1.030–1.216, P = 0.0081), signifying an 11.9% rise in the probability of hypertension by 1 mmol/L increment. Interpretation of an XGBoost machine learning model using SHAP values visually corroborated this U-shaped pattern, further indicating that the lowest contribution of serum chloride to the predicted risk of hypertension occurred around the 103 mmol/L level.
Conclusion: In conclusion, using NHANES 2017–2018 data, this study revealed a significant U-shaped association between adult serum chloride levels and hypertension risk, with a nadir at 103 mmol/L. Both low and high chloride levels correlated with increased hypertension risk. This suggests serum chloride could serve as a potential biomarker for hypertension risk stratification, warranting further validation. Given the observational design, future prospective studies are needed to confirm this association and elucidate its underlying mechanisms.
1 Introduction
Hypertension is a contributing risk for cardiovascular disease and poses a threat to global health (Zhou et al., 2021; Olsen et al., 2016). Chronic hypertension can lead to macrovascular conditions such as aortic dissection, heart failure, and stroke, as well as microvascular diseases such as kidney disease and retinopathy (Xie et al., 2016; Sharp et al., 2011; Cipolla et al., 2018; Hibino et al., 2022; Comeau et al., 2022). Excessive blood pressure is a crucial preventable driver of cardiovascular mortality and cardiovascular disease burden in most locations around the world (Zhou et al., 2021; Olsen et al., 2016).
Chloride ions, once thought to be inert in physiological processes, are now understood to be dynamically regulated, with intracellular fluctuations participating in a myriad of physiological activities (Yang et al., 2012; Wang et al., 2006). Serum chloride levels correlate with a spectrum of diseases, including pulmonary arterial hypertension (Sinha et al., 2022), vascular calcification (Hu et al., 2021; Zhao et al., 2012), heart disease (Grodin et al., 2015), chronic renal failure (Khatri et al., 2020), cardiorenal syndrome (Kazory and Costanzo, 2020), and hypertension (Sinha et al., 2022). Substantial evidence suggests that the increase in arterial pressure caused by salt ingestion is more precisely connected to the anionic component, chloride ions, than to sodium ions (Wiig et al., 2013; McCallum et al., 2013). The study of the correlation between serum chloride concentrations and hypertension has significant implications. Therefore, this study aimed to utilize data from the NHANES 2017-2018 to precisely characterize the association between serum chloride levels and the risk of hypertension, identify potential non-linear relationships and critical thresholds, and explore these dynamics across different demographic groups.
2 Participants and methods
2.1 Source of data and research group
The data employed in the analyses was gathered from the National Health and Nutrition Examination Survey (NHANES) database, which is renowned for its rigor and reliability, as substantiated by numerous studies. The NHANES is designed to collate data on physical health indicators, lifestyle, and dietary habits of the American populace to appraise their wellbeing. Our analysis was predicated on data recorded between 2017 and 2018, encompassing a single cycle within the NHANES database. The study initially comprised 9,255 individuals. During the data curation process, we excluded individuals with missing or unknown hypertension status, those under the age of 20 years, and individuals with incomplete data regarding age, ethnicity, marital status, height, weight, serum chloride, blood urea nitrogen, uric acid, potassium, and sodium levels, as well as those who might confound the study outcomes (Figure 1).
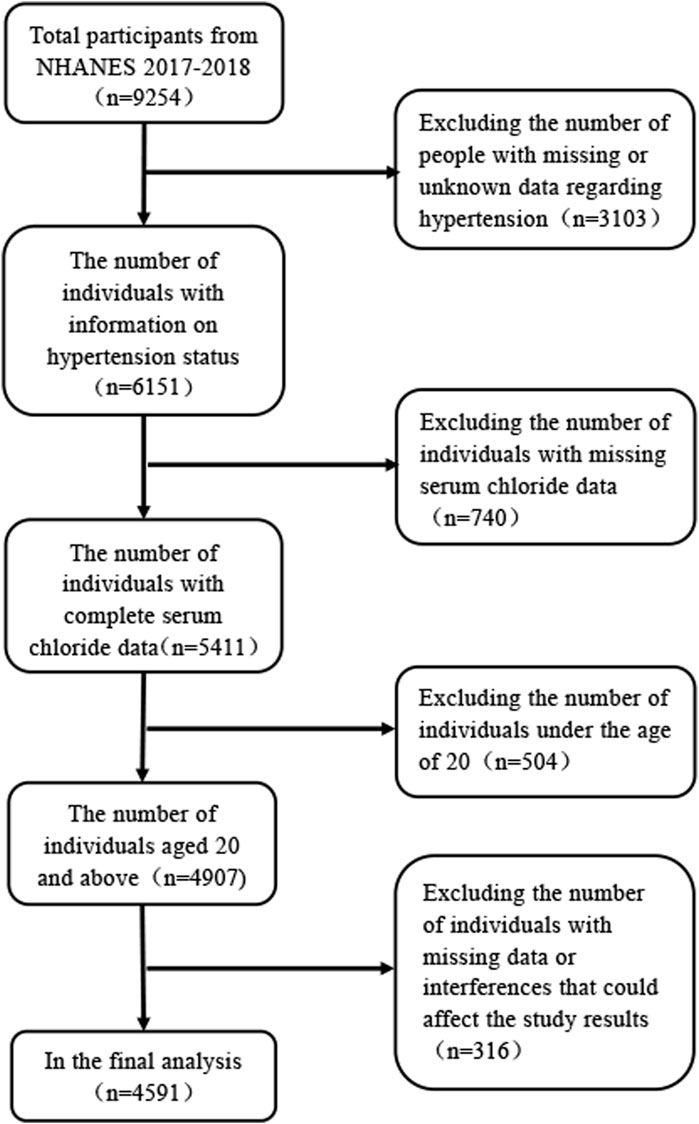
Figure 1. Flowchart of participant selection from NHANES 2017-2018.
2.2 Variables
In the current research, the exposure variable was serum chloride (mmol/L), and its concentration was measured utilizing ion-selective electrodes that generated a potential based on the unique properties of certain membranes that come into contact with a diluted (1:31) solution containing chloride ions to determine its concentration. Serum chloride concentrations were classified into four groups: quartile 1 (Q1; ≥84, ≤101 mmol/L) (n = 2,592), quartile 2 (Q2; >101, ≤103 mmol/L) (n = 1,179), quartile 3 (Q3; >103, ≤105 mmol/L) (n = 599), and quartile 4 (Q4; >105, ≤112 mmol/L) (n = 221). These categories were determined based on prior observations of serum chloride in relation to other diseases (Hu et al., 2021; Zhao et al., 2024; Hou et al., 2023). The outcome variable was the occurrence of hypertension, which was assessed by Whether a doctor or another healthcare professional had told the individual of their hypertension through questionnaires in the NHANES database. In order to make this study more rigorous and precise, we have added 18 covariates: marital status, race/hispanic origin, smoking status, sex, height (feet), albumin (g/L), urea nitrogen (mmol/L), age, uric acid (umol/L), lactate dehydrogenase (IU/L), weight (pounds), blood sodium (mmol/L), triglycerides (mmol/L), blood calcium (mmol/L), creatinine (umol/L), blood potassium (umol/L), bicarbonate (mmol/L), and blood phosphorus (mmol/L). For all data on the exposure variable, outcome variable, and other variables, please browse to https://www.cdc.gov/nchs/nhanes/.
2.3 Statistical analysis
Each analysis was conducted utilizing the data analysis packages in R and Empower Statistics. Statistical worthiness was set at P < 0.05. To evaluate differences in descriptive analysis, t-tests (for continuous variables) or chi-square tests (for categorical variables) were utilized in the statistical procedure. Univariate analysis was utilized to gauge factors affecting hypertension, while a multivariate logistic regression model was utilized to gauge the connection between serum chloride concentrations and the risk of hypertension. The regression analysis produced three statistical models. Model I was not adjusted for these variables. Model II was adjusted for variables, such as race/Hispanic origin, age, and sex. Model III was adjusted for all relevant variables, such as blood urea nitrogen, marital status, albumin, race/Hispanic origin, age, uric acid, lactate dehydrogenase, weight, triglycerides, blood calcium, sex, creatinine, and bicarbonate. Smooth curve fitting and generalized additive models were utilized to evaluate the non-linear connection between chloride concentrations and the risk of hypertension occurring. To further explore the complex relationship between serum chloride levels and hypertension risk, and to understand the contributions of various features within a high-performance machine learning model, we trained an XGBoost classifier to predict hypertension status and utilized SHAP (SHapley Additive exPlanations) values for interpretation. The dataset (n = 4,591) was randomly split into a 70% training set (n = 3,213) and a 30% testing set (n = 1,378) using stratified sampling. During training, we employed 5-fold cross-validation for hyperparameter tuning and robust evaluation. The model’s predictive performance was assessed by calculating standard metrics (including Accuracy, Area Under the ROC Curve (AUC-ROC), Precision, Recall, and F1-Score) on the test set. For model interpretation, we utilized SHAP (SHapley Additive exPlanations) values and generated SHAP dependence plots to visualize feature contributions.
3 Results
An aggregate of 4,591 individuals was enrolled and categorized into quartiles based on serum chloride concentrations: quartile 1 (Q1; n = 2,592), quartile 2 (Q2; n = 1,179), quartile 3 (Q3; n = 599), and quartile 4 (Q4; n = 221). As depicted in Table 1, the mean serum chloride levels for the four groups were 99.07 ± 2.07 mmol/L, 102.43 ± 0.50 mmol/L, 104.36 ± 0.48 mmol/L, and 106.63 ± 0.98 mmol/L, respectively. Significant baseline differences were observed across the quartiles of serum chloride for smoking status, body weight, sex, albumin, blood urea nitrogen, uric acid, race/Hispanic ethnicity, blood phosphorus, lactate dehydrogenase, triglycerides, blood calcium, height, bicarbonate, blood potassium, age, and blood sodium. In contrast, no significant baseline differences were noted for marital status or creatinine.
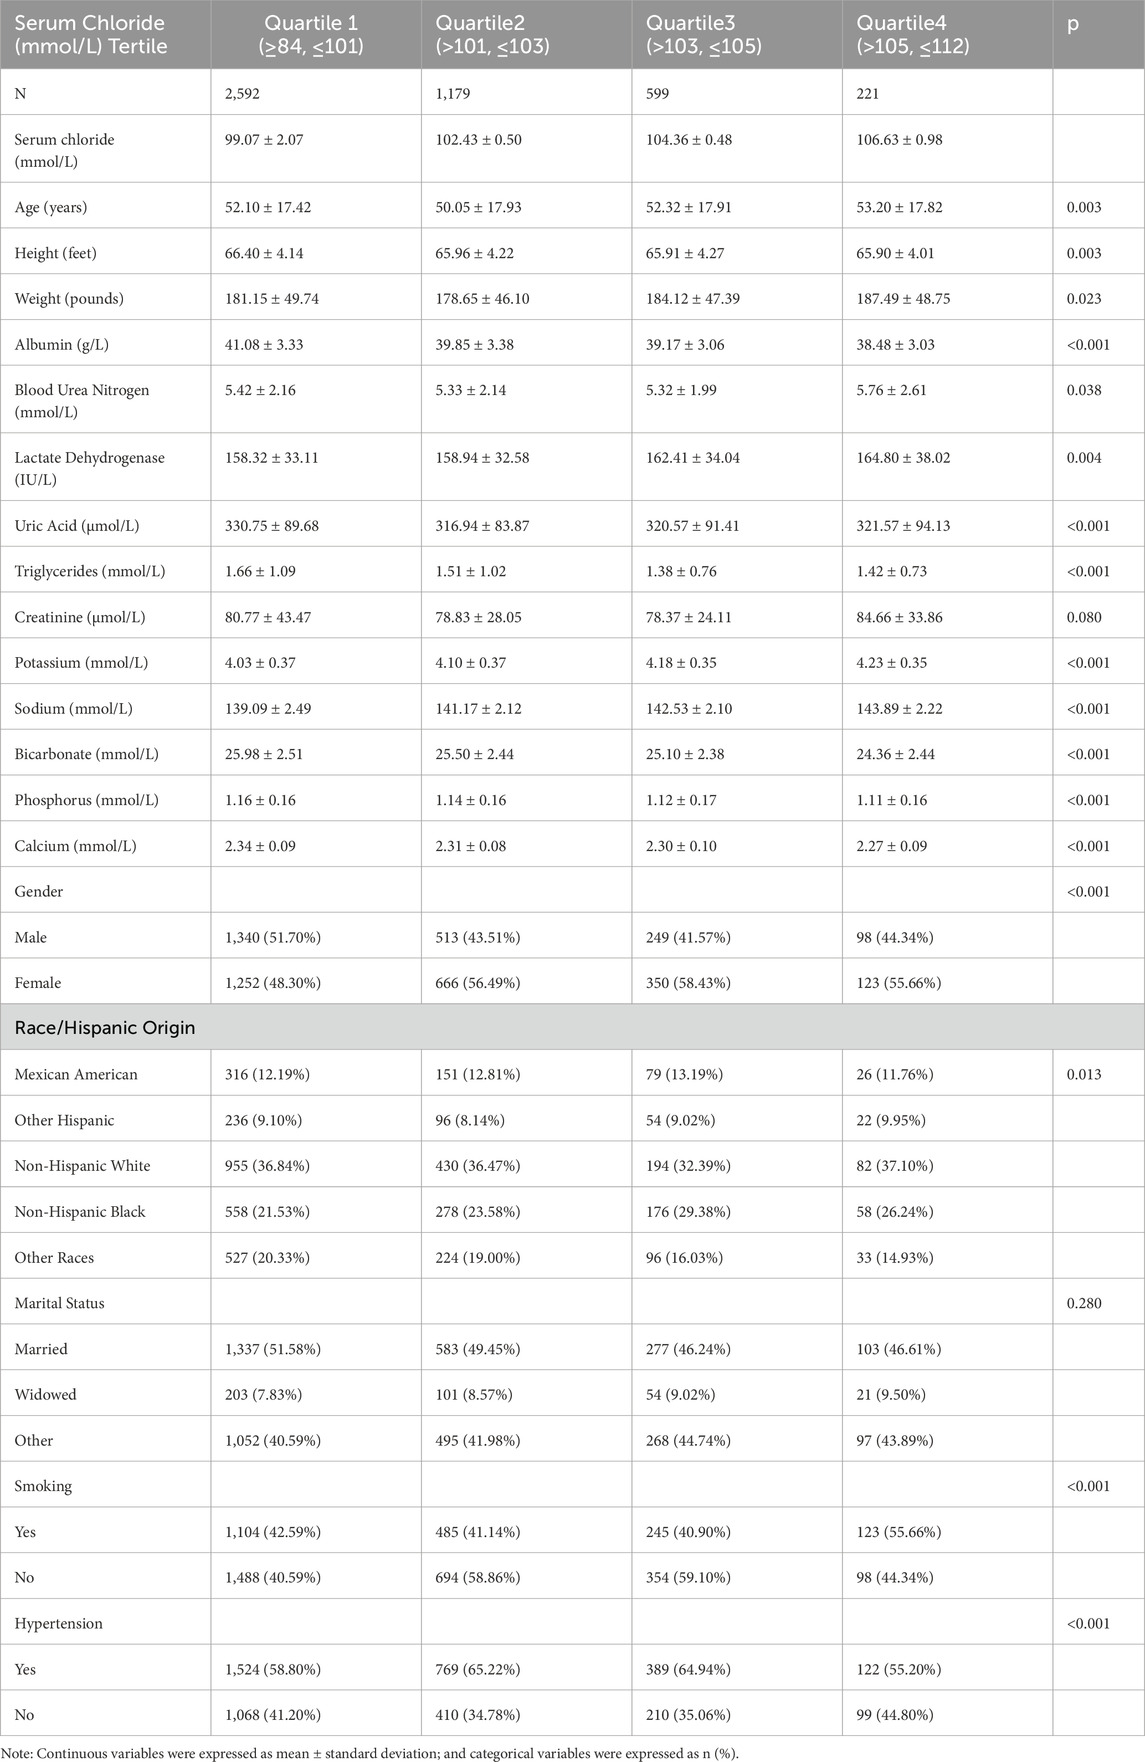
Table 1. Baseline characteristics of participants (N = 4,591).
Table 2 revealed the outcomes of the univariate analysis, indicating a link between serum chloride concentrations and the likelihood of developing hypertension. In the analysis of the risk of hypertension, utilizing Q1 as the comparison group, the odds ratios (OR) for Q2 (OR = 0.76, 95% CI: 0.66-0.88, P = 0.0002) and Q3 (OR = 0.77, 95% CI: 0.64-0.93, P = 0.0057) were both less than 1. In contrast, Q4 showed no statistical significance compared to Q1 (P > 0.05). The likelihood of hypertension occurrence was additionally connected with marital status, weight, blood urea nitrogen, race, lactate dehydrogenase, uric acid, triglycerides, smoking status, creatinine, age, blood calcium, serum albumin, and bicarbonate; however, blood potassium, height, blood sodium, sex, and blood phosphorus were not related to the likelihood of hypertension. To further investigate, were utilized subgroup analyses to gauge the various connections between serum chloride quartiles and the likelihood of hypertension in the subgroups (shown in Table 3). Significant interactions between plasma chloride concentration and the likelihood of hypertension occurring were observed in subgroups defined by sex, lactate dehydrogenase, creatinine, and blood sodium (P-value for interaction <0.05). In the female subgroup, the Q3 and Q2 populations had a lower likelihood of hypertension than the Q1 population. In the subgroup categorized by blood sodium levels, the Q2 and Q3 groups had a lower likelihood of hypertension, with the Q1 group serving as a comparison group, whereas the Q4 group had a higher likelihood of hypertension occurring.
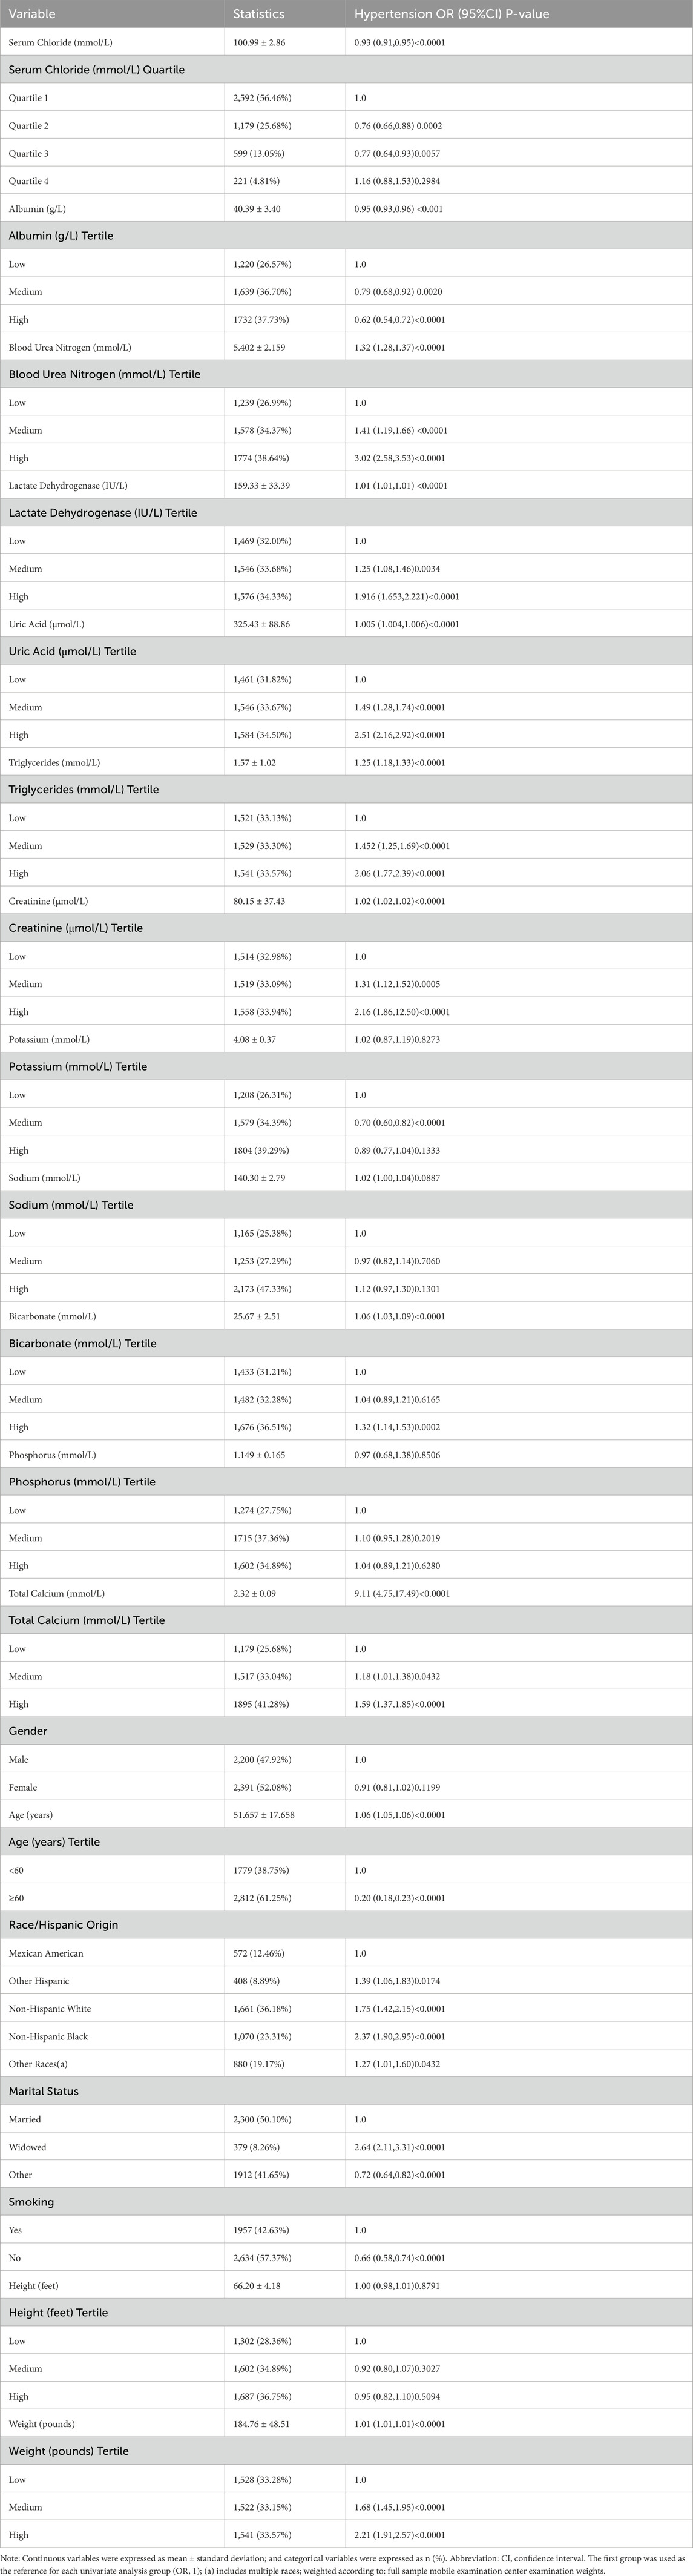
Table 2. Univariate analysis of the risk of hypertension occurrence.
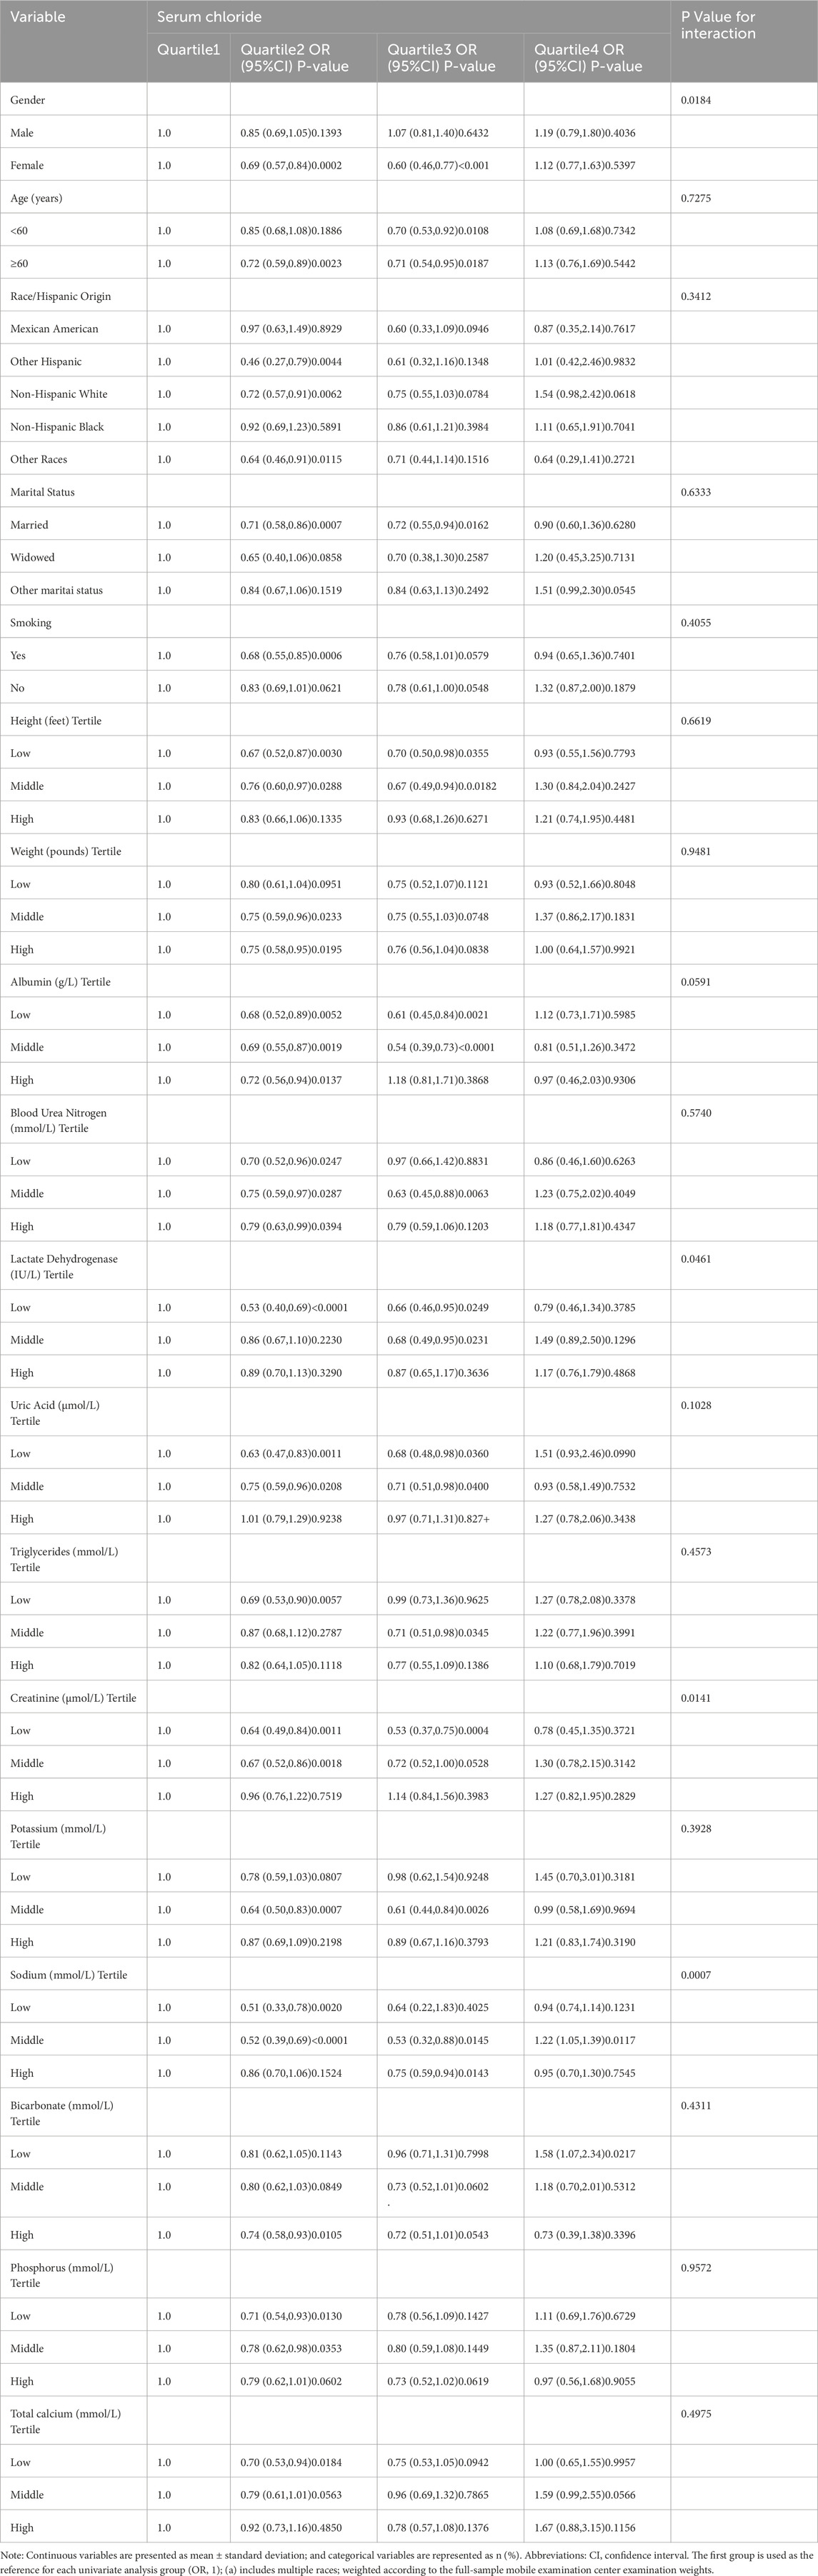
Table 3. Subgroup analysis of the risk of hypertension occurrence associated with serum chloride level.
Table 4 revealed the outcomes of the multivariate regression analysis, which revealed a negative connection between serum chloride concentrations and the likelihood of hypertension occurrence in Model I (OR = 0.93, 95% CI: 0.91-0.95, P < 0.0001). This inverse connection persisted after adjusting for confounding factors in Models II (OR = 0.93, 95% CI: 0.91-0.96, P < 0.0001) and III (OR = 0.94, 95% CI: 0.92-0.97, P < 0.0001). Furthermore, in the analysis of the risk of hypertension, it was observed across all models that compared to the reference group Q1, both Q2 and Q3 groups exhibited a lower risk of hypertension, whereas Q4 showed no significant association with Q1 (P > 0.05 for all comparisons).
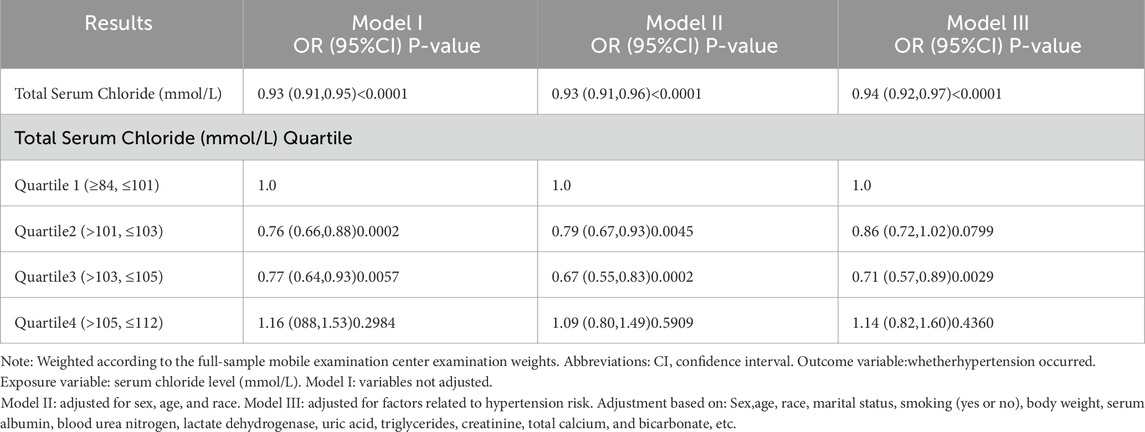
Table 4. Relationship between serum chloride and the risk of hypertension occurrence (multivariate regression analysis).
We also utilized smooth curve fitting (Figure 2) and threshold and saturation effect analyses (Table 5) to gauge the link between serum chloride and the likelihood of hypertension occcurrence. For details on the covariates utilized for adjustment, see Table 5. Figure 2 illustrates that the fitted curve between chloride levels and the risk of hypertension exhibits a U-shaped pattern, initially declining and then rising, with a segmented effect:when chloride levels are below 103 mmol/L, the risk of hypertension decreases with increasing chloride concentrations (OR = 0.906, 95% CI: 0.877-0.936, P < 0.0001), with a 9.4% decline in the probability of developing hypertension for every 1 mmol/L increase in chloride; at chloride levels above 103 mmol/L, the risk of hypertension increases with increasing chloride levels (OR = 1.119, 95% CI: 1.030-1.216, P = 0.0081), with a 11.9% rise in the likelihood of developing hypertension (Figure 2; Table 5). To conduct a increasingly thorough analysis, smooth fitting curves were plotted for different strata of six covariates, including smoking status, age, body weight, race/Hispanic origin, sex, and marital status (Figure 3). In the majority of the stratified populations, the connection between serum chloride concentrations and the likelihood of hypertension occurrence has a segmented effect. Before the inflection point, the likelihood of hypertension occurring decreased with increasing chloride levels, and after the inflection point, the likelihood of hypertension occurrence rose with increasing chloride levels, with the smooth fitting curve exhibiting a U-shaped or U-shaped-like pattern. For instance, in the male population, the inflection point of the fitting curve corresponded to a serum chloride concentration of 98 mmol/L (see Table 5), and in the population younger than 60 years, the inflection point corresponded to a chloride concentration of 103 mmol/L (Table 5). The chloride concentrations corresponding to the inflection points of the fitting curves may not be the same. In other racial populations, the risk of hypertension declined with increasing chloride levels, whereas in Mexican-American, married, and widowed populations, the fitting curves exhibited considerable fluctuations.
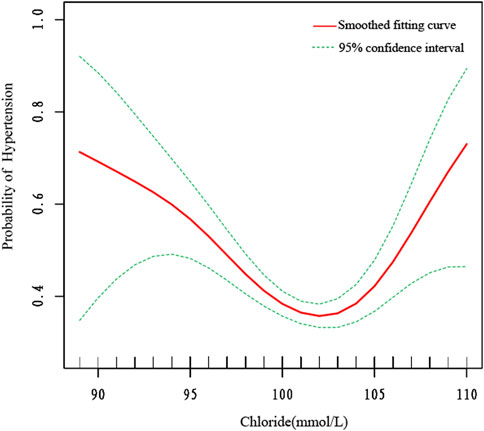
Figure 2. The smooth fitting curve delineating the relationship between serum chloride levels and the risk of hypertension occurrence. The smooth curve fitting is represented by the red line, and the fitted 95% confidence interval is represented by the green line. Weighting basis: Complete sample with mobile examination center examination weights. Adjusted for sex, age (smoothed), race, marital status, smoking status (yes or no), body weight (smoothed), serum albumin (smoothed), blood urea nitrogen (smoothed), lactate dehydrogenase (smoothed), uric acid (smoothed), triglycerides (smoothed), creatinine (smoothed), total calcium (smoothed), and bicarbonate (smoothed).
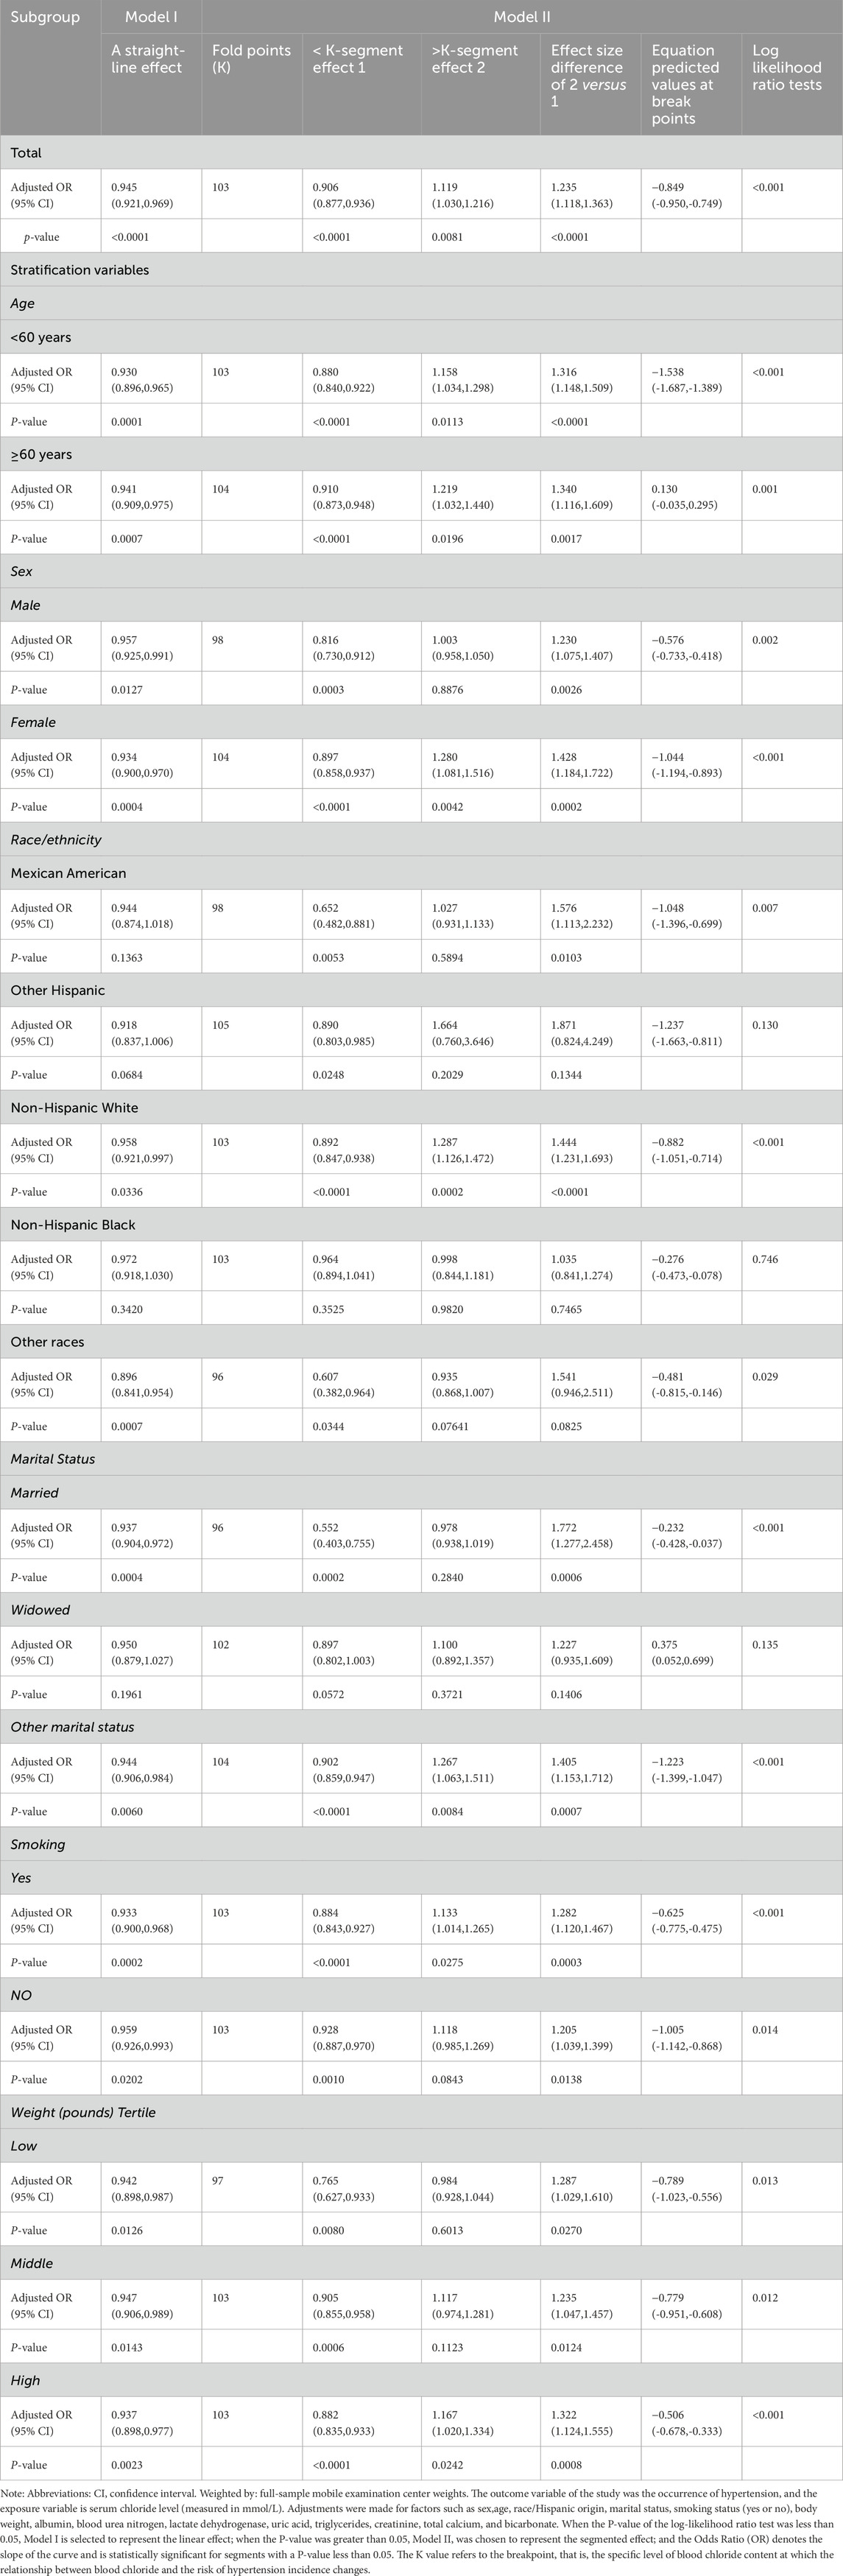
Table 5. Threshold effect and saturation effect analysis.
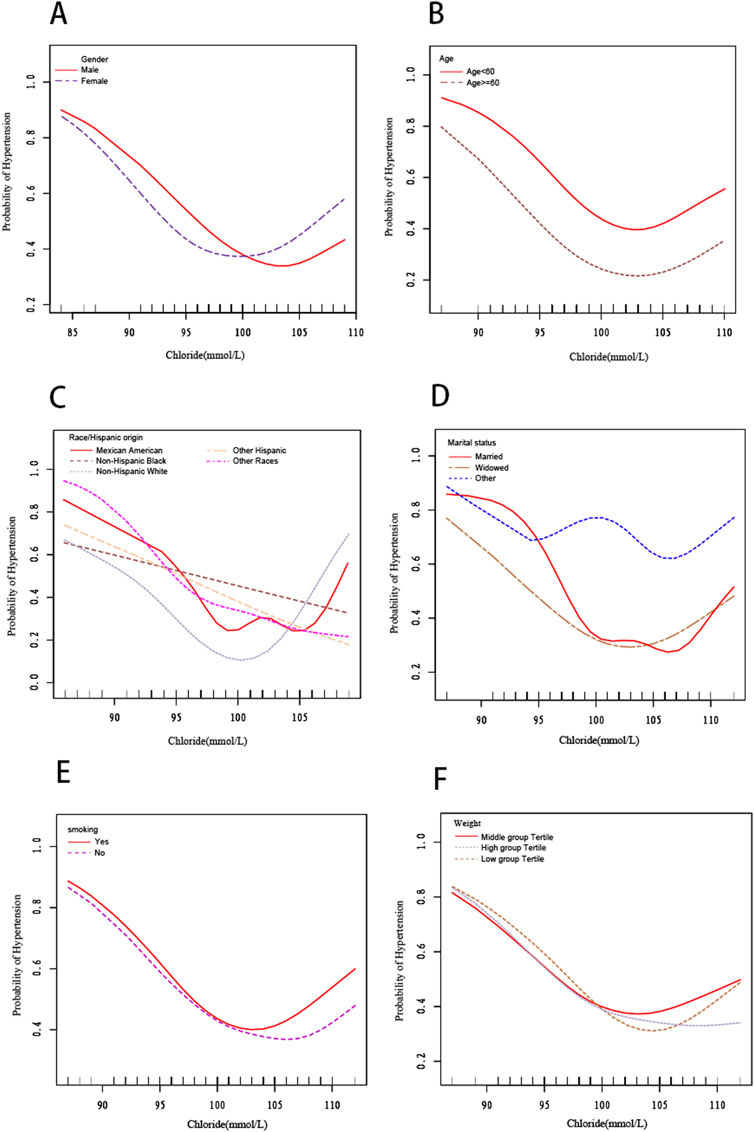
Figure 3. The smooth fitting curve delineating the relationship between serum chloride levels and the risk of hypertension occurrence, stratified by covariates (sex,age, race/Hispanic Origin, marital status, smoking status, weight). Adjusted for sex, age (smoothed), race, marital status, smoking status (yes or no), body weight (smoothed), serum albumin (smoothed), blood urea nitrogen (smoothed), lactate dehydrogenase (smoothed), uric acid (smoothed), triglycerides (smoothed), creatinine (smoothed), total calcium (smoothed), and bicarbonate (smoothed).(A) Stratified by sex. (B) Stratified by age. (C) Stratified by race/Hispanic origin. (D) Stratified by marital status. (E) Stratified by smoking status.(F) Stratified by weight (pounds).
The XGBoost classifier, trained to predict hypertension status, demonstrated good predictive capability on the independent test set. It achieved an overall accuracy of 72.1% and an AUC-ROC of 0.790. For predicting hypertension, the model yielded a precision of 0.66, a recall of 0.58, and an F1-score of 0.62. These metrics indicate that the model is sufficiently robust to support further feature contribution analysis using SHAP values. Figure 4 displays the SHAP dependence plot for serum chloride. Positive SHAP values indicate that a given chloride level increased the model’s predicted likelihood of hypertension, whereas negative values indicate a decreased predicted likelihood. Each point in the plot represents an individual sample from the test set. The plot reveals a distinct U-shaped (or potentially J-shaped) non-linear relationship between serum chloride levels and their contribution to the model’s prediction. Specifically, at lower serum chloride concentrations (approximately <98 mmol/L), increasing chloride levels were associated with a decreasing contribution (lower SHAP values) towards the predicted risk of hypertension, transitioning from positive towards zero or negative values. Within the intermediate range of approximately 98–103 mmol/L, the SHAP values were generally at their minimum, close to or below zero, suggesting that chloride levels in this range contributed minimally, or even negatively (protectively), to the predicted hypertension risk. Conversely, at higher serum chloride concentrations (approximately >103 mmol/L), further increases in chloride levels were associated with a marked increase in their positive contribution (increasing positive SHAP values) to the predicted risk.
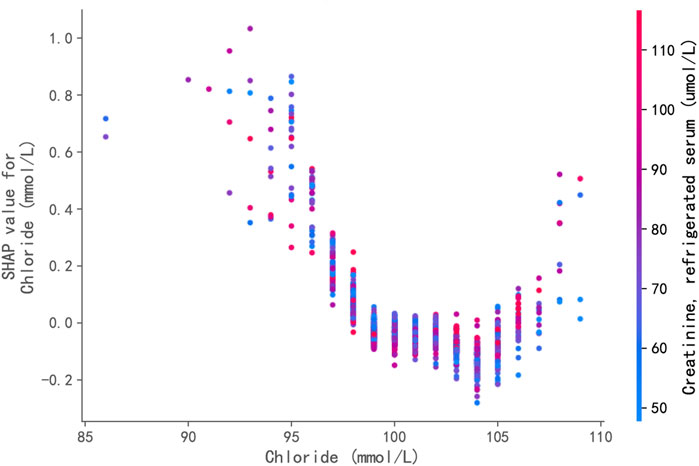
Figure 4. SHAP (SHapley Additive exPlanations) Dependence Plot for Serum Chloride. This plot displays the relationship between serum chloride levels (x-axis) and their impact (SHAP value, y-axis) on the XGBoost model’s prediction of hypertension risk. Each point represents an individual sample from the test set. Positive SHAP values indicate that the chloride level increased the model’s predicted likelihood of hypertension, while negative values indicate a decreased predicted likelihood. A distinct U-shaped non-linear relationship is evident: increasing chloride levels below ∼98 mmol/L are associated with decreasing risk contribution; levels between ∼98 and 103 mmol/L contribute minimally; and levels above ∼103 mmol/L are associated with a marked increase in positive contribution to the predicted risk.
4 Discussion
Essential hypertension develops because of complex interactions across several regulating mechanisms, which are effected by a variety of biological, nutritional, and environmental variables (McCallum et al., 2015; Cheung and Li, 2012). Studies on the effects of salt intake and potassium consumption on arterial pressure (Aung et al., 2023; Kou et al., 2023; Stolarz-Skrzypek et al., 2013), along with the pressure-natriuretic hypothesis (Guyton, 1991), indicated that sodium ions were the principal determinants of blood pressure and mortality, and chloride was the main extracellular anion that came from the diet accompanying sodium (Na) (Stolarz-Skrzypek et al., 2013). However, there was a strong indication in both animals and humans that the increase in arterial pressure due to salt consumption might be more closely related to the anionic component (i.e., Cl-) than to Na+ (Luft et al., 1990; Kotchen et al., 1983; Kurtz et al., 1987). Extensive studies on hypertensive rat models and humans have shown that equimolar additions of sodium salts can lead to similar extents of sodium storage and restriction of the renin-angiotensin-aldosterone system (RAAS), but only sodium chloride results in a volume of plasma growth and increased blood pressure (Kotchen et al., 1983; Kurtz et al., 1987). A 35-year epidemiological study of 12,968 hypertensive adults, measuring blood pressure and electrolytes longitudinally, revealed that low blood chloride levels were connected with higher cardiovascular mortality, irrespective of serum sodium or bicarbonate levels. A study involving 162 patients found that hypochloremia was significantly reduced regardless of whether or not it was accompanied by hyponatremia (Hanberg et al., 2016). The Belgian Interuniversity Research on Nutrition and Health, involving 9,106 subjects, discovered that after adjusting for sex,body mass index and other factors such as serum sodium, a chloride concentration of <100 mEq/L was correlated with an elevated susceptibility to a broad spectrum of diseases and a heightened risk of cardiovascular disease (Kurtz et al., 1987).
A wealth of current evidence indicates that chloride ions are not passive entities in the electrochemical equilibrium of the cytoplasmic membrane; they are dynamically regulated and play crucial roles in processes such as cell death (McCallum et al., 2015), modulation of enzymatic function (Cheung and Li, 2012), anticancer drug resistance (Aung et al., 2023), and synaptic transmission (Kou et al., 2023). Research has demonstrated that a decline in chloride transport by the macula densa can result in elevated renin secretion from the juxtaglomerular apparatus (Stolarz-Skrzypek et al., 2013), resulting in an active renin-angiotensin-aldosterone system, increased resistance in the renal afferent arterioles, lower renal circulation and glomerular filtration rate, and subsequently higher blood pressure (Stolarz-Skrzypek et al., 2013). Additional analyses revealed that low chloride levels in the thick ascending limb of the circle of Henle and the distal convoluted tubule could improve the activity of Na-K-Cl cotransporters through the lysine-less protein kinase family of intracellular chloride ion sensors (Guyton, 1991). Overactivity of these transporters can lead to increased sodium absorption, resistance to diuretics, and fluid overload (Guyton, 1991).
The primary goal of the investigation was to obtain a peak understanding at the connection between chloride and the likelihood of hypertension occurring. We utilized a sample with adequate representation of the adult population in America (n = 4,591). Our research has an array of advantages: (Zhou et al., 2021): a large sample size and a diverse study sample; (Olsen et al., 2016); rigorous statistical methods that take into account a wide range of potential factors in order to reduce the impact of confounding variables. This study suggests that serum chloride could serve as a population-level biomarker for stratifying hypertension risk, warranting further validation.
This study has several limitations. The individuals that we picked were all US citizens, therefore, the outcomes might vary in different nations and locations. This study measured chloride levels at a single time point; therefore, we could not assess the temporal connection between chloride levels and the likelihood of hypertension. Consequently, future studies should include long-term follow-up research. Furthermore, while the sample size of this study is substantial, data from additional individuals will strengthen the conclusions. The molecular pathway by which chloride regulates the occurrence of hypertension is unexplained and entails further basic research. Although we utilized statistical tools to control for confounding factors, we may still be unable to rule out the presence of other confounding factors.
5 Conclusion
In conclusion, using NHANES 2017–2018 data, this study revealed a significant U-shaped association between adult serum chloride levels and hypertension risk, with a nadir at 103 mmol/L. Both low and high chloride levels correlated with increased hypertension risk. This suggests serum chloride could serve as a potential biomarker for hypertension risk stratification, warranting further validation. Given the observational design, future prospective studies are needed to confirm this association and elucidate its underlying mechanisms.
Data availability statement
Publicly available datasets were analyzed in this study. This data can be found here: https://www.niehs.nih.gov/research/atniehs/labs/crb/studies/nhanes.
Ethics statement
The studies involving humans were approved by The Ethics Review Committee of the National Center for Health Statistics in the United States approved this study. The studies were conducted in accordance with the local legislation and institutional requirements. Written informed consent for participation was not required from the participants or the participants’ legal guardians/next of kin in accordance with the national legislation and institutional requirements. The manuscript presents research on animals that do not require ethical approval for their study.
Author contributions
SH: Writing – review and editing, Data curation, Software, Methodology, Resources, Funding acquisition, Writing – original draft, Formal analysis. XZ: Data curation, Methodology, Conceptualization, Formal analysis, Investigation, Resources, Software, Writing – original draft. GC: Data curation, Conceptualization, Formal analysis, Writing – original draft. LL: Project administration, Validation, Writing – original draft, Conceptualization.
Funding
The author(s) declare that no financial support was received for the research and/or publication of this article.
Acknowledgments
We are extraordinarily thankful for the contributors’ steadfast support and substantial help in accomplishing this research endeavor.
Conflict of interest
The authors declare that the research was conducted in the absence of any commercial or financial relationships that could be construed as a potential conflict of interest.
Generative AI statement
The author(s) declare that no Generative AI was used in the creation of this manuscript.
Publisher’s note
All claims expressed in this article are solely those of the authors and do not necessarily represent those of their affiliated organizations, or those of the publisher, the editors and the reviewers. Any product that may be evaluated in this article, or claim that may be made by its manufacturer, is not guaranteed or endorsed by the publisher.
References
Aung K., Ream-Winnick S., Lane M., Akinlusi I., Shi T., Htay T. (2023). Sodium homeostasis and hypertension. Curr. Cardiol. Rep. 25 (10), 1123–1129. doi:10.1007/s11886-023-01931-5
Cheung B. M., Li C. (2012). Diabetes and hypertension: is there a common metabolic pathway? Curr. Atheroscler. Rep. 14 (2), 160–166. doi:10.1007/s11883-012-0227-2
Cipolla M. J., Liebeskind D. S., Chan S. L. (2018). The importance of comorbidities in ischemic stroke: impact of hypertension on the cerebral circulation. J. Cereb. blood flow metabolism official J. Int. Soc. Cereb. Blood Flow Metabolism 38 (12), 2129–2149. doi:10.1177/0271678X18800589
Comeau E., Leonard P. S. J., Gupta N. (2022). Income inequalities and risk of early rehospitalization for diabetes, hypertension and congestive heart failure in the Canadian working-age population. Can. J. diabetes 46 (6), 561–568. doi:10.1016/j.jcjd.2021.08.007
Grodin J. L., Simon J., Hachamovitch R., Wu Y., Jackson G., Halkar M., et al. (2015). Prognostic role of serum chloride levels in acute decompensated heart failure. J. Am. Coll. Cardiol. 66 (6), 659–666. doi:10.1016/j.jacc.2015.06.007
Guyton A. C. (1991). Blood pressure control--special role of the kidneys and body fluids. Sci. (New York, NY) 252 (5014), 1813–1816. doi:10.1126/science.2063193
Hanberg J. S., Rao V., Ter Maaten J. M., Laur O., Brisco M. A., Perry Wilson F., et al. (2016). Hypochloremia and diuretic resistance in heart failure: mechanistic insights. Circ. Heart Fail. 9 (8). doi:10.1161/CIRCHEARTFAILURE.116.003180
Hibino M., Otaki Y., Kobeissi E., Pan H., Hibino H., Taddese H., et al. (2022). Blood pressure, hypertension, and the risk of aortic dissection incidence and mortality: results from the J-SCH study, the UK biobank study, and a meta-analysis of cohort studies. Circulation 145 (9), 633–644. doi:10.1161/CIRCULATIONAHA.121.056546
Hou X., Xu W., Zhang C., Song Z., Zhu M., Guo Q., et al. (2023). L-shaped association of serum chloride level with all-cause and cause-specific mortality in American adults: population-based prospective cohort study. JMIR public health surveillance 9, e49291. doi:10.2196/49291
Hu S., Lan T., Wang S., Su L., Zou S., Ye J., et al. (2021). Serum chloride level is associated with abdominal aortic calcification. Front. Cardiovasc. Med. 8, 800458. doi:10.3389/fcvm.2021.800458
Kazory A., Costanzo M. R. (2020). The dynamic relationship between serum chloride and cardiorenal syndrome. Rev. Cardiovasc. Med. 21 (1), 25–29. doi:10.31083/j.rcm.2020.01.6
Khatri M., Zitovsky J., Lee D., Nayyar K., Fazzari M., Grant C. (2020). The association between serum chloride levels and chronic kidney disease progression: a cohort study. BMC Nephrol. 21 (1), 165. doi:10.1186/s12882-020-01828-3
Kotchen T. A., Luke R. G., Ott C. E., Galla J. H., Whitescarver S. (1983). Effect of chloride on renin and blood pressure responses to sodium chloride. Ann. Intern. Med. 98 (5 Pt 2), 817–822. doi:10.7326/0003-4819-98-5-817
Kou C., Zhao X., Fan X., Lin X., Wang Q., Yu J. (2023). Dietary sodium/potassium intake and cognitive impairment in older patients with hypertension: data from NHANES 2011-2014. J. Clin. Hypertens. (Greenwich, Conn) 25 (6), 534–544. doi:10.1111/jch.14667
Kurtz T. W., Al-Bander H. A., Morris R. C. (1987). Salt-sensitive essential hypertension in men. Is sodium ion alone important? N. Engl. J. Med. 317 (17), 1043–1048. doi:10.1056/NEJM198710223171702
Luft F. C., Zemel M. B., Sowers J. A., Fineberg N. S., Weinberger M. H. (1990). Sodium bicarbonate and sodium chloride: effects on blood pressure and electrolyte homeostasis in normal and hypertensive man. J. Hypertens. 8 (7), 663–670. doi:10.1097/00004872-199007000-00010
McCallum L., Jeemon P., Hastie C. E., Patel R. K., Williamson C., Redzuan A. M., et al. (2013). Serum chloride is an independent predictor of mortality in hypertensive patients. Hypertens. (Dallas, Tex 1979) 62 (5), 836–843. doi:10.1161/HYPERTENSIONAHA.113.01793
McCallum L., Lip S., Padmanabhan S. (2015). The hidden hand of chloride in hypertension. Pflugers Archiv Eur. J. physiology 467 (3), 595–603. doi:10.1007/s00424-015-1690-8
Olsen M. H., Angell S. Y., Asma S., Boutouyrie P., Burger D., Chirinos J. A., et al. (2016). A call to action and a lifecourse strategy to address the global burden of raised blood pressure on current and future generations: the Lancet Commission on hypertension. Lancet London, Engl. 388 (10060), 2665–2712. doi:10.1016/S0140-6736(16)31134-5
Sharp S. I., Aarsland D., Day S., Sønnesyn H., Ballard C. (2011). Hypertension is a potential risk factor for vascular dementia: systematic review. Int. J. geriatric psychiatry 26 (7), 661–669. doi:10.1002/gps.2572
Sinha M., Zabini D., Guntur D., Nagaraj C., Enyedi P., Olschewski H., et al. (2022). Chloride channels in the lung: challenges and perspectives for viral infections, pulmonary arterial hypertension, and cystic fibrosis. Pharmacol. & Ther. 237, 108249. doi:10.1016/j.pharmthera.2022.108249
Stolarz-Skrzypek K., Bednarski A., Czarnecka D., Kawecka-Jaszcz K., Staessen J. A. (2013). Sodium and potassium and the pathogenesis of hypertension. Curr. Hypertens. Rep. 15 (2), 122–130. doi:10.1007/s11906-013-0331-x
Wang X. Q., Deriy L. V., Foss S., Huang P., Lamb F. S., Kaetzel M. A., et al. (2006). CLC-3 channels modulate excitatory synaptic transmission in hippocampal neurons. Neuron 52 (2), 321–333. doi:10.1016/j.neuron.2006.08.035
Wiig H., Schröder A., Neuhofer W., Jantsch J., Kopp C., Karlsen T. V., et al. (2013). Immune cells control skin lymphatic electrolyte homeostasis and blood pressure. J. Clin. investigation 123 (7), 2803–2815. doi:10.1172/JCI60113
Xie X., Atkins E., Lv J., Bennett A., Neal B., Ninomiya T., et al. (2016). Effects of intensive blood pressure lowering on cardiovascular and renal outcomes: updated systematic review and meta-analysis. Lancet London, Engl. 387 (10017), 435–443. doi:10.1016/S0140-6736(15)00805-3
Yang H., Huang L. Y., Zeng D. Y., Huang E. W., Liang S. J., Tang Y. B., et al. (2012). Decrease of intracellular chloride concentration promotes endothelial cell inflammation by activating nuclear factor-κB pathway. Hypertens. (Dallas, Tex 1979) 60 (5), 1287–1293. doi:10.1161/HYPERTENSIONAHA.112.198648
Zhao P., Li Y., Fei Z., Gu L., Han B., Ye P., et al. (2024). Association between serum chloride levels and estimated glomerular filtration rate among US adults: evidence from NHANES 1999-2018. Int. urology Nephrol. 56, 3665–3677. doi:10.1007/s11255-024-04119-0
Zhao W. H., Gou B. D., Zhang T. L., Wang K. (2012). Lanthanum chloride bidirectionally influences calcification in bovine vascular smooth muscle cells. J. Cell. Biochem. 113 (5), 1776–1786. doi:10.1002/jcb.24049
Keywords: serum chloride, NHANES, hypertension, multiple regression analysis, smooth curve fitting
Citation: He S, Zhong X, Chen G and Li L (2025) U-shaped association between serum chloride and hypertension risk with nadir around 103 mmol/L: insights from regression and interpretable machine learning (XGBoost/SHAP) using NHANES 2017-2018. Front. Physiol. 16:1612895. doi: 10.3389/fphys.2025.1612895
Received: 16 April 2025; Accepted: 02 June 2025;
Published: 24 June 2025.
Edited by:
Rashu Barua, New York University, United StatesReviewed by:
Lorenzo Facila, University of Valencia, SpainMd Saqline Mostaq, University of Louisiana at Monroe, United States
Copyright © 2025 He, Zhong, Chen and Li. This is an open-access article distributed under the terms of the Creative Commons Attribution License (CC BY). The use, distribution or reproduction in other forums is permitted, provided the original author(s) and the copyright owner(s) are credited and that the original publication in this journal is cited, in accordance with accepted academic practice. No use, distribution or reproduction is permitted which does not comply with these terms.
*Correspondence: Long Li, MTcwNDU4NDQ3QHFxLmNvbQ==