 Sepiso K. Masenga1*†
 Catherine A.-M. Graham2*†
 Jonathan Nixon3Joreen P. Povia1
 Annet Kirabo4,5*
 Leta Pilic6
- 1Department of Physiological Sciences, Mulungushi University School of Medicine and Health Sciences, Kabwe, Zambia
- 2Precision Nutrition, Lake Lucerne Institute (LLUI), Lucerne, Switzerland
- 3St Mary’s University, London, United Kingdom
- 4Department of Molecular Physiology and Biophysics, Vanderbilt University, Nashville, TN, United States
- 5Department of Medicine, Vanderbilt Center for Immunobiology, Vanderbilt Institute for Infection, Immunology and Inflammation, Vanderbilt Institute for Global Health, Vanderbilt University Medical Center, Nashville, TN, United States
- 6Optimyse Nutrition Ltd., Radlett, United Kingdom
Introduction: Cardiovascular diseases (CVDs) are the leading cause of noncommunicable mortality in sub-Saharan Africa (SSA), driven in part by excessive salt intake. People living with HIV (PLWH) face heightened CVD risks due to hypertension and potential taste dysfunction, yet genetic and sensory drivers of salt intake in this population remain understudied. This study primarily explores differences between salt taste perception and dietary salt intake. The secondary aim was to determine if genetic variation influences the above and health markers of CVD.
Methods: Seventy-nine Zambian adults (37 PLWH, 42 healthy controls (HC)) underwent salt taste threshold/preference assessments, 24-h dietary recalls, and genotyping. Salt intensity/pleasantness was rated using visual analogue scales, and area-under-the-curve (AUC) values were calculated. Systolic and diastolic blood pressure, pulse rate, and body mass index (BMI) were measured.
Results: PLWH consumed more salt than HC (median: 9.01 vs. 7.11 g/day, p = 0.041) and exhibited reduced salt intensity perception (AUC: 94.8 vs. 109.2, p = 0.02). Genetic analyses revealed that PLWH with the TRPV1 rs4790522 AC/CC genotype consumed more salt (9.4 vs. 7.3 g/day, p < 0.05) and those with the AA genotype had lower BMIs than HC (21.0 vs. 27.9 kg/m2, p = 0.001). The SCNN1B rs239345 AT/AA genotype in PLWH was linked to elevated systolic/diastolic blood pressure (142.0/92.0 mmHg) at high salt intake. No direct correlations emerged between taste thresholds and salt intake (p > 0.05).
Conclusion: PLWH consumed more salt than HC, which may be driven by a reduced salt perception. Additionally, differences were found in the association between the TRPV1 rs4790522 SNP, salt intake and BMI profiles, between PLWH and HC, suggesting a gene-environment-disease interaction. Future research should validate these associations in larger cohorts and explore interventions addressing genetic and sensory contributors to hypertension in high-risk SSA populations.
1 Introduction
Cardiovascular diseases (CVD) are the leading cause of death from noncommunicable diseases (NCDs) in sub-Saharan Africa (SSA). It is estimated that the region accounts for approximately 80% of deaths from CVDs globally (Shumba et al., 2024). The number one risk factor for CVD is a high intake of sodium or salt due to its causal relationship with elevated blood pressure (DiNicolantonio et al., 2017). Salt is the leading dietary risk factor contributing to global morbidity and mortality. It was estimated that the mean global sodium consumption in 2019 was 4,310 mg/day (10.78 g/day salt), exceeding the WHO recommended intake of 2000 mg/day (Afshin et al., 2019). In Africa, the estimated sodium intake in 2019 was 2,687 mg/day (6.72 g/day salt) (WHO, 2023), within SSA salt intake ranges from 6.8 to 11.3 g/day (Oyebode et al., 2016). The influencers of salt intake in a SSA cohort are not comprehensively understood, this coupled with the high CVD death rate emphasises the requirement for further research.
Salt taste perception and preference are drivers of dietary salt intake (Tan et al., 2021). More specifically, impaired salt taste perception may lead to an increase in dietary salt intake, as individuals may use more salt to achieve the desired taste (Azinge et al., 2011). This impairment can be a consequence of various factors, including body mass index (BMI), disease status, medication, and genetic variation (Fasunla et al., 2016; Pilic and Mavrommatis, 2018; Bigiani, 2020). An increased BMI has been associated with a decrease in global taste sensitivity (Vignini et al., 2019), however research is scarce in a SSA cohort with no literature on people living with human immunodeficiency virus (HIV, PLWH).
HIV is an epidemic, with the greatest prevalence in SSA (Moyo et al., 2023). Although research is scarce, PLWH have been reported to have an impaired taste ability (Graham et al., 1995; Fasunla et al., 2017), potentially due to HIV’s affinity for disrupting nervous tissues, an increased susceptibility to upper aerodigestive tract infections, or by the use of antiretroviral therapy (ART; Fasunla et al., 2016; Verma et al., 2017). In PLWH salt taste ability is of great importance due to the association between HIV and hypertension (Masenga et al., 2019; Pangmekeh et al., 2019) and separately salt intake and hypertension (Grillo et al., 2019). If salt taste perception is impaired in PLWH, then a potentially higher salt intake could worsen health outcomes in a population already at increased risk of hypertension and CVD.
Salt taste perception is partially determined by genetic variations in salt taste receptors. Two membrane receptors have been identified: the epithelial sodium channel (ENaC; encoded by products of the Sodium Channel Epithelial 1 Subunit (SCNN1A, SCNN1B, SCNN1G, and SCNN1D genes) and the transient receptor potential cation channel subfamily V member 1 (TRPV1, encoded by the TRPV1 gene) (Tapanee et al., 2021). Salt taste is transduced by a sodium-specific (amiloride (Am)-sensitive) pathway and a non-selective (Am-insensitive) pathway (Rhyu et al., 2024). Single nucleotide polymorphisms (SNPs), namely, rs239345 SNN1B, related to the Am-sensitive pathway, and rs8065080 TRPV1, related to the Am-insensitive pathway, have been correlated with salt taste perception in various cohorts, including Canadian, Iranian, Spanish, United States, and United Kingdom adults (Dias et al., 2013; Barragán et al., 2018; Chamoun et al., 2018; Pilic et al., 2020; Mohammadifard et al., 2023). However, despite the important implications of these findings, research focusing on the genetic basis of salt taste perception and its impact on dietary salt intake remains limited in SSA, despite the frequency of the minor allele in SSA populations being high. This coupled with the heightened CVD risk, particularly within PLWH, makes it imperative that further research is conducted.
Therefore, the primary aim of this study was to explore and compare, in a Zambian population of healthy adults (controls; HC) and PLWH, differences between salt taste perception and dietary salt intake. The secondary aim was to determine if genetic variation influences salt perception and intake and health markers of CVD.
2 Methods
2.1 Study design and participants
This was a pilot study involving Zambian adults, 37 PLWH and 42 HC matched for sex and BMI Participants were recruited through advertisements and during in-hospital visits.
2.2 Eligibility and ethics
Participants were excluded with a history of any chronic disease diagnosis apart from HIV (as listed in the International Statistical Classification of Diseases and Related Health Problems 10th Revision (ICD-10, 2019) or the use of any medications besides ART. All PLWH were on ART form more than 1 year and virally suppressed. In addition, pregnant and lactating women, and participants who have suffered a previous illness or incident that permanently alters taste, for example, stroke, head trauma, lasting effects from COVID-19, were also excluded from the study. All procedures involving human participants were approved by the Mulungushi University Research Ethics Committee (reference number: SMHS-MU1-2022-10). Written informed consent was obtained from each participant before the data collection.
During testing, all participants completed the salt taste threshold and preference assessment, provided a saliva sample for genotyping, and completed a 24-h dietary recall providing information on salt eating habits.
2.3 Demographic data
Demographic data (age (years), sex (m/f/prefer not to say), and ethnicity) together with smoking habits and health status information were collected using a questionnaire.
2.4 Anthropometric measurements
Height (m) and weight (kg) were measured using a stadiometer and body mass index (BMI) were calculated using the equation kg/m2.
2.5 Blood pressure and pulse rate
Blood pressure (mmHg) and pulse rate was recorded using a certified automatic monitor (Omron HEM-7120; Omron Healthcare Co., Ltd., Kyoto, Japan) while participants sat upright, ensuring their backs rested against the chair and their feet were flat on the ground, with arms aligned to the level of the heart.
2.6 Taste threshold
Six concentrations of sodium chloride (0.0, 5.0, 15.0, 30.0, 60.0, 120.0 and 240.0 g/L) diluted with spring water were prepared on the day of testing. The solutions were presented to participants in increasing concentrations. Participants rinsed their mouth with water before tasting each solution and then swirled the test solutions in the mouth for approximately 10 s before exporating it. The recognition threshold, the concentration at which the respondent could distinguish the salty taste from water, and the preferred sample, the concentration the respondents chose as their favorite, were recorded, as per (Eriksson et al., 2019; Tapanee et al., 2021).
2.7 Taste preference and self-reported eating habit
Tomato soup was prepared by mixing spring water with tomato passata (Pastificio Riscossa, Corato, Italy; www.riscossa.it) in 1:1 ratio. Salt (NaCl) was added to manipulate the final salt concentrations of soup: 0.15%, 0.30%, 0.50%, 1%, 1.5% and 2% (w/w). The soups were presented to participants in increasing concentrations. Participants tasted each soup and rinsed their mouth with water between each sample. Saltiness and pleasantness of each of the soups was rated on a 100 mm visual analogue scale (VAS) ranging from “not at all salty” (0%) to extremely salty (100%) and “very unpleasant” (0%) to “very pleasant” (100%).
2.8 Single nucleotide polymorphism (SNP) genotyping
Genotyping was performed according to Pilic and Mavrommatis, (2018). Pre-designed TaqMan® SNP genotyping assays for: SCNN1B rs239345, TRPV1 rs8065080, rs4790522 and the StepOnePlus thermocycler (Applied Biosystems, CA, United States) were used. The primers and the probes were pre-designed by Applied Biosystems with the following codes (C___2387896_30, C__11679656_10, C___3269499_10). Call rates were higher than 95% and all SNPs were in Hardy Weinberg equilibrium (p > 0.05). SCNN1B rs239345 minor allele frequency (MAF) (A) was 42%, the TRPV1 rs8065080 (C) 8% and rs4790522 (C) 49%. rs8065080 was excluded from further analysis considering low MAF. SNPs were selected based on either a high know MAF in an African population or previous association with both salt taste and blood pressure in multicultural populations (Dias et al., 2013; Barragán et al., 2018; Chamoun et al., 2018; Pilic et al., 2020; Mohammadifard et al., 2023).
2.9 Dietary salt intake
Dietary salt intake was assessed with a 24-h dietary recall, based on the United States Department of Agriculture (USDA) 5-step multiple pass method and administered via an online platform (Jisc Online Survey; (Rhodes et al., 2013). The method includes a forgotten food list, and in addition to the typically forgotten foods such as tea, coffee, non-alcoholic and alcoholic beverages, sweets and snacks, high salt foodstuffs were also included, such as pickled vegetables, deli meats, smoked fish, cheese, bread and condiments. Participants were also asked to provide information about the quantity of the stock cubes or gravy granules, if used, while cooking. Discretionary salt use was assessed asking questions on adding salt while cooking and at the table, with participants providing the quantities of added salt. Participants were asked to provide food portion size by fist size (Gibson et al., 2016; Amoutzopoulos et al., 2020). Energy and nutrient intake were calculated using a nutritional analysis software (Nutritics, Nutritics LTD, Dublin, Ireland). Total sodium intake (non-discretionary and discretionary) was calculated as an average of sodium intake, expressed as both absolute and energy adjusted (mg sodium per 1,000 kcal).
2.10 Statistical analysis
Continuous variables are presented as mean ± standard deviation (SD) or median ± interquartile range (IQR) and were tested for normality with Shapiro-Wilk test. Categorical variables are presented as absolute (relative) frequencies, grouped by median value.
Differences in baseline characteristics by health status (PLWH vs. HC) were assessed using an independent-samples t-test (with Levene’s test for equality of variance), Mann Whitney U test or Fisher’s exact test, as appropriate. Individual ratings of saltiness (intensity) and pleasantness in soup (mm) were plotted and the area under the curve (AUC) calculated using GraphPad Prism (Version 10.4.1; GraphPad Software Inc.). Differences in AUC values were tested using the Independent T-test or Mann Whitney U as appropriate. AUC values for intensity and pleasantness, and intensity and pleasantness against salt intake (g/day) were plotted using Pearson’s correlation to assess correlations within PLWH and HC.
To assess thresholds and preferred concentration sample, considering there is no universal cut-off point to distinguish between the participants with low and high salt taste thresholds, the median was used as cut-offs. Participants with detection threshold <0.467 g/L and a preferred sample concentration of <3.74 g/L were considered to have low thresholds. Furthermore, to explore the effects of disease, two-way ANOVAs were used to test threshold and preferred concentration with AUC intensity and pleasantness by disease state.
To assess health variables, BMI, SBP, DBP, and pulse were assessed by disease state using the Independent T-Test or Mann Whitney U test as appropriate. Then, dietary salt intake was dichotomized by median (<8/≥8 g/d), and disease state and salt intake were assessed with health variables as outcomes. A two-way ANOVA was used throughout. The same approach was taken with threshold and preferred sample cut-offs.
Furthermore, to assess genetic variation, the following groupings were applied: TRPV1 rs4790522 AA and AC/CC genotypes, SCNN1B rs239345 TT and AT/AA genotypes, as per previous literature findings (Tapanee et al., 2021). Dietary salt intake (<8/≥8 g/d) were assessed by genotype frequency, using the Chi Squared test, and then the interaction of disease status was assessed by two-way ANOVA including genotype and disease state with dietary salt intake (g/d) as the outcome variable. The same approach was taken with threshold and preferred sample data.
Lastly, health variables, BMI, SBP, DBP, and pulse, were assessed by genotype grouping. Then, as exploratory and hypothesis generating analysis only, the impact of genotype and salt intake was assessed by health status with BMI, SBP, DBP, and pulse as outcome variables. Two-way ANOVA was used throughout.
All data were corrected for multiple testing, with main effect and pairwise comparison results presented throughout. All analysis were performed using GraphPad Prism (Version 10.4.1; GraphPad Software Inc.). All tests were two-tailed, with p < 0.05 considered statistically significant.
3 Results
3.1 Participant characteristics
A total of 37 PLWH (50% female), aged 46.9 ± 10.4 years, with a BMI of 22.7 ± 3.7 kg/m2, and 42 healthy controls (HC; 49% female), aged 31.2 ± 9.9 years, with a BMI of 24.5 ± 4.9 kg/m2 participated (Tables 1, 2). All PLWH (91.9%) in exception of three, were on integrase strand transfer inhibitor (INSTI)-based ART. Median (interquartile range (IQR) duration on ART for PLWH was 12 (7–15) years. Mean age differed between groups (p < 0.001; Table 1). There were no differences in sex (Table 1), BMI (Table6), or TRPV1 and SCNN1B genotype distribution between cohorts (p > 0.05; Table 1).
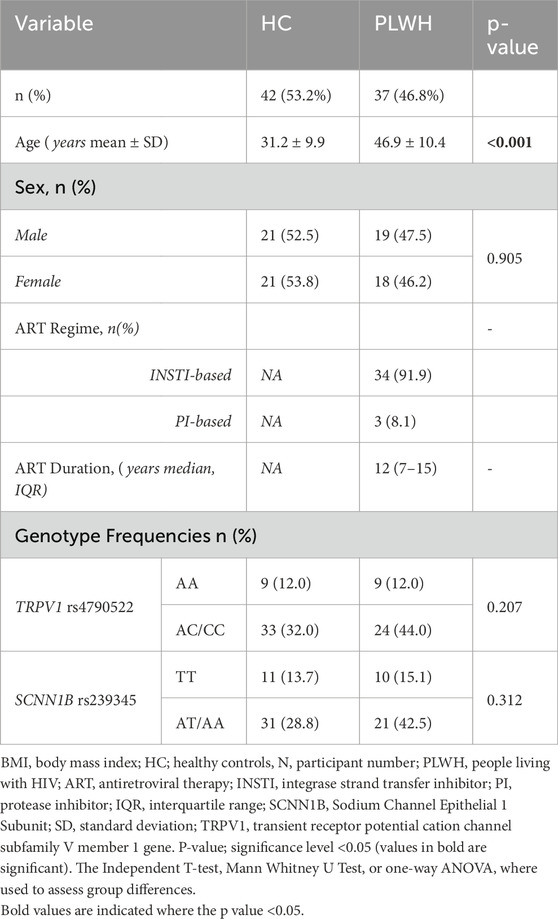
Table 1. Participant characteristics.
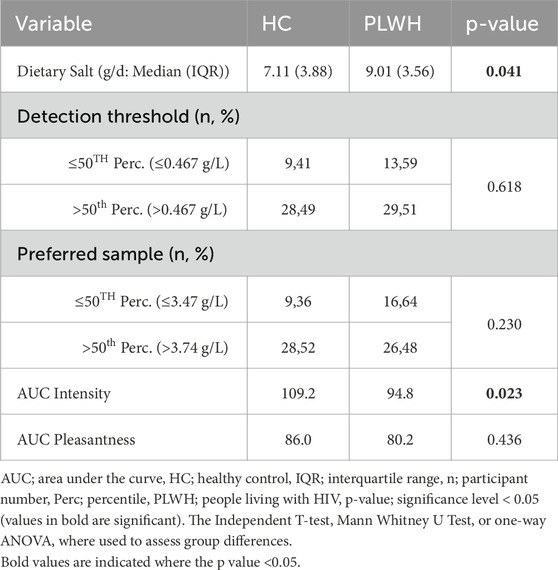
Table 2. Salt taste assessments in HC and PLWH.
3.2 Salt intake and salt taste
Dietary salt intake differed based on disease status, PLWH consumed more salt (9.01 (3.56) g/d) than PLWH (7.11 (3.88) g/L; p = 0.041; Table 2). Salt detection threshold and preferred threshold sample did not differ between groups (p > 0.05). For the intensity of salt perceived, AUC was higher in HC than PLWH (109.2 ± 26.7, 94.8 ± 28.4; p = 0.02; Figure 1). No difference was found regarding the pleasantness of salt (p > 0.05). Intensity and pleasantness were negatively correlated in HC (p = 0.013, r = −0.379), no difference was found in PLWH (p > 0.05; Figure 2).
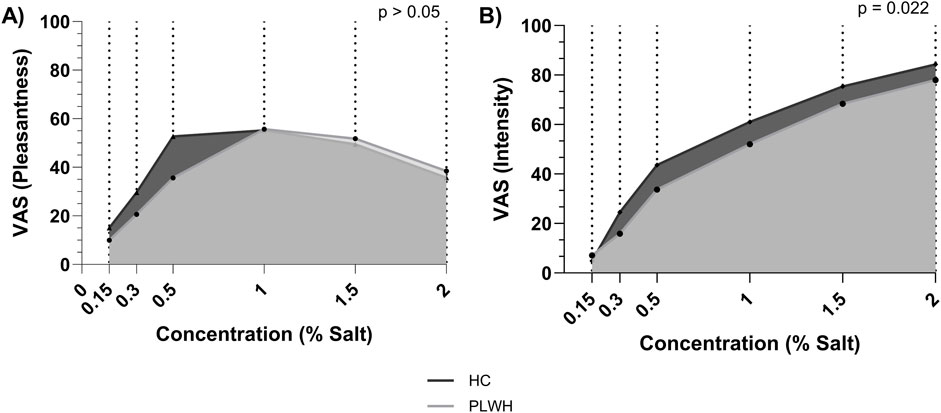
Figure 1. Area under the curve for (A) pleasantness and (B) intensity of salt threshold by concentration. HC; Healthy Control, PLWH; people living with HIV, VAS; visual analogue scale. P-value; significance level <0.05 (values in bold are significant). The Independent T-test was used to assess group differences.
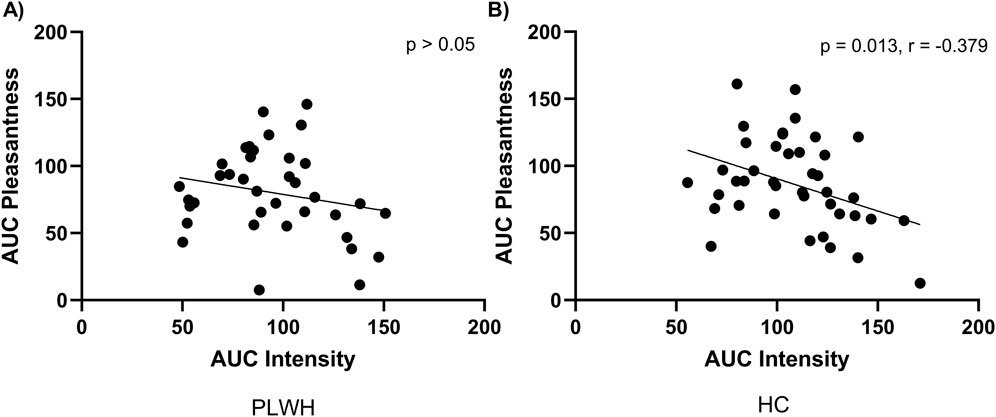
Figure 2. Area under the curve for pleasantness and intensity of salt within (A) PLWH and (B) HC. AUC; area under the curve, HC; Healthy Control, PLWH; people living with HIV. P-value; significance level <0.05 (values in bold are significant). Pearson’s correlation was used throughout.
Total salt intake did not differ based on threshold nor preferred sample within or between cohorts (p > 0.05: Table 3).
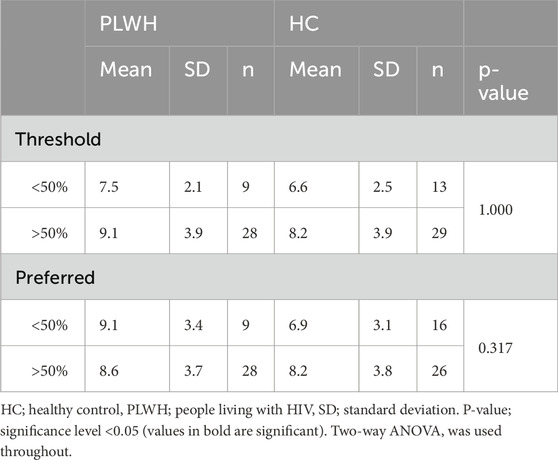
Table 3. Salt intake by threshold and preferred sample.
Total salt intake was not correlated with the AUC for intensity or pleasantness (p > 0.05; Figure 3).
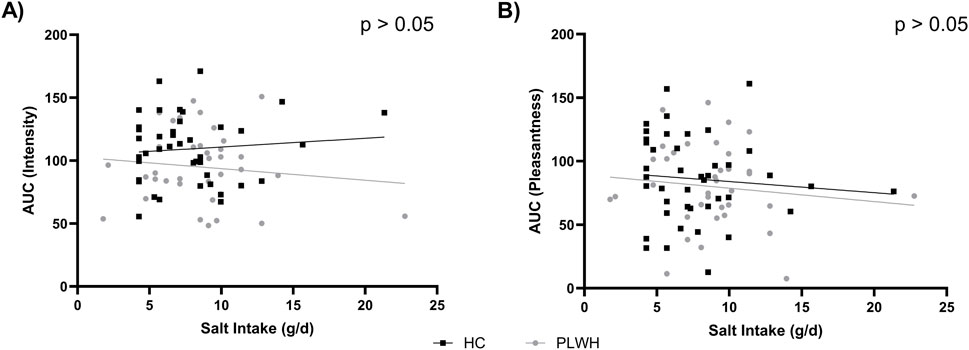
Figure 3. Salt intake by (A) intensity AUC and (B) pleasantness AUC in PLWH and HC. AUC; area under the curve, HC; Healthy Control, PLWH; people living with HIV. P-value; significance level <0.05 (only significant values shown). Pearson’s correlation was used throughout.
Disease status and threshold or preferred sample did not influence intensity of salt perceived (p > 0.05). However, pairwise comparisons revealed HCs with a low threshold (<50%) perceived a higher intensity (122.5 ± 25.6) than PLWH with a high threshold (94.9 ± 30.3; >50%; p = 0.016), and HCs with a low concentration of preferred sample (<50%) perceived a higher intensity (125.6 ± 17.0) than HC (99.2 ± 26.8) and PLWH (91.7 ± 27.5) with a high concentration (>50%) preferred sample (p = <0.001, 0.011 respectively; Table 4).
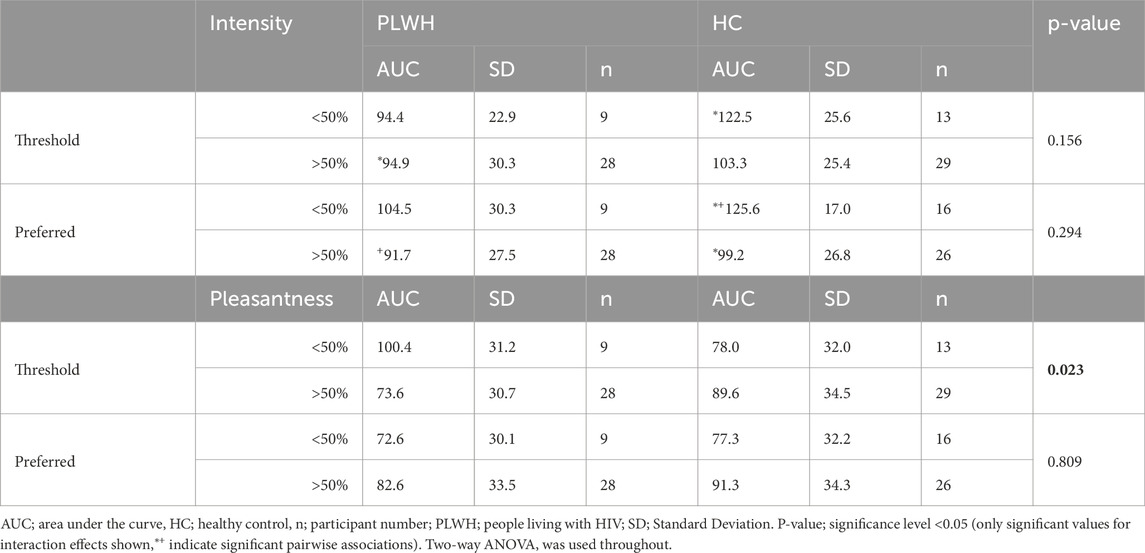
Table 4. Pleasantness and intensity by threshold and preferred sample concentration.
3.3 Genetics, health variables, salt taste and salt intake
There was an interaction between rs4790522 and health status on BMI (p = 0.005). Specifically, PLWH in the AA genotype group had a lower BMI (21.0 ± 3.9 kg/m2) when compared to HC in the AA genotype group (27.9 ± 4.9 kg/m2; p = 0.001; Table 5). Additionally, HC in the AA genotype group (27.9 ± 4.9 kg/m2) had a higher BMI than those in the AC/CC genotype group (23.6 ± 4.9 kg/m2; p = 0.010; Table 5).
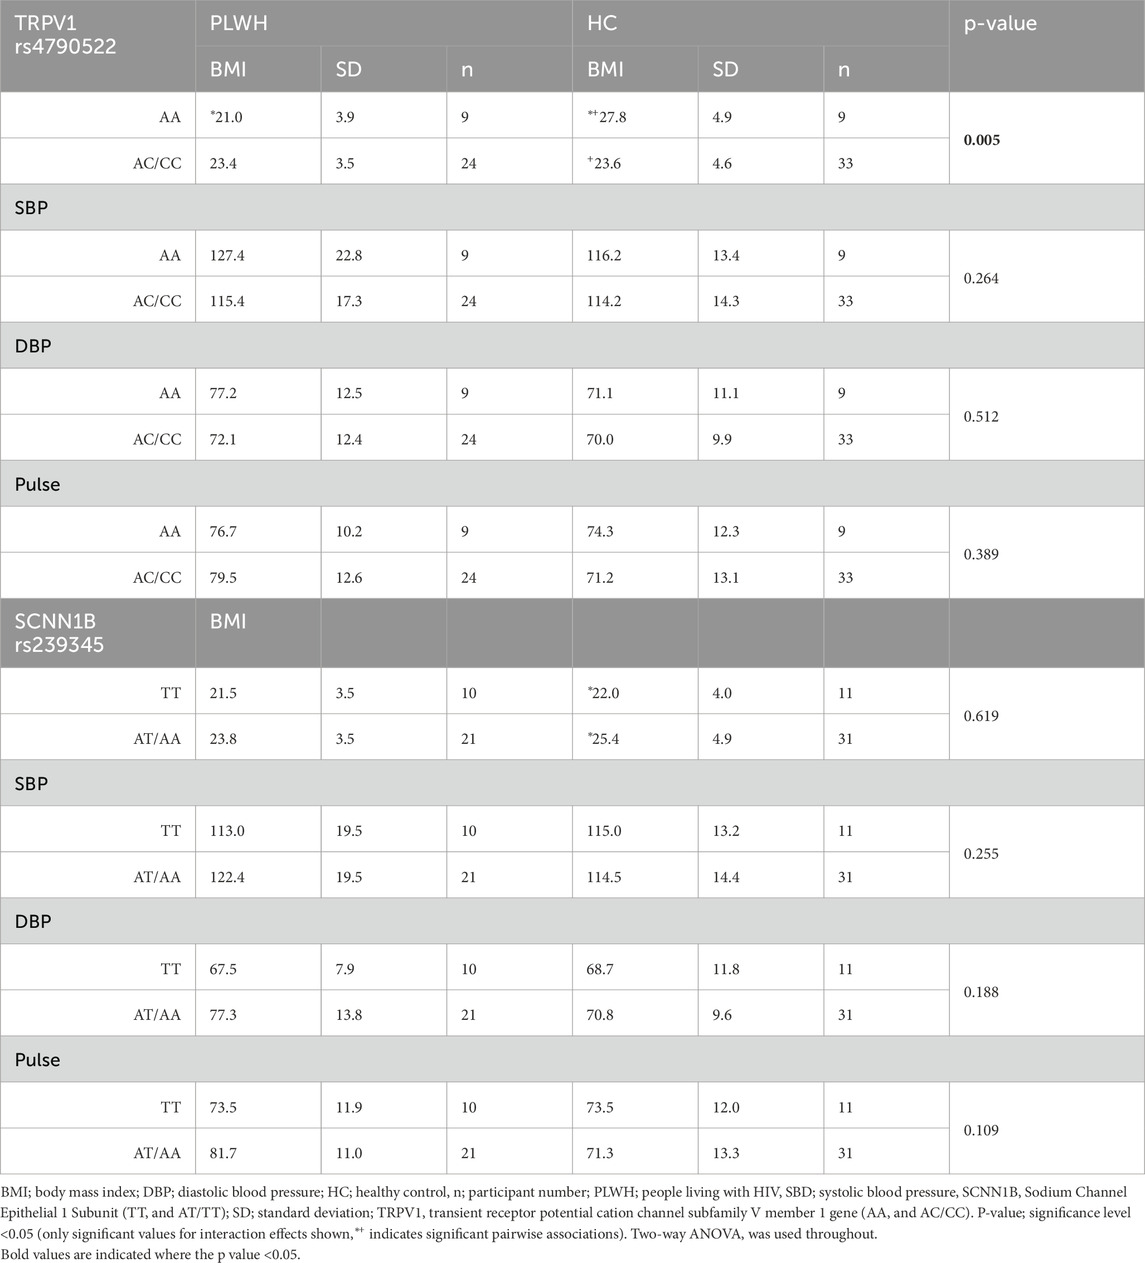
Table 5. BMI, SBP, DBP, and pulse by rs4790522 and rs239345 genotype, within and between PLWH and HC.
There was no interaction between rs239345 and health status on BMI (p > 0.05). However pairwise comparisons revealed, HC in the TT genotype group had a lower BMI (21.5 ± 3.5 kg/m2) than those in the AT/AA genotype group (23.8 ± 3.5 kg/m2; p = 0.025; Table 5).
There was no interaction between rs4790522 or rs239345 and health status on SBP, DBP, or pulse (p > 0.05; Table 5).
As exploratory and hypothesis generating analysis, genotype and salt intake (>/<8 g/d) were explored as influencers of health variables (Supplementary Table S1). There was an interaction between rs4790522 genotype, salt intake and BMI (p = 0.022), PLWH with the AA genotype who consumed less than 8 g/d salt had a lower BMI (18.2 ± 3.4 kg/m2) when compared to HC with the AA genotype who consumed less than 8 g/d salt (27.0 ± 5.6 kg/m2; p = 0.018) and HC with the AA genotype who consumed more than 8 g/d salt (23.4 ± 3.6 kg/m2; p = 0.009). No interaction was found between rs4790522 genotype, salt intake and SBP, DBP, or pulse (p > 0.05).
There was an interaction between rs239345, salt intake, and SBP (p = 0.037) and DBP (p = 0.031). PLWH with the AT/AA genotype who consumed less than 8 g/d salt had a higher SBP (142.0 ± 26.1 mmHg) and DBP (92.0 ± 7.0 mmHg) than almost all other groupings. Data shown in Supplementary Figure S1. No interaction was found between rs4790522 genotype, salt intake and BMI or pulse.
Further, BMI, SBP, and DBP did not differ between cohorts (p > 0.05). PLWH had a higher pulse rate than HC (p = 0.013; Table 6). Pairwise comparisons revealed that PLWH who consumed less than 8 g/d salt had a lower BMI (20.4 ± 3.0 kg/m2) than HC who consumed less than 8 g/d salt (24.3 ± 4.3 kg/m2; p = 0.009) and HC who consumed more than 8 g/d salt (24.3 ± 4.3 kg/m2; p 0.006).
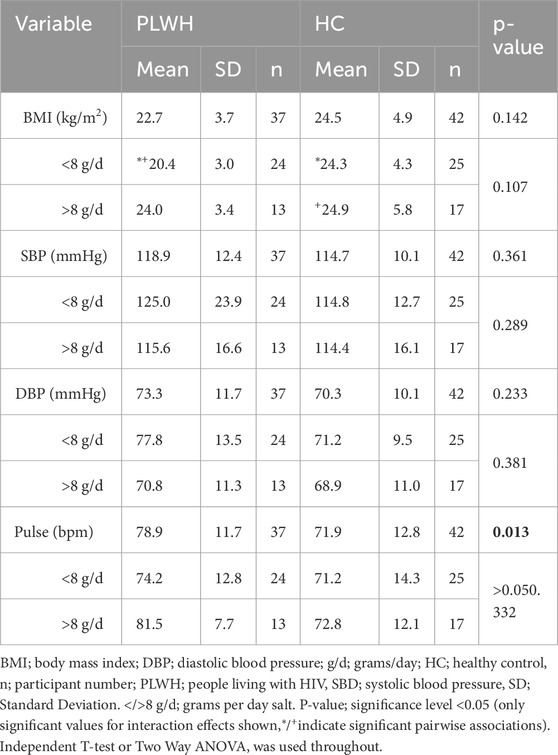
Table 6. BMI, SBP, DBP, and pulse rate between PLWH and HC, and by median salt intake.
BMI, SBP, DBP, and Pulse did not differ based on salt threshold, and there was no interaction between disease status and threshold on health variables. Disease status and preferred sample influenced SBP and DBP (p = 0.025, 0.046, respectively), however pairwise comparisons were not significant but revealed PLWH with low preferred sample concentration (<50%) had a higher pulse rate (83.8 ± 13.4) than HC with a high preferred sample concentration (>50%; 68.9 ± 14.3; 0.010; Table 7).
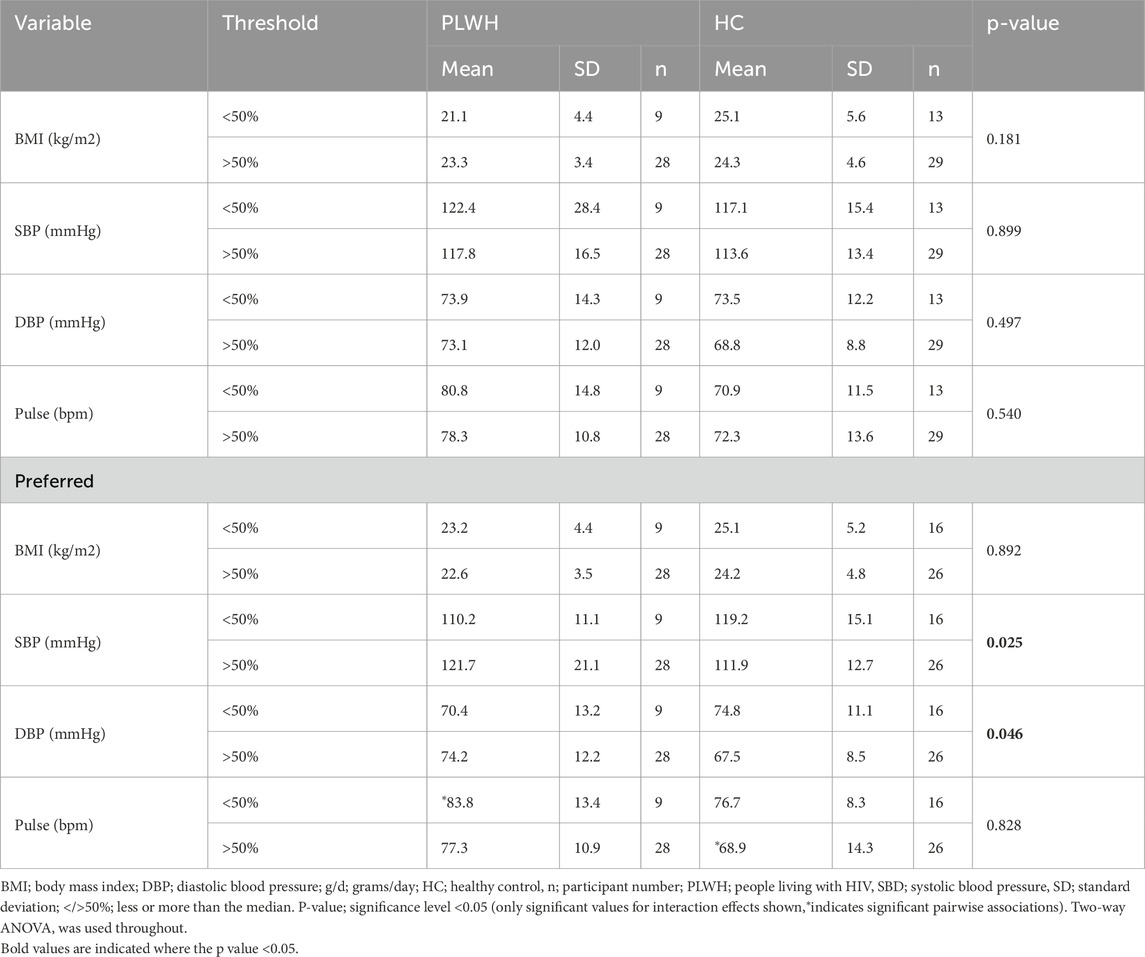
Table 7. BMI, SBP, DBP, and pulse rate between PLWH and HC, and by threshold and preferred sample concentration.
No interaction was found between rs4790522 or rs239345 and health status on salt intake (g/d, p > 0.05; Supplementary Table S2).
When the distribution of participants within salt intake groups (>/<8 g/d) was assessed, more PLWH (40%) with the AC/CC genotype consumed >8 g salt/day, when compared to those who consumed <8 g salt/day (10%; Figure 4). No significance was found in HC, and salt intake did not differ based on rs239345 genotype in PLWH nor HC.
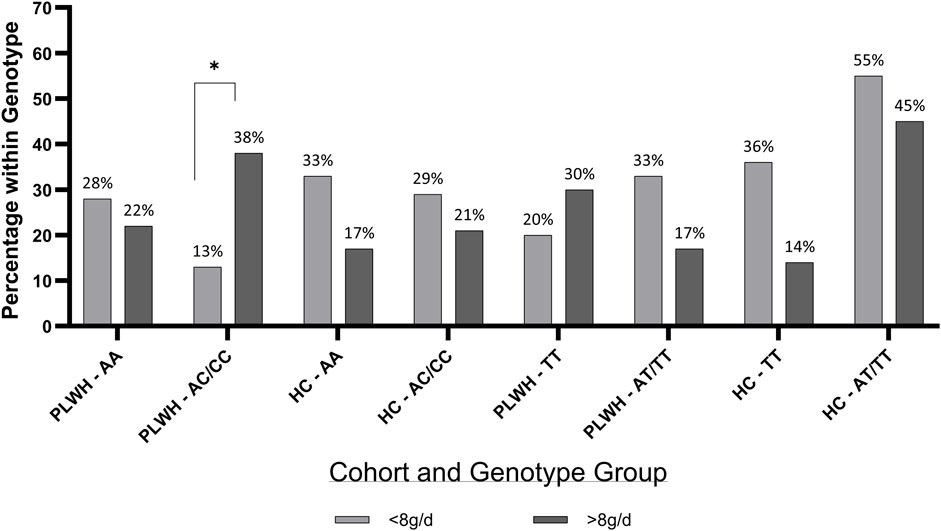
Figure 4. Percentage of PLWH and HC in TRPV1 rs4790522 and SCNN1B rs239345 within genotype groups by salt intake. g/d; grams/day; HC; Healthy Control, PLWH; people living with HIV, SCNN1B, Sodium Channel Epithelial 1 Subunit (TT and AT/TT); TRPV1, transient receptor potential cation channel subfamily V member 1 gene (AA and AC/CC). P-value; significance level <0.05. Chi Squared test was used throughout.
More PLWH and HC with a high (>50% concentration) threshold had the rs4790522 AC/CC genotype (61%, p < 0.001; 70%, p = 0.014, respectively; Supplementary Figure S2A), however this was also true for the HC AA genotype group (18%, p = 0.014). More PLWH and HC with a high (>50%) preferred sample concentration had the rs4790522 AC/CC genotype (51%, p < 0.001; 48%, p = 0.024, respectively), and the SCNN1B rs239345 genotype (45%, p = 0.026; 43%, p = 0.026, respectively; Supplementary Figure S2B).
Neither AUC for intensity or pleasantness differed based on rs4790522 nor rs239345 in PLWH and HC (p > 0.05; Supplementary Table S3).
3.4 Discussion
This study investigated the differences between salt intake and salt taste perception and the interplay between genetic variations in salt taste receptors (SCNN1B rs239345 and TRPV1 rs4790522) with salt taste perception, dietary salt intake, and cardiovascular health parameters in Zambian adults, with a focus on PLWH. The key findings reveal that PLWH consumed significantly more salt than HC (9.01 vs. 7.11 g/day) and exhibited reduced salt intensity perception (AUC: 94.8 vs. 109.2). Genetic analyses highlighted that PLWH carrying the TRPV1 rs4790522 AC/CC genotype had higher salt intake (9.4 vs. 7.3 g/day) than HC, and the TRPV1 rs4790522 SNP was associated with BMI, suggesting a gene-environment-disease interaction, suggesting a potential gene-environment-disease interaction. Our results present novel findings in an understudied cohort and thus warrant further investigation.
3.4.1 Elevated salt intake and impaired salt perception in PLWH
The observed higher salt intake in PLWH aligns with prior literature related to taste dysfunction (Fasunla et al., 2016; Prakash et al., 2024). Reduced intensity perception may drive compensatory salt use, exacerbating hypertension risk, a critical concern given the high CVD burden in SSA (Minja et al., 2022). However, a direct correlation between salt intake and taste thresholds was not found in this study. Literature in this area is heterogenous with some reporting an association (Sari et al., 2022) whilst others, alike this study, reporting no association (Tan et al., 2021). This suggests multifactorial influences, including cultural dietary practices or socioeconomic factors not captured here. Additionally, a higher salt intake in PLWH may be due to HIV-associated neuropathies, recurrent infections, ART effects, or the increased age of the PLWH cohort compared to the HC (Fasunla et al., 2017; Barragán et al., 2018; Masenga et al., 2019). Taste perception has been reported to decline with age, across a range of concentrations (Barragán et al., 2018) regarding salt, whether this is associated with dietary intake and aging is disputed (Tepper, 2008; Liem and Russell, 2019). Some have demonstrated that aging is associated with a declined taste sensitivity and, subsequently, diet quality (Jeon et al., 2021). However, this literature generally refers to adults over 65 years and therefore cannot be directly compared to the current findings. Therefore, further research on larger aged-balanced cohorts is required to comprehensively determine the drivers of salt intake in PLWH.
Moreover, although taste has been stated as indicative of dietary intake (Tan et al., 2021), many aspects of taste contribute to flavour (IQWiG, 2023). This study aimed to assess salt taste intensity and pleasantness as a driver of salt intake, which has been demonstrated in previous literature (Pilic et al., 2020), however flavour is a complex interplay and further research should consider assessment of all the six researched tastes (Besnard et al., 2016; IQWiG, 2023) and examine all aspects of taste perception, including identification, threshold, and discrimination testing, alongside taste liking (Technical Committee, 2011; Liem and Russell, 2019).
3.4.2 Genetic susceptibility and salt intake and salt perception
The TRPV1 rs4790522 AC/CC genotype demonstrated a higher frequency in those with a higher salt intake in PLWH, representing a novel finding. Similarly, Chamoun et al. (2018) reported that the C allele was associated with a significantly higher salt preference in preschool children of the Guelph region, Canada, compared to the A allele. In keeping, Tapanee et al. (2021) found that adults with hypertension carrying the AA genotype exhibited a higher salt recognition threshold, which as discussed previously, may be indicative of a higher dietary intake. However, this current study found no association with rs4790522 salt intensity or pleasantness. Given the variation in age and ethnicity across these cohorts, direct comparison is unsuitable. Further investigation of rs4790522 in relation to salt intake, preference, and perception is warranted within more demographically and clinically homogeneous population, particularly because the minor allele (A) frequency (MAF) is approximately 10% higher in African cohorts than in Caucasians (Auton et al., 2015), therefore if negative dietary implications are apparent then importance of this research is heightened.
No associations between SCNN1B rs239345 and salt intake or perception were identified in this study. This contrasts with findings from Caucasian cohorts; for example, Barragán et al. (2018) reported that the AA genotype was associated with heightened salt intensity perception in Europeans, whereas Dias et al. (2013) found that, in a Canadian cohort, AA carriers perceived salt less intensely than those with the T allele. This inconsistency highlights the need for further population-specific genetic research, particularly because the MAF is also higher in African cohorts (Auton et al., 2015). Overall, such research has the potential to contribute to personalized nutrition (PN) practices. PN is a leading method for dietary change and improved health (Hinojosa-Nogueira et al., 2024), however, related research is predominantly from westernised, affluent societies (Otterbring and Folwarczny, 2024). PN, incorporating genetics, runs the risk of remaining an inaccessible, expensive method of prevention and treatment (Mathers, 2019). Therefore, exploring phenotypes that are predictive of genetic predispositions offers a more accessible approach. For example, prediction of genetic predisposition has been previously demonstrated regarding bitter taste ability (Aoki et al., 2023), but to date, not in other taste modalities.
3.4.3 Health markers of hypertension risk
Notably, PLWH carrying the rs4790522 AA genotype exhibited lower BMIs than HC (21.0 vs. 27.9 kg/m2, p = 0.001), this finding is supportive that a higher perceived intensity may result in a lower dietary consumption of salt (Hayes et al., 2010). However, this finding is not consistent with recent literature, for example, systematic review by Tan et al. (2021) that reports salt sensitivity and intensity did not relate to dietary intake but dietary intake was better predicted by salt taste hedonic ratings. Additionally, a lower BMI in PLWH may reflect HIV-related metabolic dysregulation or ART effects (Masenga et al., 2019). Without research carried out in larger cohorts, powered for genetic and BMI groupings these findings should be considered hypothesis generating only.
Lastly, while overall BP did not differ between groups, PLWH with the SCNN1B rs239345 AT/AA genotype and high salt intake had elevated SBP/DBP (142.0/92.0 mmHg), suggesting a genetic predisposition to salt-sensitive hypertension. This aligns with evidence that ENaC variants modulate renal sodium handling and BP (Tapanee et al., 2021). The higher pulse rate in PLWH (78.9 vs. 71.9 bpm, p = 0.013) further signals cardiovascular strain, warranting longitudinal monitoring.
3.4.4 Limitations and strengths
This study presents novel findings in an under-researched population; however, it is not without limitations. Most notably, this study is limited by sample size (n = 79), reducing statistical power for genetic associations. Additionally, the age disparity between PLWH (older) and HC may confound outcomes related to differences in taste, due to taste sensitivity often declining with age (Barragán et al., 2018). This does not deter from any genetic related conclusions, however, results reported must be considered hypothesis-generating only, supporting future research in sub-Saharan African populations, particularly among PLHW and/or hypertension. Further, dietary intake was self-reported, which is inherently prone to error (National Research Council, 1986; Amoutzopoulos et al., 2020). Although a 5-step multiple pass dietary recall method was used, with reported accuracy within 10% of actual intake (Conway et al., 2003), day-to-day variability and systematic bias remain potential sources of error (National Research Council, 1986). Finally, cross-sectional design limits causal inferences, thus, the long-term implications of taste perception and salt intake require further investigation. Despite these limitations, the novel integration of genetic, sensory, and clinical data in an understudied population represents a substantial strength and provides a foundation for targeted, population-specific interventions.
3.4.5 Public health relevance
In a region grappling with dual burdens of HIV and CVD, addressing modifiable risk factors like salt intake through genetic and sensory profiling could mitigate morbidity. Policy initiatives promoting low-salt diets and routine taste assessments in PLWH clinics may enhance health outcomes in this vulnerable population.
3.5 Conclusion
Overall, this work demonstrates that within this cohort, PLWH consume more salt than HC, which may be driven by a reduced salt perception. Differences were found in the association between the TRPV1 rs4790522 SNP, salt intake and BMI profiles, between PLWH and HC, suggesting a gene-environment-disease interaction. These findings highlight the need for further research in SSA, which should employ larger cohorts, longitudinal designs, and objective sodium biomarkers (e.g., 24-h urine) to clarify causal pathways. Such design would allow a wider assessment of polygenic influencers of salt taste perception and cardiovascular health. Further, when investigating PLWH, ART-specific effects on taste and metabolism should be explored. Taken together, such research could influence salt-reduction strategies tailored to PLWH, particularly those with genetic risk variants.
Data availability statement
The raw data supporting the conclusions of this article will be made available by the authors, without undue reservation.
Ethics statement
The studies involving humans were approved by Mulungushi University Research Ethics Committee (reference number: SMHS-MU1-2022-10). The studies were conducted in accordance with the local legislation and institutional requirements. The participants provided their written informed consent to participate in this study.
Author contributions
SM: Supervision, Data curation, Methodology, Investigation, Software, Validation, Conceptualization, Writing – review and editing, Formal Analysis, Resources, Visualization, Writing – original draft, Project administration, Funding acquisition. C-MG: Validation, Writing – review and editing, Formal Analysis, Writing – original draft, Data curation, Visualization. JN: Writing – original draft, Writing – review and editing, Formal Analysis. JP: Writing – original draft, Visualization, Writing – review and editing, Validation, Formal Analysis. AK: Writing – original draft, Writing – review and editing, Funding acquisition. LP: Conceptualization, Writing – review and editing, Data curation, Writing – original draft, Formal Analysis, Validation, Visualization.
Funding
The author(s) declare that financial support was received for the research and/or publication of this article. This work was supported by St Mary’s University, Twickenham, London, the Fogarty International Center and National Institute of Diabetes and Digestive and Kidney Diseases of the National Institutes of Health grants R21TW012635 (SKM and AK) and R01HL147818 and R01HL144941 (AK) and the American Heart Association Award Number 24IVPHA1297559.
Conflict of interest
Author LP was employed by Optimyse Nutrition Ltd.
The remaining authors declare that the research was conducted in the absence of any commercial or financial relationships that could be construed as a potential conflict of interest.
Generative AI statement
The author(s) declare that no Generative AI was used in the creation of this manuscript.
Any alternative text (alt text) provided alongside figures in this article has been generated by Frontiers with the support of artificial intelligence and reasonable efforts have been made to ensure accuracy, including review by the authors wherever possible. If you identify any issues, please contact us.
Publisher’s note
All claims expressed in this article are solely those of the authors and do not necessarily represent those of their affiliated organizations, or those of the publisher, the editors and the reviewers. Any product that may be evaluated in this article, or claim that may be made by its manufacturer, is not guaranteed or endorsed by the publisher.
Supplementary material
The Supplementary Material for this article can be found online at: https://www.frontiersin.org/articles/10.3389/fphys.2025.1616785/full#supplementary-material
References
Amoutzopoulos B., Page P., Roberts C., Roe M., Cade J., Steer T., et al. (2020). Portion size estimation in dietary assessment: a systematic review of existing tools, their strengths and limitations. Nutr. Rev. 78, 885–900. doi:10.1093/nutrit/nuz107
Aoki K., Mori K., Iijima S., Sakon M., Matsuura N., Kobayashi T., et al. (2023). Association between genetic variation in the TAS2R38 bitter taste receptor and propylthiouracil bitter taste thresholds among adults living in Japan using the modified 2AFC procedure with the quest method. Nutrients 15, 2415. doi:10.3390/nu15102415
Auton A., Abecasis G. R., Altshuler D. M., Durbin R. M., Abecasis G. R., Bentley D. R., et al. (2015). A global reference for human genetic variation. Nature 526, 68–74. doi:10.1038/nature15393
Azinge E. C., Sofola O. A., Silva B. O. (2011). Relationship between salt intake, salt-taste threshold and blood pressure in Nigerians. West Afr. J. Med. 30, 373–376.
Barragán R., Coltell O., Portolés O., Asensio E., Sorlí J., Ortega-Azorín C., et al. (2018). Bitter, sweet, salty, sour and umami taste perception decreases with age: sex-specific analysis, modulation by genetic variants and taste-preference associations in 18 to 80 Year-old subjects. Nutrients 10, 1539. doi:10.3390/nu10101539
Besnard P., Passilly-Degrace P., Khan N. A. (2016). Taste of fat: a Sixth taste modality? Physiol. Rev. 96, 151–176. doi:10.1152/physrev.00002.2015
Chamoun E., Hutchinson J. M., Krystia O., Mirotta J. A., Mutch D. M., Buchholz A. C., et al. (2018). Single nucleotide polymorphisms in taste receptor genes are associated with snacking patterns of preschool-aged children in the Guelph family health study: a pilot study. NUTRIENTS 10, 153. doi:10.3390/nu10020153
Conway J. M., Ingwersen L. A., Vinyard B. T., Moshfegh A. J. (2003). Effectiveness of the US Department of Agriculture 5-step multiple-pass method in assessing food intake in obese and nonobese women. Am. J. Clin. Nutr. 77, 1171–1178. doi:10.1093/ajcn/77.5.1171
Dias A. G., Rousseau D., Duizer L., Cockburn M., Chiu W., Nielsen D., et al. (2013). Genetic variation in putative salt taste receptors and salt taste perception in humans. Chem. Senses 38, 137–145. doi:10.1093/chemse/bjs090
DiNicolantonio J. J., Mehta V., O’Keefe J. H. (2017). Is salt a culprit or an innocent bystander in hypertension? A hypothesis challenging the ancient paradigm. Am. J. Med. 130, 893–899. doi:10.1016/j.amjmed.2017.03.011
Eriksson L., Esberg A., Haworth S., Holgerson P. L., Johansson I. (2019). Allelic variation in taste genes is associated with taste and diet preferences and dental caries. Nutrients 11, 1491. doi:10.3390/nu11071491
Fasunla A. J., Daniel A., Nwankwo U., Kuti K. M., Nwaorgu O. G., Akinyinka O. O. (2016). Evaluation of olfactory and gustatory function of HIV infected women. AIDS Res. Treat. 2016, 2045383. doi:10.1155/2016/2045383
Fasunla A. J., Nwankwo U., Adebayo A. M., Nwaorgu O. G. (2017). Association between sex, CD4 cell counts, antiretroviral medications, and olfactory and gustatory functions of HIV-infected adults. Otolaryngology–Head Neck Surg. 158, 90–99. doi:10.1177/0194599817733664
Gibson A. A., Hsu M. S. H., Rangan A. M., Seimon R. V., Lee C. M. Y., Das A., et al. (2016). Accuracy of hands v. household measures as portion size estimation aids. J. Nutr. Sci. 5, e29. doi:10.1017/jns.2016.22
Graham C. S., Graham B. G., Bartlett J. A., Heald A. E., Schiffman S. S. (1995). Taste and smell losses in HIV infected patients. Physiol. Behav. 58, 287–293. doi:10.1016/0031-9384(95)00049-o
Grillo A., Salvi L., Coruzzi P., Salvi P., Parati G. (2019). Sodium intake and hypertension. Nutrients 11, 1970. doi:10.3390/nu11091970
Hayes J. E., Sullivan B. S., Duffy V. B. (2010). Explaining variability in sodium intake through oral sensory phenotype, salt sensation and liking. Physiol. Behav. 100, 369–380. doi:10.1016/j.physbeh.2010.03.017
Hinojosa-Nogueira D., Subiri-Verdugo A., Díaz-Perdigones C. M., Rodríguez-Muñoz A., Vilches-Pérez A., Mela V., et al. (2024). Precision or personalized nutrition: a bibliometric analysis. Nutrients 16, 2922. doi:10.3390/nu16172922
ICD-10 (2019). ICD-10. Available online at: https://icd.who.int/browse10/2019/en (Accessed July 29, 2025).
IQWiG (2023). In brief: how does our sense of taste work? Institute for Quality and Efficiency in Health Care (IQWiG).
Jeon S., Kim Y., Min S., Song M., Son S., Lee S. (2021). Taste sensitivity of elderly people is associated with quality of life and inadequate dietary intake. Nutrients 13, 1693. doi:10.3390/nu13051693
Liem D. G., Russell C. G. (2019). The influence of taste liking on the consumption of nutrient rich and nutrient poor foods. Front. Nutr. 6, 174. doi:10.3389/fnut.2019.00174
Masenga S. K., Hamooya B. M., Nzala S., Kwenda G., Heimburger D. C., Mutale W., et al. (2019). Patho-immune mechanisms of hypertension in HIV: a systematic and thematic review. Curr. Hypertens. Rep. 21, 56. doi:10.1007/s11906-019-0956-5
Mathers J. C. (2019). Paving the way to better population health through personalised nutrition. EFSA J. 17, e170713. doi:10.2903/j.efsa.2019.e170713
Minja N. W., Nakagaayi D., Aliku T., Zhang W., Ssinabulya I., Nabaale J., et al. (2022). Cardiovascular diseases in Africa in the twenty-first century: gaps and priorities going forward. Front. Cardiovasc Med. 9, 1008335. doi:10.3389/fcvm.2022.1008335
Mohammadifard N., Moazeni F., Azizian-Farsani F., Gharipour M., Khosravi E., Sadeghian L., et al. (2023). Genetic variation in salt taste receptors impact salt intake and blood pressure. Sci. Rep. 13, 4037. doi:10.1038/s41598-022-23827-0
Moyo E., Moyo P., Murewanhema G., Mhango M., Chitungo I., Dzinamarira T. (2023). Key populations and Sub-Saharan Africa’s HIV response. Front. Public Health 11, 1079990. doi:10.3389/fpubh.2023.1079990
National Research Council (1986). “Errors in nutrient intake measurement,” in Nutrient adequacy: assessment using food consumption surveys (Washington: National Academies Press US).
Otterbring T., Folwarczny M. (2024). From WEIRD to worldwide: auditing authors’ affiliation countries over time across three leading journals publishing food-related research. Food Qual. Prefer. 117, 105175. doi:10.1016/j.foodqual.2024.105175
Oyebode O., Oti S., Chen Y.-F., Lilford R. J. (2016). Salt intakes in sub-Saharan Africa: a systematic review and meta-regression. Popul. Health Metr. 14, 1. doi:10.1186/s12963-015-0068-7
Pangmekeh P. J., Awolu M. M., Gustave S., Gladys T., Cumber S. N. (2019). Association between highly active antiretroviral therapy (HAART) and hypertension in persons living with HIV/AIDS at the Bamenda regional hospital, Cameroon. Pan Afr. Med. J. 33, 87. doi:10.11604/pamj.2019.33.87.15574
Pilic L., Mavrommatis Y. (2018). Genetic predisposition to salt-sensitive normotension and its effects on salt taste perception and intake. Br. J. Nutr. 120, 721–731. doi:10.1017/S0007114518002027
Pilic L., Lubasinski N. J., Berk M., Ward D., Graham C. A.-M., Da Silva Anastacio V., et al. (2020). The associations between genetics, salt taste perception and salt intake in young adults. Food Qual. Prefer. 84, 103954. doi:10.1016/j.foodqual.2020.103954
Prakash P., Swami Vetha B. S., Chakraborty R., Wenegieme T.-Y., Masenga S. K., Muthian G., et al. (2024). HIV-associated hypertension: risks, mechanisms, and knowledge gaps. Circulation Res. 134, e150–e175. doi:10.1161/CIRCRESAHA.124.323979
Rhodes D. G., Murayi T., Clemens J. C., Baer D. J., Sebastian R. S., Moshfegh A. J. (2013). The USDA Automated Multiple-Pass Method accurately assesses population sodium intakes. Am. J. Clin. Nutr. 97, 958–964. doi:10.3945/ajcn.112.044982
Rhyu M.-R., Ozdener M. H., Lyall V. (2024). Differential effect of TRPV1 modulators on neural and behavioral responses to taste stimuli. Nutrients 16, 3858. doi:10.3390/nu16223858
Sari A. N., Farapti F., Nor N. M. (2022). Salt taste threshold as A detection of salt intake in hypertensive individuals. J. Berk. Epidemiol. 10, 227–236. doi:10.20473/jbe.V10I32022.227-236
Shumba C., Mtaja A., Saylor D. (2024). Developing systems for cardiac and stroke care in Zambia. J. Am. Heart Assoc. 13, e030151. doi:10.1161/JAHA.123.030151
Tan S.-Y., Sotirelis E., Bojeh R., Maan I., Medalle M., Chik X. S. F., et al. (2021). Is dietary intake associated with salt taste function and perception in adults? A systematic review. Food Qual. Prefer. 92, 104174. doi:10.1016/j.foodqual.2021.104174
Tapanee P., Tidwell D. K., Schilling M. W., Peterson D. G., Tolar-Peterson T. (2021). Genetic variation in taste receptor genes (SCNN1B, TRPV1) and its correlation with the perception of saltiness in normotensive and hypertensive adults. Int. J. Hypertens. 2021, 5559831. doi:10.1155/2021/5559831
Technical Committee (2011). ISO 3972:2011 Sensory analysis — Methodology — method of investigating sensitivity of taste. Available online at: https://www.iso.org/standard/50110.html (Accessed July 4, 2025).
Tepper B. J. (2008). Nutritional implications of genetic taste variation: the role of PROP sensitivity and other taste phenotypes. Annu. Rev. Nutr. 28, 367–388. doi:10.1146/annurev.nutr.28.061807.155458
Verma N., Patil R., Khanna V., Singh V., Tripathi A. (2017). Evaluation of salivary flow rate and gustatory function in HIV-positive patients with or without highly active antiretroviral therapy. Eur. J. Dent. 11, 226–231. doi:10.4103/ejd.ejd_289_16
Vignini A., Borroni F., Sabbatinelli J., Pugnaloni S., Alia S., Taus M., et al. (2019). General decrease of taste sensitivity is related to increase of BMI: a simple method to monitor eating behavior. Dis. Markers 2019, 2978026. doi:10.1155/2019/2978026
Keywords: SCNN1B rs239345, TRPV1 rs4790522, HIV, dietary salt, blood pressure, Zambia, cardiovascular health
Citation: Masenga SK, Graham CA-M, Nixon J, Povia JP, Kirabo A and Pilic L (2025) Salt taste perception, dietary salt intake, cardiovascular health and genetic variation in Zambian adults with HIV. Front. Physiol. 16:1616785. doi: 10.3389/fphys.2025.1616785
Received: 23 April 2025; Accepted: 26 September 2025;
Published: 14 October 2025.
Edited by:
Geoffrey A. Head, Baker Heart and Diabetes Institute, AustraliaReviewed by:
Simone Crouch, University of the Witwatersrand, South AfricaStanley Zimba, University of Zambia, Zambia
Copyright © 2025 Masenga, Graham, Nixon, Povia, Kirabo and Pilic. This is an open-access article distributed under the terms of the Creative Commons Attribution License (CC BY). The use, distribution or reproduction in other forums is permitted, provided the original author(s) and the copyright owner(s) are credited and that the original publication in this journal is cited, in accordance with accepted academic practice. No use, distribution or reproduction is permitted which does not comply with these terms.
*Correspondence: Sepiso K. Masenga, c2VwaXNvbWFzZW5nYUBnbWFpbC5jb20= Catherine A.-M. Graham, Y2F0Lm1haGVyQGxsdWkub3Jn Annet Kirabo, YW5uZXQua2lyYWJvQHZ1bWMub3Jn
†These authors have contributed equally to this work and share first authorship