 Yunfeng Chen1*†
 Xiaodie Xu1†Zhigui Huang2Xiuting Lai1
 Chuzhao Li3Jingyi Chen4Weijing Wu1
 Kavimbi Chipusu5
 Yiming Zeng1*
- 1Department of Pulmonary Medicine, Fujian Provincial Clinical Research Center of Interventional Respirology, Fujian Key Laboratory of Lung Stem Cells, Key Laboratory of Sleep Medicine, The Second Affiliated Hospital of Fujian Medical University, Quanzhou, Fujian, China
- 2Department of Pulmonary Medicine, Affiliated Hospital of Putian University, Putian, China
- 3Department of Pulmonary Medicine, Fujian Medical University Union Hospital, Fuzhou, China
- 4Clinical Medical College, Fujian medical universty, Fuzhou, China
- 5Department of Mechanical Engineering, Division of Biomedical Engineering University of Saskatchewan, Saskatoon, SK, Canada
Background: Pneumocystis jirovecii pneumonia (PJP) is a serious form of pneumonia characterized by non-specific symptoms. Diagnosis is challenging due to overlapping clinical and laboratory features with bacterial pneumonia (BP). This study aimed to develop a diagnostic prediction model integrating digital chest CT analysis with clinical and laboratory parameters to enable early identification of PJP.
Methods: A retrospective analysis was performed on patients with confirmed PJP or BP at two medical centers between May 2020 and June 2024. Patient history, clinical symptoms, and laboratory test results were compared between cohorts. Chest CT images were analyzed using AI-assisted tools. Predictive factors were identified through univariate and multivariate logistic regression analyses, and a diagnostic nomogram was constructed. External validation was conducted using an independent cohort.
Results: Multivariate analysis identified previous immunomodulator use, procalcitonin levels, inflammatory lesion volume/total lung volume, whole lung −700 to −450 HU pneumonia lesion volume, and whole lung −450 to −300 HU pneumonia lesion volume as independent predictors of PJP. The constructed nomogram achieved AUCs of 0.898 and 0.820 in the training and validation cohorts, respectively, with sensitivity of 74.5% and specificity of 90.4% in the training cohort, and sensitivity of 73.5% and specificity of 79.4% in the validation cohort. Calibration curves and decision curve analyses confirmed the model’s predictive accuracy and clinical utility.
Conclusion: The model provides a valuable tool for differentiating PJP from BP, demonstrating that AI-assisted recognition of chest CT images can effectively support pathogen identification. Its application has the potential to improve early diagnosis of PJP and enhance patient outcomes.
1 Introduction
Pneumonia remains a leading cause of morbidity and mortality worldwide, particularly among hospitalized patients. PJP and BP represent two clinically important subtypes that require accurate differentiation to guide appropriate treatment (Berenji et al., 2025). PJP primarily affects immunocompromised individuals, whereas BP is more common and associated with a wide range of pathogens (Shoar and Musher, 2020; Yin et al., 2021). Despite advances in diagnostic techniques, distinguishing PJP from BP continues to pose significant challenges, as current guidelines for community-acquired pneumonia (CAP) and hospital-acquired pneumonia (HAP) do not provide specific treatment recommendations for PJP. The rapid progression and non-specific symptoms of PJP can delay diagnosis, leading to higher rates of mortality and mechanical ventilation, underscoring the urgent need for timely identification and treatment (Li J. et al., 2024; Nseir et al., 2024; Li et al., 2014; Roux et al., 2014). Traditional diagnostic methods such as microscopy and culture are limited by their low sensitivity in detecting PJP compared with other infections (Senécal et al., 2022). Metagenomic next-generation sequencing (mNGS) has improved pathogen detection in clinical samples and enhanced pneumonia diagnosis, especially in immunocompromised patients (Lv et al., 2023). However, it’s very high sensitivity can complicate the distinction between pathogenic and non-pathogenic microorganisms, particularly in the case of Pneumocystis jirovecii, which is associated with low specificity (Giacobbe et al., 2023). At present, PJP diagnosis relies on the integration of risk factor assessment, clinical symptoms, imaging features, and serum lactate dehydrogenase levels to inform initiation of anti-pneumocystis therapy (Tasaka, 2020; Li Y. et al., 2024). High-resolution chest CT plays a critical role in detecting pulmonary infections and supports early recognition of PJP for timely treatment (Wu et al., 2021). Nevertheless, CT interpretation is time-consuming, and the heavy workload of radiologists may hinder accurate recognition of subtle features associated with PJP.
Artificial intelligence (AI) has been increasingly applied in chest CT analysis (Yadav et al., 2024), particularly during the COVID-19 pandemic (Saba et al., 2021). However, its use in differentiating pneumonia pathogens remains underexplored. Computer-aided systems are capable of preprocessing images and extracting quantitative features, potentially providing valuable insights into distinctions between PJP and BP. The present study sought to improve PJP identification by integrating AI-based digital analysis of chest CT scans with clinical and laboratory data. A retrospective review of medical records from patients diagnosed with PJP and BP was performed to systematically evaluate baseline clinical characteristics, laboratory findings, and imaging features. On this basis, a diagnostic prediction model was constructed to enhance diagnostic accuracy, support empirical anti-infective decision-making, and improve patient prognosis.
2 Methods
2.1 Study design and participants
This retrospective study analyzed pneumonia patients at two hospitals who underwent mNGS of sputum or bronchoalveolar lavage fluid, selecting participants based on detected pathogens and strict criteria. Logistic regression identified independent predictors of PJP, which were used to create a nomogram model validated by the Hosmer-Lemeshow test. The model’s accuracy was assessed using ROC curve analysis, AUC, C-index, and calibration curve, with DCA evaluating its net benefit. Figure 1 illustrates the flow diagram of this retrospective, multicenter study conducted to identify independent predictors of PJP among pneumonia patients using metagenomic next-generation sequencing (mNGS) data. The study protocol was ethically approved, and informed consent was waived due to anonymization. The study involved two cohorts: a training cohort of 99 pneumonia patients (May 2020 - April 2023) and an external validation cohort of 87 patients, February 2021 - June 2024. Inclusion criteria for the PJP cohort included: (1) age 18+, (2) persistent lung infection symptoms for over a week, (3) chest CT showing typical PJP features, (4) detection of Pneumocystis jirovecii via mNGS, and (5) diagnostic confirmation by two specialists considering medical records and TMP-SMX use. PJP exclusion criteria included incomplete data and HIV co-infection. BP inclusion criteria, based on community-acquired pneumonia, required new or worsening respiratory symptoms, signs of consolidation or crackles, abnormal leukocyte counts, and radiographic evidence of infiltrates. BP exclusion criteria included incomplete data and mNGS results showing mixed infections.
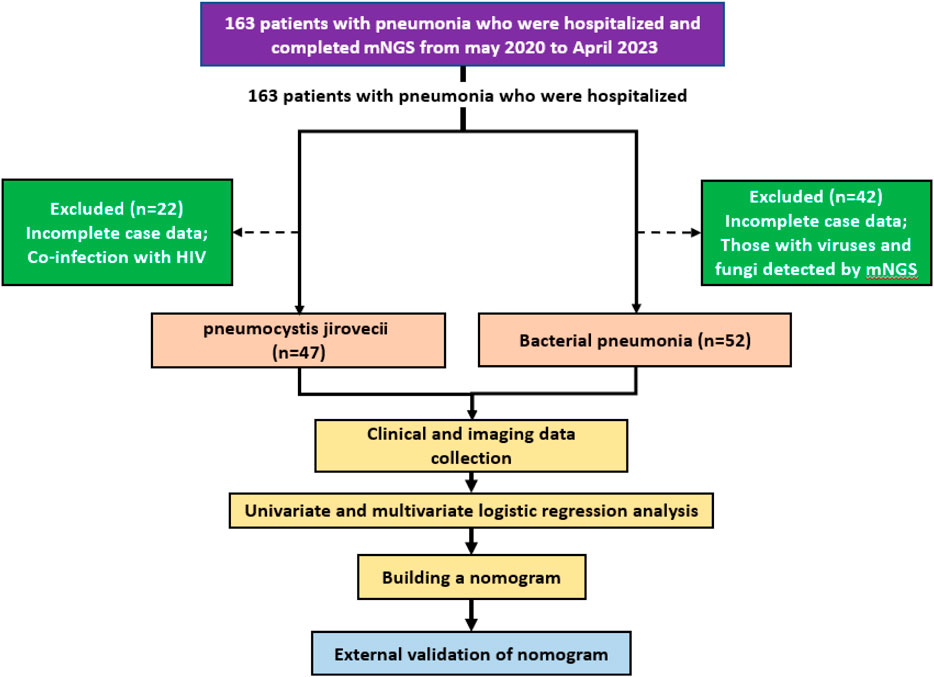
Figure 1. Flow illustration of the retrospective, multicenter study designed to identify independent predictors of PJP among patients with pneumonia.
2.2 Data collection
Baseline clinical characteristics were extracted from electronic medical records, including demographics, admission date by season, comorbidities, symptoms, physical findings, immunosuppressive therapy history, and current medications. Chronic comorbidities, defined by CDC criteria, included conditions lasting over a year needing ongoing care, such as cardiovascular diseases, type 2 diabetes, malignancies, and chronic respiratory disorders (Goodman et al., 2013). Immunosuppressive agents included glucocorticoids, calcineurin inhibitors, antimetabolites, lymphocyte-depleting antibodies, and alkylating agents. Laboratory data collected within 72 h of admission included complete blood count, inflammatory markers, serum biochemistry, cardiac biomarkers, electrolytes, arterial blood gas analysis, and coagulation profiles. All patients in this study underwent chest CT examinations on Philips iCT, Philips Brilliant CT, Siemens Force CT, or GE Lightspeed CT. Scanning parameters were as follows: fixed tube voltage 120kV, 3D tube current automatic modulation technology. Detector collimation width was 128 × 0.6 mm or 64 × 0.625 mm. Reconstruction slice thickness was 1.0 mm or 2.0mm, with a slice gap of 0.5 mm or 1.25 mm. CT images were interpreted using Picture Archiving and Communication System (PACS) software (GE Healthcare Life Sciences, Logan, UT, United States). All scans were performed with patients supine at end-inspiration, without intravenous contrast injection. Reconstruction was performed using a bone algorithm with 1 mm thickness and 1 mm interval. CT results included pneumonia, atelectasis, pulmonary nodules, pleural effusion, emphysema, etc. We employed the Shukun Pneumonia CT Image-Assisted Triage and Evaluation Software for automated image analysis, quantification, and visualization of CT scan structures (Figure 2). The software detects and segments pulmonary lesions, providing lesion location and size measurements. The AI algorithm intelligently recognizes CT images and precisely segments pneumonia lesions. Two respiratory physicians, each with over 3 years of experience, jointly reviewed and manually calibrated the lesion segmentation areas identified by the AI software. Multi-dimensional quantitative analysis was performed on lung volume, inflammatory lesion volume, and mean density of inflammatory lesions (in Hounsfield units, HU). Two physicians from the Department of Respiratory and Critical Care Medicine verified all pneumonia lesion delineations to ensure accuracy.
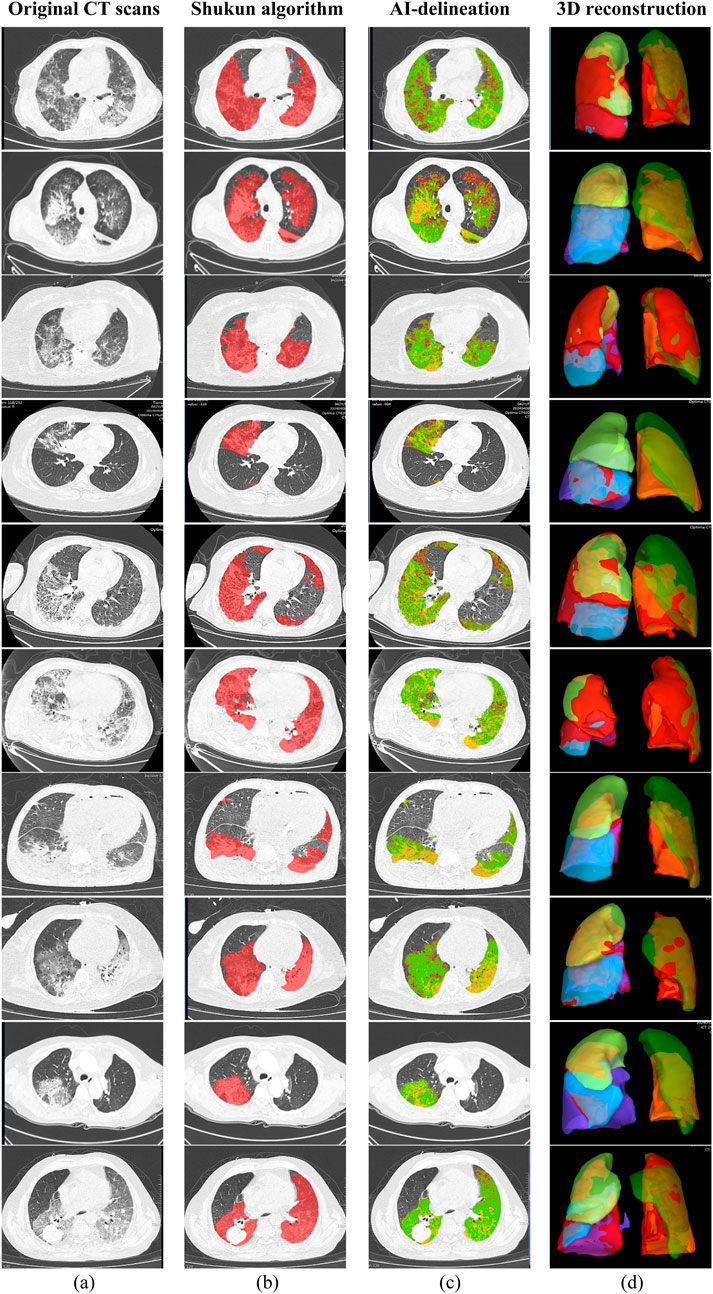
Figure 2. Chest CT images of 10 sample patients with pneumonia; (a) Original CT scans; (b) Pneumonia lesions delineated using the Shukun AI algorithm; (c) AI-delineated lesions with green indicating ground-glass opacities and yellow indicating consolidation; (d) 3D reconstruction of the lungs, with red indicating pneumonia lesions.
2.3 Statistical analysis
Statistical analyses were performed using RStudio software (version R 4.3.3). Normally distributed continuous variables were presented as mean ± standard deviation (x̄ ± s), and two groups were compared using independent samples t-test. Non-normally distributed quantitative data were presented as the median (interquartile range) [M (P25, P75)], and comparisons between the two groups were performed using the Wilcoxon rank sum test. Categorical data were expressed as percentages (%), and two samples were compared using the Chi-squared test or Fisher’s exact test. Risk factor analysis was performed using logistic regression, calculating odds ratios (OR) and their 95% confidence intervals (CI). A P-value <0.05 was considered statistically significant.
3 Results
3.1 Baseline characteristics of the study population
In the study, 163 pneumonia patients were considered, with 99 ultimately included: 47 in the PJP group (30 males, 17 females) and 52 in the BP group (37 males, 15 females). The PJP group had ages 32–85, with most (78.7%) aged 50–70, while the BP group had ages 36–93, with 69.2% aged 50–70. Males predominated in both groups, with higher prevalence in middle-aged and elderly patients. PJP cases peaked in January and April, while BP cases peaked in June and December.
Table 1 shows that the two groups had no significant differences in age, gender, severe pneumonia incidence, ICU admission, and mortality, but the PJP group had a higher incidence of chronic diseases (93.6% vs. 63.5%, P < 0.001) and immunosuppressant use (51.1% vs. 11.5%, P < 0.001). The BP group had a higher hemoptysis rate (17.3% vs. 4.26%, P = 0.039), while other clinical manifestations showed no significant differences (P > 0.05). Table 2 represents characteristics of patients with pneumocystis pneumonia and bacterial pneumonia.
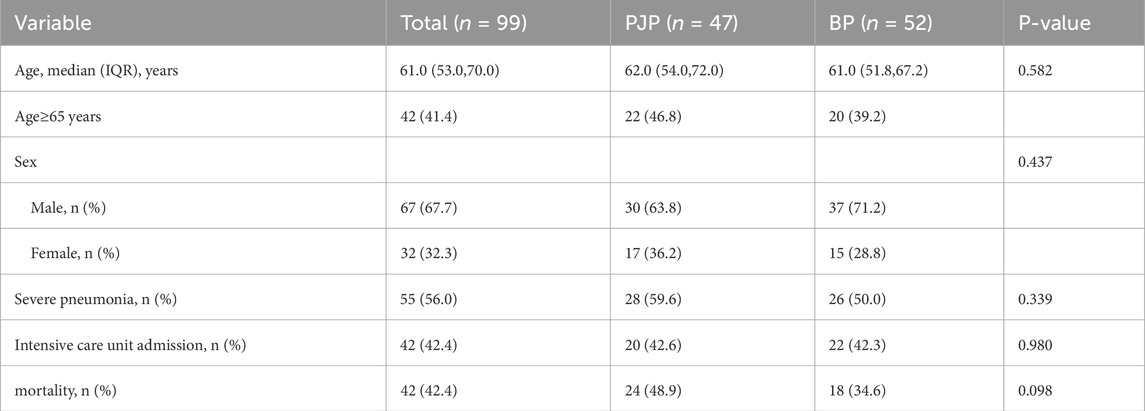
Table 1. Baseline demographic characteristics of patients with PJP and BP.
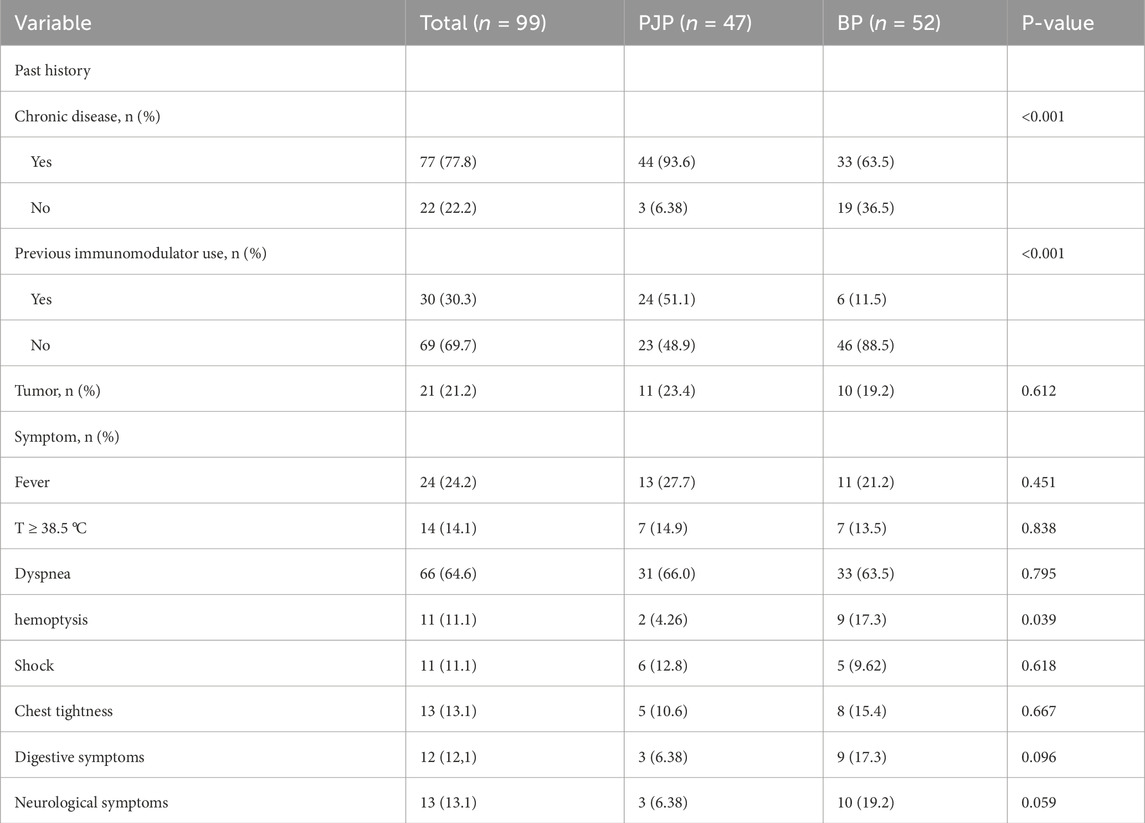
Table 2. Clinical characteristics of patients with PJP and BP.
The PJP group had higher LDH levels (374 U/L vs. 254 U/L, P < 0.05) and lower RBC (3.69 × 10^12/L vs. 4.31 × 10^12/L, P = 0.038), CK (33 U/L vs. 70 U/L, P < 0.001), PCO2 (34.8 mmHg vs. 35.9 mmHg, P = 0.048), and APTT (28.2 s vs. 31.4 s, P = 0.004) than the BP group. Table 3 represents the laboratory data for patients with PJP and bacterial pneumonia.
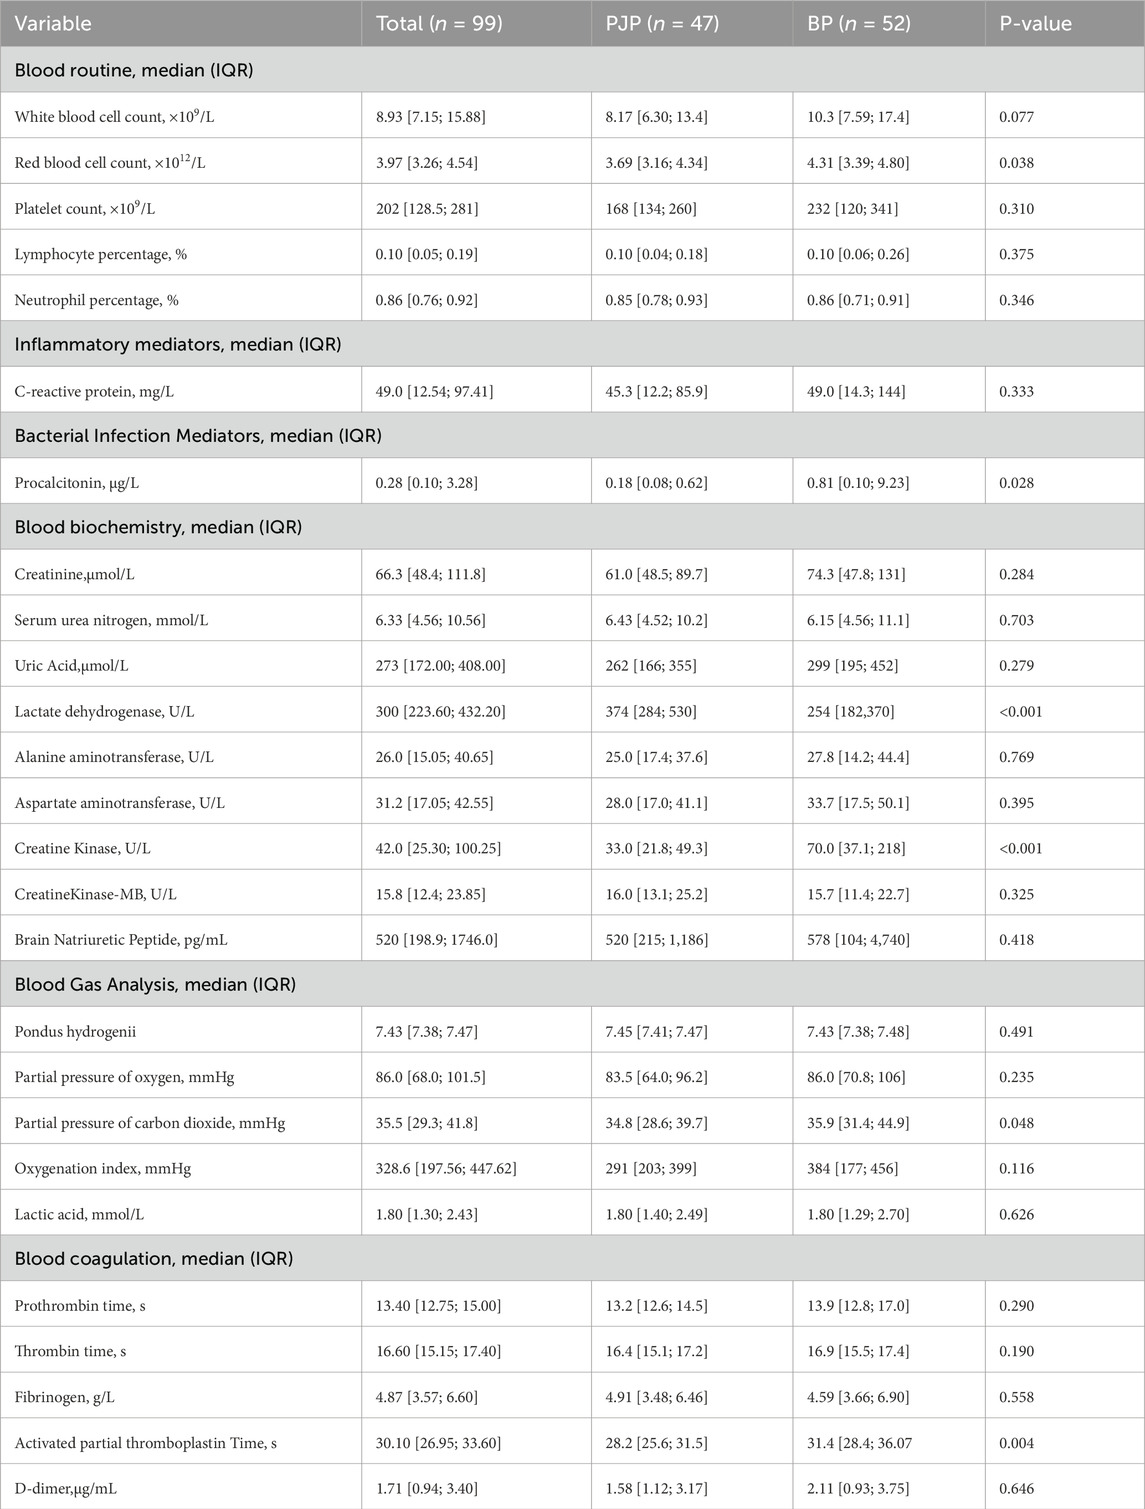
Table 3. Laboratory data within 72 h of admission in patients with PJP and BP.
3.2 Imaging findings
A significant difference in inflammatory lesion volume was found between the PJP (952 cm3) and BP (242 cm3) groups (P < 0.001), with PJP showing more extensive lung involvement and diffuse distribution. Lesion volumes in both lungs were greater in the PJP group, particularly in the left upper lobe (224 cm3 vs. 24.8 cm3) and right lower lobe (258 cm3 vs. 74 cm3), with significant differences (P < 0.001). The right lung lesions were larger (median 549 cm3) than the left (median 140 cm3), and the left upper lobe (median 391 cm3) had more lesions than the left lower lobe (median 96.3 cm3). In the right lung, lesions were most prevalent in the right lower lobe (median 258 cm3). The ratio of upper lobe lesion volume to total lung volume was higher in the PJP group (16.8% vs. 1.92%, P = 0.003), indicating upper lung predominance. Table 4 highlights the radiographic differences in pulmonary inflammatory lesion volumes between patients with PJP and bacterial pneumonia.
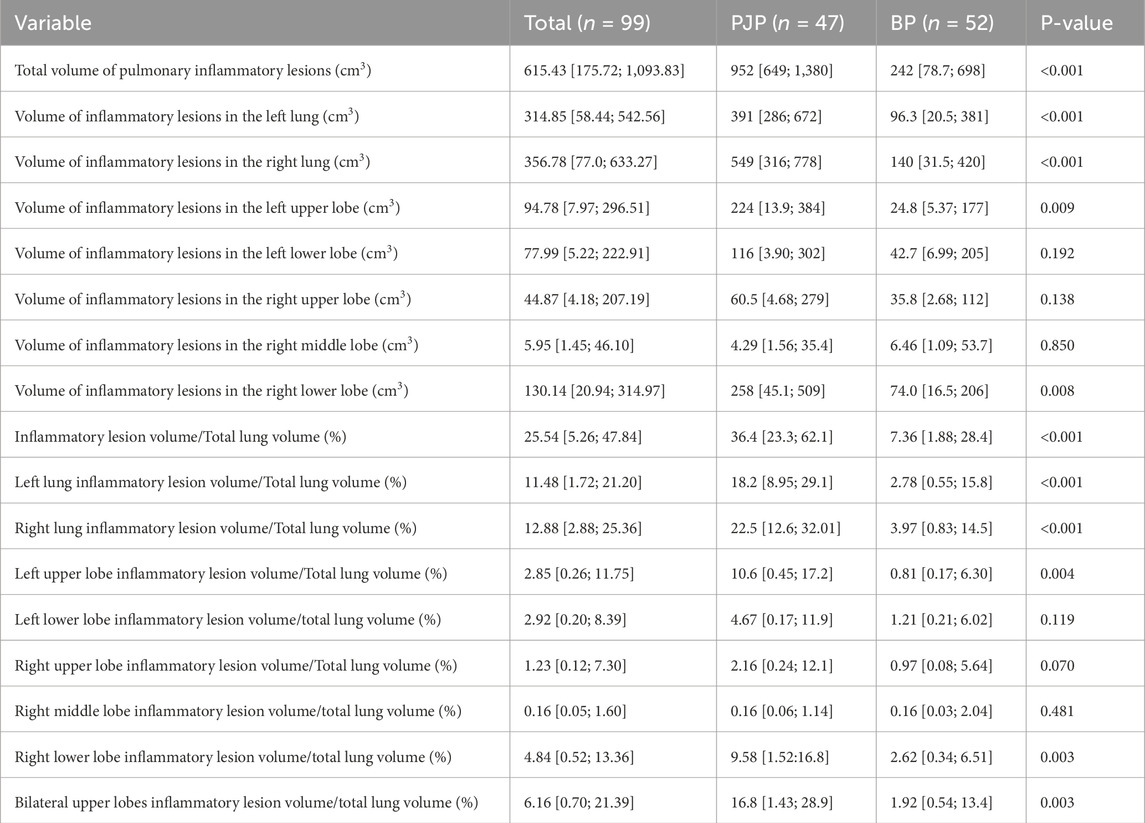
Table 4. Distribution and comparison of pulmonary inflammatory lesion volumes in patients with PJP and BP.
No significant difference in average lung inflammatory lesion density was found between PJP and BP groups, but the right upper lobe showed a significant difference. The PJP group had greater inflammatory lesion volumes than the BP group in two density ranges. Table 5 highlights the differences in average inflammatory lesion density and lesion volumes across various Hounsfield Unit ranges between patients with PJP and bacterial pneumonia.
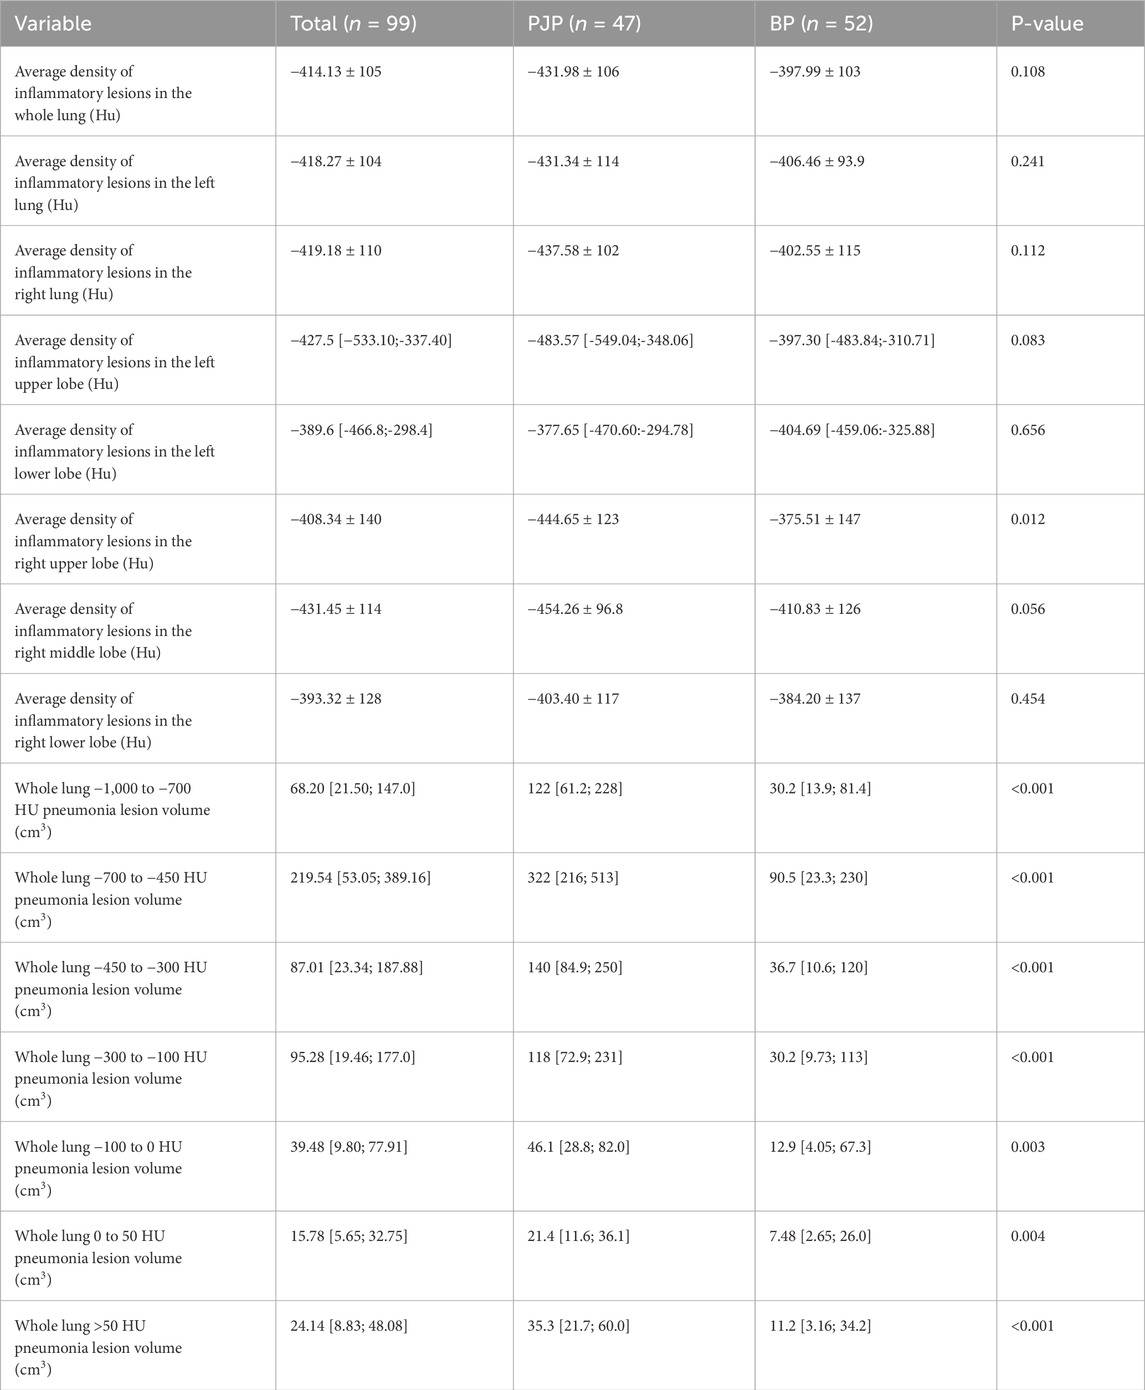
Table 5. Comparison of average CT density and stratified lesion volume by Hounsfield Units in patients with PJP and BP.
PJP and BP patients showed no significant differences in mechanical ventilation (82.6% vs. 67.3%,
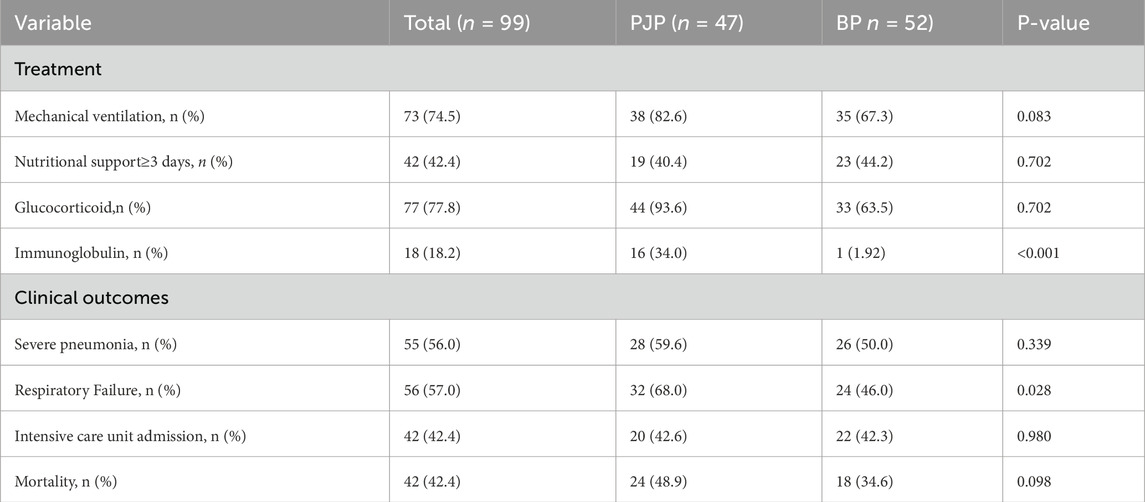
Table 6. Treatment strategies and clinical outcomes in patients with PJP and BP.
PJP is characterized by diffuse ground-glass opacities in both lungs, leading to statistical analysis of inflammatory lesions and CT values. Eight clinically significant variables were analyzed, identifying five independent predictors for distinguishing PJP from BP: previous immunomodulator use (
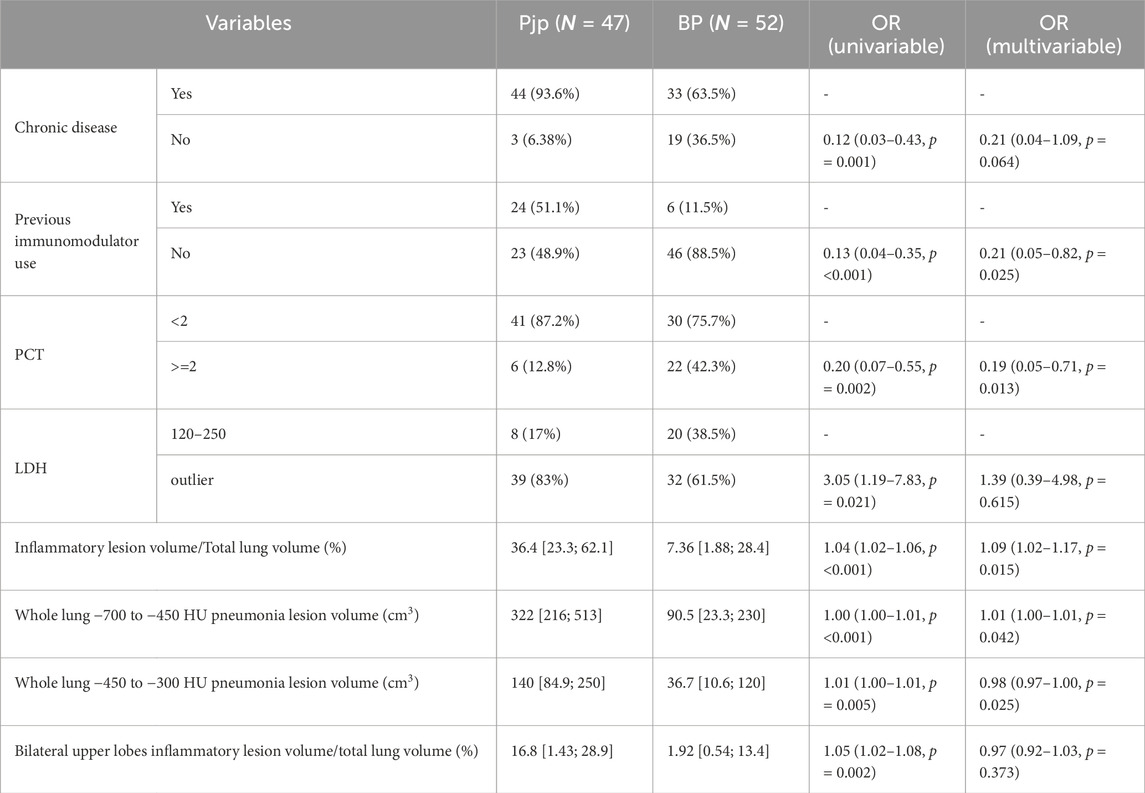
Table 7. Univariate and multivariate logistic regression of predictors differentiating PJP from BP.
We developed a nomogram model to differentiate PJP from BP, with a higher score indicating greater PJP risk. The model’s C-index was 0.898, showing excellent accuracy, confirmed by the Hosmer-Lemeshow test (
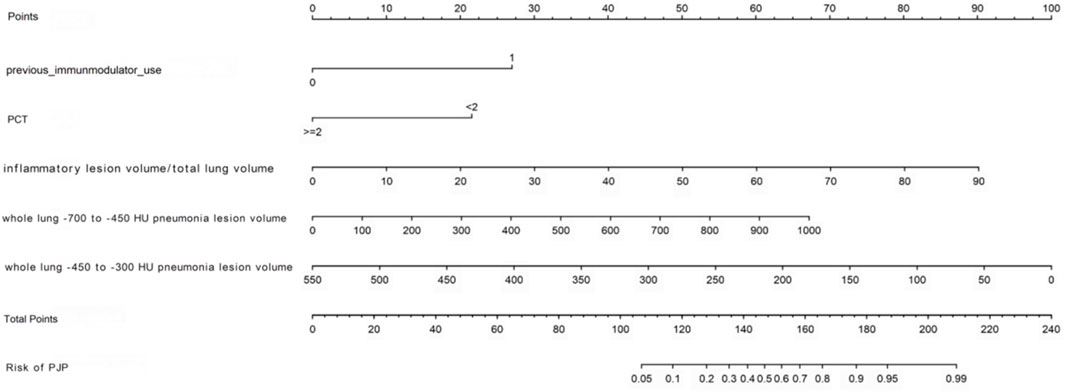
Figure 3. Nomogram for predicting the occurrence of Pneumocystis jirovecii pneumonia.
Figure 4 through Figure 7 collectively illustrate the development, validation, calibration, and clinical utility of the predictive model for PJP. Figure 4 presents the Receiver Operating Characteristic (ROC) curves for both the training and external validation cohorts. In Figure 4a, the model achieved an Area Under the Curve (AUC) of 0.898 in the training set, with an optimal threshold of 0.614, specificity of 0.904, and sensitivity of 0.745, reflecting strong discriminatory ability. Figure 4b shows slightly reduced but still robust performance in the validation set, with an AUC of 0.820, an optimal threshold of 0.526, specificity of 0.794, and sensitivity of 0.735. These results underscore the model’s consistent performance across cohorts. Figure 5 provides internal validation using bootstrap resampling. In Figure 5a, the red solid line represents the original ROC curve from the training set, while the grey lines depict 1,000 bootstrap replicates, indicating model stability and low variance. Figure 5b illustrates the distribution of AUCs from the 1,000 bootstrap samples, with a mean AUC of 0.899 and a 95% confidence interval ranging from 0.833 to 0.950, further confirming the model’s reliability. Figure 6 shows calibration curves assessing the agreement between predicted probabilities and observed outcomes. In both the training (Figure 6a) and validation (Figure 6b) cohorts, the red calibration line closely follows the ideal 45-degree line, and the green bias-corrected line remains within acceptable deviation, indicating good concordance between predicted and observed PJP risk. Figure 7 depicts Decision Curve Analysis (DCA), evaluating the net clinical benefit of the model across a range of risk thresholds. In both the training (Figure 7a) and validation (Figure 7b) cohorts, the red decision curve lies above the “treat-all” (grey line) and “treat-none” (horizontal line) strategies, demonstrating that the model provides greater net benefit in guiding clinical interventions compared to indiscriminate or absent treatment approaches.
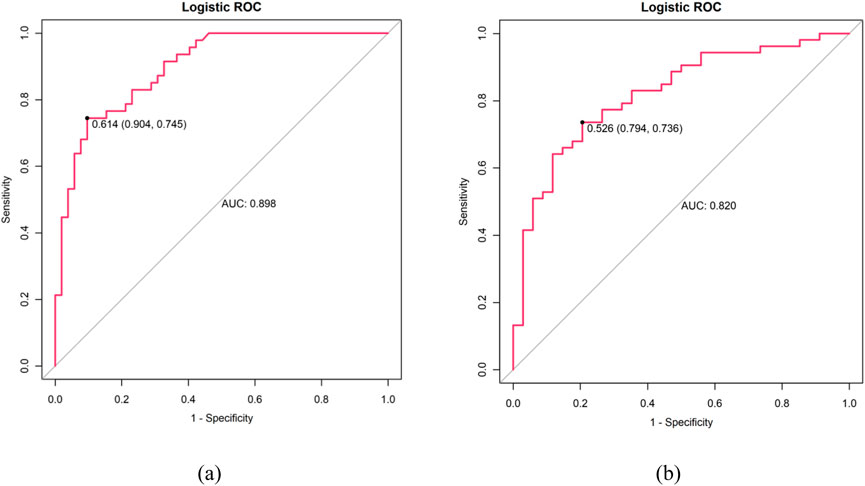
Figure 4. ROC curves: (a) Training cohort (AUC: 0.898, optimal threshold: 0.614, specificity 0.904 and sensitivity 0.745) (b) Validation cohort (AUC: 0.820, optimal threshold: 0.526, specificity 0.794, sensitivity 0.735). X-axis shows 1-specificity, Y-axis shows sensitivity.
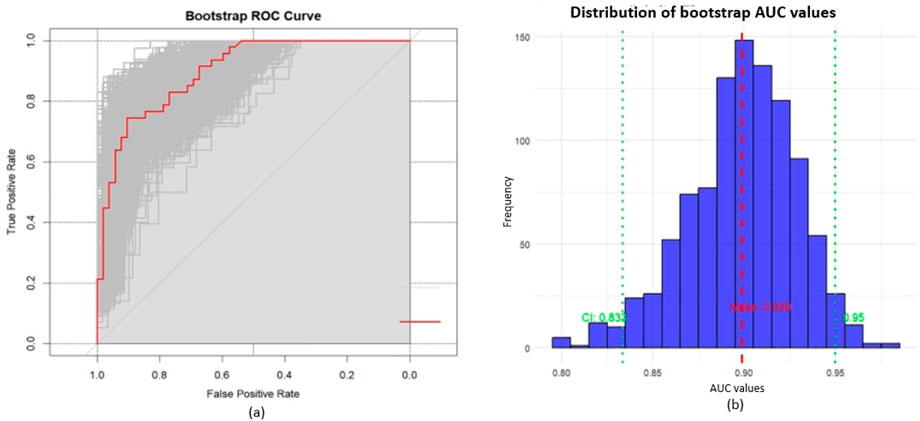
Figure 5. Internal validation with bootstrap resampling; (a) ROC curves: red solid line represents the original ROC curve from training set, grey curves show 1,000 bootstrap resamples. The distribution of grey curves indicates model stability and uncertainty; (b) Distribution of bootstrap AUC values: mean AUC = 0.899 (red dashed line), 95% CI: 0.833–0.950 (green dashed lines).
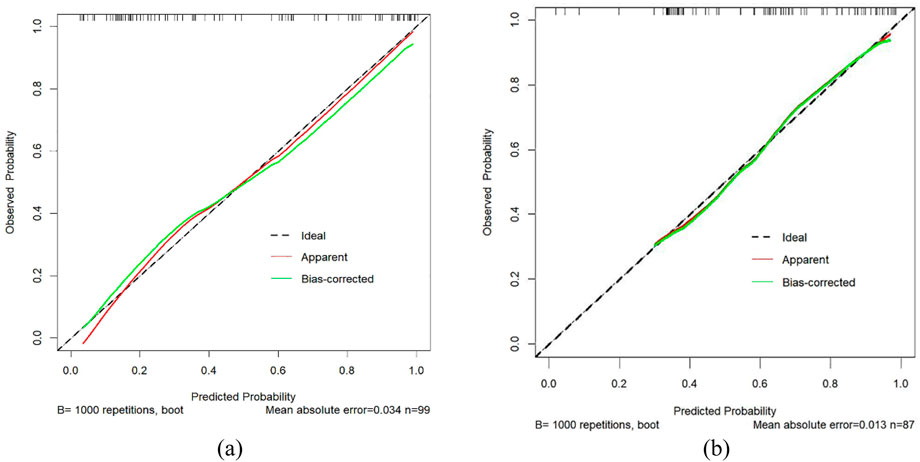
Figure 6. Calibration curves for PJP prediction. (a) Training cohort; (b) Validation cohort. X-axis represents predicted risk of PJP; Y-axis shows observed rate. Dashed line indicates ideal calibration, red line shows model calibration, and green line represents bias-corrected calibration. Proximity to the diagonal reflects prediction accuracy. PJP = Pneumocystis jirovecii pneumonia.
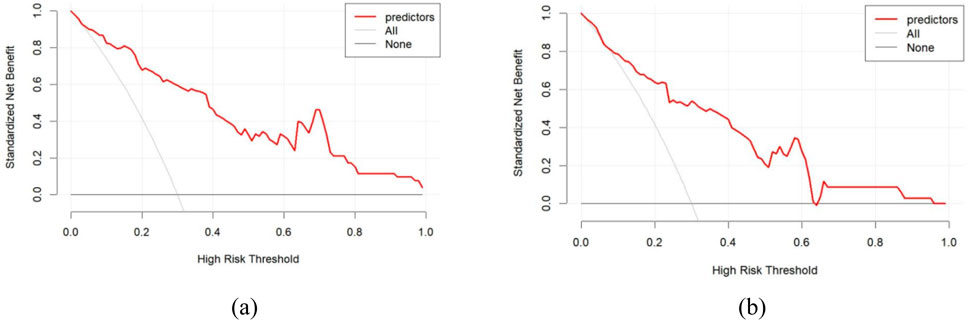
Figure 7. Decision curve analysis for predicting PJP. (a) Training cohort; (b) Validation cohort. X-axis represents high-risk threshold for clinical intervention; Y-axis shows standardized net benefit. Red curve demonstrates the actual net benefit of the prediction model at different thresholds, with higher curves indicating greater clinical utility at corresponding thresholds. horizontal line (None) represents treating no patients, and grey line (All) represents treating all patients.
In addition to sensitivity, specificity, and AUC, overall accuracy was also calculated to provide a more comprehensive assessment of the model’s performance. The diagnostic prediction model achieved an accuracy of 84.2% in the training cohort and 81.6% in the validation cohort. These values demonstrate strong consistency across datasets and further confirm the robustness and reliability of the model in distinguishing PJP from bacterial pneumonia (Song et al., 2025).
4 Discussion
This study distinguishes itself from previous research by employing a digital characterization approach for pneumonia lesions in chest CT scans, moving beyond traditional manual descriptions of lesion features. Building on this innovative method, clinical information and laboratory test results were incorporated to develop a predictive model for PJP. The model demonstrated excellent sensitivity and specificity in both training and testing sets, underscoring its potential for early detection and clinical intervention. An important observation from the decision curve analysis (Figure 7) is the influence of the high-risk threshold. At higher thresholds, the model still maintained a positive net clinical benefit, underscoring its robustness for guiding targeted interventions in patients at elevated risk of PJP. This study introduces a digital analysis approach combining chest CT imaging with clinical features to differentiate PJP from BP. To validate the effectiveness of this method, its performance was compared with existing studies in the field. For instance, Yu et al. (2024) developed a CT-based radiomics model for diagnosing PJP in non-HIV patients. Their model achieved a diagnostic accuracy of 95.8%, demonstrating the potential of radiomics in distinguishing PJP from other types of pneumonia. In comparison, our AI-assisted methodology not only achieved similar accuracy but also provided a more comprehensive analysis by integrating clinical data, thereby enhancing diagnostic precision. Additionally, Yu et al. (2024) employed multi-plane CT imaging and machine learning techniques to differentiate bacterial from non-bacterial pneumonia. While their approach showed promise, it primarily focused on imaging data without incorporating clinical features. Our integrated model, by combining imaging with clinical data, offers a more holistic diagnostic tool, potentially leading to better patient outcomes.
Notably, this study is the first to demonstrate that effective identification of pneumonia pathogens can be achieved solely through comprehensive artificial intelligence (AI) analysis (Wong, 2023) of pulmonary infection lesions, combined with clinical data, without relying on subjective physician interpretation. This approach provides robust support for clinical decision-making and opens new avenues for the diagnosis of pulmonary infections. Findings indicate that PJP is more commonly observed in immunocompromised individuals. Compared with patients with BP, chest CT scans of PJP patients revealed a higher proportion of inflammatory lesion volume relative to total lung volume, with larger volumes of inflammation (measured in cm3) observed in the ranges of −700 to −450 HU and −450 to −300 HU. Additionally, PJP patients exhibited significantly lower serum procalcitonin (PCT) levels than those with BP. These results align with existing literature, reinforcing the distinct clinical and radiological features of PJP in immunocompromised populations (Yu et al., 2024) (Hsu et al., 2020).
This study utilized AI-assisted tools to perform a quantitative analysis of CT images from patients with PJP[28. The results revealed that PJP patients had inflammatory lesions characterized by larger volumes and lower densities compared to BP patients, in contrast to previous studies that focused primarily on qualitative assessments of imaging (Tasaka, 2020) (Zou et al., 2022). Digital characterization of chest CT images enabled the quantification of complex imaging features into analyzable data, enhancing understanding of disease characteristics. This method also facilitates the development of pathogen-specific diagnostic prediction models and improves the ability to differentiate lung injuries caused by distinct pathogens. The digital analysis highlighted significant differences in pneumonia lesion volume and density between PJP and BP, further emphasizing the advantages of digital methods in differential diagnosis (Shi J. et al., 2021) (Ye et al., 2021) (Shi et al., 2022). Furthermore, this research provides the first theoretical validation for the application of AI in analyzing CT image attenuation patterns, extending beyond traditional visual recognition techniques to identify pneumonia pathogens via a multimodal model. This advancement not only expands the scope of AI applications in medical image analysis but also establishes a foundation for more accurate and objective diagnosis of pulmonary infection pathogens, offering promising potential for enhanced precision and intelligence in clinical diagnostics and treatment. Metagenomic next-generation sequencing (mNGS) technology has proven effective in identifying pathogenic organisms, which is critical for developing appropriate treatment strategies and improving patient outcomes (Jarboui et al., 2010). Research indicates that mNGS provides more comprehensive and accurate pathogen identification than traditional microbiological methods (Yang et al., 2025a), particularly in immunosuppressed patients (Lin et al., 2022; Li et al., 2022). However, mNGS can yield genetic information from multiple potential pathogens, complicating the identification of the primary causative agent—a critical consideration since different pathogens require distinct treatment regimens.
The primary innovation of this study lies in the comprehensive evaluation and comparative analysis of patients diagnosed with PJP and BP using mNGS results. Integration of digitized imaging features with clinical characteristics and laboratory findings significantly enhances the accuracy and reliability of pathogen identification in complex clinical scenarios. The findings further reveal that patients with PJP have a higher prevalence of chronic underlying conditions and a history of immunosuppressive therapy compared to those with BP, consistent with established risk factors for PJP (Zhang et al., 2021). Additionally, potential new biomarkers were identified, including PCT, which may serve as diagnostic indicators for PJP. PCT, a precursor of calcitonin, is recognized as a reliable infection marker, particularly in systemic responses triggered by circulating endotoxins and inflammatory cytokines (Tang et al., 2007). Recent studies have demonstrated a positive association between PCT levels and mortality in PJP cases (Zhang et al., 2024; Feng and Tong, 2024), although its specific role in diagnosing PJP has not been previously reported. Findings suggest that the degree of PCT elevation could aid in distinguishing between PJP and BP. One limitation of this study is the relatively small sample size of the training cohort, which may affect the generalizability of the results. The study was conducted at a single center, and although an external validation cohort was included, its small size further limits external validity. The selected patient population may not fully represent characteristics from other geographic regions or medical institutions. Future studies should consider larger, multi-center cohorts to enhance representativeness and robustness. Additionally, adopting a prospective study design (Wong et al., 2010) and standardized treatment protocols would help minimize potential biases and provide more precise insights into diagnostic prediction for PJP (Shi et al., 2021a; Shi et al., 2021b; Yang et al., 2025b).
5 Conclusion
The AI-assisted CT analysis enabled precise quantification of lesion distribution and density, offering a novel dimension to differential diagnosis that extends beyond traditional radiological interpretation. The model demonstrated strong accuracy, sensitivity, and specificity, highlighting its robustness and potential clinical value in guiding timely diagnosis and management. These findings underscore the emerging role of AI and digital radiology in infectious disease diagnostics, particularly for immunocompromised populations at elevated risk of PJP. Such advances may improve diagnostic precision and support clinicians in making more confident therapeutic decisions, thereby reducing misclassification and inappropriate antibiotic use. Despite these promising results, certain limitations should be acknowledged, including the retrospective single-center design and the possibility of selection bias. Additionally, integrating metagenomic next-generation sequencing (mNGS) data with imaging and clinical variables warrants further exploration to optimize cost-effectiveness and clinical utility.
Data availability statement
The original contributions presented in the study are included in the article/supplementary material, further inquiries can be directed to the corresponding authors.
Ethics statement
The studies involving humans were approved by Ethics Committee of the Second Affiliated Hospital of Fujian Medical University (Approval No.: (2022) Fujian Medical Ethics Review 350). The studies were conducted in accordance with the local legislation and institutional requirements. The ethics committee/institutional review board waived the requirement of written informed consent for participation from the participants or the participants’ legal guardians/next of kin because The retrospective study removed all patient identifiers prior to analysis and procedures used in this study adhere to the tenets of the Declaration of Helsinki.
Author contributions
YC: Writing – original draft, Conceptualization, Methodology. XX: Methodology, Conceptualization, Writing – original draft. ZH: Writing – review and editing, Methodology. XL: Data curation, Writing – review and editing. CL: Writing – review and editing, Formal Analysis. JC: Data curation, Investigation, Writing – review and editing. WW: Validation, Writing – review and editing, Data curation. KC: Visualization, Writing – review and editing, Formal Analysis. YZ: Formal Analysis, Writing – review and editing, Supervision.
Funding
The author(s) declare that financial support was received for the research and/or publication of this article. This work was supported by the Doctoral Training Matching Fund of the Second Affiliated Hospital of Fujian Medical University (Grant No. 2022BD0107).
Acknowledgments
We thank all the patients and their families involved in the study. We thank all the medical staff who work in The Second Affiliated Hospital of Fujian Medical University and Affiliated Hospital of Putian University.
Conflict of interest
The authors declare that the research was conducted in the absence of any commercial or financial relationships that could be construed as a potential conflict of interest.
Generative AI statement
The author(s) declare that no Generative AI was used in the creation of this manuscript.
Any alternative text (alt text) provided alongside figures in this article has been generated by Frontiers with the support of artificial intelligence and reasonable efforts have been made to ensure accuracy, including review by the authors wherever possible. If you identify any issues, please contact us.
Publisher’s note
All claims expressed in this article are solely those of the authors and do not necessarily represent those of their affiliated organizations, or those of the publisher, the editors and the reviewers. Any product that may be evaluated in this article, or claim that may be made by its manufacturer, is not guaranteed or endorsed by the publisher.
References
Berenji F., Zarrinfar H., Gholizadeh A., Sargazi F., Jamali J., Noghabi M. P., et al. (2025). Co-Infection of Lophomonas blattarum and Pneumocystis jirovecii in Patients with Respiratory Disorders in Northeastern Iran. Iran. J. Parasitol. 20 (2), 299–306. doi:10.18502/ijpa.v20i2.19049
Feng Q., Tong Z. (2024). Clinical Characteristics and Prognostic Predictors of Pneumocystis Jirovecii Pneumonia in Patients with and without Chronic Pulmonary Disease: A Retrospective Cohort Study. Infect. Drug Resist. 17, 2169–2182. doi:10.2147/IDR.S456716
Giacobbe D. R., Dettori S., Di Pilato V., Asperges E., Ball L., Berti E., et al. (2023). Pneumocystis jirovecii pneumonia in intensive care units: a multicenter study by ESGCIP and EFISG. Crit. Care 27 (1), 323. doi:10.1186/s13054-023-04608-1
Goodman R. A., Posner S. F., Huang E. S., Parekh A. K., Koh H. K. (2013). Defining and measuring chronic conditions: imperatives for research, policy, program, and practice. Prev. Chronic Dis. 10, E66. doi:10.5888/pcd10.120239
Hsu J. M., Hass A., Gingras M. A., Chong J., Costiniuk C., Ezer N., et al. (2020). Radiographic features in investigated for Pneumocystis jirovecii pneumonia: a nested case-control study. BMC Infect. Dis. 20, 492–495. doi:10.1186/s12879-020-05217-x
Jarboui M. A., Sellami A., Sellami H., Cheikhrouhou F., Makni F., Ben Arab N., et al. (2010). Molecular diagnosis of pneumocystis jirovecii in immunocompromised patients. Mycoses 53 (4), 329–333. doi:10.1111/j.1439-0507.2009.01715.x
Li M. C., Lee N. Y., Lee C. C., Lee H. C., Chang C. M., Ko W. C. (2014). Pneumocystis jirovecii in immunocompromised patients: delayed diagnosis and poor outcomes in non-HIV-infected individuals. J. Microbiol. Immunol. Infect. 47, 42–47. doi:10.1016/j.jmii.2012.08.024
Li J., Zhou C. E., Wei S. C., Wang L. N., Shi M. W., Sun C. P., et al. (2022). Diagnostic value of metagenomic next-generation sequencing for pneumonia in immunocompromised patients. Can. J. Infect. Dis. Med. Microbiol. 2022, 5884568. doi:10.1155/2022/5884568
Li J., Mu X., Li H., Liu X. (2024a). Clinical course and prognostic factors of Pneumocystis pneumonia with respiratory failure in non-HIV patients. Front. Cell. Infect. Microbiol. 14, 1380494. doi:10.3389/fcimb.2024.1380494
Li Y., Liu H., Lv Q., Long J. (2024b). Diagnosis model of early Pneumocystis jirovecii pneumonia based on convolutional neural network: a comparison with traditional PCR diagnostic method. BMC Pulm. Med. 24 (1), 205. doi:10.1186/s12890-024-02987-x
Lin P., Chen Y., Su S., Nan W., Zhou L., Zhou Y., et al. (2022). Diagnostic value of metagenomic next-generation sequencing of bronchoalveolar lavage fluid for the diagnosis of suspected pneumonia in immunocompromised patients. BMC Infect. Dis. 22 (1), 416. doi:10.1186/s12879-022-07381-8
Lv M., Zhu C., Zhu C., Yao J., Xie L., Zhang C., et al. (2023). Clinical values of metagenomic next-generation sequencing in patients with severe pneumonia: a systematic review and meta-analysis. Front. Cell. Infect. Microbiol. 13, 1106859. doi:10.3389/fcimb.2023.1106859
Nseir S., Valadas E., Leone M. (2024). Severe Pneumocystis jirovecii pneumonia: time to reassess our practices. Intensive Care Med. 50, 1310–1312. doi:10.1007/s00134-024-07547-9
Roux A., Canet E., Valade S., Gangneux-Robert F., Hamane S., Lafabrie A., et al. (2014). Pneumocystis jirovecii pneumonia in patients with or without AIDS, France. Emerg. Infect. Dis. 20, 1490–1497. doi:10.3201/eid2009.131668
Saba L., Agarwal M., Patrick A., Puvvula A., Gupta S. K., Carriero A., et al. (2021). Six artificial intelligence paradigms for tissue characterisation and classification of non-COVID-19 pneumonia against COVID-19 pneumonia in computed tomography lungs. Int. J. Comput. Assist. Radiol. Surg. 16 (3), 423–434. doi:10.1007/s11548-021-02317-0
Senécal J., Smyth E., Del Corpo O., Hsu J. M., Amar-Zifkin A., Bergeron A., et al. (2022). Non-invasive diagnosis of Pneumocystis jirovecii pneumonia: a systematic review and meta-analysis. Clin. Microbiol. Infect. 28 (1), 23–30. doi:10.1016/j.cmi.2021.08.017
Shi J., Ye Y., Zhu D., Su L., Huang Y., Huang J. (2021a). Automatic Segmentation of Cardiac Magnetic Resonance Images based on Multi-input Fusion Network. Comput. Methods Programs Biomed. 209, 106323. doi:10.1016/j.cmpb.2021.106323
Shi J., Ye Y., Zhu D., Su L., Huang Y., Huang J. (2021b). Comparative analysis of pulmonary nodules segmentation using multiscale residual U-Net and fuzzy C-means clustering. Comput. Methods Programs Biomed. 209, 106332. doi:10.1016/j.cmpb.2021.106332
Shi J., Ye Y., Zhu D., Su L., Huang Y., Huang J. (2021c) Super-resolution reconstruction of pneumocystis carinii pneumonia images based on generative confrontation network, 215, 106578.
Shi J., Huang C., Zheng J., Ai Y., Liu H., Pan Z., et al. (2022). Case Report: Tachycardia, Hypoxemia and Shock in a Severely Burned Pediatric Patient. Front. Cardiovasc Med. 9, 904400. doi:10.3389/fcvm.2022.904400
Shoar S., Musher D. M. (2020). Etiology of community-acquired pneumonia in adults:a systematic review. Pneumonia (Nathan) 12, 11. doi:10.1186/s41479-020-00074-3
Song L., Zhan Y., Li L., Li X., Wu Y., Zhao M., et al. (2025). Differentiating bacterial and non-bacterial pneumonia on chest CT using multi-plane features and clinical biomarkers. Acad. Radiol. 32 (9), 5596–5608. doi:10.1016/j.acra.2025.05.047
Tang B. M., Eslick G. D., Craig J. C., McLean A. (2007). Accuracy of procalcitonin for sepsis diagnosis in critically ill patients: systematic reveiw and meta-analysis. Lancet Infect. Dis. 7(3):210–217. doi:10.1016/s1473-3099(07)70052-x
Tasaka S. (2020). Recent Advances in the Diagnosis and Management of Pneumocystis Pneumonia. Tuberc. Respir. Dis. 83 (2), 132–140. doi:10.4046/trd.2020.0015
Wong K. K. L. (2023). Cybernetical Intelligence: Engineering Cybernetics with Machine Intelligence. Hoboken, New Jersey: John Wiley and Sons, Inc.
Wong K. K. L., Tu J. Y., Mazumdar J., Abbott D. (2010). Modelling of blood flow resistance for an atherosclerotic artery with multiple stenoses and poststenotic dilatations. ANZIAM J. E 51, C66–C82. doi:10.21914/anziamj.v51i0.2587
Wu H. Y., Wu K. S., Huang Y. L., Dai S. H., Chang D. Y., Kuo S. H., et al. (2021). Identifying predictors for bacterial andfungal coinfection on chest computed tomography in patients with Pneumocystis pneumonia. J. Microbiol. Immunol. Infect. 54 (4), 701–709. doi:10.1016/j.jmii.2020.06.007
Yadav P., Rastogi V., Yadav A., Parashar P. (2024). Artificial Intelligence: A PromisingTool in Diagnosis of Respiratory Diseases. Intell. Pharm. 2, 784–791. doi:10.1016/j.ipha.2024.05.002
Yang C., Ashraf M. A., Riaz M., Umwanzavugaye P., Chipusu K., Huang H., et al. (2025a). Enhanced thyroid nodule detection and diagnosis: a mobile-optimized DeepLabV3+ approach for clinical deployments. Front. Physiology 16, 1457197. doi:10.3389/fphys.2025.1457197
Yang C., Ashraf M. A., Riaz M., Umwanzavugaye P., Chipusu K., Huang H., et al. (2025b). Improving diagnostic precision in thyroid nodule segmentation from ultrasound images with a self-attention mechanism-based Swin U-Net model. Front. Oncol. 15, 1456563. doi:10.3389/fonc.2025.1456563
Ye Y., Shi J., Huang Y., Zhu D., Su L., Huang J. (2021). Management of Medical and Health Big Data Based on Integrated Learning-based Health Care System: A Review and Comparative Analysis. Comput. Methods Programs Biomed. 209, 106293. doi:10.1016/j.cmpb.2021.106293
Yin Y., Zhao C., Li H., Jin L., Wang Q., Wang R., et al. (2021). Clinical and microbiological characteristics ofadults with hospital-acquired pneumonia: a 10-year prospective observationalstudy in China. Eur. J. Clin. Microbiol. and Infect. Dis. 40, 683–690. doi:10.1007/s10096-020-04046-9
Yu H., Yang Z., Wei Y., Shi W., Zhu M., Liu L., et al. (2024). Computed tomography-based radiomics improves non-invasive diagnosis of Pneumocystis jirovecii pneumonia in non-HIV patients: a retrospective study. BMC Pulm. Med. 24 (1), 11. doi:10.1186/s12890-023-02827-4
Zhang F., Chen J., Huang H., Deng X., Zhang W., Zeng M., et al. (2021). Application of metagenomic next-generation sequencing in the diagnosis and treatment guidance of Pneumocystis jirovecii pneumonia in renal transplant recipients. Eur. J. Clin. Microbiol. Infect. Dis. 40 (9), 1933–1942. doi:10.1007/s10096-021-04254-x
Zhang L., Liu Y., Zou J., Wang T., Hu H., Zhou Y., et al. (2024). The Development and Evaluation of a Prediction Model for Kidney Transplant-Based Pneumocystis carinii Pneumonia Patients Based on Hematological Indicators. Biomedicines 12, 366. doi:10.3390/biomedicines12020366
Keywords: pneumocystis jirovecii pneumonia, bacterial pneumonia, chest CT imaging, digital analysis, AI-assisted diagnosis, nomogram
Citation: Chen Y, Xu X, Huang Z, Lai X, Li C, Chen J, Wu W, Chipusu K and Zeng Y (2025) Diagnostic predictive evaluation of pneumocystis jirovecii pneumonia using digital chest CT analysis combined with clinical features. Front. Physiol. 16:1616791. doi: 10.3389/fphys.2025.1616791
Received: 23 April 2025; Accepted: 18 September 2025;
Published: 20 October 2025.
Edited by:
Alexander V. Glushkov, Odessa National Polytechnic University, UkraineReviewed by:
Hossein Zarrinfar, Mashhad University of Medical Sciences, IranYogarajan Gunasekaran, Mepco Schlenk Engineering College, India
Copyright © 2025 Chen, Xu, Huang, Lai, Li, Chen, Wu, Chipusu and Zeng. This is an open-access article distributed under the terms of the Creative Commons Attribution License (CC BY). The use, distribution or reproduction in other forums is permitted, provided the original author(s) and the copyright owner(s) are credited and that the original publication in this journal is cited, in accordance with accepted academic practice. No use, distribution or reproduction is permitted which does not comply with these terms.
*Correspondence: Yunfeng Chen, OTE5OTkxMjAwN0Bmam11LmVkdS5jbg==; Yiming Zeng, emVuZ195aW1pbmdAZmptdS5lZHUuY24=
†These authors have contributed equally to this work