 Ron Bessler1*
 Tirosh Mekler1Rami Fishler1Oshri Farhana1Sigal Dhatavkar1Tamar Daniel1Bar Kalifa1
 Kenichiro Koshiyama2
 Netanel Korin1
 Josué Sznitman1*
- 1Department of Biomedical Engineering, Technion – Israel Institute of Technology, Haifa, Israel
- 2Graduate School of Technology, Industrial and Social Sciences, Tokushima University, Tokushima, Japan
Obstructive pulmonary diseases, including asthma and chronic obstructive pulmonary disease are widespread and represent a major global health burden. Despite their impact, effective therapeutic delivery to the small airways using inhaled aerosols remains suboptimal. In this study, we present a novel in vitro airway-on-chip platform that mimics both normal and constricted small bronchial geometries to quantify the deposition charged and neutral polystyrene latex aerosol particles ranging from 0.2 to 2 µm. Analytical and numerical solutions were derived from dimensionless scaling laws to further support the experiments and predict deposition location. Our experiments showcase how electrostatic forces significantly alter deposition patterns across particle sizes in these small airways. For submicron particles, we observe the enhancement of proximal airway deposition due to the coupling of electrostatic-diffusive screening effects. For larger particles, which typically deposit only in the direction of gravity, the inclusion of electrostatic forces significantly extends their deposition footprint, enabling deposition even in orientations where gravitational sedimentation is not feasible. Constricted regions consistently exhibit lower deposition across all cases, the presence of electrostatic forces enhanced overall deposition, offering a potential strategy for targeting bronchioles. Together, these findings suggest that electrostatic attraction may be strategically leveraged to enhance aerosol targeting in the small airways, providing new opportunities for optimizing inhaled drug delivery in obstructive lung diseases.
Introduction
Obstructive pulmonary diseases, most notably asthma and chronic obstructive pulmonary disease (COPD), are highly prevalent across the globe and pose significant public health challenges. Despite the severity of the condition, effective treatment with inhaled aerosols remains limited, in part due to the poor deposition efficiencies of common inhalers, which typically deliver less than 50% of the inhaled dose (de Boer et al., 2017; Choi et al., 2019), with even lower efficiencies observed in pediatric populations (Oakes et al., 2023). The inefficiency in aerosol delivery is particularly pronounced in the presence of airway constriction, where the reduction in airway diameters creates higher resistance to airflow (Das et al., 2018; Oakes et al., 2023; Virchow et al., 2018). For example, in chronic bronchitis, a condition characterized by excessive mucus production and inflammation in the (small) bronchi, the accumulation of phlegm and swelling of the bronchial walls reduces the effective luminal space (Kim and Criner, 2013). Alternatively, the presence of mucus plugs occluding medium to large airways (i.e., approximately 2–10 mm lumen diameter) has been shown to be significantly associated with higher risk of all-cause mortality in COPD (Diaz et al., 2023).
In this landscape, delivering inhaled therapeutics to constricted airways, let alone obstructed ones, remains a vast challenge in pulmonary drug delivery. Recent inhalation therapy techniques have attempted to improve the outcomes of inhalation therapy, including modifying breathing patterns, using breath-actuated inhalers, and adjusting inspiratory flow rates (Ari and Fink, 2020). Nevertheless, the most widely used strategy remains optimizing the aerodynamic diameter (dp) of inhaled particles, as this parameter largely governs key deposition mechanisms such as impaction, gravitational sedimentation, and Brownian diffusion (Ijsebaert et al., 2001). Aerosol design criteria advocate that aerosols in the size range between approximately 2 and 6 μm hold the best potential to deposit in the central and small airways (Darquenne, 2012) as larger particles (>6 μm) tend to mainly deposit in the upper airways due to impaction whereas aerosols <2 μm deposit mainly in the deep lungs (i.e., alveolar regions). Despite such general guidelines, one significant particle property that is often overlooked in addressing aerosol deposition (Bessler and Sznitman, 2024) is the electric charge (q) acquired by aerosols during inhaler-generated formation (Kwok and Chan, 2009).
Briefly, when an inhaled charged particle approaches the (neutral) lung tissue, it induces a localized electric field triggering a dielectric effect (Wilson, 1947; Finlay, 2021; Balachandran et al., 1997). This effect causes surrounding charges or dipole molecules within the tissue to reorient in response to the particle’s projected field (E). The interaction between a particle’s inherent charge q and the induced dipoles or charges within the tissue results in an electrostatic attraction force Fe; a phenomenon shown to enhance particle deposition in proportion to
To date, numerical simulations (Koullapis et al., 2016), in vitro studies (Bessler et al., 2023) and non-dimensional analysis (Bessler and Sznitman, 2024; Finlay, 2001) have underlined the importance of electrostatic charge towards deposition outcomes. Notably, these studies account for proper scaling based on realistic charge levels and particle sizes generated by commercial inhalers (Kwok and Chan, 2008). Electrostatic forces may play a dominant role in the deeper lung regions where characteristic length scales are small (Bailey et al., 1998; Finlay, 2001). There, electrostatic attraction, which is inversely proportional to the square of the distance between an aerosol and the luminal wall, can potentially overshadow conventional deposition mechanisms when particle charge is sufficiently elevated relative to size (Bessler and Sznitman, 2024; Bessler et al., 2023; Finlay, 2001). Yet, studies addressing the induced electrostatic forces have largely focused on deposition in large airways (Cohen et al., 1995; Xi et al., 2014). This observation results amongst others from historical and technical challenges of exploring the phenomenon at true scale in small bronchioles. Concurrently, while electrostatic forces are expected to play a significant role in the smaller lung regions, electrostatic attraction obeys the principle of superposition in addition to other deposition mechanisms and thus also contributes to deposition in the extra-thoracic and upper airways. Despite some recent interest in the field (Bessler et al., 2023), there remains a dearth of available data exploring electrostatic-driven pulmonary deposition at small scale (Sznitman, 2022).
Motivated by the ongoing shortcomings on aerosol electrostatics in the lungs, we investigate in vitro the role of electrostatic forces on aerosol deposition within small airway models. Specifically, we focus on how electrostatic forces influence deposition patterns in normal and constricted bronchioles. To this end, we present a novel in vitro airway-on-chip lined with electrically conductive material to mimic the conductive properties of the luminal airway tissue. We capture the size and branching structure of small to terminal bronchioles (i.e., corresponding to generations 12–15 of the seminal Weibel A model (Weibel, 1963)); the primary sites of airflow obstruction in COPD that contributes to the disease’s characteristic symptoms (Xu et al., 2022). We quantify aerosol deposition patterns spanning aerosol sizes of 0.2 µm–2 μm, representing particles typically influenced by Brownian diffusion and gravitational sedimentation, respectively (Hofem et al., 2015). Our experiments examine two specific charge distributions: (i) intrinsically charged atomized particles (>100 e) and (ii) neutralized particles following a Boltzmann distribution. By directly comparing these distributions, in conjunction with particle size, we attempt to shed new quantitative light on how electrostatic charge can overcome traditional deposition mechanisms and ultimately alter local deposition outcomes.
Methods
Aerosol exposure experiment
Aerosol exposure assay
The aerosols are generated using a collision-type atomizer (Model 3076, TSI) with filtered air as the gas source, maintained at
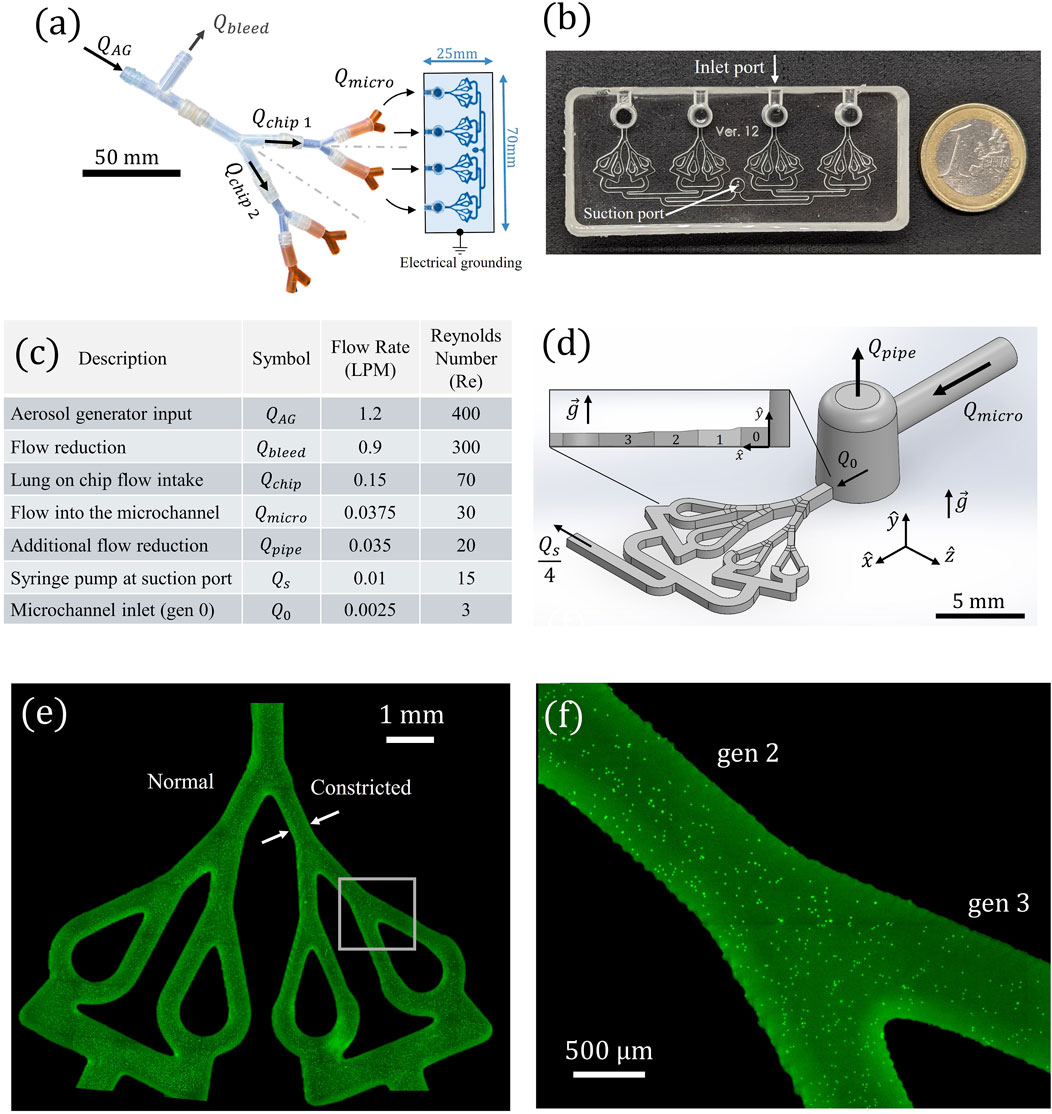
Figure 1. (a) Schematic of the experimental aerosol exposure setup. The air reduction apparatus expels excess airflow
Before entering the first microchannel generation (i.e., Gen. 0, see Figure 1d and top view in Figure 2c) the bulk airflow passes through a small vertical pipe for additional reduction Qpipe. The desired flow rate into Gen 0, .designated as Q0, is then drawn under a constant steady flow into the microchannels via a syringe pump (PHD Ultra, Harvard Apparatus) connected to the suction outlet of each chip (Figure 1b; Supplementary Figure S1a). The constant flow approximation in the model is sufficient to accurately represent physiological breathing, as further justified in the device design section. The final reduction step ensures that Q0 is only 6% of Qmicro and is directed to the model inlet to reach the desired quite breathing rate, while the remaining 94% is expelled. The syringe pump simultaneously withdraws a total airflow of QS = 4Q0. Within each microchannel, the airflow is further subdivided in a manner mimicking bronchiolar bifurcation. The airway-on-chip design features individual airway trees with three bifurcating generations, includes both normal and constricted segments.
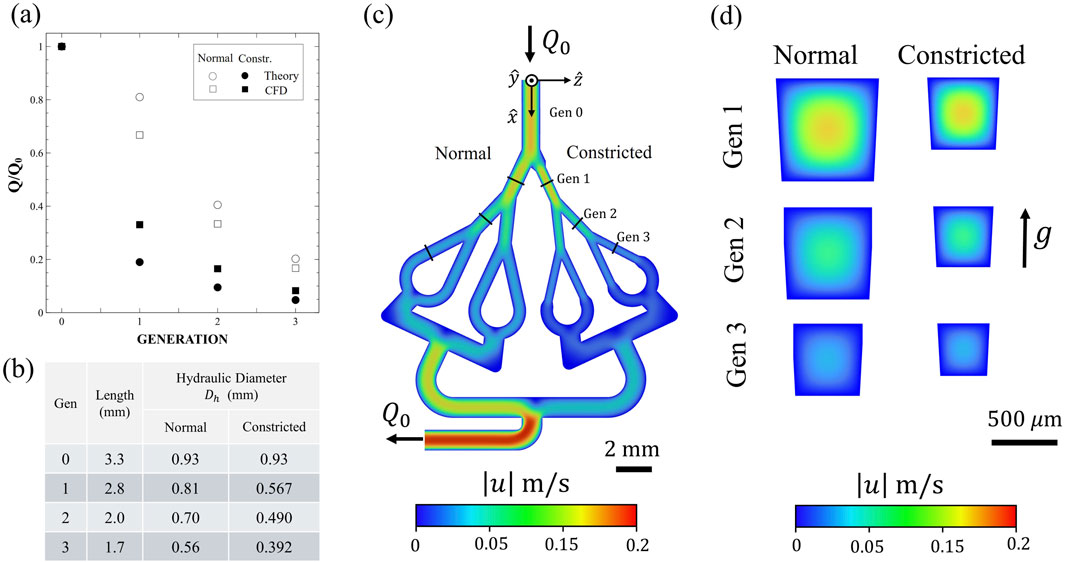
Figure 2. (a) Comparison between the theoretically (circular symbols) expected flow rate (based upon laminar Hagen-Poiseuille flow) to our Computational Fluid Dynamics (CFD) predictions (square symbols) at each airway generation. Comparison between the two airway conditions also presented: normal (empty symbols) and constricted (filled symbols) models. The values are normalized relative to that at Gen. 0. (b) Table summarizing airway dimensions, including generation length L and hydraulic diameter
Fluorescent particle aerosolization
Fluorescent polystyrene latex (PSL) particles are used to investigate size-dependent aerosol deposition (ρp = 1,050 kg/m3, Fluoromax red and green, fluorescent microspheres, 1% solid, Thermo Scientific). The use of PSL particles is well established in aerosol exposure studies involving airway-on-chip models (Bessler et al., 2023; Elias-Kirma et al., 2020; Fishler et al., 2015) due to their well-characterized physiochemical properties and charge acquisition during aerosolization. To examine the effects of particle size and electrostatic charge on deposition, distinct monodisperse PSL sizes are used:
Prior to exposure (see previous section), polystyrene latex (PSL) particles are suspended in deionized (DI) water at a high concentration (∼107–108 particles/mL) to ensure sufficient deposition data for ensemble statistics within reasonable exposure times (∼30–90 min, depending on particle size and charge conditions) (Fishler et al., 2015). The particle suspension is prepared at a weight concentration of 5%, carefully selected to maintain an aerosol with <1% aggregate formation. This assumption follows from the expected evaporation of water droplets exiting the atomizer, characterized by a count mean diameter of 0.35 μm and a geometric standard deviation of 2 μm, as specified by the manufacturer. The size distribution of the generated aerosol is assumed to follow a log-normal distribution with monodisperse spherical particles, consistent with previous studies (Fishler et al., 2015; Raabe, 1968). To minimize aerosol aggregation due to the high particle concentration, each suspension undergoes 30 min of sonication in an ultrasonic water bath (Elma Elmasonic S10) immediately before experimentation. To prevent particle sedimentation during experiments, a magnetic stirrer continuously operates inside the suspension container.
Deposition quantification
Following each aerosol exposure experiment, the bronchiole microchannels were examined using an inverted fluorescent microscope (Nikon Eclipse Ti) at varying magnifications (×2, ×10 and ×20) depending on particle size (i.e., 0.2 μm, 0.5 μm and 2 μm respectively), see Figures 1e,f. Using ANDOR Zyla sCMOS camera, we captured the entire model by stitching them together with zero overlap, using large free-shape images function. To reduce the image memory space, we used 4 × 4 binning. The quantification of deposition involved identifying the precise planar locations (x, z) of individual deposited fluorescent particles through digital processing of local intensity maxima using ImageJ software. Subsequently, the particles were counted with correspondence to their two-dimensional (2D) location and the sum of deposited particles were obtained for each airway generation. The deposition fraction was then calculated as the percentage of deposited particles in a specific airway generation out of the total number of deposited particles across the entire model. This approach enables us to determine the spatial distribution of particle deposition within the in vitro model.
Airway-on-chip
Device design
The in vitro airway-on-chip platform consists of four planar, symmetric airway path trees spanning four generations 0–3, as schematically shown in Figures 1, 2c. The tree design broadly mimics the deep bronchial airway branches (i.e., bronchioles) in the distal region of the conducting zone, with hydraulic diameters of <1 mm (Figures 1a,b). Each airway segment consists of square cross-sections, with dimensions summarized in Figure 2b. The chosen generation dimensions were based on morphometric measurements representative of typical length and diameter of an adult human lung, corresponding to generations 12–15, following the seminal works of Weibel (1963), Horsfield et al. (1971). These airway dimensions mimic the deep bronchial regions, referring to airways with a diameter smaller than 2 mm, which are associated with constricted diseases (McNulty et al., 2014). While the Weibel A model assumes idealized cylindrical airways, actual distal bronchiolar cross-sections in the human lung are often irregular and deviate from perfect circles (Hogg, 2004; Wang et al., 2020). In our airway-on-chip design, we employed square cross-sections (Figures 2c,d) as a deliberate engineering choice to enable precise microfabrication (Figure 1b), optical access for high-resolution imaging (Figures 1e,f), and consistent channel alignment across multiple generations. Importantly, flow behavior and particle transport in rectangular microchannels remain comparable to those in circular channels when the hydraulic diameter (defined as Dℎ = 4A/P, where A is the cross-sectional area and P is the wetted perimeter) and flow conditions (Re) are matched. To ensure physiologically relevant flow, we designed each generation as a square channel to have a hydraulic diameter Dℎ equal to that of the corresponding cylindrical segment in the Weibel model (see Figure 2b). While minor deviations in flow may occur near corners due to reduced velocities, these are localized and do not significantly affect the overall transport and deposition behavior of aerosols. Therefore, the underlying physics remain valid despite the geometric simplification. The first airway (Gen. 0, see Figure 1d and see top view Figure 2c) serves as the model’s inlet, ensuring fully-developed flow conditions over a distance exceeding the anticipated entrance length Le by more than two orders of magnitude at such low Reynolds numbers (
Approximating a constant inhalation condition may be assumed for modeling airflow in the deep lung regions during quiet breathing, as the Womersley number (Wo = fL2ρf/μf), which is a dimensionless expression of the oscillatory airflow frequency (f ∼ 0.25 Hz for quite breathing) in relation to viscous effects, remains well below unity in our bronchial region of interest (Wo ≪ 1), indicating quasi-steady flow conditions that can be approximated as steady flow conditions (Ménache et al., 2008). However, it is important to note that while the airflow can be considered steady, the absence of exhalation in the model may lead to overestimating particle retention, as particles that would otherwise exit the lungs during exhalation are not accounted for. The Gen. 0 segment terminates in a bifurcation with a 25° split angle. Beyond this point, the airway tree bifurcates symmetrically across all generations, maintaining a consistent 37° branching angle along the symmetry line (Ménache et al., 2008). The model branches into two distinct pathways: one representing normal anatomical bronchioles and the other featuring a 30% constriction, designed to mimic smaller airways or regions affected by obstructive pulmonary diseases (Figure 2). Airflow regulation is achieved using a syringe pump connected to the model outlet port (Figure 1b). The present design enables the investigation of electrostatic deposition by incorporating a conductive coating, while electrical grounding prevents charge buildup (Bessler et al., 2023).
Device fabrication
Models were fabricated using 3D-printed molds printed using a PRUSA SL1 3D printer and 3DM-ABS Orange Tough Resin), see Supplementary Material Supplementary Figures S1c and S1d. The models were filled with polydimethylsiloxane (PDMS), inspired by recent microfluidic lung airway models (Bessler et al., 2023; Elias-Kirma et al., 2020). PDMS, a well accepted material for microfluidic devices, was selected for its optical transparency and high flexibility, allowing for easy molding into complex shapes and structures. The printing settings included a layer height of 25 μm and an exposure time of 10 s. Post printing, the molds were cleaned with isopropyl alcohol, and to solidify the resin the molds were cured at 60 °C for 1 h under ultraviolet light (Formlabs Form Cure FH-CU-01 curer). After pouring the PDMS, the PDMS-filled molds were placed in desiccators for 1 hour to release trapped air bubbles. The PDMS models were peeled after 24 h of resting within the mold under ambient conditions. The outlet port for the syringe insertion (Figure 1b) was created using a 2 mm biopsy punch (Miltex, 3331).
Conductive Layering
The electrical conductivity of lung parenchymal tissue closely approximates that of saline water
To address this limitation, we applied a conductive indium tin oxide (ITO) coating to our microscope slide, following previous methodologies (Bessler et al., 2023). The ITO pattern was selectively deposited only in regions corresponding to the airway microchannels (see Supplementary Figure S2) to avoid interfering with the adhesion of the PDMS to the glass. The bonding process was performed via a 1 min plasma treatment (ETP, INC. Model BD-20). The ITO coating, provided by Huizhou Konshen Glass Co., Ltd., had a sheet resistivity of approximately
Computational fluid dynamics (CFD)
Numerical simulations (see Figure 2; Supplementary Figure S3b) were performed using the commercial solver Fluent 24.2 (ANSYS, Inc.), employing a steady-state laminar flow model with air as the working fluid (
Analytical and numerical modeling
To gain a deeper understanding of particle deposition within the model, we explore the dynamics of aerosol transport and apply Newton’s second law to charged particles and derive their expected trajectory within the mid-channel xy plane (see Figure 1d; Supplementary Figure S3b). The governing forces considered in this analysis include (i) electrostatic attraction due to induced charge (−keq2/4y2), where ke is the Coulomb constant, (ii) gravitational sedimentation (+mg), (iii) viscous Stokes drag (−vrel/B), where vrel is the relative velocity of the particle with respect to the surrounding streamwise flow velocity uf (whose profile varies along the y-direction) and B is the aerosol mechanical mobility, and (iv) Brownian motion (FB). Assuming no hygroscopic growth (i.e., constant particle mass m), the particle dynamics are described by the coupled equations of motion 1 and 2, presented below:
These equations capture the interplay between electrostatic, drag, gravitational, and diffusive transport mechanisms, providing a framework for predicting particle trajectories within the airway-on-chip model. Note that due to the electrostatic term (∝ y−2), the governing equation in the y-axis (Equation 1) is a nonlinear, second-order, non-homogeneous differential equation, such that a direct analytical solution
Explicit Euler method
We propose a canonical model featuring rectangular channels connected in series according to Weibel dimensions mimicking our in vitro model (Supplementary Figure S5). In each channel, the streamwise flow (uf) is approximated using the laminar Hagen–Poiseuille velocity profile (see Supplementary Figures S6 and S7, and derivations for flow in a square cross-section chanel) at low Reynolds number (Re ∼ 3), corresponding approximately to quiet breathing of a healthy person at these deep lung generations. The numerical simulations are initialized with an aerosol starting at a vertical distance of height
Non-dimensional analysis
Non-dimensional analysis is helpful for understanding aerosol transport and its leading physical mechanisms, in particular when electrostatic forces are involved. This approach expresses the dominant mechanisms in terms of characteristic length (Lc∼ D), velocity (Uc∼Q/A) and time (tc ∼ Lc/Uc) scales relevant to the bronchioles. We revisit the governing mechanisms of aerosol deposition in our model using dimensionless parameters (Sznitman, 2022; Tsuda et al., 2013). The deposition of small (approximately <0.5 µm) particles in the bronchioles occurs mainly via Brownian motion, characterized by the inverse Péclet number: Pe−1 = Ddiff/UcLc. For larger particles (>1 µm), bronchiolar deposition is primarily governed by gravitational sedimentation, quantified by the gravity number H = vter/Uc, where vter is the settling velocity given by vter = τpg, and τp represents the particle relaxation time. Concurrently, particle inertia is captured by the particle Stokes number: Stk = τpUc/Lc.
We then extend the discussion to when electrostatic charge is present. When Coulomb forces arising from particle–wall electrostatic interactions introduce an additional dimensionless group relevant to represent the Induced Charge versus the airflow convection (Finlay, 2001): Inc = (Bke/Uc) (q/Lc)2. By applying dimensional analysis to Newton’s second law, while omitting the noise introduced by Brownian motion (which can be superimposed subsequently), we obtain the non-dimensional governing equations for particle dynamics, Equations 3, 4, presented below:
where
Whereas the horizontal particle trajectory follows a straightforward path, showcasing how the particle velocity aligns with that of the surrounding flow (Equation 6), the non-linear equation in the vertical direction (Equation 5) remains more complex and requires further analysis.
We define the characteristic length scale
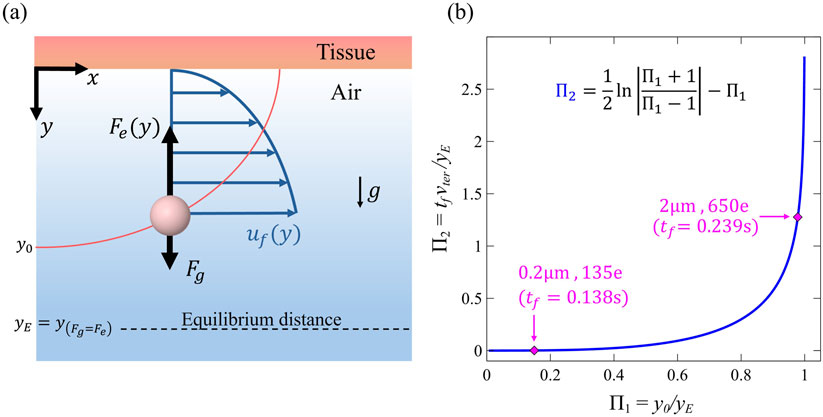
Figure 3. (a) Diagram illustrating an airborne particle near the wall of the model domain, released from initial distance y0. The particle is under the influence of electrostatic image charge forces
This non-dimensional equation is no longer a differential equation, making it significantly easier to solve and hence analyze particle behavior over time. We can write it dimensionally as:
This Equation 8 describes displacement through two distinct terms. The first term on the left represents the classic free-fall sedimentation over time, while the nonlinear logarithmic term captures the opposing electrostatic attraction counteracting gravitational pull. Despite this clear separation, the Equation 8 is implicit in
This result offers a simplified yet direct analytical expression for the vertical displacement of the particle trajectory, providing a fundamental framework to understand how electrostatic charge influences deposition dynamics under Stokes drag.
An alternative approach to Equation (8) can be formulated using a non-dimensional framework. By considering the deposition condition
Equation 10 provides a generalized expression for the final deposition time
Statistical analysis
We conducted independent experiments for the combination of each particle size and group (i.e., charged vs neutralized). A three-way analysis of variance (ANOVA) was used to examine the effect of the experiment settings. The independent variables were the aerosol size (i.e., dp ∈ {0.2, 0.5, 1.1} µm), the electrostatic charge group (i.e., q ∈ {Neutralized, Charged}), generation (i.e., Gen ∈ {G1,G2,G3}) and their interactions and state (constricted or Normal). The dependent variable was the Deposition Fraction (DF). In this work, we report both the p-values and the estimated effect sizes (β), where β represents the magnitude of change in DF and is expressed as a percentage to align with the units of DF itself. Additional details on the statistical analysis outcomes, beyond those presented in the Results and Discussion section, can be found in the Supplementary Material.
Results and discussion
In what follows, we present deposition data obtained from quantitative microscopy and numerical simulations, focusing on particle deposition in the microchannels. We extract from microscopy imaging the deposition fractions (DF) for each airway after completion of each exposure assay. A summary of the results is shown in Figure 4, where we present depositions according to particle sizes (Figure 4, rows) and regions: i.e., Constricted and Normal (Figure 4, columns). The histograms are normalized according to the total number of deposited particles. We discriminate between experiments where aerosols were neutralized (i.e., light gray histograms) and when we allow them bypass the neutralizer and maintain highly charged conditions (i.e., dark gray histograms). We note that the effect of lung generation (Gen. 1, 2 and 3) on deposition is not significant (p = 0.095), suggesting that it is not enough to conclude airway branching contributes to deposition in this particular model. This result is reasonable, as the airway generations examined in this study share similar characteristic length scales and flow velocities. However, in a larger model spanning additional airway generations, we would likely expect lung generation to exert a stronger influence on deposition patterns.
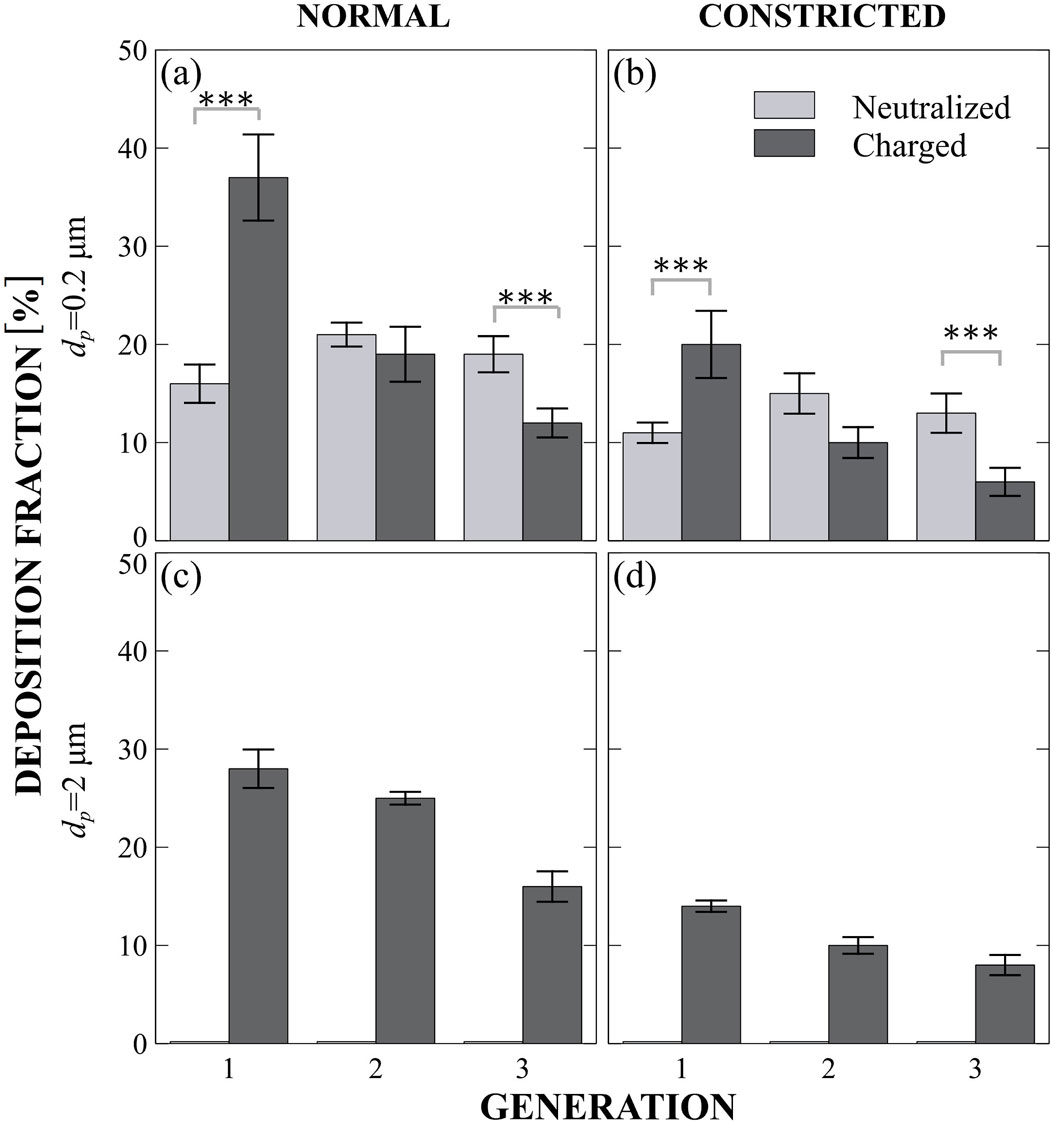
Figure 4. Four different cases of particles Deposition Fractions (DF) across airway generations in the in vitro model (see Figure 1). Rows distinguish between particle sizes (0.2 µm and 2 µm), and columns represent airway conditions (normal vs constricted). Light gray bars denote neutralized particle exposures, while dark gray bars indicate charged particle exposures. In each panel the x-axis indicates the airway generation, while the y-axis represents the corresponding DF. (a) Normal airway, dp=0.2 µm. (b) Constricted airway, dp=0.2 µm. (c) Normal airway, dp=2 µm. (d) Constricted airway, dp=2 µm.
To ensure that the model reflects physiological flow, we conducted CFD simulations where we observe Hagen–Poiseuille-like flow across all the generations. In Figure 2a, we notice a minor overestimation of flow reduction due to constriction in the theoretical analysis (circles) compared to the CFD results (squares). This discrepancy likely arises from the minor pressure drop added by changes in airway diameter, as well as the bifurcation angles, that are omitted in the theoretical model. Moreover, in our analysis, each airway is modeled as an ideal rectangular resistor (see Supplementary Material Supplementary Figure S3a), based on the dimensions shown in Figure 2b. However, further down the airway, both the CFD results and the theoretical analysis converge as anticipated.
We recall that in our experiments, we examine a mild constriction (30%) with a moderate reduction in flow, which approximates the airflow reduction in the constricted regions about two-thirds of that in an open healthy airway and hence less deposition expected there. The influence of lung state (Normal vs Constricted) on deposition is found to be highly significant (p < 0.0001, β = 8%), underscoring that airway narrowing indeed significantly alters deposition patterns. This finding aligns with clinical studies showing that constricted airways are associated with impaired particle transport and reduced deposition efficiency (Diaz et al., 2023; Xu et al., 2022). It is important to highlight how the characteristic length scale differs in the constricted region versus normal in the model (Figure 3d); a point we will revisit due to the greater sensitivity of electrostatic forces to length scale compared to other mechanisms. Particle size has a significant impact on deposition in the model (p < 0.0001, β = 14% for 0.2 μm–2 μm), confirming that different particle sizes lead to distinct DF. This finding is consistent with existing literature across the aerosol drug delivery community (Ijsebaert et al., 2001; Darquenne, 2012; ICRP, 1994).
Role of electrostatics versus diffusion
Upon examining the smallest particle size (0.2 μm), deposition primarily occurs due to Brownian motion (Figures 4a,b) since Pe−1 is eight times larger than H. When neutralized (light gray), deposition in the normal region remains constant, plateauing at ∼20% across the three generations. As expected, in the constricted region, there is less flow with available particles to deposit, leading to a lower deposition rate of around ∼12% per generation. However, when the particles are charged, a different deposition pattern emerges. Charge has a strong and highly significant effect on deposition fraction DF (p < 0.0001, β = 15%), indicating that electrostatic forces play a major role in particle behavior in our model. We observe a screening effect, where deposition is dominated in the first generation, and this effect extends to the rest of the model. Screening refers to particles that are unlikely to reach more distal regions because they first collide with nearby surfaces, effectively “screening” the regions farther downstream. This results in the streamwise depletion of particles. The phenomenon of “diffusional screening” is well known in the respiratory system (Felici et al., 2003; Hofemeier et al., 2016). Here, we clearly observe that the superposition of Brownian motion and electrostatic forces leads to screening in proximal airways. The interaction between charge and generation is highly significant (β ∼ −18% for Gen 2 and β ∼ −22% for Gen 3 with respect to Gen 1,p < 0.0001 for both), demonstrating how charge-driven screening influences DF. This effect has also been observed in a recent in vitro electrostatic study in the acinar region (Bessler et al., 2023). When comparing the charged cases between normal and constricted regions, the DF ratios remain similar, reflecting the mild degree of constriction applied in this particulate study. As a result, no major change in deposition patterns was observed. However, with more severe constriction, we would indeed expect enhanced electrostatic effects, as the reduced characteristic length (Lc) favor the electrostatic attraction (Inc⋅Pe
To gain further insight, we analyzed particle trajectories using numerical simulations. Figure 5 presents five representative cases that are anticipated to occur in our model, considering the given particle sizes and expected charges (Forsyth et al., 1998; Whitby and Liu, 1968). Each particle in our numerical simulations experiences the same four main forces (Figure 2a; Supplementary Figure S5b inset): an electrostatic force directed upward toward the top of the model (
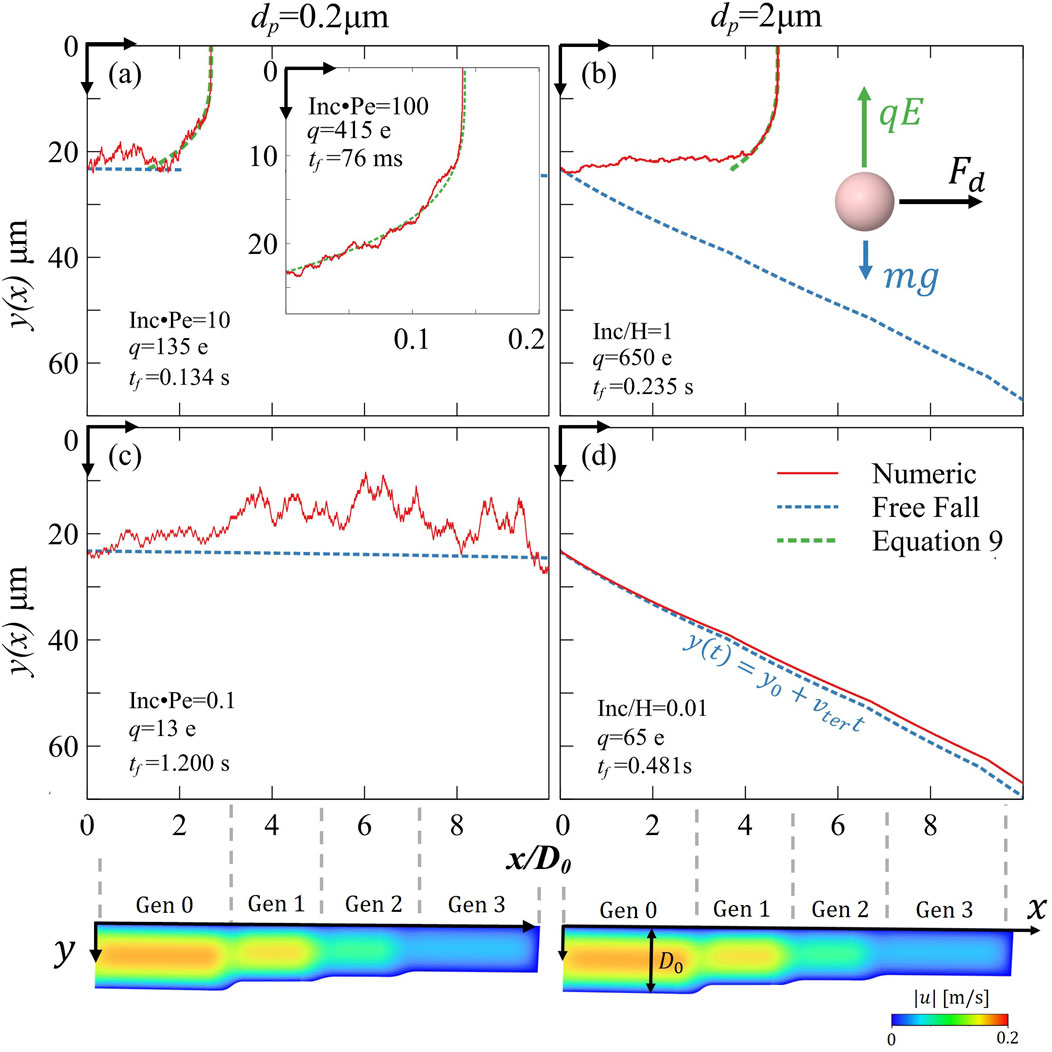
Figure 5. Numerical simulation of particle trajectories within the XY plane of the model. The red line represents the actual particle trajectory from the simulation (i.e., including electrostatics sedimentation and diffusion), while the dashed lines give a theoretical comparison: blue indicates the free-fall trajectory, green indicates electrostatics against drag (Equation 9). The vertical axis y(x) shows the particle’s distance from the top wall, while the horizontal axis x/D0 represents the normalized upstream direction across four generations. Below the horizontal axis, CFD velocity magnitudes for visual guide reference (see Supplementary Material Supplementary Figure S3b for CFD 3D view). The rows distinguish between cases where electrostatic forces dominate (first row) and cases where charge levels are insignificant (second row). In the lower left corner of each simulation, the chosen specific charge (q) and the resulting final time (tf) (indicating the time until deposition or model exiting) are displayed. The figure spans five orders of magnitude in the non-dimensional parameter for induced charge (Inc) compared to other mechanisms, illustrating the transition in dominant forces across different regimes: (a) Electrostatic forces are non-negligible for the particle motion Inc·Pe = 10, where subfigure shows even more dominating electrostatics: Inc·Pe = 100. (b) Inc/H = 1 implying that electrostatic and gravitational forces are almost balanced (subfigure illustrates the forces acting on the particle). (c) Inc·Pe = 0.1 showcasing a diffusion-dominated regime. (d) Inc/H = 0.01 showcasing a sedimentation-dominated regime.
Figure 5a highlights the dominance of electrostatic forces over diffusion (Inc⋅Pe ∼ 10 and inset Inc⋅Pe ∼ 100), whereas Figure 5c provides a comparison by illustrating deposition mechanisms when electrostatic effects are negligible in comparison to diffusion (Inc⋅Pe = 0.1). Note that all particles were released from a height y0, corresponding to 5% of the radius of generation 0, coinciding with the characteristic length scale (Lc ∼ y0). This choice satisfies the image charge assumption (y0 << D0) and follows the conventional approach for examining electrostatic effects through dimensionless analysis (Finlay, 2001). This distance y0 presents ∼10% of the total airway volume (or cross-section) populated by aerosols prone to deposition. We immediately observe a clear difference between the two cases for 0.2 µm particles. When electrostatic forces are superimposed with Brownian motion (Figure 5a), the particle trajectory is not entirely random; rather, it oscillates slightly around a dominant, sharply directed path toward the tissue, dictated by electrostatic attraction (dashed green line). This sharp path can be predicted using our analytic solution (Equation 9) which closely matches numerical simulations, with even greater agreement observed in the inset (Inc⋅Pe ∼ 100). This equation closely approximated the trajectories of small-mass particles (e.g., 0.2
The charged particles exhibit very short airborne times, with deposition occurring within tenths of a second (e.g., 0.134 s). In this regime (Inc·Pe ∼ 10), diffusion can either hinder or enhance deposition time when combined with electrostatic effects (Figure 5a). Our non-dimensional plot (Figure 2b), which also accounts for the minor influence of gravity, predicts a deposition time of tf = 0.138 s, closely matching with the numerical simulations. As implied by Equation 9, the higher charge presented in Figure 5a inset, results in even shorter deposition times, reaching approximately 75 ms. In contrast, neutralized particles (Figure 5c) remained airborne for over a second and ultimately escaped the model, despite reaching 10 µm away from the tissue due to Brownian motion. A slightly higher charge would likely have ensured deposition and close this gap. These results highlight how electrostatics effects accelerate screening behavior and enhance deposition efficiency in the proximal generations of the bronchioles.
Equation (9) further highlights the critical role of mechanical mobility B, derived from the particle’s size and shape. Mechanical mobility playing a role as significant as the charge squared itself. This finding aligns well with clinical in vivo observations in humans, where DF for similar sizes (i.e. 0.3, 0.6 and 1 µm) has been found to follow a similar scaling relationship,
We acknowledge that our airway-on-chip platform is based on a planar geometry, which does not fully capture the complex three-dimensional architecture of the human lung. However, the two primary mechanisms examined in this study, electrostatic attraction and diffusion, are largely independent of spatial orientation. Electrostatic forces follow electric field lines toward the nearest surface, while diffusion is isotropic and random. Therefore, in clinically relevant scenarios involving small, charged particles under low to moderate flow conditions, the deposition patterns observed in our planar model are anticipated to approximate sufficiently closely those in a realistic 3D airway structure. Nevertheless, we recognize that in regions with higher airflow velocities (e.g., the proximal bronchi), inertial effects may become more pronounced and sensitive to airway geometry. Additionally, in the distal bronchioles, gravitational settling becomes increasingly important for heavier particles, and the 3D orientation and curvature of the airways are likely to influence deposition. This is addressed below.
Role of electrostatic versus sedimentation
We now turn our attention to the largest particles, i.e. 2 μm. Recalling that H·Pe ∼ 235, these particles, when neutralized, are governed almost entirely by gravitational pull. In this regime, the planar orientation of our model becomes particularly relevant, as gravity acts in a fixed direction, and the absence of 3D airway curvature may influence the observed deposition patterns for clinical interpretation of the results. In order to distinguish the electrostatic forces from gravitational effects in our experiments, we conducted experiments with the model turned upside-down such that the ITO-coated surface is at the top, hence electrostatic may be interpreted as a “lifting force” against the downward pull of gravity. As expected, in the neutralized case, no deposition occurred on the top even when we extended the exposure time (see missing bars in Figures 4c,d). To validate this, as discussed in the Supplementary Material, we repeated the experiment with the model flipped to align with gravity and observed deposition biased by gravity direction, both with and without charge yields significant deposition which is hard to distinguish (see Supplementary Material Supplementary Figure S4c and S4d). This confirms the significant role of gravity in the bronchiolar region, as suggested previously (Ma and Darquenne, 2012). As expected, gravitational deposition occurs only in the direction of the gravitational pull. This can be visually shown in our numerical analysis of particle trajectories (see Figure 5d, Inc/H ∼ 0.01) where particles do not reach deposition at the top of the model when electrostatic forces and diffusion are absent. The particle follows its free-fall trajectory (see Figure 5d, dashed blue line) away from the tissue, with only slight deviations caused by weak diffusion. Its airborne time is approximately half a second (0.48 s), which is shorter compared to the 0.2 µm diffusive particle (1.200 s). This difference arises because the free-falling particle enters closer to the channel centerline, leading it to gain horizontal velocity as it moves into the high-speed region of the parabolic Poiseuille flow profile, resulting in a faster outward convection.
When these same 2 μm particles are charged, they have a chance to deposit. A distinct electrostatic-driven screening effect emerges leading to deposition within the bronchial model (Figure 4b). This suggests that electrostatic forces are enough to counteract gravity, encouraging greater bronchiolar deposition, even in regions where gravitational settling is unlikely to occur. We recall that the characteristic length scale
Although electrostatics generally increased overall targeted bronchiolar deposition, it is important to note that across all tested combinations of charge states (neutralized and charged) and particle sizes (0.2, 0.5, and 2 µm), no significant increase in deposition was observed within the constricted regions compared to the normal airways. This finding indicates that, within the limited range of particle sizes and electrostatic charge levels explored in this study, we did not identify conditions that preferentially enhance deposition in constricted regions. Specifically, for 2 µm particles, deposition in the constricted airway was consistently about half of that observed in the normal airway, regardless of charge. These results underscore the ongoing challenge of achieving efficient, targeted aerosol delivery to the bronchioles, especially in distinguishing deposition behavior between constricted and non-constricted geometries. Future studies should explore a broader range of particle sizes, electrostatic charge levels, and airway constriction severities, as this work scope focused mainly on the effect of electrostatics in the bronchiole region and consider only one case of a mild constriction. Given that electrostatic forces become increasingly dominant at smaller length scales, we hypothesize that a promising window of opportunity remains to be uncovered—one that could enable selective targeting of diseased airways through optimized charge and size combinations.
In Figure 5b, we examine the particle trajectory under conditions where electrostatic and gravitational forces are of comparable magnitude (Inc ∼ H), as suggested by Equation (8). The simulation reveals that charged particles can ascend against gravity and deposit on airway surfaces that would otherwise remain unaffected. This behavior aligns with our in vitro findings (Figure 4a), where charged particles exhibited enhanced deposition compared to their neutralized counterparts. Notably, since the release height
As a final step, we demonstrated the non-dimensional dependency (Figure 2b) that applies to all deposition scenarios involving electrostatic forces versus gravity. The result of our theoretical non-dimensional plot perfectly aligns with the deterministic trajectory and the one predicted by the numerical simulation, yielding a deposition time of
Conclusion
Using a novel in vitro airway-on-chip model, we systematically explored how electrostatic charge alters deposition patterns compared to classical mechanisms such as Brownian motion and gravitational sedimentation. Our results support that charge plays a dominant role in aerosol deposition at the bronchiole length scale, particularly for smaller aerosols, where electrostatic attraction accelerates deposition and causes diffusion screening to occur earlier. For neutralized larger particles, gravity primarily dictates a downward trajectory, but when charged, electrostatic forces influence their motion by defying gravity and promoting deposition in wider areas such as the “ceilings” of the airway wall. Hence, an increase in charge enhances the effective deposition region in bronchioles for 2 µm particles, while for smaller particles, it accelerates their deposition by electrostatic screening in this region. Additionally, our numerical simulations and analytical derivations offer a valuable step for overcoming the complexity of introducing electrostatics into particle dynamics. They provide a visual representation of the transport mechanisms and highlight key findings, such how the aerosols’ mechanical mobility can counteract electrostatic attraction, potentially allowing aerosols to penetrate deeper into the distal lung regions. These findings have relevant implications for inhaled drug delivery, suggesting that electrostatic manipulation along with size could serve as a tunable parameters for optimizing deposition in targeted airway regions, particularly where traditional aerodynamic strategies fail.
This suggests the need for further investigation into a broader variety of constriction severity and charge-diameter combinations that may selectively favor deposition in diseased airways, offering a potential avenue that may improve therapeutic targeting in obstructive lung diseases beyond the limited cases examined in this study (Bessler and Sznitman, 2024). An open question remains regarding the spatial distribution and the accumulative effect of electrostatics throughout the lungs. Some studies suggest that electrostatic forces may enhance deposition in the upper airways, raising concerns that charged particles may be lost before reaching critical therapeutic regions like the bronchioles and alveoli (Melandri et al., 1983; Koullapis et al., 2016; Azhdarzadeh et al., 2014). Alternatively, the finding here may suggest that the bronchioles themselves may act as a screening mechanism, limiting deposition in the deeper acinar regions. To fully address this question, multiscale models are needed to identify the window of opportunity in which charged aerosols can provide therapeutic benefit. Although the effect of electrical charge has been recognized for nearly a century (Wilson, 1947), the role of electrostatic forces in pulmonary deposition remains fundamentally underexplored. Overshadowed by more widely studied mechanisms such as impaction, sedimentation, and diffusion, electrostatics has often received limited attention, potentially hindering its broader application in aerosol drug delivery. To fully harness its potential, a deeper understanding is needed of the conditions under which electrostatic forces can meaningfully influence particle behavior throughout the respiratory tract. Addressing these overarching questions may require the development of multiscale lung models capable of capturing the cumulative effects of electrostatic interactions across multiple airway generations (Kassinos and Sznitman, 2024). Future studies should focus on expanding the range of charge distributions, incorporating asymmetric airway geometries, and exploring alternative particle morphologies, including fibers and aggregates, to better capture real-world deposition dynamics. Ultimately, this work reinforces the importance of electrostatics as a fundamental mechanism in pulmonary aerosol transport.
Data availability statement
The original contributions presented in the study are included in the article/Supplementary Material, further inquiries can be directed to the corresponding authors.
Author contributions
RB: Writing – review and editing, Writing – original draft, Conceptualization, Project administration, Software, Supervision, Data curation, Methodology, Visualization, Investigation. JS: Writing – review and editing, Writing – original draft, Supervision. TM: Writing – review and editing, Software. RF: Writing – review and editing. OF: Writing – review and editing, Visualization, Software. SD: Writing – review and editing, Investigation, Data curation. TD: Writing – review and editing, Investigation, Data curation. BK: Writing – review and editing, Software. KK: Writing – review and editing. NK: Writing – review and editing.
Funding
The author(s) declare that financial support was received for the research and/or publication of this article. This research was supported by the Israel Science Foundation (Grant no. 1840/21) and the Nichia Corporation via a Tokushima University–Technion grant. The funder was not involved in the study design, collection, analysis, interpretation of data, the writing of this article, or the decision to submit it for publication.
Acknowledgments
The authors thank Morane Elbaz, Leo Ibghi, Daniel Malka and Amjad Okasha, for helpful support with experiments.
Conflict of interest
The authors declare that the research was conducted in the absence of any commercial or financial relationships that could be construed as a potential conflict of interest.
Generative AI statement
The author(s) declare that no Generative AI was used in the creation of this manuscript.
Any alternative text (alt text) provided alongside figures in this article has been generated by Frontiers with the support of artificial intelligence and reasonable efforts have been made to ensure accuracy, including review by the authors wherever possible. If you identify any issues, please contact us.
Publisher’s note
All claims expressed in this article are solely those of the authors and do not necessarily represent those of their affiliated organizations, or those of the publisher, the editors and the reviewers. Any product that may be evaluated in this article, or claim that may be made by its manufacturer, is not guaranteed or endorsed by the publisher.
Supplementary material
The Supplementary Material for this article can be found online at: https://www.frontiersin.org/articles/10.3389/fphys.2025.1621177/full#supplementary-material
References
Ari A., Fink J. B. (2020). Recent advances in aerosol devices for the delivery of inhaled medications. Expert Opin. Drug Deliv. 17 (2), 133–144. doi:10.1080/17425247.2020.1712356PubMed Abstract | CrossRef Full Text | Google Scholar
Asgharian B., Yu C. P. (1988). Deposition of inhaled fibrous particles in the human lung. J. Aerosol Med. Depos. Clear. Eff. Lung 1 (1), 37–50. doi:10.1089/jam.1988.1.37CrossRef Full Text | Google Scholar
Azhdarzadeh M., Olfert J. S., Vehring R., Finlay W. H. (2014). Effect of electrostatic charge on oral-extrathoracic deposition for uniformly charged monodisperse aerosols. J. Aerosol Sci. 68, 38–45. doi:10.1016/j.jaerosci.2013.11.002CrossRef Full Text | Google Scholar
Bailey A. G., Hashish A. H., Williams T. J. (1998). Drug delivery by inhalation of charged particles. J. Electrostat. 44 (1–2), 3–10. doi:10.1016/S0304-3886(98)00017-5CrossRef Full Text | Google Scholar
Balachandran W., Machowski W., Gaura E., Hudson C., Systems E. (1997). Control of drug aerosol in human airways using electrostatic forces. J. Electrostat. 3886 (97), 579–584. doi:10.1016/s0304-3886(97)00106-xCrossRef Full Text | Google Scholar
Bessler R., Sznitman J. (2024). The potential of leveraging electrostatics for improved inhaled drug delivery to the lungs. Front. Med. Eng. 1 (January), 1298251–1298258. doi:10.3389/fmede.2023.1298251CrossRef Full Text | Google Scholar
Bessler R., Bhardwaj S., Malka D., Fishler R., Sznitman J. (2023). Exploring the role of electrostatic deposition on inhaled aerosols in alveolated microchannels. Sci. Rep. 13 (1), 23069–14. doi:10.1038/s41598-023-49946-wPubMed Abstract | CrossRef Full Text | Google Scholar
Choi J., LeBlanc L. J., Choi S., Haghighi B., Hoffman E. A., O'Shaughnessy P., et al. (2019). Differences in particle deposition between members of imaging-based asthma clusters. J. Aerosol Med. Pulm. Drug Deliv. 32 (4), 213–223. doi:10.1089/jamp.2018.1487PubMed Abstract | CrossRef Full Text | Google Scholar
Cohen B. S., Xiong J. Q., Asgharian B., Ayres L. (1995). Deposition of inhaled charged ultrafine particles in a simple tracheal model. J. Aerosol Sci. 26 (7), 1149–1160. doi:10.1016/0021-8502(95)00039-fCrossRef Full Text | Google Scholar
Cohen B. S., Xiong J. Q., Fang C.-P., Li W. (1998). Deposition of charged particles on lung airways. Health Phys. 74 (5), 554–560. doi:10.1097/00004032-199805000-00002PubMed Abstract | CrossRef Full Text | Google Scholar
Darquenne C. (2012). Aerosol deposition in health and disease. J. Aerosol Med. Pulm. Drug Deliv. 25 (3), 140–147. doi:10.1089/jamp.2011.0916PubMed Abstract | CrossRef Full Text | Google Scholar
Das P., Nof E., Amirav I., Kassinos S. C., Sznitman J. (2018). Targeting inhaled aerosol delivery to upper airways in children: insight from computational fluid dynamics (CFD). PLoS One 13 (11), e0207711–e0207720. doi:10.1371/journal.pone.0207711PubMed Abstract | CrossRef Full Text | Google Scholar
Davis J. M. G., Bolton R. E., Douglas A. N., Jones A. D., Smith T. (1988). Effects of electrostatic charge on the pathogenicity of chrysotile asbestos. Br. J. Ind. Med. 45 (5), 292–299. doi:10.1136/oem.45.5.292PubMed Abstract | CrossRef Full Text | Google Scholar
de Boer A. H., Hagedoorn P., Hoppentocht M., Buttini F., Grasmeijer F., Frijlink H. W. (2017). Dry powder inhalation: past, present and future. Expert Opin. Drug Deliv. 14 (4), 499–512. doi:10.1080/17425247.2016.1224846PubMed Abstract | CrossRef Full Text | Google Scholar
Diaz A. A., Orejas J. L., Grumley S., Nath H. P., Wang W., Dolliver W. R., et al. (2023). Airway-occluding mucus plugs and mortality in patients with chronic obstructive pulmonary disease. JAMA 329 (21), 1832–1839. doi:10.1001/jama.2023.2065PubMed Abstract | CrossRef Full Text | Google Scholar
Donaldson K., Brown G. M., Brown D. M., Bolton R. E., Davis J. M. G. (1989). Inflammation generating potential of long and short fibre amosite asbestos samples. Br. J. Ind. Med. 46 (4), 271–276. doi:10.1136/oem.46.4.271PubMed Abstract | CrossRef Full Text | Google Scholar
Elias-Kirma S., Artzy-Schnirman A., Das P., Heller-Algazi M., Korin N., Sznitman J. (2020). In situ-like aerosol inhalation exposure for cytotoxicity assessment using airway-on-chips platforms. Front. Bioeng. Biotechnol. 8 (February), 91–13. doi:10.3389/fbioe.2020.00091PubMed Abstract | CrossRef Full Text | Google Scholar
Felici M., Filoche M., Sapoval B. (2003). Diffusional screening in the human pulmonary acinus. J. Appl. Physiol. 94 (5), 2010–2016. doi:10.1152/japplphysiol.00913.2002PubMed Abstract | CrossRef Full Text | Google Scholar
Finlay W. H. (2001). The mechanics of inhaled pharmaceutical aerosols: an introduction. San Diego: Academic Press.
Finlay W. H. (2021). Deposition of aerosols in the lungs: particle characteristics. J. Aerosol Med. Pulm. Drug Deliv. 34 (4), 213–216. doi:10.1089/jamp.2021.29040.whfPubMed Abstract | CrossRef Full Text | Google Scholar
Fishler R., Hofemeier P., Etzion Y., Dubowski Y., Sznitman J. (2015). Particle dynamics and deposition in true-scale pulmonary acinar models. Sci. Rep. 5, 14071–11. doi:10.1038/srep14071PubMed Abstract | CrossRef Full Text | Google Scholar
Forsyth B., Liu B. Y. H., Romay F. J. (1998). Particle charge distribution measurement for commonly generated laboratory aerosols. Aerosol Sci. Technol. 28 (6), 489–501. doi:10.1080/02786829808965540CrossRef Full Text | Google Scholar
Harris R., Timbrell V. (1975). The influence of fibre shape in lung deposition-mathematical estimates. Inhaled Part. 4 Pt 1, 75–89.PubMed Abstract | Google Scholar
Hinds W. C., Zhu Y. (2022). “Electrical properties,” in Aerosol technology: properties, behavior, and measurement of airborne particles. (Hoboken: John Wiley and Sons), 277–304.
Hofemeier P., Sznitman J. (2015). Revisiting pulmonary acinar particle transport: convection, sedimentation, diffusion, and their interplay. J. Appl. Physiol. 118 (11), 1375–1385. doi:10.1152/japplphysiol.01117.2014PubMed Abstract | CrossRef Full Text | Google Scholar
Hofemeier P., Shachar-Berman L., Tenenbaum-Katan J., Filoche M., Sznitman J. (2016). Unsteady diffusional screening in 3D pulmonary acinar structures: from infancy to adulthood. J. Biomechanics 49 (11), 2193–2200. doi:10.1016/j.jbiomech.2015.11.039PubMed Abstract | CrossRef Full Text | Google Scholar
Hogg J. C. (2004). Pathophysiology of airflow limitation in chronic obstructive pulmonary disease. Lancet 364 (9435), 709–721. doi:10.1016/S0140-6736(04)16900-6PubMed Abstract | CrossRef Full Text | Google Scholar
Horsfield K., Dart G., Olson D. E., Filley G. F., Cumming G. (1971). Models of the human bronchial tree. J. Appl. Physiol. 31 (2), 207–217. doi:10.1152/jappl.1971.31.2.207PubMed Abstract | CrossRef Full Text | Google Scholar
Ijsebaert J. C., Geerse K. B., Marijnissen J. C. M., Lammers J.-W. J., Zanen P. (2001). Electro-hydrodynamic atomization of drug solutions for inhalation purposes. J. Appl. Physiol. 91 (6), 2735–2741. doi:10.1152/jappl.2001.91.6.2735PubMed Abstract | CrossRef Full Text | Google Scholar
Kassinos S. C., Sznitman J. (2024). Multiscale modeling of respiratory transport phenomena and intersubject variability. Annu. Rev. Fluid Mech. 57, 141–165. doi:10.1146/annurev-fluid-031424-103721CrossRef Full Text | Google Scholar
Kim V., Criner G. J. (2013). Chronic bronchitis and chronic obstructive pulmonary disease. Am. J. Respir. Crit. Care Med. 187 (3), 228–237. doi:10.1164/rccm.201210-1843CIPubMed Abstract | CrossRef Full Text | Google Scholar
Kleinstreuer C., Zhang Z. (2010). Airflow and particle transport in the human respiratory system. Annu. Rev. Fluid Mech. 42, 301–334. doi:10.1146/annurev-fluid-121108-145453CrossRef Full Text | Google Scholar
Kleinstreuer C., Zhang Z., Li Z. (2008). Modeling airflow and particle transport/deposition in pulmonary airways. Respir. Physiol. Neurobiol. 163 (1–3), 128–138. doi:10.1016/j.resp.2008.07.002PubMed Abstract | CrossRef Full Text | Google Scholar
Koullapis P. G., Kassinos S. C., Bivolarova M. P., Melikov A. K. (2016). Particle deposition in a realistic geometry of the human conducting airways: effects of inlet velocity profile, inhalation flowrate and electrostatic charge. J. Biomech. 49 (11), 2201–2212. doi:10.1016/j.jbiomech.2015.11.029PubMed Abstract | CrossRef Full Text | Google Scholar
Kwok P. C. L., Chan H. K. (2008). Effect of relative humidity on the electrostatic charge properties of dry powder inhaler aerosols. Pharm. Res. 25 (2), 277–288. doi:10.1007/s11095-007-9377-2PubMed Abstract | CrossRef Full Text | Google Scholar
Kwok P. C. L., Chan H.-K. (2009). Electrostatics of pharmaceutical inhalation aerosols. J. Pharm. Pharmacol. 61 (12), 1587–1599. doi:10.1211/jpp/61.12.0002PubMed Abstract | CrossRef Full Text | Google Scholar
Ma B., Darquenne C. (2012). Aerosol bolus dispersion in acinar airways - influence of gravity and airway asymmetry. J. Appl. Physiol. 113 (3), 442–450. doi:10.1152/JAPPLPHYSIOL.01549.2011PubMed Abstract | CrossRef Full Text | Google Scholar
McNulty W., Usmani O. S. (2014). Techniques of assessing small airways dysfunction. Eur. Clin. Respir. J. 1 (1), 25898. doi:10.3402/ecrj.v1.25898PubMed Abstract | CrossRef Full Text | Google Scholar
Melandri C., Tarroni G., Prodi V., De Zaiacomo T., Formignani M., Lombardi C. C. (1983). Deposition of charged particles in the human airways. J. Aerosol Sci. 14 (5), 657–669. doi:10.1016/0021-8502(83)90070-8CrossRef Full Text | Google Scholar
Ménache M. G., Hofmann W., Ashgarian B., Miller F. J. (2008). Airway geometry models of children’s lungs for use in dosimetry modeling. Inhal. Toxicol. 20 (2), 101–126. doi:10.1080/08958370701821433PubMed Abstract | CrossRef Full Text | Google Scholar
Oakes J. M., Amirav I., Sznitman J. (2023). Pediatric inhalation therapy and the aerodynamic rationale for age-based aerosol sizes. Expert Opin. Drug Deliv. 00 (00), 1037–1040. doi:10.1080/17425247.2023.2209314PubMed Abstract | CrossRef Full Text | Google Scholar
Osman H., Castle G. S. P., Adamiak K. (2015). Numerical study of particle deposition in electrostatic painting near a protrusion or indentation on a planar surface. J. Electrostat. 77, 58–68. doi:10.1016/j.elstat.2015.07.005CrossRef Full Text | Google Scholar
Pedley T. J. (1977). Pulmonary fluid dynamics. Annu. Rev. Fluid Mech. 9, 229–274. doi:10.1146/annurev.fl.09.010177.001305CrossRef Full Text | Google Scholar
Raabe O. G. (1968). The dilution of monodisperse suspensions for aerosolization. Am. Ind. Hyg. Assoc. J. 29 (5), 439–443. doi:10.1080/00028896809343031PubMed Abstract | CrossRef Full Text | Google Scholar
Shachar-Berman L., Ostrovski Y., De Rosis A., Kassinos S., Sznitman J. (2018). Transport of ellipsoid fibers in oscillatory shear flows: implications for aerosol deposition in deep airways. Eur. J. Pharm. Sci. 113, 145–151. doi:10.1016/j.ejps.2017.09.023PubMed Abstract | CrossRef Full Text | Google Scholar
Stahlhofen W., Rudolf G., James A. C. (1989). Intercomparison of experimental regional aerosol deposition data. J. Aerosol Med. Depos. Clear. Eff. Lung 2 (3), 285–308. doi:10.1089/jam.1989.2.285CrossRef Full Text | Google Scholar
Sznitman J. (2013). Respiratory microflows in the pulmonary acinus. J. Biomech. 46 (2), 284–298. doi:10.1016/j.jbiomech.2012.10.028PubMed Abstract | CrossRef Full Text | Google Scholar
Sznitman J. (2022). Revisiting airflow and aerosol transport phenomena in the deep lungs with microfluidics. Chem. Rev. 122 (7), 7182–7204. doi:10.1021/acs.chemrev.1c00621PubMed Abstract | CrossRef Full Text | Google Scholar
Timbrell V. (1965). Human exposure to asbestos: dust controls and standards. The inhalation of fibrous dusts. Ann. N. Y. Acad. Sci. 132 (1), 255–273. doi:10.1111/j.1749-6632.1965.tb41107.xPubMed Abstract | CrossRef Full Text | Google Scholar
Tsuda A., Henry F. S. S., Butler J. P. P. (2013). Particle transport and deposition: basic physics of particle kinetics. Compr. Physiol. 3 (4), 1437–1471. doi:10.1002/cphy.c100085PubMed Abstract | CrossRef Full Text | Google Scholar
Virchow J. C., Poli G., Herpich C., Kietzig C., Ehlich H., Braeutigam D., et al. (2018). Lung deposition of the dry powder fixed combination beclometasone dipropionate plus formoterol fumarate using NEXThaler ® device in healthy subjects, asthmatic patients, and COPD patients. J. Aerosol Med. Pulm. Drug Deliv. 31 (5), 269–280. doi:10.1089/jamp.2016.1359PubMed Abstract | CrossRef Full Text | Google Scholar
Wang C., Zhou J., Wang J., Li S., Fukunaga A., Yodoi J., et al. (2020). Progress in the mechanism and targeted drug therapy for COPD. Signal Transduct. Target. Ther. 5 (1), 248. doi:10.1038/s41392-020-00345-xPubMed Abstract | CrossRef Full Text | Google Scholar
Whitby K. T., Liu B. Y. H. (1968). Polystyrene aerosols-electrical charge and residue size distribution. Atmos. Environ. 2 (2), 103–116. doi:10.1016/0004-6981(68)90026-7CrossRef Full Text | Google Scholar
Wilson I. B. (1947). The deposition of charged particles in tubes, with reference to the retention of therapeutic aerosols in the human lung. J. Colloid Sci. 2 (2), 271–276. doi:10.1016/0095-8522(47)90028-7CrossRef Full Text | Google Scholar
Xi J., Si X., Longest W. (2014). Electrostatic charge effects on pharmaceutical aerosol deposition in human nasal-laryngeal airways. Pharmaceutics 6 (1), 26–35. doi:10.3390/pharmaceutics6010026PubMed Abstract | CrossRef Full Text | Google Scholar
Xu F., Vasilescu D. M., Kinose D., Tanabe N., Ng K. W., Coxson H. O., et al. (2022). The molecular and cellular mechanisms associated with the destruction of terminal bronchioles in COPD. Eur. Respir. J. 59 (5), 2101411. doi:10.1183/13993003.01411-2021PubMed Abstract | CrossRef Full Text | Google Scholar
Keywords: airway-on-chip, pulmonary drug delivery, obstructive pulmonary disease, non-dimensional analysis, aerosol inhalation, electrostatics
Citation: Bessler R, Mekler T, Fishler R, Farhana O, Dhatavkar S, Daniel T, Kalifa B, Koshiyama K, Korin N and Sznitman J (2025) Small scale electrostatically-driven aerosol deposition in airway-on-chip models of bronchial constriction. Front. Physiol. 16:1621177. doi: 10.3389/fphys.2025.1621177
Received: 30 April 2025; Accepted: 14 August 2025;
Published: 16 September 2025.
Edited by:
Aranyak Chakravarty, Jadavpur University, IndiaReviewed by:
Jingliang Dong, Victoria University, AustraliaEknath Kole, Kavayitri Bahinabai Chaudhari North Maharashtra University, India
Copyright © 2025 Bessler, Mekler, Fishler, Farhana, Dhatavkar, Daniel, Kalifa, Koshiyama, Korin and Sznitman. This is an open-access article distributed under the terms of the Creative Commons Attribution License (CC BY). The use, distribution or reproduction in other forums is permitted, provided the original author(s) and the copyright owner(s) are credited and that the original publication in this journal is cited, in accordance with accepted academic practice. No use, distribution or reproduction is permitted which does not comply with these terms.
*Correspondence: Ron Bessler, c3JvbmJlc3NAY2FtcHVzLnRlY2huaW9uLmFjLmls; Josué Sznitman, c3puaXRtYW5AYm0udGVjaG5pb24uYWMuaWw=