 Mattias Karlsson
 Felix Plappert
 Pyotr G. Platonov
 Sten Östenson
 Mikael Wallman
 Frida Sandberg
- 1Department of Systems and Data Analysis, Fraunhofer-Chalmers Centre, Gothenburg, Sweden
- 2Department of Biomedical Engineering, Lund University, Lund, Sweden
- 3Department of Cardiology, Clinical Sciences, Lund University, Lund, Sweden
- 4Department of Internal Medicine and Department of Clinical Physiology, Central Hospital Kristianstad, Kristianstad, Sweden
Introduction: The refractory period and conduction delay of the atrioventricular (AV) node play a crucial role in regulating the heart rate during atrial fibrillation (AF). Beat-to-beat variations in these properties are known to be induced by the autonomic nervous system (ANS) but have previously not been assessable during AF. Assessing these could provide novel information for improved diagnosis, prognosis, and treatment on an individual basis.
Methods: To estimate AV nodal conduction properties with beat-to-beat resolution, we propose a methodology comprising a network model of the AV node, a particle filter, and a smoothing algorithm. The methodology was evaluated using simulated data and using synchronized electrogram (EGM) and ECG recordings from five patients in the intracardiac atrial fibrillation database. The methodology’s ability to quantify ANS-induced changes in AV node conduction properties was evaluated by analyzing ECG data from 21 patients in AF undergoing a tilt test protocol.
Results: The estimated refractory period and conduction delay matched the simulated ground truth based on ECG recordings with a mean absolute error (
Discussion: These results suggest that beat-to-beat estimation of AV nodal conduction properties during AF from ECG is feasible, with different levels of uncertainty, and that the estimated properties agree with expected AV nodal modulation.
1 Introduction
Atrial fibrillation (AF), characterized by disorganized electrical activity in the atria, is the most common sustained cardiac arrhythmia with an estimated prevalence between 2% and 4% globally (Benjamin et al., 2019). The disorganized electrical activity in the atria leads to rapid and irregular contraction of the atria and ventricles, resulting in an increased risk of mortality, predominantly due to heart failure or stroke (Andrew et al., 2013). Despite extensive research on AF, very little robust evidence exists to inform the best type and intensity of rate control treatment on an individual level (Hindricks et al., 2020; Al-Khatib et al., 2014).
The atrioventricular (AV) node normally functions as the sole electrical connection between the atria and ventricles. During AF, the AV node plays a crucial role in protecting the ventricles from the rapid and irregular impulses originating in the atria. This function is accomplished through two distinct pathways; the fast pathway (FP) and the slow pathway (SP), which converge at the Bundle of His (Kurian et al., 2010). The FP conducts impulses faster than SP but has a longer refractory period. Depending on the refractoriness of its pathways, the AV node can either block an incoming impulse or send it through with a conduction delay. Therefore, the refractory period and conduction delay of the two pathways – here denoted
The autonomic nervous system (ANS) has been shown to contribute to the initiation and maintenance of AF (Shen and Zipes, 2014), suggesting that inter-patient variability in ANS activity might influence individual responses to AF treatment. During normal sinus rhythm, the ANS affects the heart rate primarily through changes to the sinus node automaticity, which can be quantified using heart rate variability (Shaffer and Ginsberg, 2017). However, during AF, the disorganized electrical activity in the atria overrides the organized electrical signals from the sinus node, preventing it from regulating the heart rate. Instead, the ANS affects the heart rate primarily through changes to the atrial fibrillatory rate and AV node conduction properties. Therefore, heart rate variability is not applicable as a tool for quantifying ANS modulation during AF. As an alternative, modulation of AV nodal function could be used to quantify the ANS function during AF. Since the AV node function mainly depends on the refractory period and conduction delay of the two pathways, estimating beat-to-beat changes to these properties might give insights into the ANS function.
Assessing the AV-nodal function under AF is a complex task, since its behavior is influenced by multiple factors such as atrial impulses, autonomic modulation, as well as its intrinsic dynamics and structure. Thus, standard signal processing tools are insufficient, and a model-based analysis is required. Several mathematical models of the AV node have previously been proposed with varying complexity tailored to different intents, including but not limited to Jørgensen et al. (2002), Mangin et al. (2005), Inada et al. (2009), Climent et al. (2011), Masè et al. (2015), Henriksson et al. (2015), Ryzhii and Ryzhii (2023). For clinical application on an individual level, a model should ideally have parameters identifiable from non-invasive recordings. To the best of our knowledge, the only model incorporating the refractory period and conduction delay of both pathways while simultaneously allowing for identification of model parameters based on non-invasive recordings is our previously proposed model (Karlsson et al., 2021). Using this model, the individual 24-h trends of the AV node properties
Because the Poincaré plot relies on statistical information gathered over a sequence of multiple heartbeats, it is of limited use for beat-to-beat analysis. To increase temporal resolution, we propose a particle filter to estimate
This study aims to present and evaluate two particle filter-based frameworks for beat-to-beat assessment of AV node conduction properties, based on intracardiac electrogram (EGM) and ECG data, respectively. The evaluation is done in three steps. Step one is to evaluate the estimation accuracy for the EGM and ECG-based methods on simulated data. Step two is to compare the estimates obtained from synchronized ECG and EGM measurements to estimates derived from ECG measurements only. Finally, step three is to analyze the dynamics of the AV node properties during a tilt test protocol using ECG recordings from 21 patients in order to evaluate the method’s ability to quantify expected changes in AV node conduction properties.
2 Materials and methods
The data used in this study are described in Section 2.1, and are followed by a description of the signal processing used to derive an atrial activation time series (AA series) and a ventricular activation time series (RR series) from the EGM and ECG recordings, in Section 2.2. Furthermore, the network model of the AV node is described in Section 2.3, and the computation of the posterior distribution of
2.1 Datasets
Two previously obtained datasets are used in this study. The publicly available intracardiac atrial fibrillation database (iafdb) provides synchronized EGM and ECG measurements during AF and is used to assess coherence between EGM and ECG-based estimates of
2.1.1 Intracardiac atrial fibrillation database
The iafdb data consist of EGM recordings from four separate regions of the right atrium with synchronized three-lead ECG from eight patients with AF or flutter, sampled at 1,000 Hz (Goldberger et al., 2000). The recordings at the tip of the tricuspid valve annulus are used in this study, due to its proximity to the AV-node entrance. Five recordings contain solely AF and were selected for analysis, with an average patient age of 73
2.1.2 Tilt test study
The tilt test study includes ECG recordings from 40 patients with persistent AF (Östenson et al., 2017). For the current study, data with sufficient quality from 21 patients were used (average age of 67
2.2 Signal processing
The frameworks presented in this study for assessing the AV node conduction properties with beat-to-beat resolution rely on simultaneous analysis of the RR and AA series. These are obtained using different signal processing methods depending on whether synchronized EGM and ECG recordings are available, or only ECG recordings, as described below.
2.2.1 RR and AA series from synchronized EGM and ECG
The synchronized ECG and EGM recordings from the iafdb were used to derive the RR and AA series. The RR series is extracted using R-peak detection performed by the CardioLund ECG parser (www.cardiolund.com). The AA series is extracted from the EGM recordings using an iterative method (Ng et al., 2013) following average beat subtraction-based ventricular far-field cancellation and standard pre-processing (Shkurovich et al., 1998; Botteron and Smith, 1995).
2.2.2 RR and AA series from ECG
Using solely ECG, the RR series is again extracted from the R-peak detection performed by the CardioLund ECG parser. However, the AA series cannot be extracted from the ECG. Instead, multiple AA series are generated for each RR interval based on the f-wave characteristics of the corresponding ECG segment. Each AA series, denoted
2.3 Network model of the AV node
Our previously introduced network model of the AV node (Karlsson et al., 2021) describes it as two pathways (FP and SP). Each pathway comprises 10 nodes, interconnected with a coupling node at the end, which can transmit impulses to the ventricles (see Figure 1). Each node corresponds anatomically to a localized section of its respective pathway, while the coupling node represents the Purkinje fibers and Bundle of His (Kurian et al., 2010).
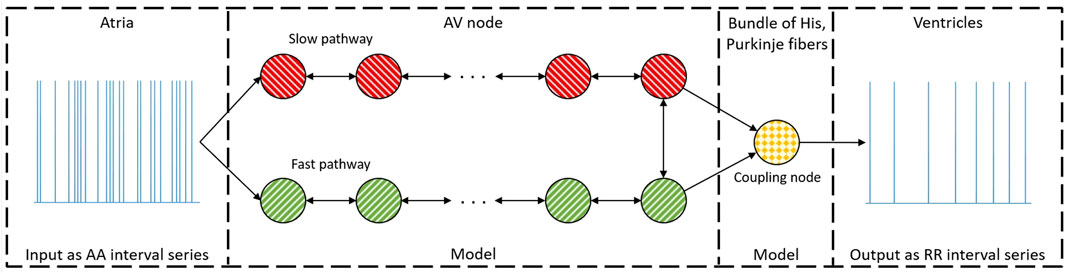
Figure 1. A schematic representation of the network model where the yellow node represents the coupling node, the red nodes the SP, the green nodes the FP, and arrows the direction for impulse conduction. For readability, only a subset of the 21 nodes is shown (Karlsson et al., 2021).
The AA series extracted from data (see Section 2.2) arrives at the first nodes of the FP and the SP simultaneously. Each node can be refractory (blocking impulses) or non-refractory (transmitting impulses). Transmitted impulses arrive at adjacent nodes with an added conduction delay, and nodes immediately become refractory after transmitting an impulse. The refractory period
where
The model is evaluated using a modified version of Dijkstra’s algorithm (Wallman and Sandberg, 2018). Impulses are propagated through the network in an event-based fashion where the impulse with the lowest
The AV node model parameters
2.4 Parameter estimation
To estimate
2.4.1 EGM-particle filter
A basic particle filter can be described by its four phases: initialization, weighting, resampling, and propagation. These phases all affect the particles in the particle filter. In this work, each particle corresponds to a model parameter vector
where
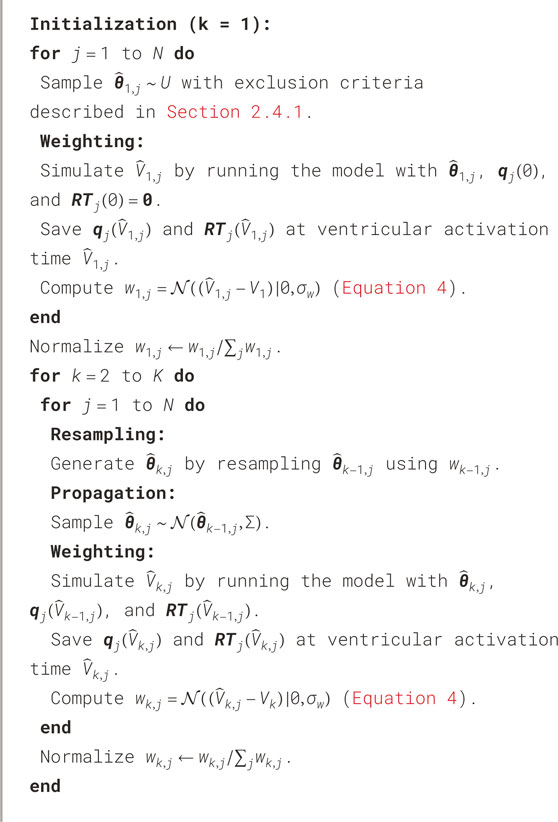
Algorithm 1. EGM-particle filter.
2.4.2 ECG-particle filter
Similar to the EGM-PF, the ECG-PF is described by its four phases: initialization, weighting, resampling, and propagation. In contrast to the EGM-PF, the atrial activity is not fully known from the ECG. To evaluate several possible AA series,
Each unique particle is evaluated with a different AA series
For the following time steps
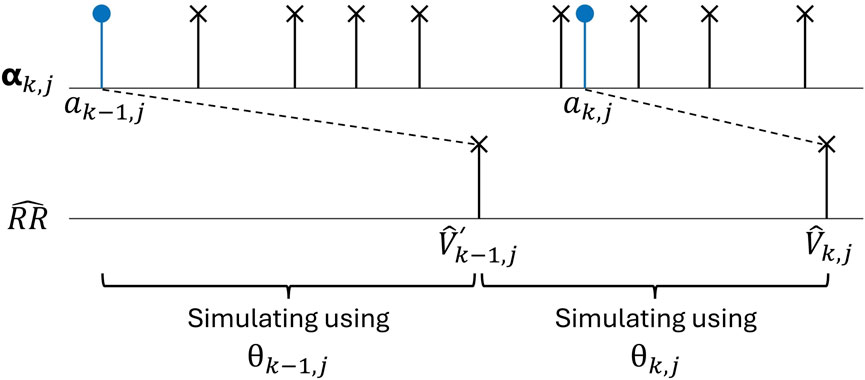
Figure 2. An AA series
After
In the resampling phase,
The propagation phase is followed by a new weighting phase before the resampling, propagation, and weighting are repeated sequentially for each time step, from
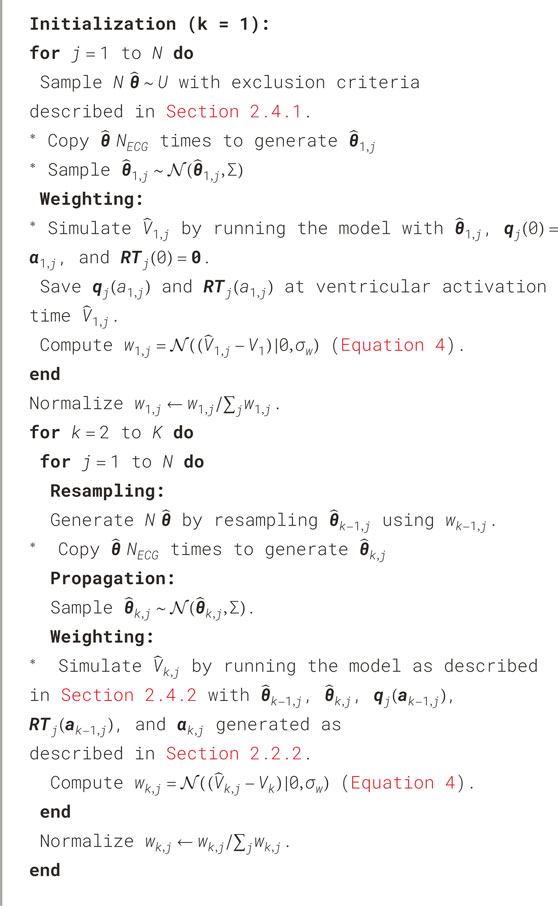
Algorithm 2. ECG-particle filter. Differences from the EGM-PF are marked with ‘*‘.
2.4.3 Smoothing algorithm
The combined particle filter and smoothing algorithm utilized in this work is commonly referred to as the forward filtering backward sampling algorithm (Chopin and Papaspiliopoulos, 2020). The smoothing algorithm is applied after either the EGM-PF or the ECG-PF, and functions as the backward sampling step.
Starting at the last time step
A new particle
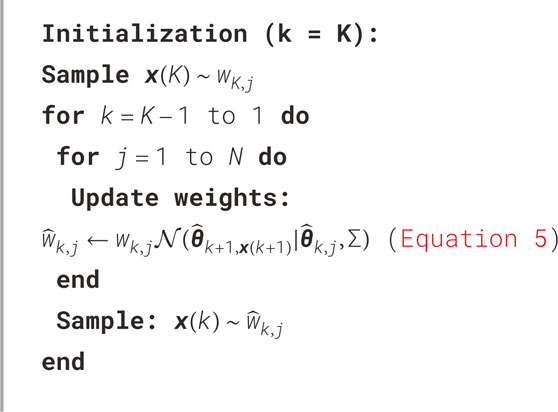
Algorithm 3. Smoothing algorithm.
2.5 Evaluation of particle filters
To evaluate the accuracy of the proposed methodology, estimates obtained using the EGM-PF
To compute the most probable value at each time step
Furthermore, the percentage of heartbeats for which the 95% credibility region covered
2.6 Analysis of iafdb data
EGM recordings from the tip of the tricuspid valve annulus with synchronized ECG recordings, as described in Section 2.1.1, are analyzed to compare the concordance between the resulting estimates from the EGM-PF and the ECG-PF. The
2.7 Analysis of tilt test data
ECG recordings from a tilt test protocol, as described in Section 2.1.2, are analyzed to evaluate the method’s ability to quantify expected changes in AV node characteristics. First,
2.8 Statistical analysis
The paired one-sided Wilcoxon signed rank test is used to quantify significant increase or decrease in this study, since the data do not generally follow a normal distribution according to the Shapiro-Wilk test
3 Results
To recapitulate, three datasets were used in this study. The simulated data (see Section 2.5) are used to evaluate the estimation accuracy for the EGM and ECG-based methods. The iafdb recordings (see Section 2.1.1) are used to compare the estimates obtained from synchronized EGM and ECG recordings. The tilt recordings (see Section 2.1.2) are used to evaluate the method’s ability to quantify expected changes in AV node characteristics.
The computation time (performed on a desktop computer with a Ryzen 9 5900X CPU, using the twelve cores in parallel) to obtain posterior distributions
3.1 Evaluation of particle filters
An example of
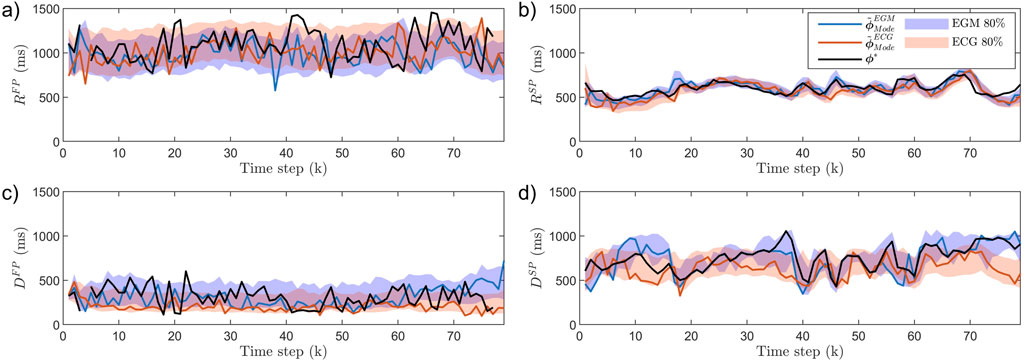
Figure 3. AV node estimates
The results from the analysis of all simulated data are summarized in Table 1. As expected, the estimation error
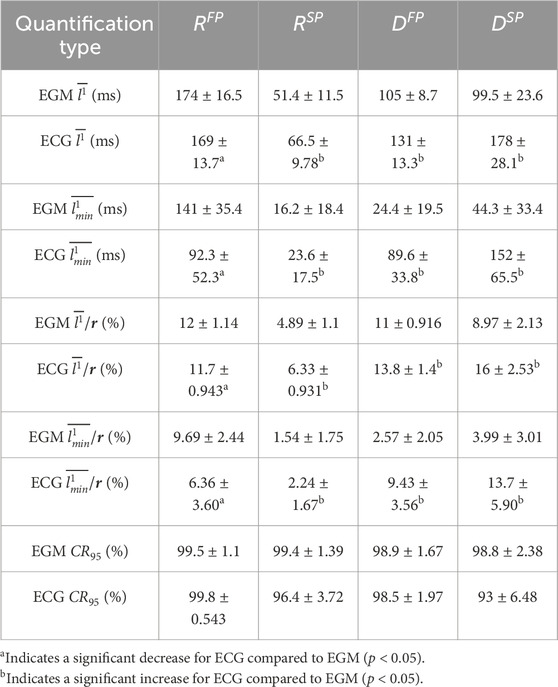
Table 1. The mean
3.2 Analysis of iafdb data
An example of
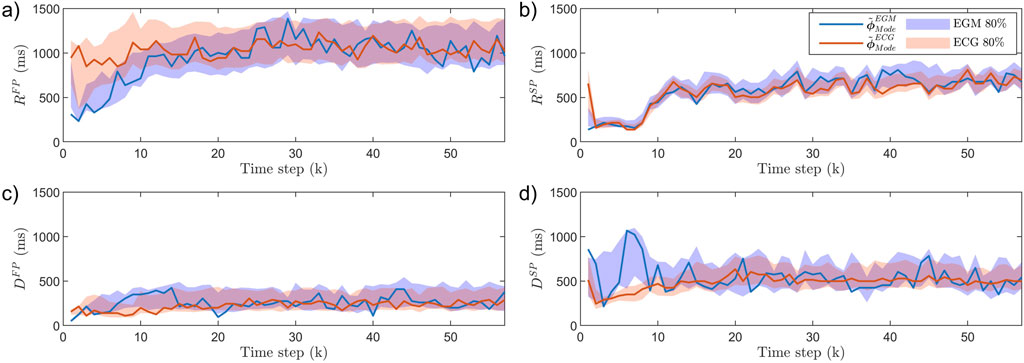
Figure 4. The AV node estimates
The results of
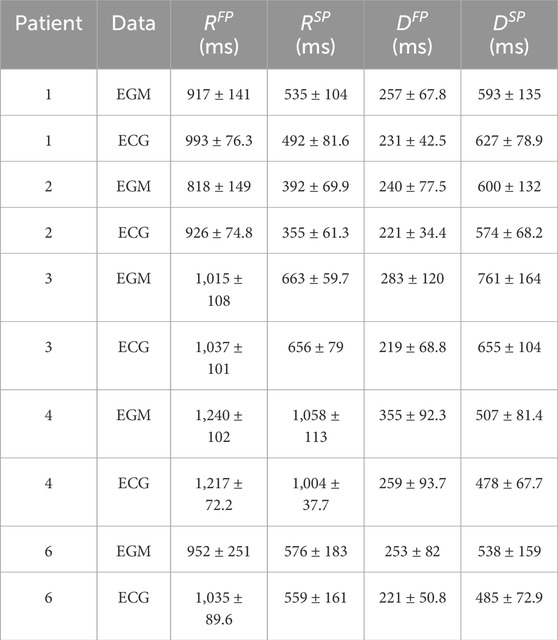
Table 2. The mean
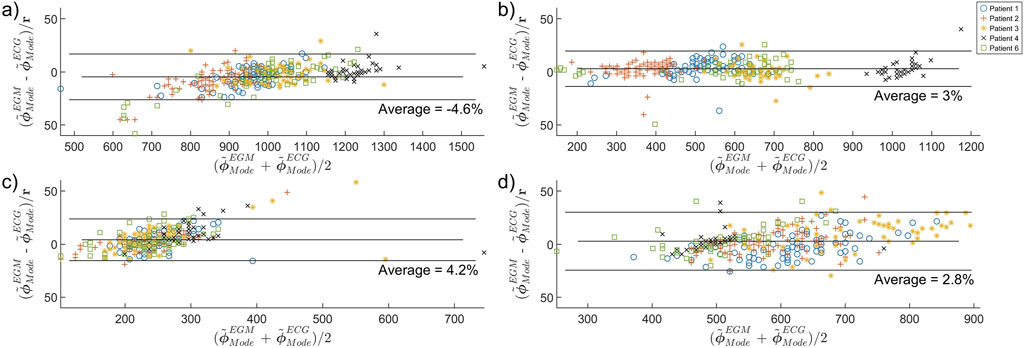
Figure 5. Bland-Altman plot comparing the concordance between ECG-PF and EGM-PF estimates of (a)
3.3 Analysis of tilt test data
An example of
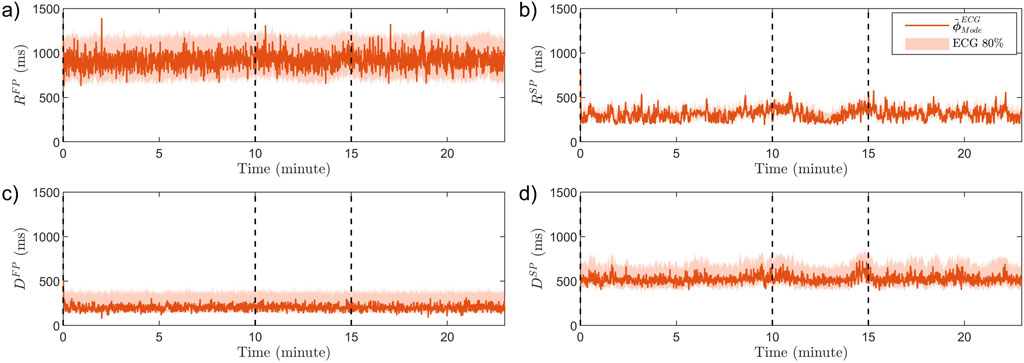
Figure 6. The estimated modes
The resulting average estimates for each patient and each phase,
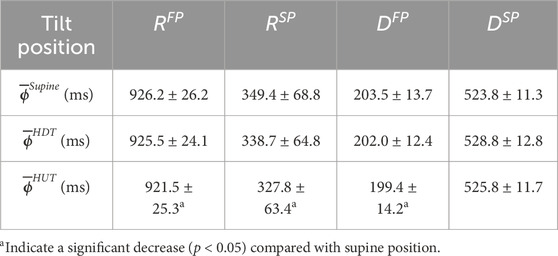
Table 3. The population mean
4 Discussion
This study proposes a method for estimating AV node conduction properties with beat-to-beat resolution during AF utilizing a network model of the AV node and a particle filter together with a smoothing algorithm. The method was evaluated using simulated data to analyze how well the particle filters estimated the AV node conduction properties for each heartbeat. Additionally, synchronized EGM and ECG recordings were analyzed to study the concordance between estimates obtained from the two data types. Finally, ECG recordings obtained during a tilt test protocol were analyzed to evaluate the method’s ability to quantify expected changes in AV node characteristics.
The proposed framework builds on a physiological model where
The estimation accuracy of the present study can be compared to results from our previous study, where the same AV node model was used to estimate
Comparing these results to the ECG
The accuracy of the ECG-based estimates differs between AV node conduction properties, with the lowest error obtained for
The differences in estimation accuracy across AV node properties arise from both signal characteristics and model dynamics. Fast pathway properties are estimated with higher error for the simulated data since fewer beats conduct through it, reducing its effect on the output as well as the amount of data available for inference. Moreover,
Only a few sources exist for functional and effective refractory periods in the SP and FP of the AV node in humans. In the study by Denes et al., the functional refractory period for two patients with paroxysmal supraventricular tachycardia and evidence of dual AV nodal conduction was 820 and 495 ms in the FP and 540 and 414 ms in the SP (Denes et al., 1973). In the study by Blanck et al., the effective refractory period in 18 patients with inducible sustained atrioventricular nodal reentrant tachycardia varied from 230 to 440 ms in the FP, and from 180 to 420 ms in the SP (Blanck et al., 1995). Assuming that intra-individual variations in the AV node refractory period are smaller than the difference between individuals, comparing the reported results to the results in Table 1 indicates that identifying beat-to-beat variations in
The iafdb was used to study the concordance between estimates obtained from synchronized ECG and EGM recordings. As seen in Figure 4, there are some differences when using EGM recordings compared to ECG recordings. This is clearest in
The AV node conduction properties estimated based on the ECG recordings from the tilt test study, summarized in Table 3, show a significant decrease from supine to HUT position for
Moreover, it is less clear how changing the position from supine to HDT affects the sympathetic and parasympathetic activity, and the results from our analysis do not show any significant changes in AV node conduction properties between supine and HDT. Further, as suggested by the estimated trends of
4.1 Study limitations and future perspectives
The network model accounts for several important properties of the AV node conduction during AF, however, it is by no means a perfect replica. For example, it does not include ventricular escape rhythm and the network topology used in this work excludes some uncommon AV node structures such as multiple slow pathways. Nevertheless, these simplifications are essential to developing a model with a manageable number of parameters. Moreover, given that these are uncommon structures, these limitations are not likely to affect the results.
The estimated AV node properties have only been validated using ground truth data generated from the same AV node model. However, obtaining the exact refractory period and conduction delay in both pathways from patients suffering from AF – if at all possible – would be very difficult and time-consuming. In addition, the number of patient recordings analyzed in this study is limited, which restricts the ability to generalize the findings across the wider AF population.
While a computation time of 17.5 min per minute of analyzed data prevents real-time clinical application of this framework (e.g., using it as part of a monitoring system), this could be addressed in several ways. Since each particle in the particle filter is computed separately, parallellizing the method across CPU cores would reduce processing time. In addition, the number of particles is directly proportional to computation time. In this study, 1,000,000 particles were used to explore the potential of the framework to study beat-to-beat variations. Many applications, such as comparing tilt positions in the tilt test data, do not require beat-to-beat resolution. In those cases, using fewer particles and basing the analysis on 1-min averages could be sufficient. However, to study the transition period between tilt positions, beat-to-beat resolution is necessary, which is only achievable with a time delay using the current implementation of the method. In general, the number of particles, and thereby the computation time and accuracy, needs to be chosen to match the requirements of the clinical application.
The developed methodology constitutes an important step towards non-invasive characterization of autonomic activity in AF patients. This could potentially inform personalized therapeutic strategies and refine prognostic assessments. However, further investigations are required to establish which static and dynamic properties derived from this method exhibit the strongest correlation with clinically significant outcomes. It would thus be interesting to apply the proposed framework to ECG signals obtained during common AF treatments, such as different rate control drugs.
5 Conclusion
We have proposed a novel framework for estimating patient-specific AV node properties with beat-to-beat resolution and conservative uncertainty estimates utilizing a mathematical model combined with a particle filter and smoothing algorithm. By using synchronized EGM and ECG recordings for the parameter estimation, the loss of estimation accuracy using non-invasive recordings could be studied, suggesting a sufficient accuracy for capturing beat-to-beat changes in the refractory period of the SP.
We illustrate the potential of the proposed methodology by analyzing a tilt-test dataset. Results suggest that changes in AV node conduction properties can be assessed from ECG using the proposed method.
Data availability statement
The estimated AV node properties and the simulated data supporting the conclusions for this article will be available from MK upon request. The code for the model together with a user example can be found at https://github.com/FraunhoferChalmersCentre/AV-node-model. The iafdb data are publicly available on https://physionet.org/content/iafdb/1.0.0/. The tilt test protocol data is owned by the Department of Cardiology, Clinical Sciences, Lund University, Sweden, and access requests should be directed to cHlvdHIucGxhdG9ub3ZAbWVkLmx1LnNl.
Ethics statement
The studies involving humans were approved by Regionala Etikprövningsnämnden in Lund. The studies were conducted in accordance with the local legislation and institutional requirements. Written informed consent for participation was not required from the participants or the participants’ legal guardians/next of kin in accordance with the national legislation and institutional requirements.
Author contributions
MK: Methodology, Investigation, Conceptualization, Software, Visualization, Validation, Writing – original draft, Formal Analysis, Writing – review and editing, Project administration. FP: Data curation, Writing – review and editing. PP: Supervision, Writing – review and editing, Funding acquisition. SÖ: Data curation, Investigation, Writing – review and editing. MW: Methodology, Conceptualization, Resources, Writing – review and editing, Validation, Investigation, Project administration, Supervision, Formal Analysis, Software, Funding acquisition. FS: Supervision, Conceptualization, Investigation, Writing – review and editing, Methodology, Funding acquisition, Project administration, Validation, Formal Analysis, Resources.
Funding
The author(s) declare that financial support was received for the research and/or publication of this article. This work was supported by the Swedish Foundation for Strategic Research (Grant FID18-0023), the Swedish Research Council (Grant VR2019-04272), and the Crafoord Foundation (Grant 20200605).
Acknowledgments
The computations were enabled by resources provided by the National Academic Infrastructure for Supercomputing in Sweden (NAISS) at Tetralith partially funded by the Swedish Research Council through grant agreement no. 2022-06725.
Conflict of interest
The authors declare that the research was conducted in the absence of any commercial or financial relationships that could be construed as a potential conflict of interest.
Generative AI statement
The author(s) declare that no Generative AI was used in the creation of this manuscript.
Publisher’s note
All claims expressed in this article are solely those of the authors and do not necessarily represent those of their affiliated organizations, or those of the publisher, the editors and the reviewers. Any product that may be evaluated in this article, or claim that may be made by its manufacturer, is not guaranteed or endorsed by the publisher.
Supplementary material
The Supplementary Material for this article can be found online at: https://www.frontiersin.org/articles/10.3389/fphys.2025.1624403/full#supplementary-material
References
Abdollahpur M., Engström G., Platonov P. G., Sandberg F. (2022). A subspace projection approach to quantify respiratory variations in the f-wave frequency trend. Front. Physiology 13, 976925. doi:10.3389/fphys.2022.976925
Al-Khatib S. M., Allen LaPointe N. M., Chatterjee R., Crowley M. J., Dupre M. E., Kong D. F., et al. (2014). Rate-and rhythm-control therapies in patients with atrial fibrillation: a systematic review. Ann. Intern. Med. 160, 760–773. doi:10.7326/M13-1467
Andrew N. E., Thrift A. G., Cadilhac D. A. (2013). The prevalence, impact and economic implications of atrial fibrillation in stroke: what progress has been made? Neuroepidemiology 40, 227–239. doi:10.1159/000343667
Aponte-Becerra L., Novak P. (2021). Tilt test: a review. J. Clin. Neurophysiology 38, 279–286. doi:10.1097/WNP.0000000000000625
Benjamin E. J., Muntner P., Alonso A., Bittencourt M. S., Callaway C. W., Carson A. P., et al. (2019). Heart disease and stroke statistics-2019 update a report from the American heart association. Circulation 139, e56–e528. doi:10.1161/CIR.0000000000000659
Blanck Z., Dhala A. A., Sra J., Deshpande S. S., Anderson A. J., Akhtar M., et al. (1995). Characterization of atrioventricular nodal behavior and ventricular response during atrial fibrillation before and after a selective slow-pathway ablation. Circulation 91, 1086–1094. doi:10.1161/01.cir.91.4.1086
Botteron G. W., Smith J. M. (1995). A technique for measurement of the extent of spatial organization of atrial activation during atrial fibrillation in the intact human heart. IEEE Trans. Biomed. Eng. 42, 579–586. doi:10.1109/10.387197
Bridge C. P., Ioannou C., Noble J. A. (2017). Automated annotation and quantitative description of ultrasound videos of the fetal heart. Med. image Anal. 36, 147–161. doi:10.1016/j.media.2016.11.006
Climent A. M., Guillem M. S., Husser D., Castells F., Millet J., Bollmann A. (2010). Role of the atrial rate as a factor modulating ventricular response during atrial fibrillation. Pacing Clin. Electrophysiol. 33, 1510–1517. doi:10.1111/j.1540-8159.2010.02837.x
Climent A. M., Guillem M. S., Zhang Y., Millet J., Mazgalev T. (2011). Functional mathematical model of dual pathway AV nodal conduction. Am. J. Physiol. Heart Circ. Physiol. 300, H1393–H1401. doi:10.1152/ajpheart.01175.2010
Denes P., Wu D., Dhingra R. C., Chuquimia R., Rosen K. M. (1973). Demonstration of dual av nodal pathways in patients with paroxysmal supraventricular tachycardia. Circulation 48, 549–555. doi:10.1161/01.cir.48.3.549
Goldberger A. L., Amaral L. A., Glass L., Hausdorff J. M., Ivanov P. C., Mark R. G., et al. (2000). Physiobank, physiotoolkit, and physionet: components of a new research resource for complex physiologic signals. Circulation 101, e215–e220. doi:10.1161/01.cir.101.23.e215
Henriksson M., Corino V. D., Sörnmo L., Sandberg F. (2015). A statistical atrioventricular node model accounting for pathway switching during atrial fibrillation. IEEE Trans. Biomed. Eng. 63, 1842–1849. doi:10.1109/TBME.2015.2503562
Henriksson M., Petrėnas A., Marozas V., Sandberg F., Sörnmo L. (2018). Model-based assessment of f-wave signal quality in patients with atrial fibrillation. IEEE Trans. Biomed. Eng. 65, 2600–2611. doi:10.1109/TBME.2018.2810508
Hindricks G., Potpara T., Dagres N., Arbelo E., Bax J. J., Blomström-Lundqvist C., et al. (2020). 2020 ESC guidelines for the diagnosis and management of atrial fibrillation developed in collaboration with the European association of cardio-thoracic surgery (EACTS). Am. J. Physiol. Heart Circ. Physiol. doi:10.1093/eurheartj/ehaa612
Inada S., Hancox J., Zhang H., Boyett M. (2009). One-dimensional mathematical model of the atrioventricular node including atrio-nodal, nodal, and nodal-his cells. Biophysical J. 97, 2117–2127. doi:10.1016/j.bpj.2009.06.056
Jørgensen P., Schäfer C., Guerra P. G., Talajic M., Nattel S., Glass L. (2002). A mathematical model of human atrioventricular nodal function incorporating concealed conduction. Bull. Math. Biol. 64, 1083–1099. doi:10.1006/bulm.2002.0313
Karlsson M., Platonov P. G., Ulimoen S. R., Sandberg F., Wallman M. (2024). Model-based estimation of av-nodal refractory period and conduction delay trends from ECG. Front. Physiology 14, 1287365. doi:10.3389/fphys.2023.1287365
Karlsson M., Sandberg F., Ulimoen S. R., Wallman M. (2021). Non-invasive characterization of human AV-nodal conduction delay and refractory period during atrial fibrillation. Front. Physiol. 12, 1849. doi:10.3389/fphys.2021.728955
Karlsson M., Wallman M., Platonov P. G., Ulimoen S. R., Sandberg F. (2022). ECG based assessment of circadian variation in AV-nodal conduction during AF – influence of rate control drugs. Front. Physiology 2015. doi:10.3389/fphys.2022.976526
Kurian T., Ambrosi C., Hucker W., Fedorov V. V., Efimov I. R. (2010). Anatomy and electrophysiology of the human av node. Pacing Clin. Electrophysiol. 33, 754–762. doi:10.1111/j.1540-8159.2010.02699.x
Lee J., McManus D. D., Bourrell P., Sörnmo L., Chon K. H. (2013). Atrial flutter and atrial tachycardia detection using bayesian approach with high resolution time–frequency spectrum from ECG recordings. Biomed. Signal Process. Control 8, 992–999. doi:10.1016/j.bspc.2013.04.002
Leffler C. T., Saul J. P., Cohen R. J. (1994). Rate-related and autonomic effects on atrioventricular conduction assessed through beat-to-beat pr interval and cycle length variability. J. Cardiovasc. Electrophysiol. 5, 2–15. doi:10.1111/j.1540-8167.1994.tb01109.x
Mangin L., Vinet A., Pagé P., Glass L. (2005). Effects of antiarrhythmic drug therapy on atrioventricular nodal function during atrial fibrillation in humans. EP Eur. 7, S71–S82. doi:10.1016/j.eupc.2005.03.016
Masè M., Marini M., Disertori M., Ravelli F. (2015). Dynamics of av coupling during human atrial fibrillation: role of atrial rate. Am. J. Physiology-Heart Circulatory Physiology 309, H198–H205. doi:10.1152/ajpheart.00726.2014
Nathan V., Jafari R. (2017). Particle filtering and sensor fusion for robust heart rate monitoring using wearable sensors. IEEE J. Biomed. Health Inf. 22, 1834–1846. doi:10.1109/JBHI.2017.2783758
Ng J., Sehgal V., Ng J. K., Gordon D., Goldberger J. J. (2013). Iterative method to detect atrial activations and measure cycle length from electrograms during atrial fibrillation. IEEE Trans. Biomed. Eng. 61, 273–278. doi:10.1109/TBME.2013.2290003
Östenson S., Corino V. D., Carlsson J., Platonov P. G. (2017). Autonomic influence on atrial fibrillatory process: head-up and head-down tilting. Ann. Noninvasive Electrocardiol. 22, e12405. doi:10.1111/anec.12405
Plappert F., Wallman M., Abdollahpur M., Platonov P. G., Östenson S., Sandberg F. (2022). An atrioventricular node model incorporating autonomic tone. Front. Physiology 13, 1814. doi:10.3389/fphys.2022.976468
Ryzhii M., Ryzhii E. (2023). A compact multi-functional model of the rabbit atrioventricular node with dual pathways. Front. Physiology 14, 1126648. doi:10.3389/fphys.2023.1126648
Shaffer F., Ginsberg J. P. (2017). An overview of heart rate variability metrics and norms. Front. Public Health 5, 258. doi:10.3389/fpubh.2017.00258
Shen M. J., Zipes D. P. (2014). Role of the autonomic nervous system in modulating cardiac arrhythmias. Circulation Res. 114, 1004–1021. doi:10.1161/CIRCRESAHA.113.302549
Shkurovich S., Sahakian A. V., Swiryn S. (1998). Detection of atrial activity from high-voltage leads of implantable ventricular defibrillators using a cancellation technique. IEEE Trans. Biomed. Eng. 45, 229–234. doi:10.1109/10.661270
Keywords: atrial fibrillation, atrioventricular node model, mathematical modeling, particle filter, smoothing algorithm, autonomic nervous system
Citation: Karlsson M, Plappert F, Platonov PG, Östenson S, Wallman M and Sandberg F (2025) ECG-based beat-to-beat assessment of AV node conduction properties during AF. Front. Physiol. 16:1624403. doi: 10.3389/fphys.2025.1624403
Received: 07 May 2025; Accepted: 04 July 2025;
Published: 01 August 2025.
Edited by:
Mark Potse, UMR5251 Institut de mathématiques de Bordeaux (IMB), FranceReviewed by:
Michela Masè, University of Trento, ItalyAlba Martin Yebra, University of Zaragoza, Spain
Copyright © 2025 Karlsson, Plappert, Platonov, Östenson, Wallman and Sandberg. This is an open-access article distributed under the terms of the Creative Commons Attribution License (CC BY). The use, distribution or reproduction in other forums is permitted, provided the original author(s) and the copyright owner(s) are credited and that the original publication in this journal is cited, in accordance with accepted academic practice. No use, distribution or reproduction is permitted which does not comply with these terms.
*Correspondence: Frida Sandberg, ZnJpZGEuc2FuZGJlcmdAYm1lLmx0aC5zZQ==
†These authors share last authorship