 Songzi Cui1,2†
 Chenxi Hu
- 1Department of Orthopaedics, Fourth Medical Centre of Chinese PLA General Hospital, Beijing, China
- 2Department of Chinese Academy of Sport and Health, Beijing Sport University, Beijing, China
Objective: This study aimed to investigate the dynamic relationship between chest temperature entropy, physiological load indicators, and excess post-exercise oxygen consumption (EPOC) during incremental cycling exercise using high-sampling-rate infrared thermography (IRT).
Methods: Twenty-four healthy young male participants (23.7 ± 3.3 years; 178.6 ± 9.8 cm; 78.5 ± 6.4 kg; 237.8 ± 48.7 min/week training duration; maximal oxygen uptake 44.06 ± 5.9 ml/kg/min; maximal power output 263.8 ± 27.4 W) performed an incremental cycling test starting at 60 W with workload increases of 30 W every 2 minutes until exhaustion. Chest thermography, oxygen consumption (VO₂), blood lactate, and external load were simultaneously measured, and entropy was used to quantify the spatial complexity of temperature distribution.
Results: Significant non-linear positive correlations were found between standardized entropy increase and VO₂ (R² = 0.809), blood lactate (R² = 0.719), and external load (R² = 0.841), while individual-level analyses confirmed strong associations with VO₂ (r = 0.874–0.977), lactate (r = 0.692–0.989), and external load (r = 0.889–0.986) (all p < 0.05). Hierarchical clustering identified three clusters corresponding to low, moderate, and high metabolic load states. During recovery, entropy was significantly associated with EPOC (R² = 0.151), though substantial inter-individual variation was observed (r = –0.288 to 0.907).
Conclusion: Chest temperature entropy dynamically reflects exercise-induced metabolic changes and partially explains recovery processes, highlighting its potential as a novel, non-invasive marker for monitoring exercise load and recovery.
1 Introduction
Training Load is the quantification of training stimulus, and through systematic and periodic application of load, it induces acute metabolic regulation, neural activation, short-term physiological stress, and long-term functional adaptation (muscle hypertrophy, enhanced cardiovascular function), leading to the systematic improvement of athletic performance (Bourdon et al., 2017; Halson, 2014; Lu et al., 2024). Modern load monitoring systems assess both external and internal loads to construct a mapping relationship between training stimulus and physiological responses (Im et al., 2019). External load monitoring relies on wearable devices such as GPS and accelerometers, to quantify training volume (duration, distance, power) and intensity (speed, acceleration) through physical parameters (Borresen and Lambert, 2009). Power meters quantify mechanical work output as an objective indicator of external load, providing valuable information for monitoring training adaptation and preventing non-functional overreaching (Halson, 2014; Sitko et al., 2020). Internal load monitoring, on the other hand, uses multidimensional data such as blood biomarkers related to creatine kinase, testosterone/cortisol ratio, heart rate variability, and subjective fatigue scales to understand the body’s metabolic state and recovery progress (Halson, 2014).
In practical application, external load monitoring requires the use of sensor devices, which may interfere with the athlete’s freedom of movement. While the gas metabolic measurement system, considered the gold standard for aerobic metabolism (Poole and Jones, 2017), offers high reliability, it is limited by the cost of equipment and restricted application scenarios (Shei et al., 2022). Blood lactate threshold testing, though sensitive to identifying anaerobic thresholds, faces challenges with low time resolution due to discrete sampling and invasive procedures, potentially triggering cortisol stress responses (Faude et al., 2009). Although traditional monitoring technologies are well-established in sports science practice, their invasiveness, high costs, and the lack of localized physiological data may limit their application in dynamic, continuous, and individualized load monitoring.
Infrared thermography (IRT) has emerged as a new tool in sports science research due to its non-invasive nature, mobility, and high spatial-temporal resolution (Costello et al., 2013). IRT captures infrared radiation from the body surface, generating temperature distribution images, and associates changes in signal intensity with muscle micro-damage and local metabolic rate responses during exercise (Masur et al., 2024). Recent studies have shown that IRT effectively captures local temperature changes induced by exercise to detect muscle activity, and the dynamic changes in skin temperature during exercise have become a well-established method to study the relationship with exercise load in sports science (Moreira et al., 2017). Research indicates that during incremental cycling tests, the maximum temperature of the bilateral thighs decreases significantly due to vasoconstriction triggered by increased metabolic demand, while temperature rises during the recovery period (Ludwig et al., 2016). This phenomenon is likely directly related to energy metabolism and blood flow distribution to the skeletal muscles. A similar cooling trend is also evident in resistance training, where the skin temperature (Tsk) in six regions of interest in the lower limbs decreases to varying degrees following 70% 1RM resistance exercise, and the temperature changes in the thighs and knees are negatively correlated with sympathetic nervous system activation (Sillero-Quintana et al., 2022). In aerobic load experiments, skin temperature shows a moderate positive correlation with maximal aerobic capacity (r = 0.6), and a stronger negative correlation with lactate levels (r = −0.7), supporting its potential as a metabolic load quantification indicator and dynamic monitoring tool for exercise load (Akimov et al., 2010). Under specific exercise modes, local skin temperature changes reflect muscle activation patterns and adjustments in blood flow dynamics. The Perpetuini team, through simultaneous collection of surface electromyography (sEMG) signals and infrared thermography data during squat-to-fatigue exercises in ten healthy participants, found significant positive correlations between the temperature features extracted using an improved Gaussian regression model (in the time domain, frequency domain, and non-linear features) and the average rectified value and median frequency of sEMG signals. In a study assessing thermal asymmetry in the body surface temperature distribution of boxers, the temperature of the posterior abdominal and lumbar regions was found to be 0.5 °C and 0.4 °C higher, respectively, compared to the anterior side, while the temperature of the anterior calf and fist joints was higher by 0.4 °C and 0.3 °C, respectively (del Estal et al., 2017). This research suggests that the asymmetry in body surface temperature may be related to the athletes’ movement patterns and specific muscle activation during training and competition. Additionally, a study analyzing Tsk changes in male endurance runners with high and moderate aerobic capacity during a progressive maximal load test found that the high aerobic capacity group had significantly higher Tsk at baseline, 60%, and 70% of maximal load compared to the moderate aerobic capacity group. Peak Tsk was positively correlated with variables such as age, body fat percentage, muscle mass, VO2peak, maximum speed, heart rate, and ventilation (Galan-Carracedo et al., 2019).
Current research on skin temperature feature extraction primarily focuses on traditional parameters such as average temperature, extreme values, and temperature difference (Perpetuini et al., 2021), while entropy, as a measure of the complexity of temperature distribution, has not been fully explored. Entropy quantifies the average information content of an event relative to the probability distribution of a random variable, and in infrared thermography it reflects the degree of spatial heterogeneity within a region of interest (ROI) (Verderber et al., 2024). During incremental cycling exercise, chest temperature entropy has been observed to increase progressively with exercise intensity and to show a stronger correlation with pulmonary ventilation than mean temperature measures (Bini et al., 2011). Further studies have confirmed significant positive correlations between chest temperature entropy and both external power output and oxygen uptake during incremental load, highlighting its sensitivity to subtle spatial variations in skin temperature and its ability to capture complex thermal patterns that are not discernible through conventional temperature metrics (Verderber et al., 2024; Hu et al., 2025). One experimental study investigated the effect of local cooling on skin blood flow during hyperemia, using multiscale entropy to assess the efficacy of local cooling in treating reactive hyperemia and the degree of skin temperature ischemia in individuals with spinal cord injuries (Liao et al., 2019). Another study aimed to determine whether changes in skin temperature characteristics could accurately predict the risk of pressure ulcers, observing the entropy and spectral indices of the skin temperature in participants. Although there were no significant differences in the probability of ulcer formation across the multiscale skin temperature measurements, the study provided a new tool for evaluating the regulation of skin temperature and, from another perspective, assessing the distribution of skin temperature and its relationship with metabolic information (Rapp et al., 2009).
The dynamic relationship between entropy in body temperature distribution and oxygen consumption (VO2) has not yet been elucidated in current research. Although studies have shown a strong correlation between chest temperature entropy and pulmonary ventilation (Bogomilsky et al., 2022), there is insufficient research on the quantitative relationship between blood lactate threshold and thermal dysregulation. Additionally, the thermal recovery characteristics during the excess post-exercise oxygen consumption (EPOC) phase remain underexplored, and the variability in the relationship between entropy and physiological indicators across individuals is not yet clear. Furthermore, there is a lack of synchronized validation data for temperature entropy in regions of interest from thermal imaging and physiological parameters such as VO2 and blood lactate. Therefore, this study utilizes an incremental cycling exercise experiment, employing IRT to collect chest temperature entropy data during exercise, along with simultaneous measurements of VO2, power output, and blood lactate. The study analyzes the relationship between temperature entropy and changes in both internal and external load during the incremental power phase and extends EPOC monitoring for 10 min post-exercise. By analyzing the entropy distribution of infrared thermography–derived skin temperature, this study quantifies metabolic and exercise load without interfering with movement, providing a valuable supplement to existing load monitoring methods. We hypothesize that chest temperature entropy derived from infrared thermography is positively associated with both internal and external loads during incremental cycling, and that it can effectively discriminate metabolic load states and characterize recovery dynamics during the EPOC phase.
2 Methods
2.1 Participants
A total of 24 young male participants were recruited from Beijing Sport University, all meeting the inclusion criteria: no chronic diseases, no lower limb injuries in the past 6 months, and regular participation in physical exercise. The participants had an average age of 23.7 ± 3.3 years, height of 178.54 ± 9.8 cm, weight of 78.5 ± 6.4 kg, weekly exercise duration of 237.8 ± 48.7 min/week, engaging in activities such as cycling, running, and resistance training, VO2max of 44.1 ± 5.9 mL/kg/min, and maximal power output of 263.8 ± 27.4 W. This study was conducted in accordance with the Institutional Review Board of Beijing Sport University (Approval No. 2024303H) and was approved by the Ethics Committee. All participants received detailed information regarding the study’s procedures and potential risks, and informed consent was obtained from each participant.
A power analysis indicated that with n = 24, the study had >80% power (α = 0.05, two-tailed) to detect correlations of ρ ≥ 0.55, which covered the majority of the observed associations.
2.2 Thermal imaging
Infrared thermography images during exercise were captured using the IRay AT200 F infrared thermal imaging device (IRay Technology Co., CN). The camera lens has a focal length of 3.2 mm, a resolution of 256 × 192, image frequency of 25Hz/30Hz, thermal sensitivity of 60mk, and a wavelength range of 8–14 μm. The temperature range is from 0 °C to 60 °C, with an accuracy of ±0.5 °C, and the imaging distance is between 0.5m and 3 m. The field of view is 56 ° × 42.2 ° and the emissivity is 0.98. The thermal image captured corresponds to the current frame collected by the temperature measurement thermal imager. During the tests, the laboratory temperature was controlled at 23 °C with a humidity level of 52% ± 2.1% to optimize the performance of the infrared thermography device. Indoor airflow was minimized to reduce the environmental impact on skin temperature. Participants were instructed to expose their torso skin throughout the cycling session while maintaining an upright sitting posture. The imaging area was the chest, and the infrared thermal imager was fixed on a stable support (80 cm from the body), with the temperature sensor angled toward the specific region of interest (ROI). After the device was powered on, it was left to stabilize for 10 min to complete thermal adaptation. During cycling, thermal images were captured every 6 s. In the pre-exercise resting phase, images were collected every minute, and in the 10-min recovery phase, images were captured every 6 s. To eliminate the influence of motion artifacts in the thermal images, the average entropy for the last minute of each workload phase and for every minute of the recovery phase was extracted as the entropy feature for statistical analysis. A total of at least 9,000 thermal images were collected throughout the experiment.
2.3 Exercise protocol
Prior to testing, the MONARK 893E ergometer was individually adjusted for each participant, including saddle height, fore-aft position, and handlebar reach, based on anthropometric measurements and the participant’s preferred cycling posture. Saddle height was set according to leg length to ensure an appropriate knee angle at full extension. All participants used the original saddle supplied with the MONARK 893E ergometer to maintain consistency, as saddle design and positioning can substantially influence rider comfort and cycling performance (Bini et al., 2011; Vicari et al., 2023). Participants performed a graded cycling protocol using a MONARK 893E ergometer, beginning with 3 min of seated rest without prior warm-up. The test began at a baseline workload of 60 W, followed by stepwise 30 W increments every 2 min until volitional exhaustion. Standardized verbal encouragement was provided at fixed intervals throughout the test to maintain participants’ motivation. Continuous heart rate monitoring was conducted using a Polar Verity Sense arm-worn sensor (Polar Verity Sense, Finland, Polar Electro Oy). Oxygen uptake (VO2) and pulmonary ventilation were measured in real time using the METALYZER® 3B system (Cortex Biophysik GmbH, Germany) and analyzed with MetaSoft Studio software.
During the final 30 s of each workload phase, capillary blood samples were collected from the right medial fingertip using sterile disposable lancets (BD Microtainer, BD, United States). Blood lactate concentrations were measured immediately using the Lactate Scout 4 analyzer (EKF Diagnostics, Cardiff, United Kingdom), which requires 0.2 μL of whole blood and provides results within 12 s using pre-calibrated single-use biosensors (LS4-SM01) (Figure 1).
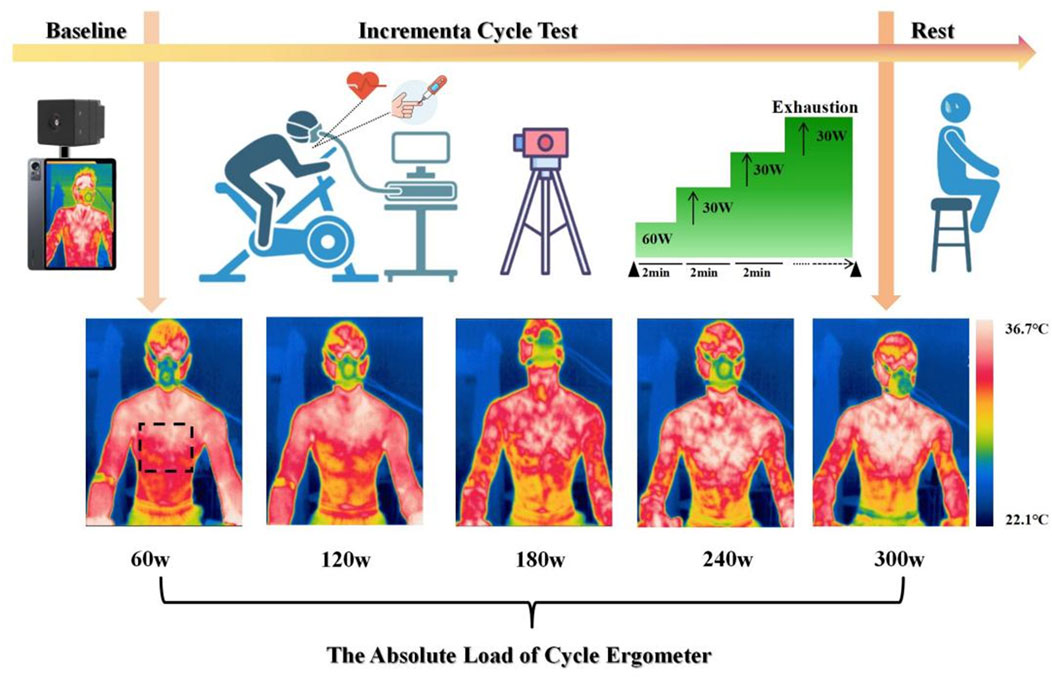
Figure 1. Test process for measuring incremental cycling
2.4 Feature extraction
Thermal imaging data were securely transmitted via wireless protocols to a dedicated secure server with encrypted storage protocols. Following comprehensive data acquisition, a standardized post-processing pipeline was implemented: manual segmentation of thermal images into predefined anatomical regions of interest (ROIs) was conducted based on standardized anatomical landmarks and spatial calibration protocols, followed by exportation of two-dimensional temperature distribution matrices for each ROI. To ensure spatial consistency, the ROI boundaries for matrix extraction were maintained across all participants using predefined coordinate alignment algorithms.
A multidimensional thermal response dataset was constructed by aggregating temperature matrices across all participants under varying loading conditions, subsequently subjected to dimensionality reduction via feature extraction. Each ROI-specific temperature matrix was processed within the statistical computing environment (R version 4.2.1; R Foundation for Statistical Computing, Vienna, Austria) under the following protocol: raw temperature values were quantized to a resolution of 0.1 °C to mitigate instrumentation noise and normalized within each ROI by subtracting the minimum temperature value. The probability distribution required for entropy computation was then derived from the frequency distribution of these normalized temperature values. Shannon entropy was directly calculated without applying additional filtering or smoothing, in order to preserve subtle local thermal variations that might otherwise be obscured. Entropy-based features were extracted using the Shannon entropy formula (Bogomilsky et al., 2022):
The entropy value for each ROI was calculated using Equation 1, where p (xk) denotes the probability of the k -th temperature value.
2.5 Statistical analysis
In this study, all entropy calculations and temperature-related mean analyses were performed using R software (version 4.2.1, R Development Core Team, Vienna, Austria). Data visualization and statistical analyses were conducted using GraphPad Prism (version 8.0, San Diego, CA, United States) and MATLAB 2022a (MathWorks, Natick, MA, United States). Data are presented as means (M) and standard deviations (SD). To evaluate the relationships among temperature entropy, oxygen uptake (VO2), blood lactate, and exercise load (power), Spearman’s rank correlation analysis was exclusively employed, as some variables were not normally distributed at the individual level. Prior to analysis, all entropy, VO2, blood lactate, and exercise load data were standardized using Z-scores.
Subsequently, hierarchical clustering was applied to the standardized data, with the optimal cluster number determined as 3 based on the highest silhouette score. Statistical significance was determined based on p-values, with differences considered significant at p < 0.05. In addition, we established mathematical equations between standardized entropy and oxygen uptake, as well as between standardized entropy and blood lactate through polynomial fitting, in order to quantify the relationships among these variables.
3 Results
3.1 Correlation analysis between chest temperature entropy and oxygen uptake
This study performed a polynomial fitting between normalized entropy increase percentage and normalized Vo2, revealing a significant positive correlation between the two variables (R2 = 0.8090, p < 0.001). Specifically, the increase in entropy is associated with an elevation in blood lactate levels, following a quadratic relationship represented by the equation (y = 0.2694x2 + 0.4645x + 0.1494) (Figure 2).

Figure 2. Relationships between normalized entropy increase% and VO2 for all data points in the group.
The individual correlation analysis indicates a significant positive correlation between the entropy increase percentage and VO2 during incremental cycling. The correlation coefficients (r) for all individuals ranged from (r = 0.874) to (r = 0.977), with all correlations being statistically significant (p < 0.05) (Figure 3).
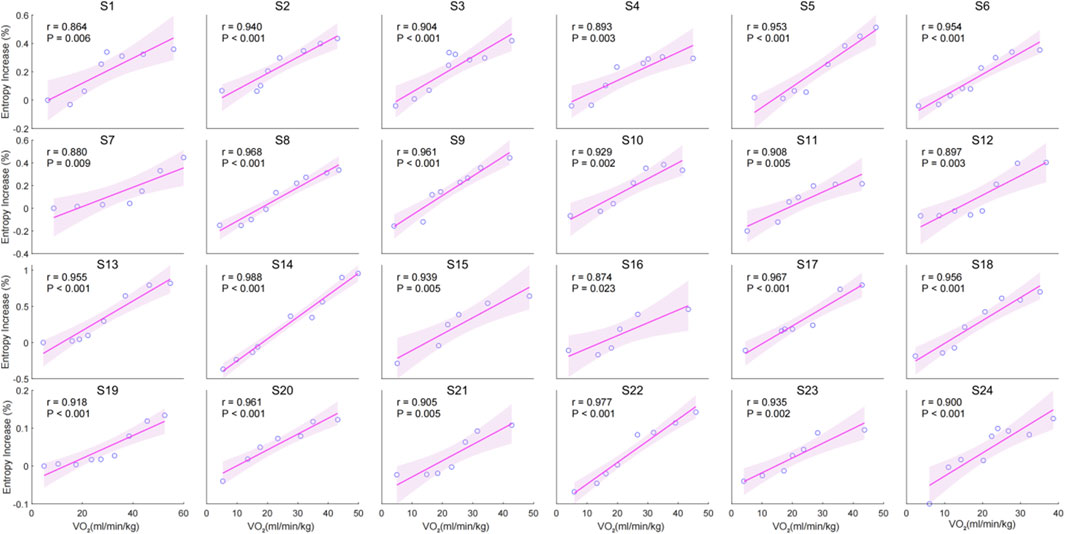
Figure 3. Individual Correlation between entropy increase percentage and VO2 for 24 individuals.
3.2 Correlation analysis between chest temperature entropy and blood lactate
This study performed a polynomial fitting analysis between normalized entropy increase percentage and normalized blood lactate, revealing a significant positive correlation between the two variables (R2 = 0.7186, p < 0.001). The fitting equation is (y = 0.8081x2 - 0.0602x + 0.1224), indicating a strong correlation between entropy increase and blood lactate (Figure 4).
The individual correlation analysis shows a significant positive relationship between entropy increase percentage and lactate levels across all subjects. The correlation coefficients (r) range from 0.692 to 0.989, with all values achieving statistical significance (p < 0.05) (Figure 5).

Figure 4. Relationships between normalized entropy increase% and blood lactate for all data points in the group.
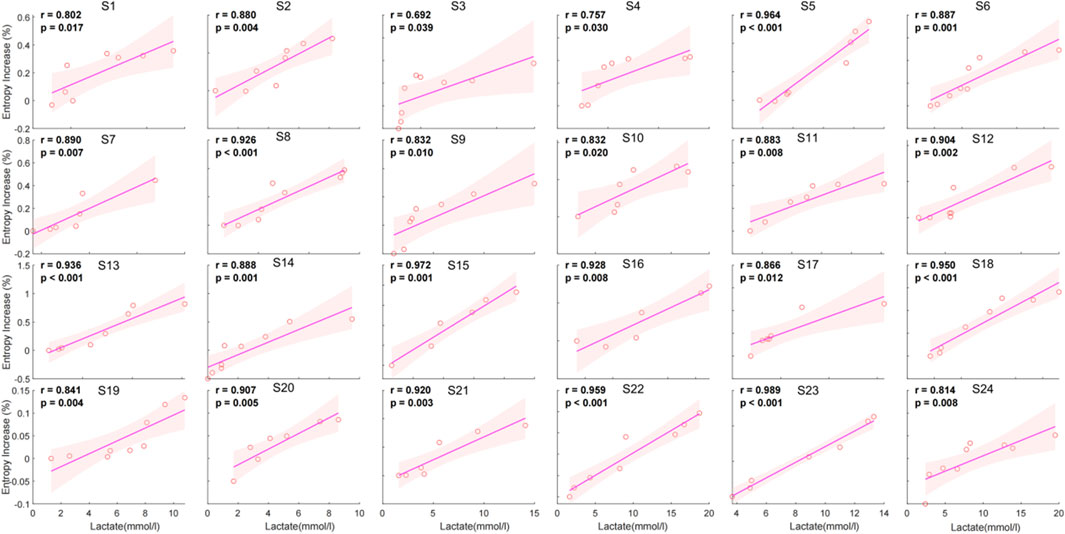
Figure 5. Individual correlation between entropy increase percentage and lactate for 24 individuals.
3.3 Correlation analysis of chest temperature entropy and external load
The polynomial fitting analysis between normalized entropy increase percentage and normalized external load reveals a significant positive correlation (R2 = 0.8412, p < 0.001). The fitting equation is (y = 0.1605x2 + 6.6319x + 0.1242), indicating a strong quadratic relationship between entropy increase and external load. As the entropy increase percentage rises, the normalized external load also increases, demonstrating their robust association (Figure 6).
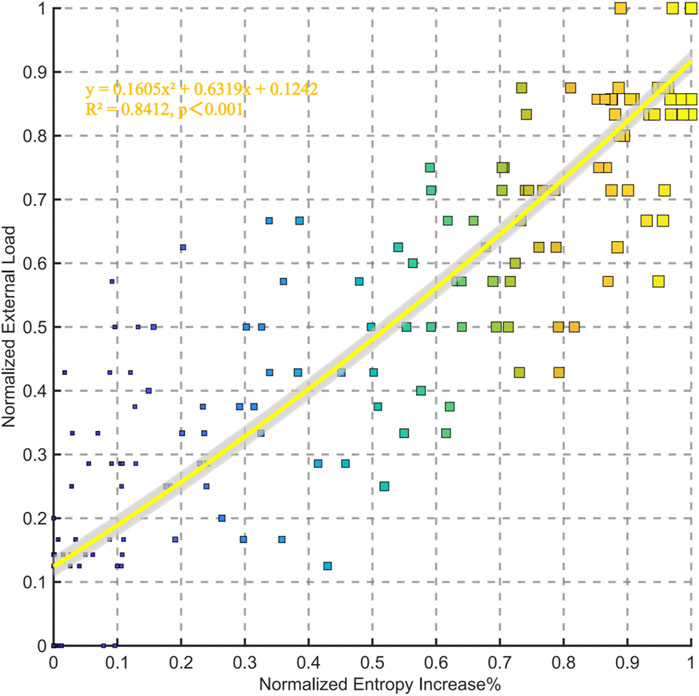
Figure 6. Relationships between normalized entropy increase% and external load for all data points in the group.
The individual correlation analysis indicates a strong positive relationship between entropy increase percentage and external load across all subjects. The correlation coefficients (r) range from 0.889 to 0.986, with all values being statistically significant (p < 0.05) (Figure 7).
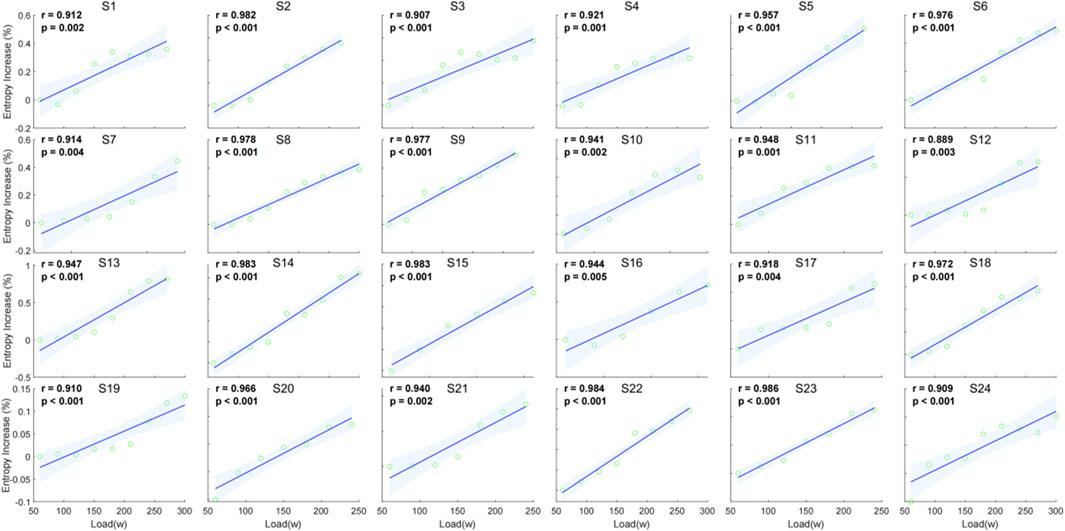
Figure 7. Individual correlation between entropy increase percentage and external load (watt) for 24 individuals.
3.4 Correlation analysis of chest temperature entropy and EPOC
The correlation analysis between chest temperature entropy accumulation and EPOC demonstrated a significant positive association. Polynomial fitting analysis generated the quadratic model y = 0.1831x2 + 0.2845x–0.1648 (R2 = 0.1511, p < 0.001), statistically validating the proportional relationship between entropy accumulation and EPOC magnitude (Figure 8).
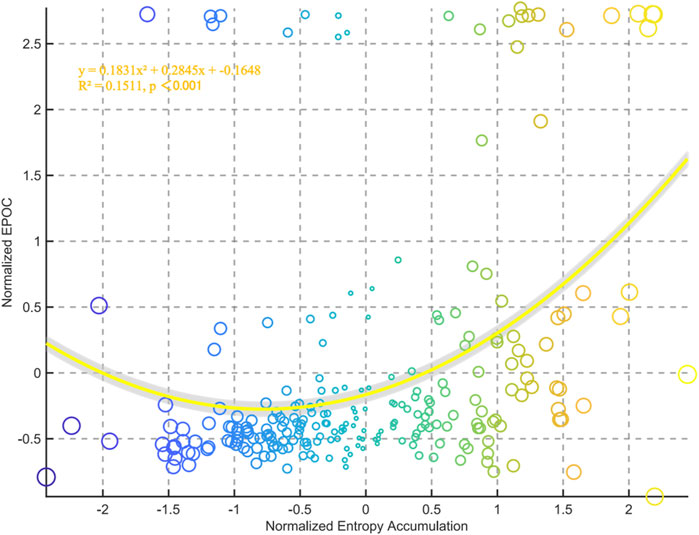
Figure 8. Relationships between normalized entropy accumulation and external EPOC for all data points in the group.
The correlation analysis between chest temperature entropy accumulation and EPOC demonstrates variable relationships across individuals. Significant positive correlations were observed in several subjects, with the strongest correlations found in S4 (r = 0.889, p < 0.001), S11 (r = 0.889, p < 0.001), and S16 (r = 0.907, p < 0.001). Conversely, weaker or non-significant correlations were noted in other subjects, such as S1 (r = 0.077, p = 0.832), S3 (r = −0.117, p = 0.732), and S17 (r = −0.288, p = 0.809). These findings suggest that the relationship between entropy accumulation and EPOC is not consistent across individuals, highlighting individual variability in this physiological response (Figure 9).
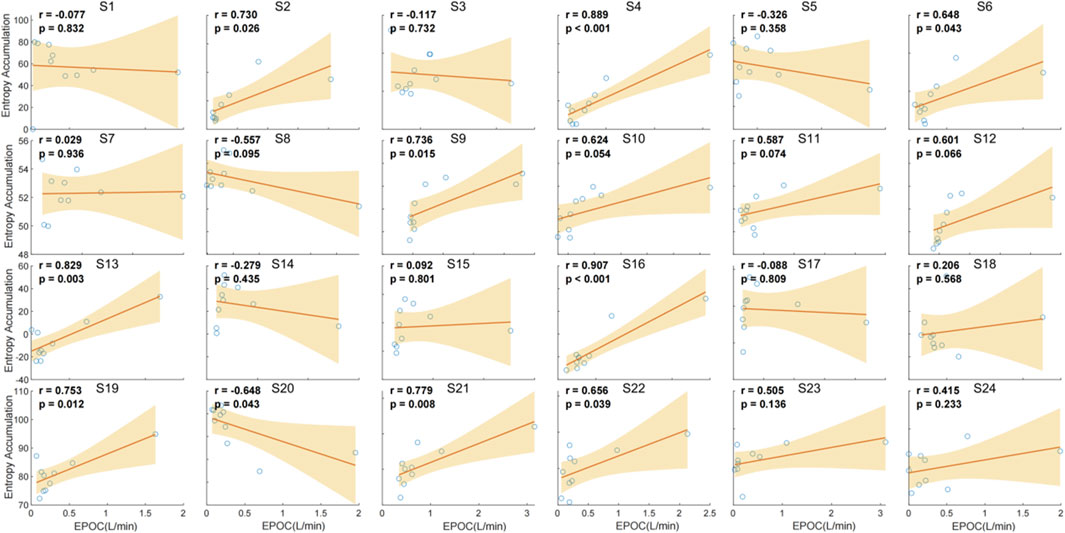
Figure 9. Individual correlation between entropy accumulation and EPOC (L/min) for 24 individuals.
3.5 Three-dimensional cluster analysis based on chest temperature entropy, oxygen uptake and blood lactate
The hierarchical clustering analysis, based on Z-score standardized entropy increase percentage, blood lactate, and VO2, identifies three clusters. Cluster 1 shows low blood lactate, VO2, and negative entropy increase. Cluster 2 represents a moderate metabolic state with moderate blood lactate, VO2, and positive entropy increase. Cluster 3 reflects a high metabolic demand with high blood lactate, VO2, and entropy increase (Figure 10).
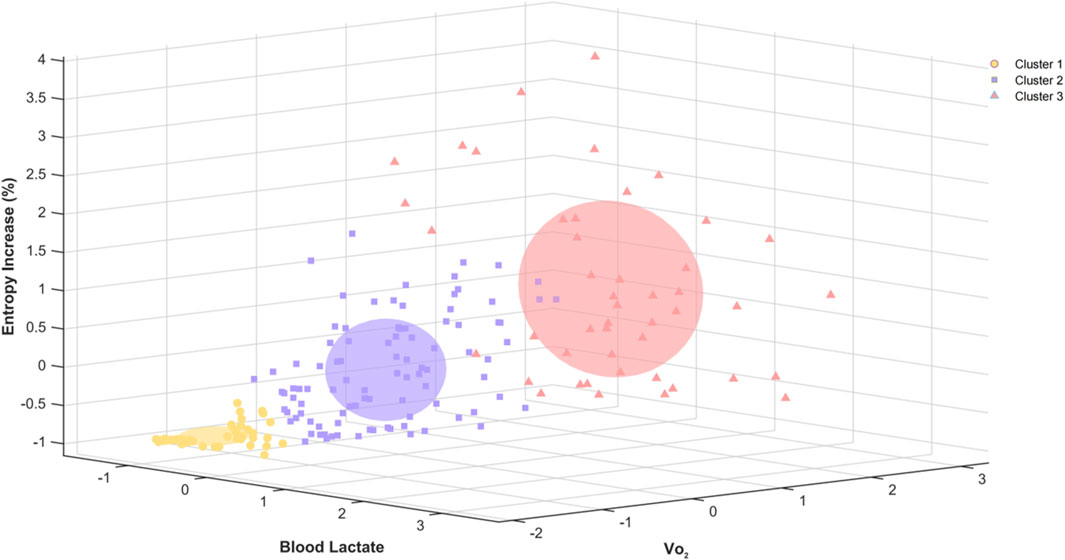
Figure 10. Three-dimensional hierarchical clustering of entropy increase percentage, blood lactate, and VO2 based on Z-score standardization.
4 Disscusion
This study reveals the value of chest temperature entropy in monitoring metabolic responses during incremental exercise. By analyzing the multidimensional physiological responses of 24 participants during incremental cycling, we established for the first time a quantitative relationship between the temperature entropy parameter and the energy metabolism system during and after incremental exercise. The findings show that the standardized percentage increase in chest temperature entropy has a significant non-linear positive correlation with VO2, blood lactate concentration, and external load. The primary aim was to evaluate the feasibility of infrared thermography–based chest temperature entropy analysis for assessing both internal and external exercise load, as well as characterizing recovery dynamics in the EPOC phase; the findings supported this hypothesis. Three-dimensional hierarchical clustering analysis grouped blood lactate, oxygen uptake, and chest temperature entropy into three clusters, corresponding to low, moderate, and high metabolic load states. The relationship between temperature entropy and EPOC exhibited considerable individual heterogeneity.
The strong positive correlation between chest temperature entropy and oxygen uptake (VO2) suggests that an increase in metabolic demand is accompanied by a rise in the disorder of the thermodynamic system of body surface temperature. The increase in entropy serves as a quantitative description of the surface thermal radiation patterns of skin temperature during exercise. During exercise, external load increases muscle work intensity, requiring more oxygen consumption and heat production by the body. Metabolic heat is regulated through superficial vasodilation (Stone et al., 2025; Rosbrook et al., 2024). Research shows that metabolic heat production during endurance exercise can increase by 10–20 times compared to resting, and this increase can persist for several hours (Lim et al., 2008). These studies suggest that thermoregulation ability reflects muscle work and related metabolic information during exercise, and this study further demonstrates that the entropy of body surface chest temperature is strongly positively correlated with oxygen uptake levels both overall and individually.
The difference between this study and previous research on skin temperature and blood lactate lies in the introduction of the concept of thermodynamic entropy. For the first time, this study verifies the strong correlation between blood lactate and chest entropy during exercise, further revealing the regulatory role of anaerobic metabolism in thermodynamics. Adamczyk et al. measured the static lower limb thermal imaging and corresponding lactate collection before and 30 min after completion of a vertical jump exercise in 16 untrained men. They found a weak negative correlation between the two (r = −0.29) (Adamczyk et al., 2014). Although skin temperature and blood lactate in the quadriceps region were reported to be positively correlated (r = 0.69), the intermittent sprint pattern resulted in a temporal misalignment between temperature and lactate sampling, which may have confounded the thermal metabolic signals of exercise stress and recovery (Temfemo et al., 2011). Recent studies have shown a moderate positive correlation (r = 0.43–0.48) between lower limb skin temperature and blood lactate during incremental exercise in sprinters and endurance athletes, which turns into a negative correlation during the recovery phase (r = −0.54∼-0.45). However, due to the low-frequency measurement of a single region (sampling interval ≥2 min during exercise, 5 min during recovery), the spatiotemporal regulatory mechanism of the interaction between the two remains unclear (Korman et al., 2024). This study fills the gap in previous research by synchronously collecting high-sampling-rate thermal imaging and blood lactate data, and directly verifies the strong correlation between chest temperature entropy and blood lactate concentration, as well as the existence of individual response differences.
This study demonstrates a strong correlation between chest temperature entropy and external load (watt) both at the overall and individual levels during incremental exercise, suggesting that the thermoregulation mechanism of the body may exhibit significant dynamic changes at different intensities of exercise. However, this study demonstrates the sensitivity of thermoregulation (entropy increase) in the chest region to both internal and external load increases. This region covers key respiratory muscles, including the heart, intercostal muscles, and external intercostal muscles (De Troyer et al., 2005), all of which increase metabolic activity during exercise, generating significant heat. Compared to the limbs, the chest has a thinner subcutaneous fat layer, which reduces thermal conductivity resistance, making it easier for deep tissue heat to be transferred to the skin surface (Rodríguez de Rivera et al., 2022; Neves et al., 2015). The surface thermal radiation pattern during exercise may be regulated by multiple systems. It is believed that IRT captures the Psr, which reflects the regulation of body surface blood vessels during exercise. Sympathetic nervous system activation, driven by the sympathetic-adrenal axis, releases norepinephrine and neuropeptide Y, which mediate the constriction of skin arterioles via α-adrenergic receptors, thereby regulating cutaneous blood circulation (Ootsuka and Tanaka, 2015). Meanwhile, increased muscle metabolic heat leads to elevated venous blood temperature. When venous blood temperature exceeds the core temperature threshold, the hypothalamus activates the vasodilation system through cholinergic non-adrenergic pathways, promoting the expansion of subcutaneous blood vessel networks (Demachi et al., 2013). At this point, heat is transferred from deep tissues to the skin surface through superficial veins and perforator vessels, forming a branching radiation pattern of the vascular tree to enhance skin thermal convection efficiency (Demachi et al., 2013; Hillen et al., 2020). This radiation pattern reflects the compensatory mechanism of the body to maintain core temperature stability by enhancing superficial blood flow heat dissipation under critical thermal load conditions. This study quantitatively characterizes the dynamic heterogeneity of chest skin thermal radiation patterns through entropy analysis and provides evidence for their significant synchronous dynamic correlation with blood lactate concentration, external load, and oxygen uptake during incremental exercise, as well as the existence of individual differences.
EPOC refers to the physiological phenomenon where oxygen consumption remains elevated above resting levels after exercise (Gaesser and Brooks, 1984). EPOC magnitude and duration vary according to exercise intensity and modality, with intermittent exercise generally producing a greater and more prolonged effect compared to continuous aerobic exercise (LaForgia et al., 2006). EPOC at different exercise intensities helps assess an individual’s recovery capacity and adaptability to exercise load. This study further supports the relationship between chest temperature entropy and EPOC. The overall correlation is weak, likely because thermoregulation during exercise is primarily controlled by blood circulation and heat dissipation mechanisms (Moreira et al., 2017). In contrast, the oxygen consumed during EPOC is mainly used to restore internal balance disrupted during exercise, including processes such as replenishing ATP and phosphocreatine, lactate clearance, and muscle glycogen resynthesis (Panissa et al., 2021). Moreover, the recovery of skin temperature lags behind the recovery of the energy metabolism system. During the post-exercise period, peripheral vasodilation persists after muscle contraction ceases, partly due to reduced venous return and sustained dilation of cutaneous vessels, contributing to post-exercise hypotension (Seeley et al., 2021). This vasodilatory response is mediated in part by cholinergic active vasodilation, which increases skin blood flow to dissipate heat generated during exercise (Francisco et al., 2023). In addition, nitric oxide released during recovery can directly relax cutaneous arterial smooth muscle, enhancing heat dissipation and potentially increasing local skin temperature in active muscle regions (Amato et al., 2025). These physiological processes may explain the observed elevation in chest temperature entropy during early recovery. Individual differences may be explained by the interaction of multiple factors, such as training experience, body composition, and local tissue metabolic states (Formenti et al., 2013; Priego Quesada et al., 2015; Weigert et al., 2018). Post-exercise metabolic rate may be related to cardiovascular fitness, mitochondrial and cellular remodeling, and autonomic nervous regulation efficiency (Greer et al., 2021). Although there is considerable individual heterogeneity and nonlinear associations between post-exercise thermal metabolic parameters and physiological recovery indicators, dynamic data from skin temperature fields obtained using infrared thermography, combined with entropy analysis of nonlinear dynamic features, can quantify the post-exercise thermal balance reconstruction process. This provides new biophysical markers for establishing a non-invasive, low-cost recovery monitoring system.
Based on the hierarchical clustering analysis results of incremental exhaustion exercise, chest temperature entropy demonstrates distinct stratified characteristics at different exercise intensities, effectively reflecting changes in metabolic states. The clustering analysis shows that chest temperature entropy has a good classification effect with the two exercise intensity markers, blood lactate and VO2. The three clusters correspond to low, moderate, and high physiological metabolic states at different exercise intensities. Chest temperature entropy can be used as an effective indicator for assessing exercise intensity, corresponding well with traditional physiological markers such as blood lactate and VO2. Compared to previous studies that used three-dimensional K-means clustering of VO2, entropy increase, and power into three clusters (Hu et al., 2025), this study further demonstrates the relationship between chest entropy increase and changes in internal load through hierarchical clustering, revealing the adaptability of using chest temperature entropy in exercise load assessment.
The strength of this study lies in the use of high-temporal-resolution infrared thermography to synchronously collect chest temperature entropy together with key exercise load monitoring indicators such as oxygen uptake, blood lactate concentration, and external power output during incremental exercise and recovery. This approach enabled a quantitative assessment of the association between thermoregulatory processes and metabolic responses, and the study provides the first empirical evidence of significant dynamic correlations between chest temperature entropy and traditional load monitoring indicators, supporting its potential feasibility as an exercise load assessment tool. Although this study demonstrates the potential of chest temperature entropy in monitoring metabolic responses during incremental exercise, it still has several limitations. Due to the need to expose the chest region for thermal imaging data collection, and for privacy protection and ethical considerations, this study included only 24 healthy young male participants. This design avoids the confounding effect of gender on temperature entropy but limits the generalizability of the findings to women or other age groups. Future work will explore ROIs that do not require direct chest exposure, enabling the safe inclusion of female participants and extending the applicability of this method to more diverse populations. Additionally, EPOC data were only collected during the first 10 min post-exercise, while excess post-exercise oxygen consumption can persist for several hours after high-intensity exercise. The lack of continued monitoring during the later recovery phase may have led to an underestimation of the dynamic correlation strength between temperature entropy and EPOC. Furthermore, due to the invasive nature of blood lactate monitoring, lactate concentration data were not collected during the recovery phase, preventing the exploration of the relationship between lactate metabolic recovery and changes in chest temperature entropy.
5 Perspective
The present findings suggest that infrared thermography–based chest temperature entropy analysis holds potential as a tool for monitoring exercise load. This method is non-invasive and relatively low-cost, enabling data acquisition without interfering with the activity itself and minimizing additional physiological or psychological stress on participants. As a complement to existing load monitoring systems, the temperature entropy parameter may offer an additional dimension of information related to thermoregulation and metabolic dynamics. Because this technique does not require wearable sensors, it could, in principle, be applied in open environments, in simultaneous monitoring of multiple individuals, and under non-laboratory conditions, offering practical applicability. Future studies with larger sample sizes and diverse activity contexts, combined with automated image extraction and computation techniques, are warranted to validate its stability and enhance its efficiency for real-world monitoring.
6 Conclusion
This study, using high-sampling-rate infrared thermography and simultaneous measurement of internal and external loads, is, to our knowledge, the first to reveal the quantitative relationship between chest temperature entropy and VO2, blood lactate concentration, and external load during exercise. It was found that the percentage increase in chest temperature entropy is significantly positively correlated in a non-linear fashion with these indicators, as well as positively correlated across individuals. Three-dimensional hierarchical clustering analysis shows that chest temperature entropy effectively distinguishes between low, moderate, and high metabolic load states and provides a good classification performance when compared to traditional physiological markers such as blood lactate and VO2. Furthermore, the relationship between chest temperature entropy and EPOC displays considerable individual heterogeneity. This study provides a quantitative surface thermal radiation pattern analysis through high-sampling-rate infrared thermography, offering a new biophysical marker for non-invasive monitoring of exercise load and recovery processes.
Data availability statement
The original contributions presented in the study are included in the article/Supplementary Material, further inquiries can be directed to the corresponding author.
Ethics statement
The studies involving humans were approved by Institutional Review Board of Beijing Sport University. The studies were conducted in accordance with the local legislation and institutional requirements. The participants provided their written informed consent to participate in this study.
Author contributions
SC: Writing – original draft. ND: Writing – original draft. ZL: Conceptualization, Methodology, Writing – original draft. CH: Methodology, Supervision, Writing – original draft, Writing – review and editing.
Funding
The author(s) declare that no financial support was received for the research and/or publication of this article.
Conflict of interest
The authors declare that the research was conducted in the absence of any commercial or financial relationships that could be construed as a potential conflict of interest.
Generative AI statement
The author(s) declare that no Generative AI was used in the creation of this manuscript.
Any alternative text (alt text) provided alongside figures in this article has been generated by Frontiers with the support of artificial intelligence and reasonable efforts have been made to ensure accuracy, including review by the authors wherever possible. If you identify any issues, please contact us.
Publisher’s note
All claims expressed in this article are solely those of the authors and do not necessarily represent those of their affiliated organizations, or those of the publisher, the editors and the reviewers. Any product that may be evaluated in this article, or claim that may be made by its manufacturer, is not guaranteed or endorsed by the publisher.
Supplementary material
The Supplementary Material for this article can be found online at: https://www.frontiersin.org/articles/10.3389/fphys.2025.1631729/full#supplementary-material
References
Adamczyk J., Boguszewski D., Siewierski M. (2014). Thermographic evaluation of lactate level in capillary blood during post-exercise recovery. Kinesiology 2014, 186–193. Available online at: https://hrcak.srce.hr/131892
Akimov E. B., Andreev R. S., Kalenov Iu N., Kirdin A. A., Son'kin V. D., Tonevitskiĭ A. G. (2010). Human temperature portrait and its relations with aerobic working capacity and the level of blood lactate. Fiziol. Cheloveka 36 (4), 89–101. doi:10.1134/S0362119710040109
Amato A., Petrigna L., Sortino M., Amorim P. R. S., Musumeci G. (2025). Water retention influences thigh skin temperature variation post-exercise: preliminary study of bioimpedance analysis and thermography data. Front. Sports Act. Living 7, 1516570. doi:10.3389/fspor.2025.1516570
Bini R., Hume P. A., Croft J. L. (2011). Effects of bicycle saddle height on knee injury risk and cycling performance. Sports Med. Auckl. 41 (6), 463–476. doi:10.2165/11588740-000000000-00000
Bogomilsky S., Hoffer O., Shalmon G., Scheinowitz M. (2022). Preliminary study of thermal density distribution and entropy analysis during cycling exercise stress test using infrared thermography. Sci. Rep. 12 (1), 14018. doi:10.1038/s41598-022-18233-5
Borresen J., Lambert M. I. (2009). The quantification of training load, the training response and the effect on performance. Sports Med. Auckl. 39 (9), 779–795. doi:10.2165/11317780-000000000-00000
Bourdon P. C., Cardinale M., Murray A., Gastin P., Kellmann M., Varley M. C., et al. (2017). Monitoring athlete training loads: consensus statement. Int. J. Sports Physiology Perform. 12 (Suppl. 2), S2161–S2170. doi:10.1123/IJSPP.2017-0208
Costello J., Stewart I., Selfe J., Kärki A., Donnelly A. (2013). Use of thermal imaging in sports medicine research: a short report. Int. Sportmed J. 14, 94–98.
De Troyer A., Kirkwood P. A., Wilson T. A. (2005). Respiratory action of the intercostal muscles. Physiol. Rev. 85 (2), 717–756. doi:10.1152/physrev.00007.2004
del Estal A., Brito C. J., Galindo V. E., Lopez Diaz de Durana A., Franchini E., Sillero-Quintana M. (2017). Thermal asymmetries in striking combat sports athletes measured by infrared thermography. Sci. Sports 32 (2), e61–e67. doi:10.1016/j.scispo.2016.09.005
Demachi K., Yoshida T., Kume M., Tsuji M., Tsuneoka H. (2013). The influence of internal and skin temperatures on active cutaneous vasodilation under different levels of exercise and ambient temperatures in humans. Int. J. Biometeorol. 57 (4), 589–596. doi:10.1007/s00484-012-0586-y
Faude O., Kindermann W., Meyer T. (2009). Lactate threshold concepts: how valid are they? Sports Med. Auckl. 39 (6), 469–490. doi:10.2165/00007256-200939060-00003
Formenti D., Ludwig N., Gargano M., Gondola M., Dellerma N., Caumo A., et al. (2013). Thermal imaging of exercise-associated skin temperature changes in trained and untrained female subjects. Ann. Biomed. Eng. 41 (4), 863–871. doi:10.1007/s10439-012-0718-x
Francisco M. A., Gibson B. M., Simmons G. H., Halliwill J. R., Minson C. T. (2023). Cholinergic nerve contribution to cutaneous active vasodilation during exercise is similar to whole body passive heating. J. Appl. Physiol. (Bethesda, Md 1985) 134 (4), 933–940. doi:10.1152/japplphysiol.00299.2022
Gaesser G. A., Brooks G. A. (1984). Metabolic bases of excess post-exercise oxygen consumption: a review. Med. Sci. Sports Exerc. 16 (1), 29–43. doi:10.1249/00005768-198401000-00008
Galan-Carracedo J., Suarez-Segade A., Guerra-Balic M., Oviedo G. R. (2019). The dynamic and correlation of skin temperature and cardiorespiratory fitness in male endurance runners. Int. J. Environ. Res. Public Health 16 (16), 2869. doi:10.3390/ijerph16162869
Greer B. K., O'Brien J., Hornbuckle L. M., Panton L. B. (2021). EPOC comparison between resistance training and high-intensity interval training in aerobically fit women. Int. J. Exerc. Sci. 14 (2), 1027–1035. doi:10.70252/ODIN6912
Halson S. L. (2014). Monitoring training load to understand fatigue in athletes. Sports Med. Auckl. 44 Suppl 2 (Suppl. 2), S139–S147. doi:10.1007/s40279-014-0253-z
Hillen B., Pfirrmann D., Nägele M., Simon P. (2020). Infrared thermography in exercise physiology: the dawning of exercise radiomics. Sports Med. Auckl. 50 (2), 263–282. doi:10.1007/s40279-019-01210-w
Hu C., Du N., Liu Z., Song Y. (2025). Can infrared thermal imaging reflect exercise load? An incremental cycling exercise study. Bioeng. (Basel, Switz) 12 (3), 280. doi:10.3390/bioengineering12030280
Impellizzeri F. M., Marcora S. M., Coutts A. J. (2019). Internal and external training load: 15 Years on. Int. J. Sports Physiology Perform. 14 (2), 270–273. doi:10.1123/ijspp.2018-0935
Korman P., Kusy K., Straburzyńska-Lupa A., Kantanista A., Quintana M. S., Zieliński J. (2024). Response of skin temperature, blood ammonia and lactate during incremental exercise until exhaustion in elite athletes. Sci. Rep. 14 (1), 2237. doi:10.1038/s41598-024-52374-z
LaForgia J., Withers R. T., Gore C. J. (2006). Effects of exercise intensity and duration on the excess post-exercise oxygen consumption. J. Sports Sci. 24 (12), 1247–1264. doi:10.1080/02640410600552064
Liao F., Yang T. D., Wu F. L., Cao C., Mohamed A., Jan Y. K. (2019). Using multiscale entropy to assess the efficacy of local cooling on reactive hyperemia in people with a spinal cord injury. Entropy (Basel, Switz). 21 (1), 90. doi:10.3390/e21010090
Lim C. L., Byrne C., Lee J. K. (2008). Human thermoregulation and measurement of body temperature in exercise and clinical settings. Ann. Acad. Med. Singap. 37 (4), 347–353. doi:10.47102/annals-acadmedsg.v37n4p347
Lu S., Hu H., Jin C., Tian H. (2024). Multimodal monitoring mode and practical strategies for sports training load China sports science and technology. China Sport Science Technol 60(01):33–45+60.
Ludwig N., Trecroci A., Gargano M., Formenti D., Bosio A., Rampinini E., et al. (2016). Thermography for skin temperature evaluation during dynamic exercise: a case study on an incremental maximal test in elite male cyclists. Appl. Opt. 55 (34), D126–D130. doi:10.1364/AO.55.00D126
Masur L., Brand F., Düking P. (2024). Response of infrared thermography related parameters to (non-)sport specific exercise and relationship with internal load parameters in individual and team sport athletes-a systematic review. Front. Sports Act. living 6, 1479608. doi:10.3389/fspor.2024.1479608
Moreira D. G., Costello J. T., Brito C. J., Adamczyk J. G., Ammer K., Bach A. J. E., et al. (2017). Thermographic imaging in sports and exercise medicine: a Delphi study and consensus statement on the measurement of human skin temperature. J. Therm. Biol. 69, 155–162. doi:10.1016/j.jtherbio.2017.07.006
Neves E., Moreira T. R., Canário-Lemos R., Alves J., Rosa C., Reis V. (2015). The influence of subcutaneous fat in the skin temperature variation rate during exercise. Res. Biomed. Eng. 31, 307–312. doi:10.1590/2446-4740.0805
Ootsuka Y., Tanaka M. (2015). Control of cutaneous blood flow by central nervous system. Temp. (Austin, Tex) 2 (3), 392–405. doi:10.1080/23328940.2015.1069437
Panissa V. L. G., Fukuda D. H., Staibano V., Marques M., Franchini E. (2021). Magnitude and duration of excess of post-exercise oxygen consumption between high-intensity interval and moderate-intensity continuous exercise: a systematic review. Obes. Rev. official J. Int. Assoc. Study Obes. 22 (1), e13099. doi:10.1111/obr.13099
Perpetuini D., Formenti D., Cardone D., Filippini C., Merla A. (2021). Regions of interest selection and thermal imaging data analysis in sports and exercise science: a narrative review. Physiol. Meas. 42 (8), 08TR01. doi:10.1088/1361-6579/ac0fbd
Poole D. C., Jones A. M. (2017). Measurement of the maximum oxygen uptake V̇o(2max): V̇o(2peak) is no longer acceptable. J. Appl. Physiology (Bethesda, Md 1985) 122 (4), 997–1002. doi:10.1152/japplphysiol.01063.2016
Priego Quesada J. I., Carpes F. P., Bini R. R., Salvador Palmer R., Pérez-Soriano P., Cibrián Ortiz de Anda R. M. (2015). Relationship between skin temperature and muscle activation during incremental cycle exercise. J. Therm. Biol. 48, 28–35. doi:10.1016/j.jtherbio.2014.12.005
Rapp M. P., Bergstrom N., Padhye N. S. (2009). Contribution of skin temperature regularity to the risk of developing pressure ulcers in nursing facility residents. Adv. Skin Wound Care 22 (11), 506–513. doi:10.1097/01.ASW.0000305496.15768.82
Rodríguez de Rivera P. J., Rodríguez de Rivera M., Socorro F., Callicó G. M., Calbet J. A. L., Rodríguez de Rivera M. (2022). Heat flow, heat capacity and thermal resistance of localized surfaces of the human body using a new calorimetric sensor. J. Therm. Analysis Calorim. 147 (13), 7385–7398. doi:10.1007/s10973-021-11062-0
Rosbrook P., Sweet D., Qiao J., Looney D. P., Margolis L. M., Hostler D., et al. (2024). Heat stress increases carbohydrate oxidation rates and oxygen uptake during prolonged load carriage exercise. Temp. (Austin, Tex) 11 (2), 170–181. doi:10.1080/23328940.2024.2322920
Seeley A. D., Giersch G. E. W., Charkoudian N. (2021). Post-exercise body cooling: skin blood flow, venous pooling, and orthostatic intolerance. Front. Sports Act. living. 3, 658410. doi:10.3389/fspor.2021.658410
Shei R. J., Holder I. G., Oumsang A. S., Paris B. A., Paris H. L. (2022). Wearable activity trackers-advanced technology or advanced marketing? Eur. J. Appl. Physiology 122 (9), 1975–1990. doi:10.1007/s00421-022-04951-1
Sillero-Quintana M., Jones-Rando J., Refoyo I., Marins J. C. B., Seixas A. (2022). Effects of resistance training on skin temperature and its relationship with central nervous system (CNS) activation. Healthc. (Basel, Switz). 10 (2), 207. doi:10.3390/healthcare10020207
Sitko S., Cirer-Sastre R., Corbi F., López-Laval I. (2020). Power assessment in road cycling: a narrative review. Sustainability 12 (12), 5216. doi:10.3390/su12125216
Stone T., Burnash S. G., Earley R. L., Mulholland A. M., Yoder H. A., Macdonald H. V., et al. (2025). Metabolic heat production modulates the cardiovascular drift-V̇O 2max relationship independent of aerobic fitness in women. Med. Sci. Sports Exerc. 57 (1), 181–191. doi:10.1249/MSS.0000000000003543
Temfemo A., Carling C., Ahmaidi S. (2011). Relationship between power output, lactate, skin temperature, and muscle activity during brief repeated exercises with increasing intensity. J. strength Cond. Res. 25 (4), 915–921. doi:10.1519/JSC.0b013e3181d680f0
Verderber L., da Silva W., Aparicio-Aparicio I., Germano A. M. C., Carpes F. P., Priego-Quesada J. I. (2024). Assessment of alternative metrics in the application of infrared thermography to detect muscle damage in sports. Physiol. Meas. 45 (9), 095014. doi:10.1088/1361-6579/ad7ad3
Vicari D. S. S., Patti A., Giustino V., Figlioli F., Alamia G., Palma A., et al. (2023). Saddle pressures factors in road and off-road cyclists of both genders: a narrative review. J. Funct. Morphol. Kinesiol. 8 (2), 71. doi:10.3390/jfmk8020071
Keywords: thermal imaging, entropy analysis, incremental exercise protocol, oxygen consumption, blood lactate response
Citation: Cui S, Du N, Liu Z and Hu C (2025) Dynamic correlation between chest temperature entropy and physiological load indicators, and excess post-exercise oxygen consumption during incremental cycling exercise. Front. Physiol. 16:1631729. doi: 10.3389/fphys.2025.1631729
Received: 20 May 2025; Accepted: 28 August 2025;
Published: 10 September 2025.
Edited by:
Cristian Romagnoli, Università telematica San Raffaele, ItalyReviewed by:
Valerio Giustino, University of Palermo, ItalyFelipe Gorini Pereira, San Jose State University, United States
Danielle Sterner, University of Central Florida, United States
Copyright © 2025 Cui, Du, Liu and Hu. This is an open-access article distributed under the terms of the Creative Commons Attribution License (CC BY). The use, distribution or reproduction in other forums is permitted, provided the original author(s) and the copyright owner(s) are credited and that the original publication in this journal is cited, in accordance with accepted academic practice. No use, distribution or reproduction is permitted which does not comply with these terms.
*Correspondence: Chenxi Hu, aGN4MjEyMzI0QDE2My5jb20=
†These authors have contributed equally to this work