 Wei Chen1,2†Shiyuan Cheng1,2†
 Yan Liu1,2Zhaoting Wu1,2Fuli Zhang1,2
 Xianju Huang1,2Guidong Yao1,2Wenyan Song1,2
 Haixia Jin1,2*
- 1Center for Reproductive Medicine, The First Affiliated Hospital of Zhengzhou University, Zhengzhou, China
- 2Henan Key Laboratory of Reproduction and Genetics, The First Affiliated Hospital of Zhengzhou University, Zhengzhou, China
Background: Reliable key performance indicators (KPIs) have been proposed to facilitate the quality management of embryo laboratories. However, the effects of controlled ovarian stimulation (COS) protocols on KPIs have not been adequately explored. This study aims to assess the variation in KPIs across four different COS protocols.
Methods: We retrospectively analyzed 51,728 IVF/ICSI cycles in our center between 2014 and 2022. They were divided into four groups based on COS protocols: follicular phase long-acting (FPL) GnRH-a long, luteal phase short-acting (LPS) GnRH-a long, GnRH-ant, and micro-stimulation protocol groups. Several KPIs were compared across the four groups, and the results were validated in three age bands (<35 years, 35–38 years, and >38 years). Multivariable regression analysis was conducted to assess the effect of COS protocols on KPIs.
Results: 1) Significant differences were observed among the four groups in total blastocyst development rate (BLR) (56.2%, 54.1%, 49.7%, 29.5%, p < 0.001), total good blastocyst development rate (GBLR) (26.8%, 30.4%, 21.1%, 13.1%, p < 0.001), and implantation rate (46.6%, 30.7%, 24.2%, 13.1%, p < 0.001). 2) The LPS GnRH-a group showed a higher total GBLR (30.4%, 26.8%, p < 0.001) but a lower implantation rate compared to the FPL GnRH-a group (30.7%, 46.6%, p < 0.001). 3) Significant differences in KPIs were observed across all age groups, with the largest differences seen in women under 35 years 4) Multivariate logistic regression analysis revealed that these KPIs were significantly associated with the COS protocol.
Conclusion: COS protocols significantly impact KPIs, suggesting that explore reliable KPIs according to treatment protocols could better evaluate the laboratory efficacy and provide a theoretical basis for personalized strategies for patients.
1 Introduction
Quality management in assisted reproductive technology (ART) laboratories is directly linked to embryo development and pregnancy outcomes. The introduction of data quality control management is not only essential for improving ART but also critical for advancing the field as a whole (Mayer et al., 2003). For instance, a previous study by Scaravelli and Giulia demonstrated that fertilization rate could serve as a key performance indicator (KPI) associated with the cumulative live birth rate (Scaravelli et al., 2021), both monitoring extrinsic factors affecting IVF embryo development and predicting clinical outcomes.
The establishment of KPIs for ART laboratories, which can evaluate the efficiency of embryologists and define the ideal reference range for each KPI, has long been discussed. The Association of Clinical Embryologists (ACE) created an international consensus that provided a set of IVF laboratory KPIs with suggested benchmarks (Hughes and Association of Clinical Embryologists, 2012). Subsequently, the Vienna Consensus (Embryology and Medicine, 2017) proposed specific competence levels and benchmark values for twelve KPIs, five performance indicators, and two reference indicators. Unlike the ACE guidelines, the Vienna Consensus also included Day 2 or 3 embryo development rate, successful biopsy rate, and implantation rate as KPIs while reclassifying the IVF/ICSI 1PN rate and IVF polyspermy rate as PIs.
Recently, the SIFES-MR and SIERR panels of experts delineated an updated set of KPIs that span both clinical and laboratory dimensions, such as the rate of cycles with moderate-to-severe ovarian hyperstimulation syndrome (OHSS) (Vaiarelli et al., 2023). Additionally, they developed a Center Performance Score formula to facilitate a comprehensive evaluation (Vaiarelli et al., 2023). Furthermore, researchers have been investigating novel KPIs, with prior studies suggesting that the Day 5 Usable Blastocyst Rate (D5BUR) (Hammond and Morbeck, 2019) and the number of MII oocytes required to produce a clinically usable embryo (Chamayou et al., 2021) can serve as innovative KPIs for quality control in the embryology laboratory.
To enhance the monitoring of clinical laboratory performance, it is essential to stratify the reference population for specific KPIs. For example, the Italian Consensus (Vaiarelli et al., 2023) has stratified the reference population based on female age, ovarian response, and the use of preimplantation genetic testing for aneuploidies (PGT-A). Carlotta (Zacà et al., 2022) et al. have further argued that KPIs related to extended embryo culture should be adjusted for advanced maternal age. These studies have been instrumental in improving quality control in embryo laboratories by enabling early detection of anomalies during in vitro culture, allowing for timely intervention and preventing issues from escalating.
Although the KPIs proposed in previous consensus documents are reliable, robust, and convenient to collect, experts have indicated that these KPIs could be further extended and refined (Hughes and Association of Clinical Embryologists, 2012; Embryology and Medicine, 2017). Threshold values for indicators included in a Total Quality Improvement plan should be based on their specific impact on outcomes and the protocols used in the laboratory (Mayer et al., 2003). Furthermore, previous research has emphasized that each center should select indicators based on laboratory organization and processes (Hughes and Association of Clinical Embryologists, 2012; Embryology and Medicine, 2017; De los Santos et al., 2016).
Controlled ovarian stimulation (COS) is a critical component in vitro fertilization-embryo transfer (IVF-ET), aiming to synchronize the development of multiple follicles. Over the past few decades, various COS protocols have been introduced, differentiating in terms of the patient population, medication timing, and associated costs. The main protocols include the luteal phase short-acting (LPS) gonadotropin-releasing hormone agonist (GnRH-a) long protocol, the follicular phase long-acting (FPL) GnRH-a long protocol, the GnRH antagonist (GnRH-ant) protocol, the short GnRH-a protocol, the micro-stimulation protocol, and the progestin-primed ovarian stimulation (PPOS) protocol. No single “optimum” protocol exists that meets all patients’ needs, and individualized protocols are highly recommended. Numerous studies have compared pregnancy outcomes and embryo quality across different protocols, but their effects on ART laboratory KPIs have not been adequately explored.
This study aims to explore reliable KPIs that reflect variation across different COS protocols, thereby facilitating the evaluation of laboratory performance. To date, no established KPIs have been tailored to COS protocols. There is limited evidence on this topic. This paper will compare the KPIs across four COS protocol groups and critically evaluate their validity and feasibility. The findings may contribute to further research on treatment protocols, provide a theoretical basis for personalized COS protocols for different patients, and offer novel suggestions for forecasting ART laboratory outcomes.
2 Methods
2.1 Patients and study design
We retrospectively analyzed medical data prospectively collected from infertile patients who underwent IVF treatment between January 2014 and December 2022 at the Reproductive Medicine Center of the First Affiliated Hospital of Zhengzhou University, Henan, China. As shown in the flowchart (Figure 1), 63,639 cycles initially met the inclusion criteria, and a total of 51,728 cycles were included in our study.
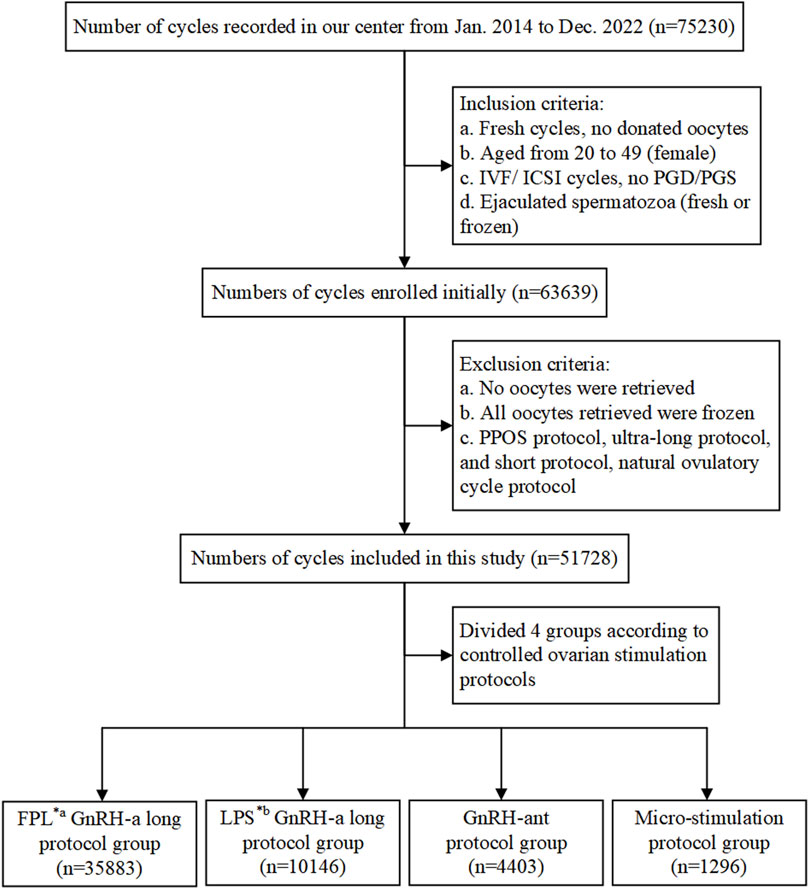
Figure 1. Flowchart showing data selection process and cycle distribution. Notes: IVF, in vitro fertilization; ICSI, intracytoplasmic sperm injection; PGD/PGS, preimplantation genetic diagnosis/screening; GnRH-a/ant, gonadotropin-releasing hormone agonist/antagonist; *a FPL, follicular phase long-acting; *b LPS, luteal phase short-acting.
The inclusion criteria were as follows: (a) fresh IVF cycles; (b) female patients aged 20–49 years; (c) routine IVF or ICSI cycles, excluding preimplantation genetic diagnosis (PGD) or preimplantation genetic screening (PGS) cycles; (d) use of ejaculated spermatozoa, whether fresh or frozen. Cycles involving donor sperm or surgically retrieved sperm were excluded from the study. Additionally, cycles were excluded if: (a) no oocytes were retrieved; (b) all retrieved oocytes were frozen for specific reasons; (c) treatment protocols with a small number of cases, including the PPOS protocol, ultra-long protocol, short protocol, or natural ovulatory cycle protocol, were used.
Patients included in the study were categorized into four groups based on the treatment protocols they received: the FPL GnRH-a long protocol group (hereinafter referred to as FPL GnRH-a group, n = 35,883), the LPS GnRH-a long protocol group (hereinafter referred to as LPS GnRH-a group, n = 10,146), the GnRH-ant protocol group (n = 4,403), and the micro-stimulation protocol group (n = 1,296). The flowchart in Figure 1 details both the inclusion and exclusion criteria, as well as the distribution of cycles.
All patients were informed of the potential use of their medical records, and the study was approved by the Ethics Committee of the First Affiliated Hospital of Zhengzhou University.
2.2 COS protocols and IVF procedures
Controlled ovarian stimulation (COS) is a critical component of IVF-ET technology, aiming to produce an optimal number of follicles developing synchronously while minimizing the risk of OHSS through the careful administration of exogenous gonadotropins at specific points in the menstrual cycle. In our center, the decision regarding which COS protocol to use is based on several factors, including patient age, body mass index (BMI), causes of infertility, ovarian reserve function, and previous response to ovulation induction drugs.
The treatment protocols adopted for the patients included in this study were the FPL GnRH-a long protocol, the LPS GnRH-a long protocol, the GnRH-ant protocol, and the micro-stimulation protocol. These four protocols differ in terms of drug selection, dosage, and timing of administration, and the standard procedures for each will be outlined below, briefly shown in Figure 2.
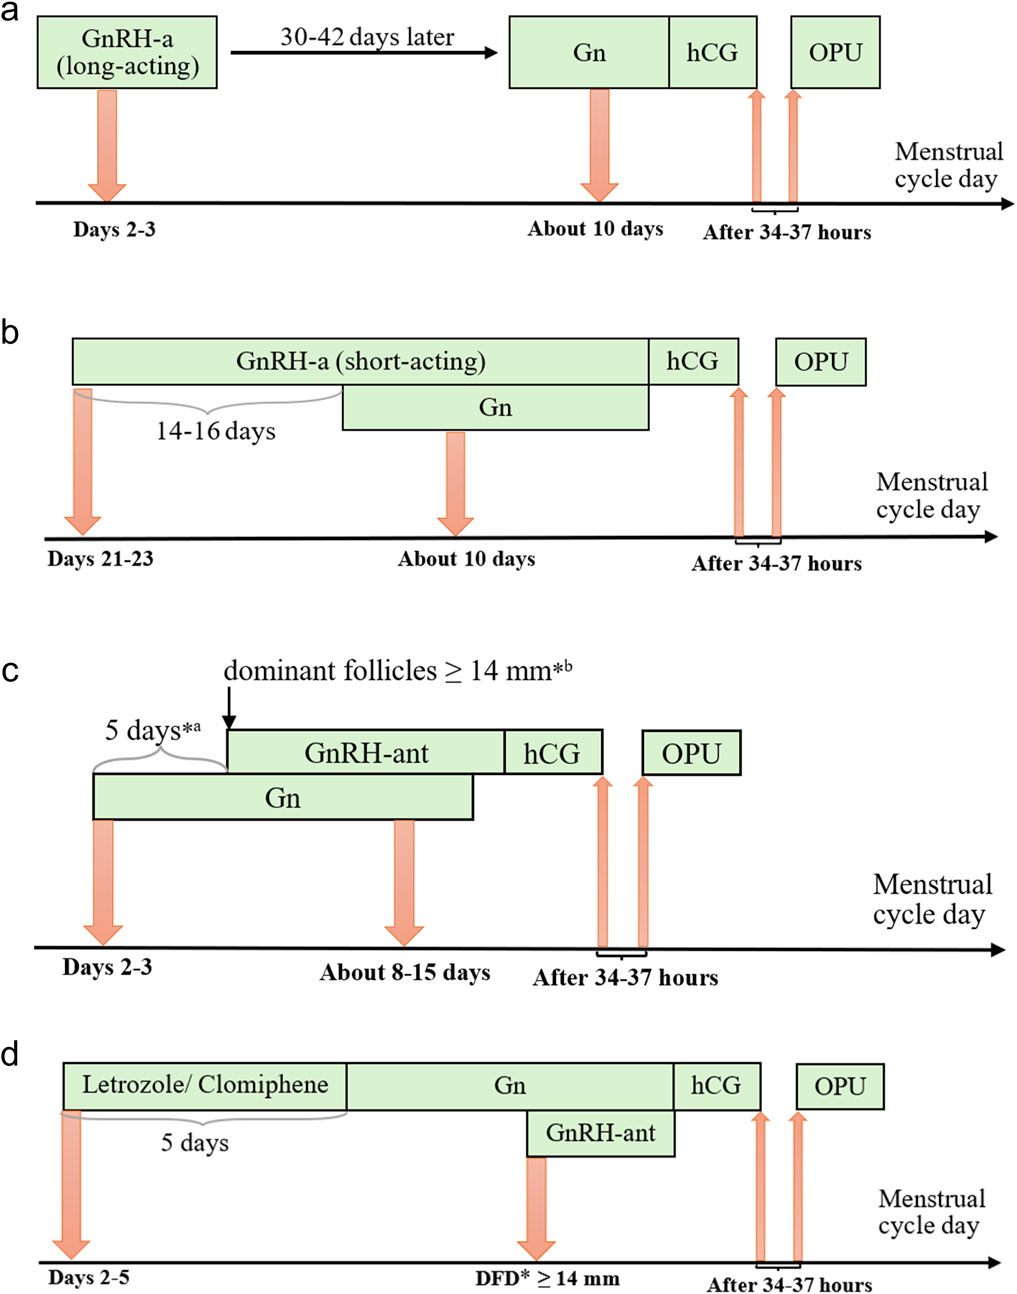
Figure 2. Protocols of controlled ovarian stimulation. Notes: (a) Long-acting GnRH-a protocol of the follicular phase, (b) Short-acting GnRH-a protocol of the luteal phase, (c) GnRH-ant protocol, and (d) Micro-stimulation protocol. Gn, gonadotropins; GnRH-a/ant, gonadotropin-releasing hormone agonist/antagonist; hCG, human chorionic gonadotropin; OPU, ovum pick-up; *a fixed protocol; *b flexible protocol; *DFD, dominant follicle diameter.
In the FPL GnRH-a long protocol, which has become increasingly prevalent in our center, a long-acting GnRH agonist (3.75 mg, Daphne, Ipsen, France) is administered on Day 2 or 3 of the menstrual cycle. After 30–42 days of downregulation, ovulation induction with gonadotropins (Gonal-f, Merck) is initiated when the following criteria are met: no follicles >10 mm in diameter, estradiol levels <183 pmol/L, and luteinizing hormone (LH) < 3 IU/L. The initial gonadotropin dose is determined based on the patient’s age, BMI, anti-Müllerian hormone (AMH) level, and previous ovarian response to COS and is adjusted during the course of stimulation according to hormone levels and follicular size. Human chorionic gonadotropin (hCG) (2000 IU, Livzon, China) and recombinant hCG (250 μg, Ovidrel, Merck, Italy) are administered when the following criteria are met: one dominant follicle ≥20 mm in diameter, at least three follicles ≥17 mm, or two-thirds of follicles ≥16 mm.
In the LPS GnRH-a long protocol cycle, a short-acting GnRH agonist (0.1 mg, Decapetyl, Ferring GmbH, Germany) is administered to patients during the mid-luteal phase (Days 21–23) of the preceding menstrual cycle. After 14–16 days, daily injections of gonadotropins (Gonal-f, Merck) are initiated when the patients meet the criteria for down-regulation, confirmed by ultrasound and serum hormone levels, as follows: endometrial thickness ≤5 mm; all follicles ≤5 mm in diameter; estradiol <183 pmol/L; FSH <5 IU/L; LH < 5 IU/L. Human chorionic gonadotropin (hCG) (2000 IU, Livzon, China) and recombinant hCG (250 μg, Merck, Italy) are administered when the follicle diameter reaches 18–20 mm.
In the GnRH-ant protocol cycle, recombinant FSH (112.5–300 IU, Puregon, Organon, The Netherlands) is administered to patients on Day 2 or 3 of the menstrual cycle. A daily injection of GnRH-ant (0.25 mg, Cetrotide, Pierre Fabre, France) is then performed using either a fixed or flexible protocol. In the fixed protocol, GnRH-ant is administered 5–6 days after ovulation triggering with gonadotropins, while in the flexible protocol, it is administered when the dominant follicles reach 14 mm in diameter. Adjustments to the gonadotropin dose, as well as the addition of FSH and exogenous LH, are made based on the estrogen levels in the follicles. Human chorionic gonadotropin (hCG) (2000 IU, Livzon, China) and recombinant hCG (250 μg, Merck, Italy) are injected when the following criteria are met: one dominant follicle ≥20 mm in diameter, two follicles ≥18 mm in diameter, or three follicles ≥17 mm in diameter.
In the micro-stimulation protocol cycle, Letrozole (5 mg/day, HENGRUI, China) or Clomiphene (100 mg/day, Codal, Cyprus) is administered orally to patients from Days 2–5 of the menstrual cycle for 5 days, followed by the administration of gonadotropins (Urofollitropin, Merck). Based on practical experience, GnRH-ant is added during the subsequent COS when the dominant follicle reaches a diameter of ≥14 mm. Monitoring is performed using vaginal ultrasound in combination with serum hormone levels, and human chorionic gonadotropin (hCG) (2000 IU, Livzon, China) and recombinant hCG (250 μg, Merck, Italy) are administered when the follicle diameter reaches 16–18 mm.
Ovum pick-up (OPU), guided by transvaginal ultrasound, was performed 34–37 h after hCG injection, with the day of OPU designated as Day 0. The oocyte-corona-cumulus complexes (OCCCs) identified under a stereoscopic microscope were immediately transferred to G-MOPS Plus (Vitrolife, Sweden) or K-SIGB (Cook, Australia) medium, washed three times in G-IVF Plus (Vitrolife, Sweden) or K-SIFM (Cook, Australia), and then placed in G-IVF Plus or K-SIFM medium in an incubator at 37°C with 6% CO2 and 5% O2 until insemination. Conventional IVF or ICSI was selected based on semen quality before and after oocyte denudation.
In a standard IVF cycle, semen was optimized using density gradient centrifugation and direct swim-up techniques, carried out 39–40 h after hCG injection. The optimized semen was then added to 50 µL drops of G-IVF Plus or K-SIFM medium, with 10,000 sperm added per oocyte. After co-culturing with optimized sperm for 5 h, the OCCCs were denuded using a denudation pipette (150 µm). Following denudation, the oocytes were cultured in G-IVF Plus or K-SIFM medium until the second polar body extrusion was observed, at which point the zygotes were transferred to G-1 Plus (Vitrolife, Sweden) or K-SICM (Cook, Australia) medium.
In an ICSI cycle, matured oocytes were denuded prior to insemination. The injected oocytes were placed in a cleavage culture medium, and fertilization was assessed 16–18 h after insemination. Normal fertilized oocytes were cultured in a cleavage medium until Day 3. On Day 3, embryos were evaluated based on morphology and were either cryopreserved, transferred, discarded, or extendedly cultured in G2 Plus (Vitrolife, Sweden) or K-SIBM (Cook, Australia) medium at 37°C with 6% CO2 and 5% O2 until Day 5/6.
Cleavage embryos and blastocysts were evaluated according to the Peter scoring system (Davis and Brinsden, 1999) and the Gardner scoring criteria (Gardner et al., 2000). Embryos fertilized in vitro were handled differently based on their morphology observed on Day 3 (Shen et al., 2024). Retained embryos were graded and prioritized for transfer, contributing to laboratory quality control. All patients received the same luteal support from the day of oocyte retrieval to 65 days post-embryo transfer.
2.3 Outcome measures
In this study, embryos scoring I or II according to the Peter scoring system were considered top-quality embryos, and blastocysts with a Gardner score ≥ 3BB were classified as high-quality blastocysts. Key performance indicators (KPIs) related to fertilization included the normal fertilization rate for IVF and ICSI. These rates were calculated by dividing the number of oocytes with 2PN (two pronuclei) and 2 PB (two polar bodies) by the number of COCs (cumulus-oocyte complexes) inseminated for IVF or MII (metaphase II) oocytes injected for ICSI, respectively.
Embryo quality indicators included the embryo development rate (top Day 3), good embryo development rate (top Day 3), GBLR (top Day 5/total), and total GBLR (top Day 5/total). The top Day 3 good embryo rate was calculated by dividing the number of top-quality embryos on Day 3 by the number of 2PN zygotes. The GBLR was determined by dividing the number of blastocysts by the number of embryos cultured to the blastocyst stage. The high-quality blastocyst rate was calculated by dividing the number of high-quality blastocysts by the number of embryos cultured in the blastocyst stage.
The primary clinical outcome measure was the implantation rate, which was assessed for both cleavage-stage embryos and blastocysts. The implantation rate was calculated as the number of gestational sacs detected via transvaginal ultrasound divided by the number of embryos transferred.
2.4 Statistical analysis
The COS groups mentioned above were compared in terms of female age, male age, maternal BMI, number of oocytes retrieved, duration of infertility, basal hormone levels, and the KPIs primarily discussed in this study. Continuous variables were expressed as mean ± SD and compared using either one-way ANOVA or the Kruskal-Wallis non-parametric test, depending on the data distribution. Comparisons of KPIs between the four COS groups and among age subgroups were performed using the chi-square test. Differences were considered statistically significant at p < 0.05 and highly significant at p < 0.01. Data were assessed after splitting cycles into four COS groups.
To evaluate the impact of the COS protocol on KPIs, stratified analyses were performed by sub-analyzing KPIs across three age bands. Multivariable regression analysis (MLR) was conducted to assess the effect of COS protocols and cycle characteristics on the KPIs. Covariates included female age, number of recovered oocytes, endometrial thickness, female BMI, infertility duration, and COS protocol (which included four categories). All data were obtained from the electronic medical record system of our reproductive center. Statistical analyses were performed using IBM SPSS Statistics 25. The results of MLR were represented in a forest plot (Figure 6) using the R package “ggforestplot”. Statistical graphs were drawn by GraphPad Prism 8.
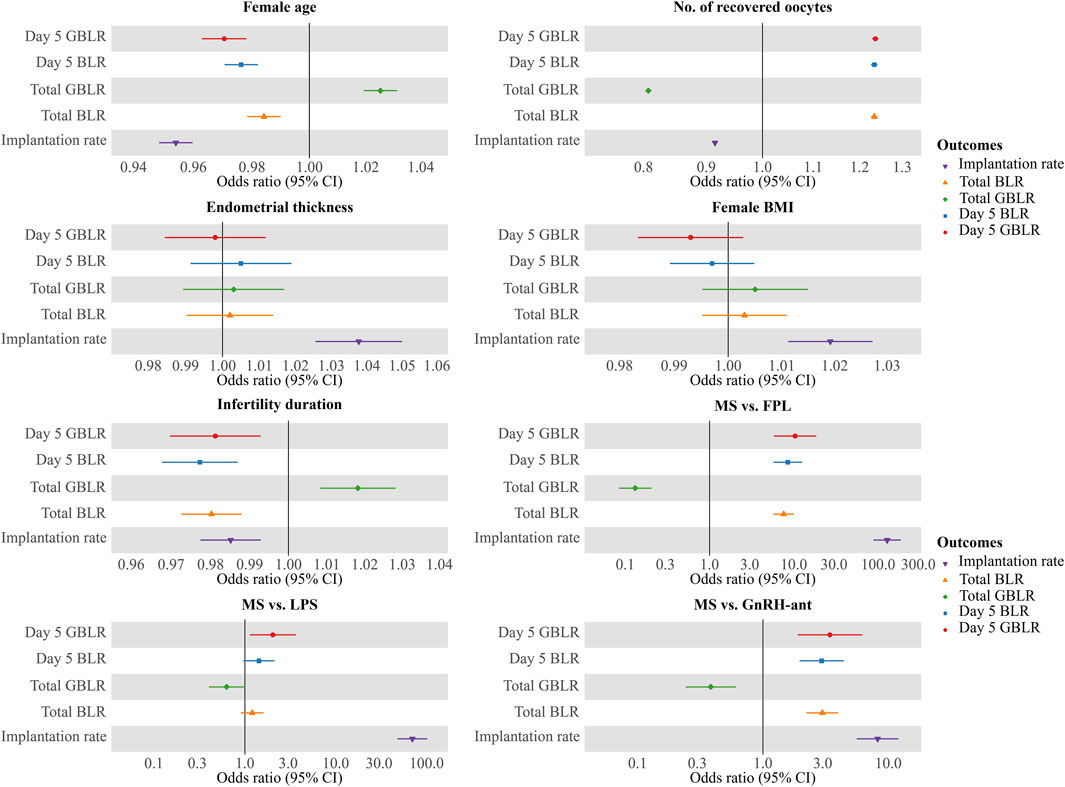
Figure 6. Multivariate logistic regression analysis of factors potentially impacting KPIs. Notes: Results of multiple logistic regressions of KPIs against female age, number of recovered oocytes, duration of infertility, endometrial thickness, and COS protocols (MS vs FPL, MS vs LPS, and MS vs GnRH-ant). KPIs here include Day 5 BLR, Day 5 GBLR, total BLR, total GBLR, and implantation rate. FPL, follicular phase long-acting GnRH-a protocol; LPS, luteal phase short-acting GnRH-a protocol; GnRH-ant, GnRH-ant protocol; MS, micro-stimulation protocol; BLR, blastocyte development rate; GBLR, good blastocyte development rate; 95% CI, 95% confidence intervals.
3 Results
3.1 Patient characteristics
This study included 51,728 complete IVF/ICSI cycles performed at our center to comprehensively explore the effects of treatment protocols on embryo laboratory KPIs. The baseline characteristics of the four study groups are summarized in Table 1. Female age, the number of recovered oocytes, and male age were similar in the FPL and LPS GnRH-a groups, as well as in the GnRH-ant protocol and micro-stimulation groups, indicating no significant differences within these paired groups. However, there were significant differences between the four groups overall.
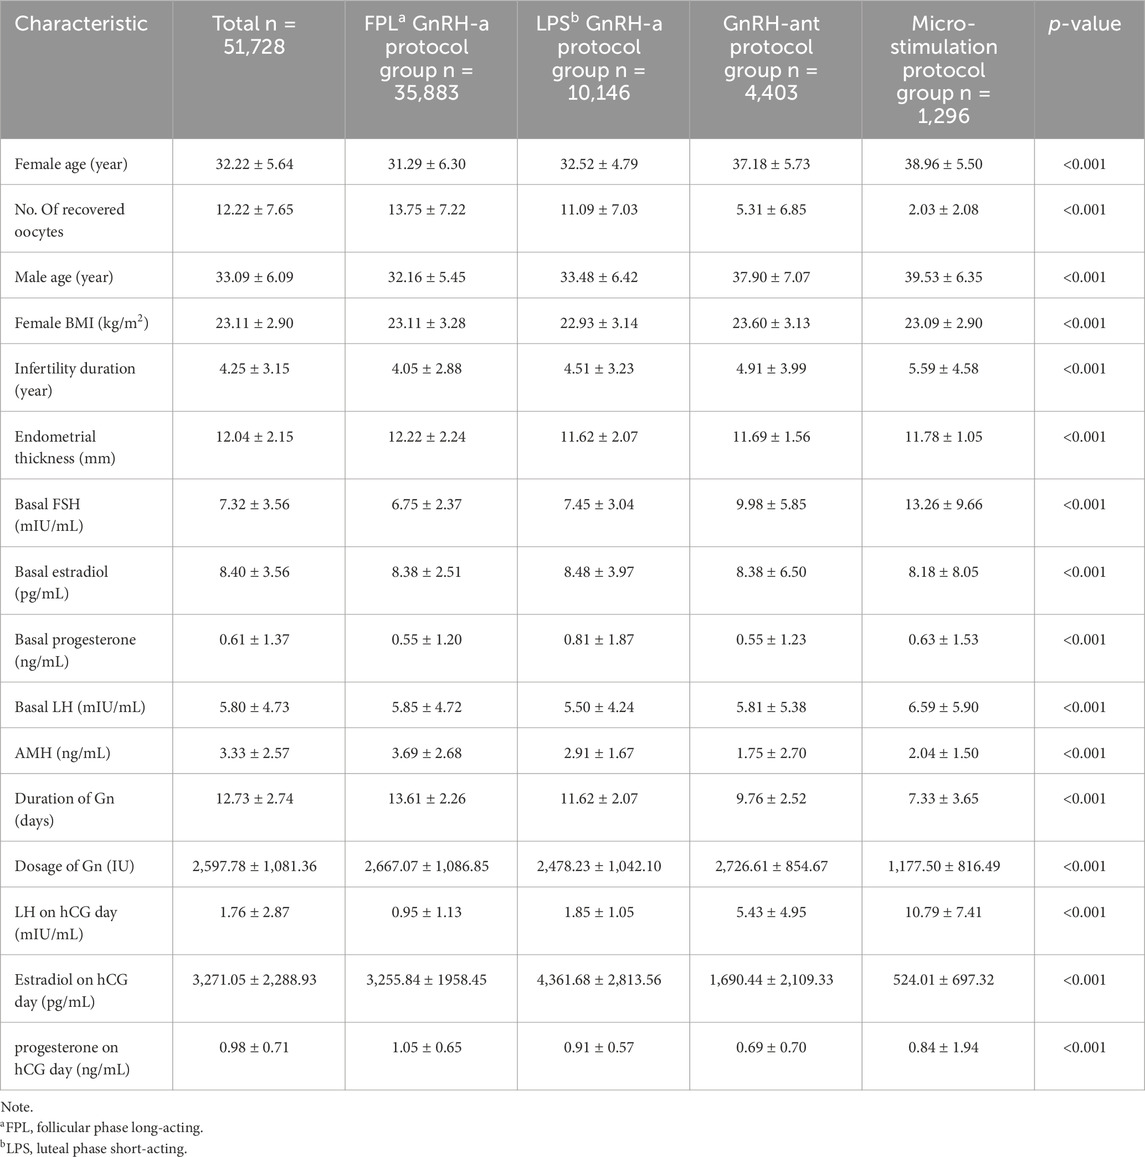
Table 1. Cycle characteristics of study groups.
The basal FSH level was significantly higher in the micro-stimulation group (13.2 ± 9.66 mIU/mL) compared to the other groups (p < 0.001). Other baseline characteristics, including duration of infertility, endometrial thickness, basal estradiol, basal progesterone, basal LH, and serum AMH levels, were similar across groups, although statistically significant differences were observed.
LH levels on the hCG day were significantly lower in the FPL and LPS GnRH-a groups (0.95 ± 1.13 mIU/mL and 1.85 ± 1.05 mIU/mL, respectively) compared to the other two groups (5.43 ± 4.95 mIU/mL and 10.79 ± 7.41 mIU/mL, respectively). Conversely, estradiol levels on the hCG day were higher in the FPL and LPS GnRH-a groups (3,255.84 ± 1958.45 pg/mL and 4,361.68 ± 2,813.56 pg/mL, respectively), followed by the GnRH-ant protocol group (1,690.44 ± 2,109.33 pg/mL) and the micro-stimulation protocol group (524.01 ± 697.32 pg/mL).
The duration of Gn administration, Gn dosage, and progesterone levels on the hCG day differed significantly across the four groups (p < 0.001 for all comparisons).
3.2 Outcomes of KPIs
Table 2 Outcomes of KPIs differed significantly between the COS protocol groups (Table 2). A complete account of these results is provided below.

Table 2. ART Comparison of KPIs between the four study groups.
3.2.1 Fertilization KPIs
Fertilization rates for routine in vitro fertilization (IVF) and intracytoplasmic sperm injection (ICSI) were evaluated across the four study groups. The ICSI fertilization rate in the FPL GnRH-a group (74.1%) was significantly higher than in the other three groups (p < 0.001). However, ICSI fertilization rates were comparable between the other three groups.
In contrast, IVF fertilization rates did not show significant differences among the FPL GnRH-a group, LPS GnRH-a group, and GnRH-ant protocol group (79.5%, 79.9%, and 79.2%, respectively). The micro-stimulation protocol group had a significantly lower IVF fertilization rate (74.2%, p < 0.001).
3.2.2 Cleavage and blastocyst KPIs
Good embryo development rates on Day 3 were comparable in the FPL GnRH-a group (66.9%) and LPS GnRH-a group (66.8%), with statistically significant differences observed when compared to the GnRH-ant protocol group (64.3%) and micro-stimulation protocol group (60.3%) (p < 0.001).
Total GBLR differed significantly across all four study groups (56.2%, 54.1%, 49.7%, and 29.5%, p < 0.001), with the most notable decrease in the micro-stimulation protocol group. Similarly, the total GBLR showed statistically significant differences between the arbitrary pairs of groups (26.8%, 30.4%, 21.1%, and 13.1%, p < 0.001).
Regarding Day 5 BLR and GBLR, no significant differences were observed between the FPL GnRH-a group and the LPS GnRH-a group. However, significant differences were found between the GnRH-ant protocol group and the micro-stimulation protocol group. Specifically, statistical differences were evident between the arbitrary pairs of groups studied, except for the FPL and LPS GnRH-a groups.
3.2.3 Implantation KPIs
Implantation rates were also evaluated for cleavage-stage and blastocyst-stage embryos across the four COS groups. The overall implantation rate was highest in the FPL GnRH-a group (46.6%) and lowest in the micro-stimulation protocol group (13.1%). The rates in the other two groups were 30.7% and 24.2%, respectively. Significant differences were observed between arbitrary two of our study groups (p < 0.001). Cleavage-stage implantation rates followed similar trends (Table 2).
Interestingly, while implantation rates for the blastocyst stage remained highest in the FPL GnRH-a long protocol group (65.5%), the rates were comparable between the LPS GnRH-a and GnRH-ant protocol groups (43.6% and 43.1%, respectively). In the micro-stimulation protocol group, only two patients aged 33 opted for blastocyst-stage embryo transfers, both of whom failed to conceive, resulting in a zero-implantation rate.
3.3 KPIs and female age
The results from the preliminary analysis of KPIs in relation to female age are presented in Figure 3. Although the patterns of decline varied slightly across the KPIs, all six KPIs showed a decline with advancing age. Overall, Day 3 good embryo development rates decreased steadily, with instability observed after age 38. Implantation rates and KPIs related to embryo and blastocyst development also declined with increasing age, with a pronounced drop observed at age 38. In contrast to cleavage-stage implantation rates, blastocyst-stage implantation rates remained more stable, with relatively high implantation rates maintained even beyond age 38.
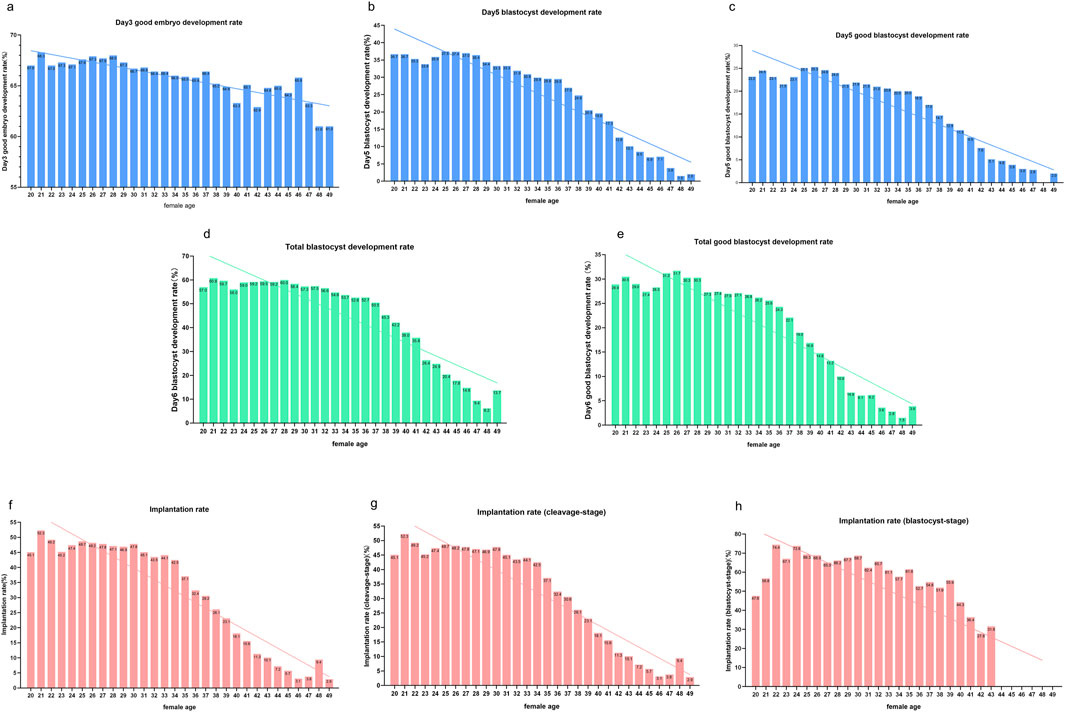
Figure 3. KPIs in cycles of different female ages. Notes: Profile of KPIs’ changes across four COS protocols in women aged from 20 to 49 years. KPIs here include (a) Day 3 good embryo development rate, (b) Day 5 blastocyte development rate (BLR), (c) Day 5 good blastocyte development rate (GBLR), (d) total BLR, (e) total GBLR, (f) implantation rate, (g) implantation rate (cleavage-stage), and (h) implantation rate (blastocyst-stage).
3.4 KPIs and COS protocol
Figure 4 illustrates the intercorrelations among the three treatment protocols across different age groups. Since the study included a reduced number of cases using the micro-stimulation protocol at several age points, the changes in indicators by age are not provided. Day 3 good embryo development rates remain similar in FPL GnRH-a group, LPS GnRH-a group and GnRH-ant group across most age points. And the Day 5 BLR/GBLR and total BLR/GBLR were higher in the LPS GnRH-a group than in the FPL GnRH-a group for patients under 36 years old. Interestingly, the opposite trend was observed in cycles of patients older than 36 years, where these KPIs related to the blastocyst development were higher in the FPL GnRH-a group compared to the LPS GnRH-a group. Implantation rates for cycles in the FPL GnRH-a group were the highest across all age groups, with the most pronounced difference observed in women under 35 years old.
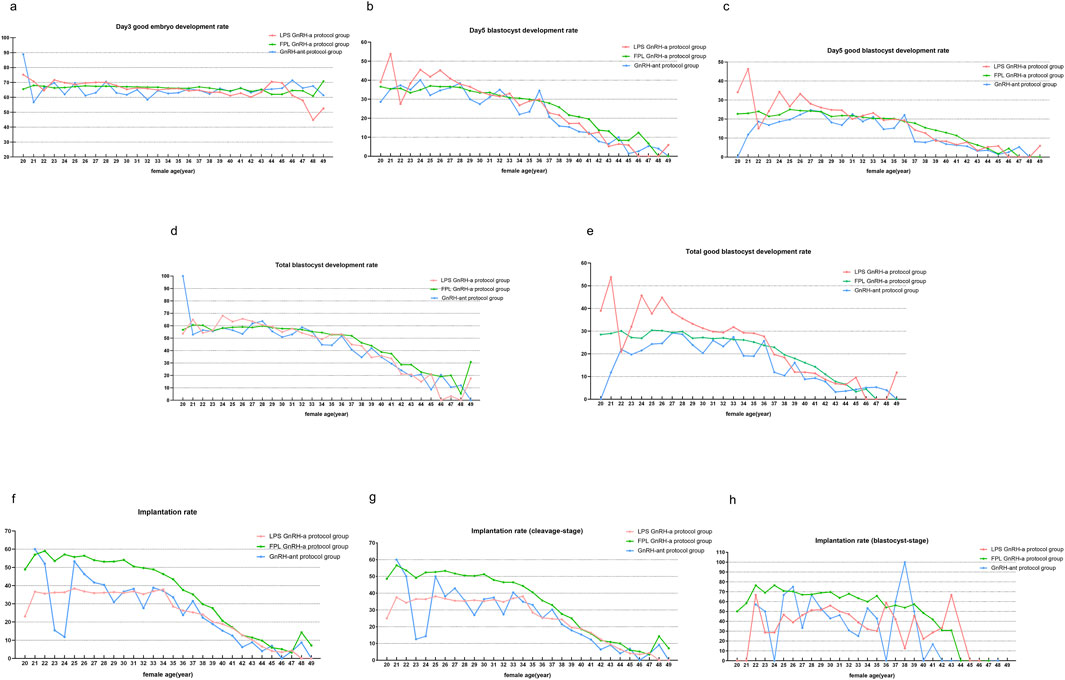
Figure 4. KPIs compared under different COS protocols. Notes: Comparisons of KPIs across three COS protocols in women aged from 20 to 49 years. KPIs here include (a) Day 3 good embryo development rate, (b) Day 5 blastocyte development rate (BLR), (c) Day 5 good blastocyte development rate (GBLR), (d) total BLR, (e) total GBLR, (f) implantation rate, (g) implantation rate (cleavage-stage), and (h) implantation rate (blastocyst-stage). GnRH-a/ant, gonadotropin-releasing hormone agonist/antagonist; FPL, follicular phase long-acting; LPS, luteal phase short-acting.
3.5 KPIs sub-analyzed according to COS protocol and female age
Figure 5 presents three age bands: under 35 years, between 35 and 38 years, and over 38 years. We conducted a comparative analysis of the differences among the four COS groups within each of these three age categories. In the cycles for women aged <35 years, the highest rates for the four KPIs related to blastocyte development were observed in the LPS GnRH-a group, followed by the FPL GnRH-a group and the GnRH-ant protocol group. The micro-stimulation protocol group showed the lowest rates for all four KPIs.
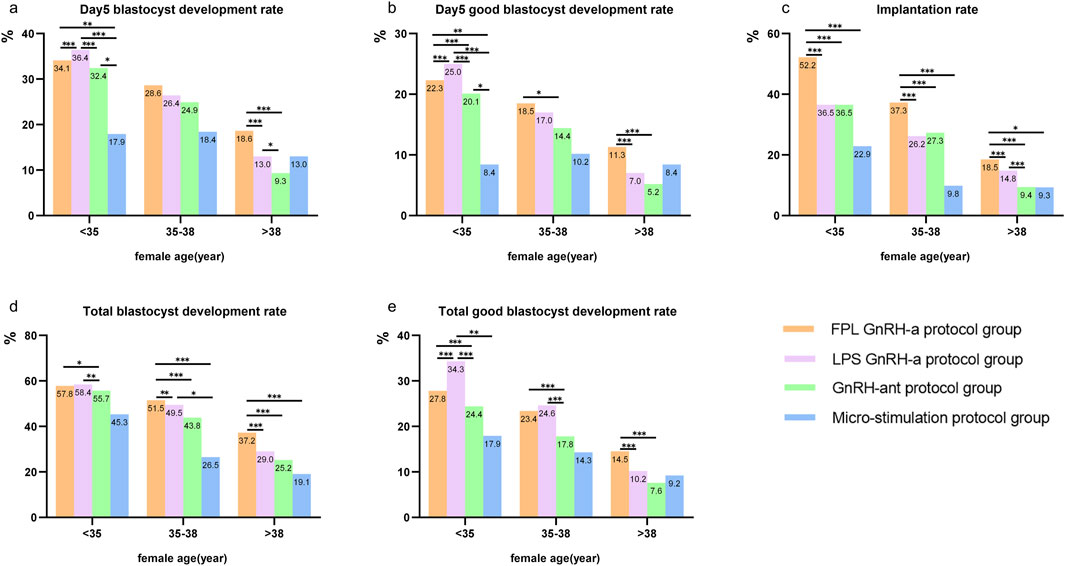
Figure 5. KPIs sub-analyzed according to COS protocol and female age. Notes: Comparisons of KPIs across four COS protocols in three age bands (<35 years, 35–38 years, and >38 years). KPIs here include (a) Day 5 blastocyte development rate, (b) Day 5 good blastocyte development rate, (c) implantation rate, (d) total blastocyte development rate, and (e) total good blastocyte development rate. GnRH-a/ant, gonadotropin-releasing hormone agonist/antagonist; FPL, follicular phase long-acting; LPS, luteal phase short-acting. *P < 0.05, **P < 0.01, ***P < 0.001.
For patients aged 35–38 and >38 years, the FPL GnRH-a group showed the highest Day 5 BLR/GBLR, total BLR/GBLR as well as implantation rates, followed by the LPS GnRH-a group. Interestingly, the implantation rate was consistently highest in the FPL GnRH-a group, regardless of age, with rates lower in the other two groups. Surprisingly, the Day 5 BLR/GBLR in the micro-stimulation protocol group was higher than that in the GnRH-ant protocol group.
3.6 Multivariate regression analysis
MLR analysis showed that implantation rate and KPIs related to blastocyte development, including Day 5 BLR/GBLR, total BLR/GBLR and implantation rate were all significantly associated with female age, number of recovered oocytes, duration of infertility, and COS protocol. The odds ratios (OR), 95% confidence intervals (CI), and p-values for these associations are presented in Table 3. The results were shown by a forest plot (Figure 6) via the R package “ggforestplot”.

Table 3. Multivariate logistic regression analysis of factors potentially impacting KPIs.
Although endometrial thickness (OR = 1.037; 95% CI: 1.026–1.049, p < 0.001) and female BMI (OR = 1.019; 95% CI: 1.012–1.027, p < 0.001) had a significant effect on the implantation rate, they did not significantly affect KPIs related to blastocyte development.
4 Discussion
Infertility is a global issue, affecting approximately 17.5% of adults at some point in their lives (Cox et al., 2022). About 40%–50% of infertile couples seek ART treatments to achieve pregnancy (Boivin et al., 2007). The ART process, which spans from gamete collection to embryo transfer, is complex and influenced by numerous factors. This complexity highlights the importance and challenges of evaluating the quality and efficiency of embryology laboratories. KPIs are essential for implementing new technologies and procedures within the embryology laboratory and for monitoring the efficacy of the quality management system. Structural KPIs primarily assess the foundational elements of the embryology laboratory, including laboratory design, equipment, and staff allocation; process KPIs monitor and control operational procedures, while outcome KPIs evaluate the effectiveness of the IVF laboratory (Fabozzi et al., 2020). Previous studies have established reliable KPIs and explored novel, meaningful KPIs (Hughes and Association of Clinical Embryologists, 2012; Embryology and Medicine, 2017; Vaiarelli et al., 2023; Hammond and Morbeck, 2019; Chamayou et al., 2021). Adjusting KPIs based on age may better monitor embryology laboratory performance (Zacà et al., 2022). In our practice, we observed that the COS protocol influences KPIs; however, there is a lack of research in this area.
The most significant finding in this study was that KPIs differed significantly across the four COS protocol groups, suggesting the potential for adjusting the reference values of these KPIs according to treatment strategies. Notably, the blastocyst development rates and implantation rates in the FPL GnRH-a and the LPS GnRH-a groups were significantly higher than those in the other two groups. This conclusion holds true across nearly all age points and all three age bands (Figures 4, 5). Another key finding is that the BLR and GBLR in the FPL GnRH-a group were higher than those in the LPS GnRH-a group for females under 35 years old; however, the implantation rate in the FPL GnRH-a group was lower than that of the LPS GnRH-a group, regardless of female age.
The BLR/GBLR and implantation rates in the FPL GnRH-a group and LPS GnRH-a group were both higher than those in the other two groups, likely benefiting from the use of GnRH-a. GnRH-a, an analog of hypothalamic Gn-releasing hormone, induces pituitary desensitization and stimulates the development of multiple follicles by promoting synchronized follicular growth. It has been used in IVF procedures for over 40 years (Porter et al., 1984). Both long-acting and short-acting GnRH-a can effectively reduce LH levels on the day of hCG administration, preventing premature luteinization and improving the follicular microenvironment to support follicular development (Siristatidis et al., 2025). GnRH-a not only reduces the fluctuations of endogenous LH and FSH by inhibiting the function of the hypothalamic-pituitary axis, but also produces a flare-up effect, thereby promoting the synchronous development of follicles and improving the implantation rates and pregnancy rates (Wang et al., 2023; Luo et al., 2020). Overall, there is limited articles comparing GnRH-a regimens with micro-stimulation protocols. Youssef (Youssef et al., 2017) et al. found that a mild ovarian stimulation strategy for women with poor ovarian reserve undergoing IVF results in ongoing pregnancy rates comparable to those achieved with conventional ovarian stimulation strategies. However, several studies align with our findings, demonstrating that GnRH-a protocols yield higher implantation rates and blastocyst development rates compared to other protocols (Lv et al., 2022; Huang et al., 2018).
In the two groups that did not use GnRH-a, our study revealed significantly higher BLR/GBLR and implantation rates in the GnRH-ant protocol group compared to the micro-stimulation group for individuals under 35 years of age. GnRH-antagonists inhibit the early onset of the LH peak during the middle and late stages of follicular growth, which prevents the suppression of endogenous LH and FSH during the early follicular phase, thereby promoting follicular development during the initial recruitment phase and preserving pituitary responsiveness (Zhang et al., 2021). However, micro-stimulation protocols involve shorter stimulation cycles and necessitate lower doses of gonadotropins. Although no statistically significant difference was observed in subgroups over the age of 35, a consistent trend was noted. This observation warrants further investigation in future studies.
In addition, we observed that the Day 5 BLR/GBLR and total BLR/GBLR in the LPS group prior to the age of 35 were both higher than those in the FPL group (Figures 4, 5). However, there is little literature directly addressing this concern. We hypothesize that this may be related to the lower LH levels on the day of hCG administration in the LPS GnRH-a group. Interestingly, regarding the blastocyst development rates, we observed almost the opposite conclusion in cycles after the age of 35, which currently lacks strong supporting evidence and awaits further exploration in other studies. LH, a crucial hormone secreted by the anterior pituitary, stimulates oocyte maturation and plays a key role in ovulation and corpus luteum maintenance (Ezcurra and Humaidan, 2014; Orisaka et al., 2013). LH and FSH work synergistically to support normal follicular development (Orvieto et al., 2021), with low LH levels negatively affecting oocyte retrieval and fertilization rates (Dragotto et al., 2024; Makolle et al., 2021).
Unexpectedly, a previous review found no significant difference between depot and daily GnRH-a use for pituitary down-regulation in IVF cycles with the long protocol (Albuquerque et al., 2013), suggesting that variations in blastocyst formation rates may not be directly related to LH levels. However, more research supports our ideas. Numerous studies have shown that timely administration of LH can enhance pregnancy outcomes (Alviggi et al., 2018; Benmachiche et al., 2019; De Placido et al., 2005; Bosch et al., 2011). The half-life of short-acting GnRH-a is shorter than that of long-acting GnRH-a, resulting in more rapid recovery of pituitary desensitization and higher LH levels, within the LH window (Balasch et al., 2001). Excessive suppression of the pituitary can lower LH levels, interfering with paracrine signaling between granulosa and theca cells, which affects estrogen and androgen synthesis, preventing complete oocyte maturation (Verpoest et al., 2000).
Our study provides evidence supporting that the implantation rate was significantly higher in the GnRH-a treatment groups compared to the other two protocols. Besides, we observed that between the two groups using GnRH-a, the FPL GnRH-a group had a higher implantation rate. GnRH-a treatment can improve oocyte quality, regulate cytokine secretion, and enhance endometrial receptivity and the pelvic microenvironment (Cao et al., 2020; Kolanska et al., 2017; Xu et al., 2020), facilitating embryo implantation. Previous studies have suggested that GnRH-a may decrease estrogen production and enhance endometrial repair capacity by upregulating Tff1 and Sprr2a1 (Guo et al., 2017). A possible explanation for the higher implantation rate in the FPL GnRH-a group may be the decreased resistance in sub-endometrial blood flow, along with the resulting increase in endometrial thickness. Consistently, previous studies have shown that GnRH-a prolonged protocol is superior to short GnRH-a long protocol in terms of clinical pregnancy rates and implantation rates, particularly in patients with thinner endometria (Song et al., 2020). Xu (Xu et al., 2020) et al. suggested that depot GnRH-a may protect the expression of HOXA10, MEIS1, and LIF, positively impacting endometrial receptivity and leading to higher live birth rates.
Based on the findings of this study, we conclude that the LPS GnRH-a long protocol results in the highest total GBLR, while the FPL GnRH-a long protocol provides the highest implantation rates. COS protocols can be tailored according to the patient’s needs. For patients who do not require fresh embryo transfer, such as those needing PGD/PGS or embryo freezing, the LPS GnRH-a long protocol may be used to increase blastocyst yield. For patients requiring fresh embryo transfer, the FPL GnRH-a long protocol should be used to improve implantation rates. For patients over 40 years old, the results of the four COS protocols are similar, and the GnRH-ant or micro-stimulation protocols, which are more cost-effective and shorter in duration, can be considered.
Additionally, our results support the role of female age in embryo and blastocyst quality and implantation rates. Extensive research has shown that advancing maternal age adversely affects embryo development and transfer outcomes. Studies indicate that older maternal age is associated with an increased incidence of aneuploidy in oocytes and embryos, increased mitochondrial DNA damage (Coughlan et al., 2014), and higher rates of embryo-endometrial asynchrony (Shapiro et al., 2016), all of which contribute to reduced implantation rates.
Utilizing KPIs for embryo laboratory quality control is crucial for total quality management (De los Santos et al., 2016), and previous guidelines and consensus have provided robust KPIs with agreed competency levels and benchmark values (Hughes and Association of Clinical Embryologists, 2012; Embryology and Medicine, 2017; Vaiarelli et al., 2023). KPIs play a vital role in introducing laboratory technologies or operational processes, establishing minimum performance standards, monitoring the effectiveness of the quality management system, and assessing quality improvements. The efficacy of KPIs depends on the accurate and comprehensive collection of data, and their reasonable utilization is essential to enhance safety, efficacy, and efficiency (Malhotra et al., 2013). The blastocyst/good embryo development rates and implantation rate studied here are common and effective KPIs used in embryo laboratories. Given the observed differences in these KPIs across the four COS protocols, we believe it is necessary to adjust the reference values for these KPIs according to treatment protocols. Although we observed that KPIs varied among COS groups, contributing to a more rational evaluation of embryo laboratory efficacy, we do not assert that these protocols are inherently superior or inferior. The choice of treatment regimen should be informed by a variety of factors. We recommend considering total BLR, total GBLR, and implantation rate as potential KPIs to evaluate the laboratory efficacy of different COS protocols. However, the incorporation of age into the assessment and the determination of appropriate reference values warrant further investigation.
This study’s major limitation is its retrospective nature, which introduces potential biases and does not eliminate individual differences. Additionally, there was considerable variation in sample sizes among the four COS groups. As this is a single-center study, future multicenter studies with larger sample sizes are needed to validate our findings. While our study demonstrated differences in KPIs across treatment groups, it does not provide explicit reference values for each COS protocol. However, this approach contributes to refining our understanding of how KPIs can be adjusted to improve the quality control of embryology laboratories. This may provide a theoretical basis for personalized COS protocols for patients, and offer novel suggestions for forecasting ART laboratory outcomes.
5 Conclusion
In summary, COS protocols significantly influence KPIs, indicating that adjusting the reference values of these indicators according to the treatment protocols may help optimize the quality control of ART laboratories. Our study also supports the effectiveness of the KPIs recommended in previous consensus guidelines. COS protocols can be tailored based on the patient’s individual needs. Further well-designed, multicenter studies are necessary to validate these results and establish explicit reference values for each COS protocol.
Data availability statement
The original contributions presented in the study are included in the article/supplementary material, further inquiries can be directed to the corresponding author.
Ethics statement
The studies involving humans were approved by Institutional Review Board (IRB) of First Affiliated Hospital of Zhengzhou University. The studies were conducted in accordance with the local legislation and institutional requirements. The ethics committee/institutional review board waived the requirement of written informed consent for participation from the participants or the participants’ legal guardians/next of kin because According to article 39 of the Approaches to Ethical Review of Biomedical Research Involving Human Beings (China), this retrospective study qualifies for exemption from signing an informed consent form for reasons below: 1. Research risk is not greater than minimal risk; 2. Exemption from informed consent does not adversely affect the rights or welfare of subjects. A signed Application for Waiver of Informed Consent has been reviewed.
Author contributions
WC: Conceptualization, Methodology, Formal Analysis, Visualization, Software, Writing – original draft, Writing – review and editing. SC: Conceptualization, Methodology, Formal Analysis, Software, Writing – original draft, Writing – review and editing. YL: Data curation, Resources, Writing – review and editing. ZW: Data curation, Investigation, Writing – review and editing. FZ: Data curation, Resources, Writing – review and editing. XH: Data curation, Visualization, Writing – review and editing. GY: Investigation, Supervision, Writing – review and editing. WS: Investigation, Supervision, Writing – review and editing. HJ: Conceptualization, Methodology, Investigation, Project administration, Supervision, Writing – review and editing.
Funding
The author(s) declare that no financial support was received for the research and/or publication of this article.
Acknowledgments
We are thankful to all the participants of the study.
Conflict of interest
The authors declare that the research was conducted in the absence of any commercial or financial relationships that could be construed as a potential conflict of interest.
Generative AI statement
The author(s) declare that no Generative AI was used in the creation of this manuscript.
Publisher’s note
All claims expressed in this article are solely those of the authors and do not necessarily represent those of their affiliated organizations, or those of the publisher, the editors and the reviewers. Any product that may be evaluated in this article, or claim that may be made by its manufacturer, is not guaranteed or endorsed by the publisher.
Abbreviations
BLR, blastocyst development rate; D5BUR, Day 5 Usable Blastocyst Rate; FPL, follicular phase long-acting; GBLR, good blastocyst development rate; LPS, luteal phase short-acting.
References
Albuquerque L. E. T., Tso L. O., Saconato H., Albuquerque M. C. R. M., Macedo C. R. (2013). Depot versus daily administration of gonadotrophin-releasing hormone agonist protocols for pituitary down regulation in assisted reproduction cycles. Cochrane Database Syst. Rev. 2013, CD002808. doi:10.1002/14651858.CD002808.pub3
Alviggi C., Conforti A., Esteves S. C., Andersen C. Y., Bosch E., Bühler K., et al. (2018). Recombinant luteinizing hormone supplementation in assisted reproductive technology: a systematic review. Fertil. Steril. 109, 644–664. doi:10.1016/j.fertnstert.2018.01.003
Balasch J., Creus M., Fábregues F., Civico S., Carmona F., Puerto B., et al. (2001). The effect of exogenous luteinizing hormone (LH) on oocyte viability: evidence from a comparative study using recombinant human follicle-stimulating hormone (FSH) alone or in combination with recombinant LH for ovarian stimulation in pituitary-suppressed women undergoing assisted reproduction. J. Assisted Reproduction Genet. 18, 250–256. doi:10.1023/a:1016662100572
Benmachiche A., Benbouhedja S., Zoghmar A., Humaidan P. (2019). Low LH level on the day of GnRH agonist trigger is associated with reduced ongoing pregnancy and live birth rates and increased early miscarriage rates following IVF/ICSI treatment and fresh embryo transfer. Front. Endocrinol. 10, 639. doi:10.3389/fendo.2019.00639
Boivin J., Bunting L., Collins J. A., Nygren K. G. (2007). International estimates of infertility prevalence and treatment-seeking: potential need and demand for infertility medical care. Hum. Reprod. Oxf. Engl. 22, 1506–1512. doi:10.1093/humrep/dem046
Bosch E., Labarta E., Crespo J., Simón C., Remohí J., Pellicer A. (2011). Impact of luteinizing hormone administration on gonadotropin-releasing hormone antagonist cycles: an age-adjusted analysis. Fertil. Steril. 95, 1031–1036. doi:10.1016/j.fertnstert.2010.10.021
Cao X., Chang H.-Y., Xu J.-Y., Zheng Y., Xiang Y.-G., Xiao B., et al. (2020). The effectiveness of different down-regulating protocols on in vitro fertilization-embryo transfer in endometriosis: a meta-analysis. Reproductive Biol. Endocrinol. RB&E 18, 16. doi:10.1186/s12958-020-00571-6
Chamayou S., Ragolia C., Alecci C., Storaci G., Romano S., Sapienza R., et al. (2021). More blastocysts are produced from fewer oocytes in ICSI compared to IVF - results from a sibling oocytes study and definition of a new key performance indicator. Reproductive Biol. Endocrinol. RB&E 19, 116. doi:10.1186/s12958-021-00804-2
Coughlan C., Ledger W., Wang Q., Liu F., Demirol A., Gurgan T., et al. (2014). Recurrent implantation failure: definition and management. Reprod. Biomed. Online 28, 14–38. doi:10.1016/j.rbmo.2013.08.011
Cox C. M., Thoma M. E., Tchangalova N., Mburu G., Bornstein M. J., Johnson C. L., et al. (2022). Infertility prevalence and the methods of estimation from 1990 to 2021: a systematic review and meta-analysis. Hum. Reprod. Open 2022, hoac051. doi:10.1093/hropen/hoac051
Davis O. K., Brinsden P. R. (1999). A textbook of in vitro fertilization and assisted reproduction. New York: The Parthenon Publishing Group. p. 1–564.
De los Santos M. J., Apter S., Coticchio G., Debrock S., Lundin K., Plancha C. E., et al. (2016). Revised guidelines for good practice in IVF laboratories (2015). Hum. Reprod. Oxf. Engl. 31, 685–686. doi:10.1093/humrep/dew016
De Placido G., Alviggi C., Perino A., Strina I., Lisi F., Fasolino A., et al. (2005). Recombinant human LH supplementation versus recombinant human FSH (rFSH) step-up protocol during controlled ovarian stimulation in normogonadotrophic women with initial inadequate ovarian response to rFSH. A multicentre, prospective, randomized controlled trial. Hum. Reprod. Oxf. Engl. 20, 390–396. doi:10.1093/humrep/deh625
Dragotto J., Buzzaccarini G., Etrusco A., Laganà A. S., Venezia R., Terzic S., et al. (2024). Effects of low luteinizing hormone serum levels on oocyte retrieval, fertilization rate, and embryo quality during controlled ovarian stimulation: results from a prospective cohort analysis. Gynecol. Obstetric Investigation 89, 50–58. doi:10.1159/000534860
ESHRE Special Interest Group of Embryology and Alpha Scientists in Reproductive Medicine (2017). The Vienna consensus: report of an expert meeting on the development of ART laboratory performance indicators. Reprod Biomed Online 35, 494–510. doi:10.1016/j.rbmo.2017.06.015
Ezcurra D., Humaidan P. (2014). A review of luteinising hormone and human chorionic gonadotropin when used in assisted reproductive technology. Reproductive Biol. Endocrinol. 12, 95. doi:10.1186/1477-7827-12-95
Fabozzi G., Cimadomo D., Maggiulli R., Vaiarelli A., Ubaldi F. M., Rienzi L. (2020). Which key performance indicators are most effective in evaluating and managing an in vitro fertilization laboratory? Fertil. Steril. 114, 9–15. doi:10.1016/j.fertnstert.2020.04.054
Gardner D. K., Lane M., Stevens J., Schlenker T., Schoolcraft W. B. (2000). Blastocyst score affects implantation and pregnancy outcome: towards a single blastocyst transfer. Fertil. Steril. 73, 1155–1158. doi:10.1016/s0015-0282(00)00518-5
Guo S., Lu X., Gu R., Zhang D., Sun Y., Feng Y. (2017). Transcriptome analysis of endometrial tissues following GnRH agonist treatment in a mouse adenomyosis model. Drug Des. Dev. Ther. 11, 695–704. doi:10.2147/dddt.s127889
Hammond E. R., Morbeck D. E. (2019). Tracking quality: can embryology key performance indicators be used to identify clinically relevant shifts in pregnancy rate? Hum. Reprod. Oxf. Engl. 34, 37–43. doi:10.1093/humrep/dey349
Huang M. C., Tzeng S. L., Lee C. I., Chen H. H., Huang C. C., Lee T. H., et al. (2018). GnRH agonist long protocol versus GnRH antagonist protocol for various aged patients with diminished ovarian reserve: a retrospective study. PLoS One 13, e0207081. doi:10.1371/journal.pone.0207081
Hughes C.Association of Clinical Embryologists (2012). Association of clinical embryologists - guidelines on good practice in clinical embryology laboratories 2012. Hum. Fertil. 15, 174–189. doi:10.3109/14647273.2012.747891
Kolanska K., Cohen J., Bendifallah S., Selleret L., Antoine J.-M., Chabbert-Buffet N., et al. (2017). Pregnancy outcomes after controlled ovarian hyperstimulation in women with endometriosis-associated infertility: GnRH-agonist versus GnRH-antagonist. J. Gynecol. Obstetrics Hum. Reproduction 46, 681–686. doi:10.1016/j.jogoh.2017.09.007
Luo Y., Sun L., Dong M., Zhang X., Huang L., Zhu X., et al. (2020). The best execution of the DuoStim strategy (double stimulation in the follicular and luteal phase of the same ovarian cycle) in patients who are poor ovarian responders. Reproductive Biol. Endocrinol. 18, 102. doi:10.1186/s12958-020-00655-3
Lv M., Yu J., Chen P., Xiao Q., Lou L., Luo Y., et al. (2022). Ovarian stimulation in IVF couples with severe male factor infertility: GnRH antagonist versus long GnRH agonist. Front. Endocrinol. (Lausanne) 13, 1037220. doi:10.3389/fendo.2022.1037220
Makolle S., Catteau-Jonard S., Robin G., Dewailly D. (2021). Revisiting the serum level of anti-Müllerian hormone in patients with functional hypothalamic anovulation. Hum. Reprod. (Oxford, England) 36, 1043–1051. doi:10.1093/humrep/deab024
Malhotra N., Shah D., Pai R., Pai H. D., Bankar M. (2013). Assisted reproductive technology in India: a 3 year retrospective data analysis. J. Hum. Reproductive Sci. 6, 235–240. doi:10.4103/0974-1208.126286
Mayer J. F., Jones E. L., Dowling-Lacey D., Nehchiri F., Muasher S. J., Gibbons W. E., et al. (2003). Total quality improvement in the IVF laboratory: choosing indicators of quality. Reprod. Biomed. Online 7, 695–699. doi:10.1016/s1472-6483(10)62093-7
Orisaka M., Hattori K., Fukuda S., Mizutani T., Miyamoto K., Sato T., et al. (2013). Dysregulation of ovarian follicular development in female rat: LH decreases FSH sensitivity during preantral-early antral transition. Endocrinology 154, 2870–2880. doi:10.1210/en.2012-2173
Orvieto R., Venetis C. A., Fatemi H. M., D'Hooghe T., Fischer R., Koloda Y., et al. (2021). Optimising follicular development, pituitary suppression, triggering and luteal phase support during assisted reproductive technology: a delphi consensus. Front. Endocrinol. 12, 675670. doi:10.3389/fendo.2021.675670
Porter R. N., Smith W., Craft I. L., Abdulwahid N. A., Jacobs H. S. (1984). Induction of ovulation for in-vitro fertilisation using buserelin and gonadotropins. Lancet 2, 1284–1285. doi:10.1016/s0140-6736(84)92840-x
Scaravelli G., Zacà C., Levi Setti P. E., Livi C., Ubaldi F. M., Villani M. T., et al. (2021). Fertilization rate as a novel indicator for cumulative live birth rate: a multicenter retrospective cohort study of 9,394 complete in vitro fertilization cycles. Fertil. Steril. 116, 766–773. doi:10.1016/j.fertnstert.2021.04.006
Shapiro B. S., Daneshmand S. T., Desai J., Garner F. C., Aguirre M., Hudson C. (2016). The risk of embryo-endometrium asynchrony increases with maternal age after ovarian stimulation and IVF. Reprod. Biomed. Online 33, 50–55. doi:10.1016/j.rbmo.2016.04.008
Shen X., Guo Y., Liu Y., Song W., Li G., Jin H. (2024). Effects of total gonadotropin dose on embryo quality and clinical outcomes with AMH stratification in IVF cycles: a retrospective analysis of 12,588 patients. Eur. J. Med. Res. 29, 167. doi:10.1186/s40001-024-01768-w
Siristatidis C. S., Yong L. N., Maheshwari A., Ray Chaudhuri Bhatta S. (2025). Gonadotropin-releasing hormone agonist protocols for pituitary suppression in assisted reproduction. Cochrane Database Syst. Rev. 1, Cd006919. doi:10.1002/14651858.CD006919.pub5
Song J., Duan C., Cai W., Wu W., Lv H., Xu J. (2020). Comparison of GnRH-a prolonged protocol and short GnRH-a long protocol in patients with thin endometrium for assisted reproduction: a retrospective cohort study. Drug Des. Devel Ther. 14, 3673–3682. doi:10.2147/DDDT.S270519
Vaiarelli A., Zacà C., Spadoni V., Cimadomo D., Conforti A., Alviggi C., et al. (2023). Clinical and laboratory key performance indicators in IVF: a consensus between the Italian society of fertility and sterility and reproductive medicine (SIFES-MR) and the Italian society of embryology, reproduction and research (SIERR). J. Assisted Reproduction Genet. 40, 1479–1494. doi:10.1007/s10815-023-02792-1
Verpoest W. M., Cahill D. J., Harlow C. R., Hull M. G. (2000). Relationship between midcycle luteinizing hormone surge quality and oocyte fertilization. Fertil. Steril. 73, 75–77. doi:10.1016/s0015-0282(99)00481-1
Wang Y., Pang C., Wu H., Wei C., Yu Y., Xin X., et al. (2023). The effect of large follicle puncture and aspiration on the outcomes of IVF-ET in patients with asynchronized follicles under the long GnRH-a protocol: a retrospective cohort study. BMC Pregnancy Childbirth 23, 64. doi:10.1186/s12884-023-05397-9
Xu B., Geerts D., Hu S., Yue J., Li Z., Zhu G., et al. (2020). The depot GnRH agonist protocol improves the live birth rate per fresh embryo transfer cycle, but not the cumulative live birth rate in normal responders: a randomized controlled trial and molecular mechanism study. Hum. Reprod. Oxf. Engl. 35, 1306–1318. doi:10.1093/humrep/deaa086
Youssef M. A., van Wely M., Al-Inany H., Madani T., Jahangiri N., Khodabakhshi S., et al. (2017). A mild ovarian stimulation strategy in women with poor ovarian reserve undergoing IVF: a multicenter randomized non-inferiority trial. Hum. Reprod. 32, 112–118. doi:10.1093/humrep/dew282
Zacà C., Coticchio G., Vigiliano V., Lagalla C., Nadalini M., Tarozzi N., et al. (2022). Fine-tuning IVF laboratory key performance indicators of the Vienna consensus according to female age. J. Assisted Reproduction Genet. 39, 945–952. doi:10.1007/s10815-022-02468-2
Keywords: embryo laboratory, quality control, key performance indicators (KPIs), controlled ovarian stimulation (COS) protocol, blastocyst development
Citation: Chen W, Cheng S, Liu Y, Wu Z, Zhang F, Huang X, Yao G, Song W and Jin H (2025) Adjusting key performance indicators in ART laboratories according to controlled ovarian stimulation protocol. Front. Physiol. 16:1632623. doi: 10.3389/fphys.2025.1632623
Received: 21 May 2025; Accepted: 29 July 2025;
Published: 12 August 2025.
Edited by:
Elisabeth Pinart, University of Girona, SpainCopyright © 2025 Chen, Cheng, Liu, Wu, Zhang, Huang, Yao, Song and Jin. This is an open-access article distributed under the terms of the Creative Commons Attribution License (CC BY). The use, distribution or reproduction in other forums is permitted, provided the original author(s) and the copyright owner(s) are credited and that the original publication in this journal is cited, in accordance with accepted academic practice. No use, distribution or reproduction is permitted which does not comply with these terms.
*Correspondence: Haixia Jin, amluaHhAenp1LmVkdS5jbg==
†These authors have contributed equally to this work and share first authorship