 Junsheng Cao
 Jinyang Lin2*
 Yulong Wang
- 1School of Physical Education, Shandong Normal University, Jinan, Shandong, China
- 2Department of Physical Education, Central South University, Changsha, Hunan, China
- 3Yulin Campus, Guangxi Medical University, Yulin, Guangxi, China
Background: Explosive power and skill performance are critical components of basketball success, particularly in female athletes whose neuromuscular and physiological responses may differ from males. While Short Sprint Interval Training (SSIT) is recognized for improving aerobic and anaerobic capacity, its effect on explosive performance remains underexplored, especially across varied intensity pairings.
Methods: A randomized controlled trial was conducted involving 36 female collegiate basketball players assigned to high-intensity (HI-SSIT), moderate-intensity (MI-SSIT), or multiple-intensity (MUL-SSIT) SSIT protocols over 8 weeks. Pre- and post-intervention assessments included vertical jump (CMJ, approach jump), sprint (10 m, 20 m), agility (Modified T-test, defensive slide), repeated sprint ability (RSA), intermittent endurance (YYIR1), and physiological markers (heart rate, blood lactate).
Results: MUL-SSIT showed “possibly” beneficial effects on jump height decrement, sprint performance, and heart rate recovery compared to other protocols. While all groups improved in RSA and endurance capacity (p < 0.001), MUL-SSIT had the greatest gains in 10 m sprint and fatigue resistance. No significant improvements were observed in CMJ or agility across groups. Heart rate recovery improved in all protocols, with MUL-SSIT showing the most favorable outcomes.
Conclusion: Multiple-intensity SSIT protocols are effective in enhancing fatigue resistance, sprint capacity, and certain aspects of explosive performance in female basketball players. These findings support the inclusion of varied-intensity SSIT formats in basketball conditioning programs to better address sport-specific demands.
Introduction
Explosive performance is a critical factor in basketball performance, particularly given the sport’s dynamic and fast-paced nature (Stojanovic et al., 2012). The rapid generation of high forces is essential for executing skills that confer offensive and defensive advantages on the court (Erčulj et al., 2010). Basketball involves a unique blend of explosive physical demands and high-level technical skills, necessitating training strategies that enhance both aspects simultaneously (Castagna et al., 2009). With the increasing participation of female basketball players across various levels, there is a growing focus on optimizing explosive performance and skill performance through research and training practices. While traditional methods like resistance training and plyometric exercises have been commonly employed to explosive performance (Griffiths et al., 2019), these approaches, though effective, often entail lengthy training sessions and may not fully replicate the intermittent and high-intensity nature of actual game scenarios.
Short sprint interval training (SSIT) has recently gained prominence as an efficient and adaptable approach to enhancing aerobic and anaerobic capacities, particularly through the incorporation of diverse intensity levels. By mirroring the exertion-rest sequences characteristic of competitive events, SSIT fosters pronounced neuromuscular adaptations (Gibala et al., 2006; Burgomaster et al., 2005). Furthermore, the short duration of each sprint in SSIT minimizes the risk of overtraining and excessive fatigue, thereby enabling athletes to sustain quality efforts across training sessions. Key studies have shown that even a low volume of SSIT can lead to substantial improvements in metabolic and neuromuscular function (Gibala et al., 2006; Burgomaster et al., 2005). While early research mainly focused on endurance adaptations and metabolic efficiency enhancements, recent literature suggests that SSIT protocols can also induce neuromuscular changes that promote explosive performance. These adaptations include improvements in muscle buffering capacity, glycogen storage, and increased expression of oxidative enzymes, contributing to enhanced rate of force development and jump performance (Burgomaster et al., 2006). Consequently, SSIT presents a promising training approach not only for boosting overall cardiorespiratory fitness but also for augmenting explosive muscular performance.
In addition to the metabolic and neuromuscular benefits, SSIT protocols have been shown to induce significant changes in hormonal profiles, substrate utilization, and muscle fiber recruitment patterns—all of which are critical determinants of explosive performance. For instance, studies have reported that SSIT can modulate insulin sensitivity, enhance dopamine responsiveness, and even influence the activation of type II muscle fibers, which are primarily responsible for rapid and powerful movements (Richards et al., 2010). These adaptations are particularly important in female athletes who may exhibit different hormonal responses and muscle fiber compositions relative to their male counterparts (Zhang et al., 2023). Moreover, the incorporation of multiple-intensity pairing strategies may further optimize these adaptations by carefully balancing periods of high-intensity stress with recovery intervals that facilitate neuromuscular restitution and subsequent power output (Liu et al., 2024; Li and Xue, 2024). Thus, using multiple-intensity SSIT pairing patterns holds promise for significantly improving explosive performance while also addressing the technical demands of skill performance.
Thus, the aim of this study was to explore the effects of multiple-intensity SSIT pairing patterns on explosive performance and skill performance in female basketball players. We hypothesize that 8-week multiple-intensity SSIT can significantly improve explosive performance and skill performance in female basketball players.
Methods
Study design
A randomized controlled trial with a parallel group design was conducted to evaluate the effects of different Short Sprint Interval Training (SSIT) intensity distributions on explosive performance and skill performance in female basketball players. The study was approved by the Shandong Normal University Institutional Review Board (approval number: SDNUTYDW2024042), and all procedures adhered to the Declaration of Helsinki.
Participants
Sample size calculations were performed using G*Power software (version 3.1.9.7) based on previous research evaluating SSIT interventions in team sport athletes (Wilson et al., 2021), with an 80% power, α = 0.05, and an expected medium-to-large effect size (partial η2 = 0.14) for the primary outcomes. Thirty-six female basketball players (age: 20.7 ± 1.8 years; height: 177.3 ± 6.2 cm; weight: 70.4 ± 7.5 kg) from two collegiate teams volunteered for this study. Inclusion criteria were: 1 at least 3 years of competitive basketball experience, 2 participation in regular team training sessions (≥4 sessions/week), 3 no injuries in the previous 3 months, and 4 no contraindications to high-intensity exercise. Exclusion criteria included: 1 any cardiovascular or orthopedic conditions exacerbated by intense exercise, 2 inability to complete baseline testing, and 3 planned absence for more than three consecutive days during the intervention period. After baseline testing, participants were stratified by playing position (guards, forwards, centers) and randomly assigned to one of three training groups via a computer-generated randomization sequence: High-Intensity SSIT (HI-SSIT, n = 12), Moderate-Intensity SSIT (MI-SSIT, n = 12), and Multiple-Intensity SSIT (MUL-SSIT, n = 12). None of the participants had previous systematic experience with the SSIT prior to the intervention (Figure 1). To ensure familiarity with all testing procedures and minimize potential learning effects, participants completed a familiarization session 1 week before baseline testing.
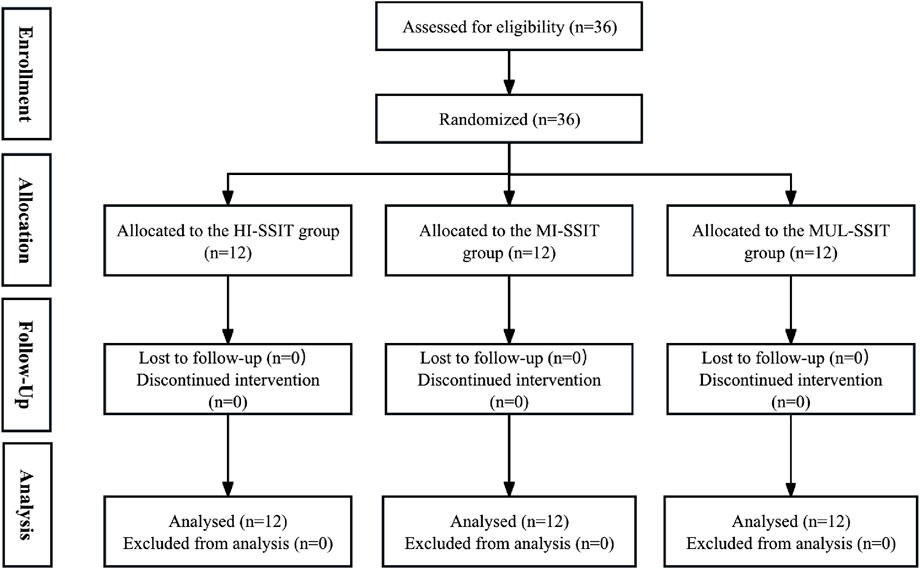
Figure 1. CONSORT flow diagram of participant allocation and analysis across three SSIT groups.
Procedures
Testing schedule
The study was conducted during the pre-season period to minimize the impact of competitive games on the training intervention. Testing sessions were completed at three time points:
Baseline (PRE): 1 week before the start of the intervention.
Post-intervention (POST): 1 week after completion of the 8-week intervention.
All testing sessions were conducted at the same time of day (±1 h) to minimize the effects of diurnal variation and were separated into two consecutive days. Day 1 included anthropometric measurements, vertical jump tests, sprint and agility tests, and the Yo-Yo Intermittent Recovery Test. Day 2 included skill performance tests and repeated sprint ability assessment.
Anthropometric measurements
Body mass was measured to the nearest 0.1 kg using a calibrated electronic scale (Seca 769, Hamburg, Germany), with participants wearing light clothing and no shoes. Standing height was measured to the nearest 0.1 cm using a stadiometer (Seca 217, Hamburg, Germany). Body composition was assessed using bioelectrical impedance analysis (InBody 770, Seoul, South Korea) following standardized procedures. The InBody 770 has demonstrated high test-retest reliability for body fat percentage measurements, with intraclass correlation coefficients (ICC) exceeding 0.95 (2013).
Vertical jump performance
Countermovement jump (CMJ) and approach jump performance were assessed using a portable force platform (Kistler 9286BA, Winterthur, Switzerland) sampling at 1,000 Hz. For the CMJ, participants stood with feet shoulder-width apart, hands on hips, and performed a countermovement to a self-selected depth followed by a maximal vertical jump (Di Domenico et al., 2023). For the approach jump, participants were allowed a 3-step approach before performing a maximal vertical jump, simulating a basketball-specific jumping task. Three attempts were performed for each jump type with 2-min rest intervals, and the highest jump height was recorded. Jump height was calculated from flight time using the equation: h = gt2/8, where h is the jump height (m), g is the acceleration due to gravity (9.81 m/s2), and t is the flight time (s) Additionally, a 30-s continuous jump test was performed to assess lower-limb muscular endurance and fatigue resistance. Participants performed repeated CMJs for 30 s, attempting to maximize jump height while minimizing ground contact time. The total number of jumps and the jump height decrement (%) from the first to the last five jumps were recorded. Multiple studies report excellent test-retest and intrasession reliability for CMJ height and related variables, with ICCs typically ranging from 0.79 to 0.98 and coefficients of variation (CV) generally below 10% (Heishman et al., 2020).
Sprint and agility performance
Linear sprint performance was assessed over 10 m and 20 m distances using photocell timing gates (Microgate Witty, Bolzano, Italy) positioned at the start, 10 m, and 20 m marks. Participants started in a stationary split stance with the front foot 0.5 m behind the first timing gate. Three attempts were performed with 3-min recovery periods, and the fastest time was recorded. Short-distance sprints (10–20 m), when measured with timing gates or similar precise technology, consistently show high test-retest reliability, with ICC values typically ranging from about 0.76 to 0.94 (Bariya and Pathak, 2020).
Change-of-direction ability was assessed using the modified T-test (Radhouane Haj Sassi et al., 2009). Four cones were arranged in a T-shape, with a 5 m distance from the start to the middle cone, and 2.5 m to each side cone. Participants sprinted forward to the middle cone, side-shuffled to the right cone, side-shuffled to the left cone, side-shuffled back to the middle cone, and backpedaled to the starting position. Three trials were performed with 3-min recovery periods, and the fastest time was recorded. Studies report ICCs for the modified T-test ranging from 0.82 to 0.95, indicating strong reliability across different populations, including healthy adults, athletes, and both men and women (Sassi et al., 2009).
Basketball-specific defensive movement was assessed using the defensive slide test. Participants performed defensive slides between cones placed 5 m apart in a zig-zag pattern for a total distance of 30 m. Time was recorded using photocell timing gates. This test has demonstrated good test-retest reliability in basketball players, with ICCs above 0.74–0.82 (Vučković et al., 2022). Although these tests reflect physical components relevant to basketball gameplay, such as lateral movement speed and change-of-direction ability, they do not directly assess technical basketball skills (e.g., ball handling, shooting accuracy). Therefore, in this study, agility performance is used as a proxy for basketball-related movement efficiency, rather than sport-specific skill execution.
Repeated sprint ability (RSA)
RSA was assessed using a 6 × 20 m shuttle sprint test (Pareja-Blanco et al., 2016). Participants completed six 20 m shuttle sprints (10 m out and back) with 20 s of passive recovery between sprints. Performance was measured using the total sprint time (sum of all six sprints) and the percentage decrement score calculated as: [(total sprint time ÷ best sprint time × 6) − 1] × 100. This RSA protocol has demonstrated good reliability, with ICCs for total sprint time and fatigue index ranging from 0.85 to 0.91.
Intermittent endurance capacity
The Yo-Yo Intermittent Recovery Test Level 1 (YYIR1) was used to assess intermittent endurance capacity (Narazaki et al., 2008) The test consisted of 2 × 20 m shuttle runs at progressively increasing speeds controlled by audio signals. Between each shuttle, participants had a 10-s active recovery period (2 × 5 m jog). The test was terminated when a participant failed to reach the finish line in time for two consecutive shuttles or due to volitional exhaustion. The total distance covered was recorded as the test result. The YYIR1 has excellent test-retest reliability in both male and female athletes, with ICC values typically ranging from 0.87 to 0.98 (Deprez et al., 2014).
Fatigue protocol
A basketball-specific fatigue protocol was used to induce fatigue before the post-fatigue skill assessments (Scanlan and Aaron, 2012). The Basketball Exercise Simulation Test (BEST) was modified to include four 5-min quarters with 2-min rest periods between quarters. The protocol included basketball-specific movements such as sprinting, defensive sliding, jumping, and directional changes at intensities simulating game demands. Heart rate was continuously monitored during the protocol using heart rate telemetry (Polar Team2 Pro, Kempele, Finland). Prior studies have reported this protocol as a valid and repeatable method to simulate game-induced fatigue, though specific ICC values are not always provided.
Physiological measurements
Heart rate monitoring
Heart rate was continuously monitored during all training sessions using heart rate telemetry (Polar Team2 Pro, Kempele, Finland). Maximum heart rate (HRmax) was determined using the Yo-Yo Intermittent Recovery Test at baseline. Heart rate recovery was assessed by recording heart rate at 30 s and 60 s post-exercise during training sessions. Polar heart rate monitors have demonstrated excellent agreement with ECG-derived heart rates, with ICCs typically above 0.95 and measurement errors below 2%.
Blood lactate concentration
Capillary blood samples (5 μL) were collected from the fingertip and analyzed for blood lactate concentration using a portable lactate analyzer (Lactate Pro 2, Arkray, Japan). Samples were collected at rest, immediately after the fatigue protocol, and at 3-, 5-, and 10-min post-exercise to assess lactate clearance rate.
Intervention protocol
All participants continued their re-gular basketball training (4-5 sessions per week, approximately 90 min per session, excluding SSIT sessions). The Short Sprint Interval Training (SSIT) intervention was conducted three times per week on non-consecutive days (Monday, Wednesday, and Friday) for 8 weeks. Each session was supervised by certified strength and conditioning specialists and began with a standardized 15-min warm-up, which included dynamic stretching, joint mobilization, and basketball-specific movements. High-Intensity SSIT (HI-SSIT): Participants performed 2-3 sets of 6-8 sprints at 90%–95% of maximal heart rate (RPE 9-10). Each sprint lasted 15–20 s, with 15–20 s passive recovery between sprints and 3 min active recovery between sets. Training progression was achieved by increasing the number of sprints per set (from 6 to 8) and the number of sets (from 2 to 3) over the 8-week period (Table 1).
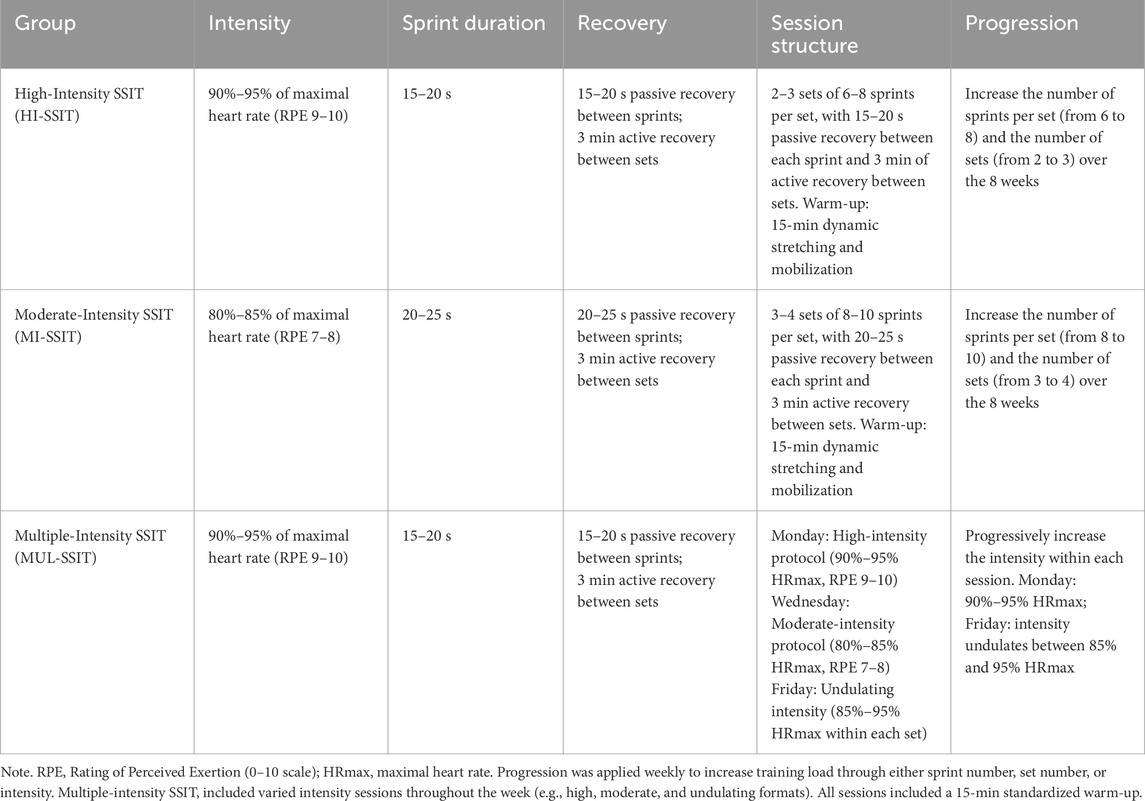
Table 1. Training protocol characteristics for high-, moderate-, and multiple-intensity SSIT groups.
Statistical analysis
Data were analyzed using SPSS software (version 26.0, IBM Corp., Armonk, NY, USA). Normality of distribution was confirmed using the Shapiro-Wilk test. Descriptive statistics are presented as means and standard deviations (mean ± SD). A 2 × 3 mixed-model analysis of variance (ANOVA) with repeated measures was used to examine the effects of group (HI-SSIT, MI-SSIT, MUL-SSIT) and time (PRE, POST) on each dependent variable. Mauchly’s test was used to assess sphericity, and where the assumption was violated, Greenhouse-Geisser corrections were applied.
When significant main effects or interactions were detected, post hoc pairwise comparisons with Bonferroni adjustment were conducted to identify specific differences. Effect sizes were calculated using partial eta squared (η2p) for ANOVA effects and Cohen’s d for pairwise comparisons, with values of 0.01, 0.06, and 0.14 representing small, medium, and large effects for η2p, and values of 0.2, 0.5, and 0.8 representing small, medium, and large effects for Cohen’s d, respectively (Taylor and Harris, 2023). Qualitative probabilities of effects being beneficial or detrimental were calculated using the smallest worthwhile change (SWC), defined as 0.2 × inter-subject SD, better or worse effects were assessed qualitatively as follows: <1%, almost certainly not; 1%–5%, very unlikely; 5%–25%, unlikely; 25%–75%, possibly; 75%–95%, likely; 95%–99%, very likely; and >99%, almost certain. If the chances of obtaining beneficial/better or detrimental/worse were both >5%, the true difference was assessed as unclear (Hopkins et al., 2009; Marques et al., 2019). Statistical significance was set at p < 0.05. To enhance practical interpretability for coaches and practitioners, these descriptors reflect both the magnitude and certainty of observed effects. For instance, a “possibly beneficial” outcome suggests moderate probability of performance improvement with individual variability, whereas a “likely beneficial” result implies high confidence and practical applicability. This approach helps translate statistical outcomes into meaningful guidance for sport-specific training decisions.
Results
Vertical jump performance
For the countermovement jump (CMJ), there were no significant main effects of group (F = 0.326, p = 0.724), time (F = 1.467, p = 0.724), or group × time interaction (F = 1.405, p = 0.234). The MI-SSIT group demonstrated a small decline from 35.36 ± 5.36 cm to 34.93 ± 5.31 cm (Cohen’s d = 0.08), with a qualitative probability of “Unlikely” improvement. The HI-SSIT group showed a moderate decrease from 35.23 ± 3.89 cm to 33.39 ± 4.28 cm (Cohen’s d = −0.45), interpreted as a “Possibly” detrimental effect. The MUL-SSIT group showed a modest increase from 34.43 ± 2.81 cm to 35.12 ± 2.68 cm (Cohen’s d = 0.08), suggesting a “Possibly” beneficial outcome (Tables 2, 3; Figure 2).

Figure 2. Pre- and post-intervention changes in six key performance variables, presented separately for each training group (HI-SSIT, MI-SSIT, and MUL-SSIT). Note: * indicates a significant within-group difference between pre- and post-intervention (p < 0.05); #indicates a significant between-group difference at post-test based on post hoccomparisons (p < 0.05).

Table 2. Pre- and post-intervention performance outcomes across groups.

Table 3. Effect sizes and probabilities of performance changes following SSIT interventions.
For the approach jump, no significant main effects were found for group (F = 0.326, p = 0.724), time (F = 1.467, p = 0.234), or interaction (F = 1.405, p = 0.260). The HI-SSIT group showed a trivial increase from 40.04 ± 6.22 cm to 40.48 ± 6.41 cm (Cohen’s d = 0.07), rated as “Unlikely.” The MI-SSIT group slightly declined from 39.69 ± 3.32 cm to 39.36 ± 3.25 cm (Cohen’s d = 0.10), also “Unlikely.” The MUL-SSIT group improved from 40.27 ± 4.99 cm to 41.85 ± 3.90 cm (Cohen’s d = 0.10), corresponding to a “Possibly” beneficial effect (Tables 2, 3; Figure 2).
Jump height decrement showed a significant group × time interaction (F = 3.277, p = 0.050) and a significant main effect of time (F = 21.555, p < 0.001). The HI-SSIT group demonstrated a substantial reduction in decrement score from 21.08% ± 4.50% to 16.25% ± 2.34% (Cohen’s d = 1.35), indicating “Possibly” better fatigue resistance. The MUL-SSIT group also exhibited a notable improvement from 21.50% ± 5.07% to 16.08% ± 2.15% (Cohen’s d = 1.35), while the MI-SSIT group showed minimal change from 21.67% ± 3.94% to 20.83% ± 7.03% (Cohen’s d = 0.15), considered “Most unlikely” to be beneficial (Tables 2, 3; Figure 2).
The 30-s continuous jump test revealed no significant group effect (F = 0.056, p = 0.946) or group × time interaction (F = 0.231, p = 0.794). The HI-SSIT group remained nearly unchanged (32.83 ± 4.09 cm to 32.58 ± 4.58 cm, d = 0.06), with “Unlikely” improvement. The MI-SSIT group slightly improved (32.25 ± 3.96 cm to 32.67 ± 4.62 cm, d = 0.10), also “Unlikely.” The MUL-SSIT group improved from 32.42 ± 4.64 cm to 33.67 ± 3.68 cm (d = 0.10), with a probability of “Possibly” better performance (Tables 2, 3; Figure 2).
Sprint and agility performance
For linear sprint performance, there were significant time effects in both 10 m (F = 16.584, p < 0.001) and 20 m sprints (F = 15.611, p < 0.001), with no significant group × time interaction. The HI-SSIT group improved from 2.19 ± 0.23 s to 2.09 ± 0.14 s in the 10 m sprint (Cohen’s d = 0.54) and from 3.88 ± 0.23 s to 3.79 ± 0.29 s in the 20 m sprint (d = 0.37), both showing “Possibly” beneficial effects. The MI-SSIT group also improved, from 2.18 ± 0.17 s to 2.11 ± 0.14 s (10 m, d = 0.45) and from 3.77 ± 0.31 s to 3.75 ± 0.32 s (20 m, d = 0.08), with qualitative effects rated as “Unlikely” to “Possibly.” The MUL-SSIT group showed the largest gain in 10 m sprint performance (2.21 ± 0.21 s to 2.05 ± 0.07 s, d = 1.07) and a moderate improvement in 20 m sprint (3.74 ± 0.30 s to 3.62 ± 0.31 s, d = 0.39), both rated as “Possibly” beneficial (Tables 2, 3; Figure 2).
For the Modified T-test, there were no significant effects for group (F = 0.577, p = 0.567) or group × time interaction (F = 0.017, p = 0.983), but a significant time effect (F = 14.898, p = 0.001) was found. All three groups showed marginal improvements, with HI-SSIT (10.87 ± 1.03 s to 10.66 ± 0.92 s), MI-SSIT (10.81 ± 0.97 s to 10.70 ± 0.85 s), and MUL-SSIT (10.93 ± 0.92 s to 10.70 ± 0.67 s), each associated with small effect sizes (d = 0.12–0.21) and qualitative probabilities rated as “Unlikely” or “Most unlikely (Tables 2, 3; Figure 2).”
The defensive slide test also showed no significant group (F = 0.277, p = 0.192) or interaction effect (F = 0.635, p = 0.536), although a significant time effect was observed (F = 17.878, p < 0.001). The HI-SSIT group improved from 10.97 ± 0.91 s to 10.51 ± 1.16 s (d = 0.44), MI-SSIT from 11.04 ± 0.72 s to 10.77 ± 0.62 s (d = 0.41), and MUL-SSIT from 10.98 ± 1.13 s to 10.43 ± 0.72 s (d = 0.41), but the improvements were generally rated as “Unlikely” or “Most unlikely (Tables 2, 3; Figure 2).”
Repeated sprint ability (RSA)
The 6 × 20 m shuttle sprint test showed a significant main effect of time (F = 47.239, p < 0.001), with all three groups improving. The HI-SSIT group reduced total sprint time from 39.59 ± 4.93 s to 38.19 ± 3.44 s (d = 0.33), the MI-SSIT group from 39.69 ± 3.79 s to 38.34 ± 2.94 s (d = 0.40), and the MUL-SSIT group from 39.73 ± 4.76 s to 37.62 ± 2.98 s (d = 0.40). Despite improvements, qualitative probabilities were interpreted as “Unlikely” or borderline “Possibly” across groups. The percentage decrement score also showed a significant time effect (F = 32.398, p < 0.001). HI-SSIT improved from 8.40 ± 1.58 to 7.66 ± 1.01 (d = 0.55), MI-SSIT from 8.28 ± 1.46 to 7.58 ± 0.80 (d = 0.60), and MUL-SSIT from 8.41 ± 0.80 to 6.91 ± 0.56 (d = 0.60). All groups showed statistically meaningful reductions in fatigue, though qualitative probabilities were rated as “Unlikely (Tables 2, 3; Figure 2).”
Intermittent endurance capacity
YYIR1 performance significantly improved across all groups (F = 73.265, p < 0.001), with no significant group (F = 0.793, p = 0.461) or group × time interaction (F = 0.000, p = 1). The HI-SSIT group increased from 1329.37 ± 189.39 m to 1385.20 ± 158.40 m (d = 0.32), the MI-SSIT group from 1311.14 ± 171.00 m to 1392.85 ± 178.69 m (d = 0.47), and the MUL-SSIT group from 1302.53 ± 148.89 m to 1408.60 ± 120.83 m (d = 0.47). These improvements were interpreted as “Likely” for HI-SSIT and MUL-SSIT and “Possibly” for MI-SSIT (Tables 2, 3; Figure 2).
Heart rate recovery
There was a significant main effect of time (F = 40.506, p = 0.000), with no significant group (F = 0.972, p = 0.389) or interaction effect (F = 2.859, p = 0.072). Heart rate recovery improved in all groups: HI-SSIT from 18.53 ± 3.14 to 20.47 ± 2.13 bpm (d = 0.72), MI-SSIT from 17.80 ± 4.38 to 19.39 ± 3.37 bpm (d = 0.41), and MUL-SSIT from 18.57 ± 4.38 to 22.23 ± 1.97 bpm (d = 0.41). These were qualitatively interpreted as “Possibly” to “Likely” beneficial adaptations (Tables 2, 3; Figure 2).
Discussion
The present study investigated the effects of multiple-intensity SSIT pairing patterns on explosive performance and skill performance in female basketball players. Our findings indicate that, while there were no significant overall improvements in vertical jump performance as measured by the CMJ and approach jump, specific aspects such as jump height decrement and fatigue resistance, as well as linear sprint and repeated sprint ability, demonstrated meaningful modulations following the intervention. These outcomes underscore the complex interplay between training intensity, neuromuscular adaptation, and sport-specific performance, and they contribute to an emerging body of literature seeking to optimize performance through tailored training protocols.
In our study, the CMJ performance did not reveal significant main effects of group or time. The heterogeneous responses in jump performance found in this study align with previous investigations that have utilized various field-based assessments to quantify lower-limb explosive performance. For example, Chamari et al. (2008) demonstrated that the five-jump test can effectively quantify explosive performance in soccer players (Chamari et al., 2008); similarly, Stockbrugger and Haennel’s validation of the medicine ball throw test (Stockbrugger and Haennel, 2001) supports the need for multiple testing modalities to capture the multifaceted nature of explosive performance. Moreover, Cronin et al. (2001) emphasized that movement technique plays a critical role in optimizing explosive performance output (Cronin et al., 2001). The divergent outcomes in jump height and fatigue resistance found here suggest that the pairing patterns used in SSIT may influence neuromuscular fatigue differently, perhaps by engaging distinct motor unit recruitment strategies. These observations resonate with prior work that noted varied fatigue responses in athletes under different training regimes (Rejc et al., 2018; Haj-Sassi et al., 2011). Such findings underscore the importance of monitoring not only peak performance but also the sustainability of performance under conditions of repeated explosive effort.
Significant enhancements in linear sprint performance were evident in both the 10 m and 20 m sprint tests across all groups, with the MUL-SSIT group displaying the most notable improvements in the 10 m sprint. Although the group × time interaction did not achieve statistical significance, the substantial reduction in sprint times, particularly in short, explosive efforts, indicates favorable neuromuscular adaptations. Rapid acceleration over short distances is pivotal in basketball for instigating fast breaks and defensive transitions. These results align with existing literature associating improved sprint performance with enhanced explosive neuromuscular function. For example, Tillin et al. (2010) illustrated that explosive power athletes surpassed untrained individuals in rapid force generation during sprints (Tillin et al., 2010); similarly, Tsao et al. (2022) underscored the significance of motor abilities, including explosive power, in identifying athletic talent (Tsao et al., 2022). Furthermore, Gisladottir et al. (2024) investigated the relationship between agility and sprint performance, with their results supporting the correlation between linear speed and change-of-direction capabilities (Gisladottir et al., 2024). Considering the constant and rapid speed and direction changes in basketball, these advancements in sprint metrics bear substantial practical implications for athletic performance.
In contrast, the Modified T-test and the defensive slide test—which are measures of agility and change-of-direction speed—showed only marginal improvements. Although the time effects were significant in these tests, the lack of notable group differences suggests that SSIT pairing patterns may have a limited impact on the specific neuromuscular adaptations required for agility. This finding is not entirely surprising, as agility performance is influenced by multiple factors, including coordination, balance, and decision-making, which may not be sufficiently challenged by SSIT protocols alone (Castagna et al., 2009; Skelton et al., 2002). The relatively small effect sizes observed here suggest that while the SSIT approach may induce improvements in sprint capacity, integrating specific agility drills may be necessary to achieve more marked enhancements in change-of-direction speed.
Although certain performance indicators, such as CMJ and agility tests, did not yield statistically significant group or interaction effects, several outcomes showed small-to-moderate effect sizes (e.g., Cohen’s d = 0.4–0.5). In trained populations with relatively small sample sizes, such magnitudes may still reflect meaningful physiological adaptations. For example, the MUL-SSIT group exhibited “possibly beneficial” trends in CMJ and defensive slide performance, indicating improved neuromuscular output or movement efficiency not fully captured by conventional statistical thresholds. This apparent discrepancy may be further explained by the principle of training specificity. While SSIT mimics the intermittent, high-intensity demands of basketball, it does not sufficiently engage the perceptual and cognitive components critical to agility performance. Agility and defensive effectiveness rely not only on physical capabilities like acceleration and direction change, but also on rapid visual processing, anticipation, and decision-making (Young et al., 2015)—elements not directly trained by SSIT alone. Therefore, the modest improvements observed may reflect the limited transfer of linear sprint-based training to complex, multidimensional game behaviors. Future interventions might consider integrating SSIT with reactive agility drills or opponent-based scenarios to better simulate the perceptual-motor demands of in-game movement. Additionally, the training duration, while sufficient to elicit improvements in other performance domains, may have been insufficient to induce the specific neuromuscular adaptations required for greater agility and defensive sliding gains.
The RSA test, which consisted of a 6 × 20 m shuttle sprint, demonstrated significant improvements over time across all groups, with reductions in total sprint time and percentage decrement scores. These improvements in RSA reflect a better ability to sustain high-intensity efforts over multiple sprints—a quality that is crucial for the demands of basketball, where players often engage in bursts of rapid movements interspersed with short recovery periods. The substantial reductions in fatigue, as measured by the decrement scores, suggest that the HI-SSIT and MUL-SSIT conditions may enhance neuromuscular endurance and delay the onset of fatigue. Such adaptations are consistent with previous studies that reported alterations in muscle fiber recruitment and metabolic efficiency following high-intensity training protocols (Rejc et al., 2018). Furthermore, studies employing blood flow restriction training have demonstrated that modifications in training intensity can yield improvements in explosive power and fatigue resistance (Wang et al., 2023). In tandem with improvements in the RSA test, intermittent endurance capacity, as measured through the YYIR1 test, was significantly enhanced in all groups. These findings are indicative of improved aerobic capacity, which is essential for maintaining performance during prolonged, high-intensity activity. The aerobic and anaerobic systems must synergistically support explosive actions in basketball, and our results suggest that SSIT protocols can positively affect both energy systems (Erčulj et al., 2010). The concomitant improvement in heart rate recovery further supports the notion that SSIT fosters favorable cardiovascular adaptations (Ekstrand et al., 2013).
The performance enhancements observed in the study are attributed to neural and metabolic adaptations resulting from the specific pairing patterns utilized in the SSIT protocols. Differentiation between HI-SSIT, MI-SSIT, and MUL-SSIT is believed to influence motor unit recruitment patterns, rate of force development, and muscle fiber type utilization. Research by Zhang et al. (2023) suggests that resistance training methods, whether velocity-based or percentage-based, can have varying effects on explosive neuromuscular adaptations (Zhang et al., 2023). Additionally, findings by Fu et al. (2023) demonstrate acute potentiation effects following flywheel training, shedding light on how specific loading patterns can enhance explosive performance (Fu et al., 2023). Moreover, Zamparo et al. (1997) discuss the role of elastic recoil in enhancing muscle power, providing a potential biomechanical mechanism that may interact with the SSIT protocols (Zamparo et al., 1997).
The practical implications of this study are significant for practitioners seeking to optimize training regimens for female basketball players. The differential responses observed across SSIT intensities suggest that a multiple-intensity approach may be more beneficial in simultaneously enhancing neuromuscular endurance, speed, and explosive power compared with a single-intensity approach. This notion is supported by previous research reporting that individualized or mixed training modalities can yield superior performance benefits (Shalom et al., 2024; Crow et al., 2012). Coaches and practitioners might consider incorporating both high- and moderate-intensity elements into training sessions, with particular attention to fatigue resistance and sprint performance, which were among the most responsive outcomes.
Despite promising findings, several limitations must be acknowledged. First, the relatively small sample size (n = 12 per group) and the specific demographic—female collegiate basketball players from China—limit the generalizability of the findings. Future research should include larger and more diverse populations to validate and refine dosing recommendations across broader athletic cohorts. Second, although a comprehensive performance test battery was employed (including vertical and approach jump assessments, sprint tests, and repeated sprint ability measures), the ecological validity of these assessments may be limited compared to in-game performance indicators. Prior literature has highlighted the importance of field-based measures that closely simulate competitive conditions. Third, individual biomechanical and anatomical differences—such as variations in foot arch structure—may have influenced training responses, as suggested by previous studies, and warrant further investigation. Lastly, potential confounding variables, including hormonal status (e.g., menstrual cycle phase), nutritional intake, and recovery strategies, were not systematically monitored or controlled. These factors could have variably impacted performance outcomes and should be addressed in future studies.
Conclusion
In conclusion, our study shows that various SSIT pairing patterns at different intensities lead to distinct improvements in explosive power, sprint performance, and fatigue resistance among female basketball players. These findings suggest the importance of incorporating mixed-intensity training methods to address the multifaceted physical demands of basketball. Future research should aim for larger-scale investigations, improved field-based evaluations, and personalized training strategies to better connect theoretical results with real-world basketball performance.
Data availability statement
The original contributions presented in the study are included in the article/supplementary material, further inquiries can be directed to the corresponding authors.
Ethics statement
The studies involving humans were approved by The study was approved by the Shandong Normal University Institutional Review Board (approval number: SDNUTYDW2024042), and all procedures adhered to the Declaration of Helsinki. The studies were conducted in accordance with the local legislation and institutional requirements. The participants provided their written informed consent to participate in this study.
Author contributions
JC: Data curation, Writing – review and editing, Software, Writing – original draft, Methodology. JL: Writing – original draft, Resources, Methodology, Visualization. XW: Software, Resources, Writing – review and editing. YW: Resources, Validation, Writing – review and editing.
Funding
The author(s) declare that no financial support was received for the research and/or publication of this article.
Conflict of interest
The authors declare that the research was conducted in the absence of any commercial or financial relationships that could be construed as a potential conflict of interest.
Correction note
This article has been corrected with minor changes. These changes do not impact the scientific content of the article.
Generative AI statement
The author(s) declare that no Generative AI was used in the creation of this manuscript.
Any alternative text (alt text) provided alongside figures in this article has been generated by Frontiers with the support of artificial intelligence and reasonable efforts have been made to ensure accuracy, including review by the authors wherever possible. If you identify any issues, please contact us.
Publisher’s note
All claims expressed in this article are solely those of the authors and do not necessarily represent those of their affiliated organizations, or those of the publisher, the editors and the reviewers. Any product that may be evaluated in this article, or claim that may be made by its manufacturer, is not guaranteed or endorsed by the publisher.
References
Bariya N., Pathak I. (2020). Test-retest reliability of the 50 meter dash test as a measure of sprinting performance in collegiate sprinters.
Burgomaster K. A., Hughes S. C., Heigenhauser G. J., Bradwell S. N., Gibala M. J. (2005). Six sessions of sprint interval training increases muscle oxidative potential and cycle endurance capacity in humans. J. Appl. Physiol. (1985) 98, 1985–1990. doi:10.1152/japplphysiol.01095.2004
Burgomaster K. A., Heigenhauser G. J., Gibala M. J. (2006). Effect of short-term sprint interval training on human skeletal muscle carbohydrate metabolism during exercise and time-trial performance. J. Appl. Physiol. (1985) 100, 2041–2047. doi:10.1152/japplphysiol.01220.2005
Castagna C., Chaouachi A., Rampinini E., Chamari K., Impellizzeri F. (2009). Aerobic and explosive power performance of elite Italian regional-level basketball players. J. Strength Cond. Res. 23, 1982–1987. doi:10.1519/JSC.0b013e3181b7f941
Chamari K., Chaouachi A., Hambli M., Kaouech F., Wisløff U., Castagna C. (2008). The five-jump test for distance as a field test to assess lower limb explosive power in soccer players. J. Strength Cond. Res. 22, 944–950. doi:10.1519/JSC.0b013e31816a57c6
Cronin J., Mcnair P. J., Marshall R. N. (2001). Developing explosive power: a comparison of technique and training. J. Sci. Med. Sport 4, 59–70. doi:10.1016/s1440-2440(01)80008-6
Crow J. F., Buttifant D., Kearny S. G., Hrysomallis C. (2012). Low load exercises targeting the gluteal muscle group acutely enhance explosive power output in elite athletes. J. Strength Cond. Res. 26, 438–442. doi:10.1519/JSC.0b013e318220dfab
Deprez D., Fransen J., Lenoir M., Philippaerts R., Vaeyens R. (2014). The Yo-Yo intermittent recovery test level 1 is reliable in young high-level soccer players. Biol. Sport 32, 65–70. doi:10.5604/20831862.1127284
Di Domenico F., D’Isanto T., Esposito G., Aliberti S., Raiola G. (2023). Exploring the influence of cognitive and ecological dynamics approaches on countermovement jumping enhancement: a comparative training study. J. Funct. Morphol. Kinesiol. 8, 133. doi:10.3390/jfmk8030133
Ekstrand L. G., Battaglini C. L., Mcmurray R. G., Shields E. W. (2013). Assessing explosive power production using the backward overhead shot throw and the effects of morning resistance exercise on afternoon performance. J. Strength Cond. Res. 27, 101–106. doi:10.1519/JSC.0b013e3182510886
Erčulj F., Blas M., Bračič M. (2010). Physical demands on young elite European female basketball players with special reference to speed, agility, explosive strength, and take-off power. J. Strength Cond. Res. 24, 2970–2978. doi:10.1519/jsc.0b013e3181e38107
Fu K., Chen L., Poon E. T., Wang R., Li Q., Liu H., et al. (2023). Post-activation performance enhancement of flywheel training on lower limb explosive power performance. Front. Physiol. 14, 1217045. doi:10.3389/fphys.2023.1217045
Gibala M. J., Little J. P., Van Essen M., Wilkin G. P., Burgomaster K. A., Safdar A., et al. (2006). Short-term sprint interval versus traditional endurance training: similar initial adaptations in human skeletal muscle and exercise performance. J. Physiol. 575, 901–911. doi:10.1113/jphysiol.2006.112094
Gisladottir T., Petrović M., Sinković F., Novak D. (2024). The relationship between agility, linear sprinting, and vertical jumping performance in U-14 and professional senior team sports players. Front. Sports Act. Living 6, 1385721. doi:10.3389/fspor.2024.1385721
Griffiths B., Grant J., Langdown L., Gentil P., Fisher J., Steele J. (2019). The effect of In-Season traditional and explosive resistance training programs on strength, jump height, and speed in recreational soccer players. Res. Q. Exerc Sport 90, 95–102. doi:10.1080/02701367.2018.1563276
Haj-Sassi R., Dardouri W., Gharbi Z., Chaouachi A., Mansour H., Rabhi A., et al. (2011). Reliability and validity of a new repeated agility test as a measure of anaerobic and explosive power. J. Strength Cond. Res. 25, 472–480. doi:10.1519/JSC.0b013e3182018186
Heishman A., Daub B., Miller R., Freitas E., Frantz B., Bemben M. (2020). Countermovement jump reliability performed with and without an arm swing in NCAA division 1 intercollegiate basketball players. J. Strength Cond. Res. 34, 546–558. doi:10.1519/JSC.0000000000002812
Hopkins W. G., Marshall S. W., Batterham A. M., Hanin J. (2009). Progressive statistics for studies in sports medicine and exercise science. Med. and Sci. Sports and Exerc. 41, 3–13. doi:10.1249/MSS.0b013e31818cb278
Li X., Xue K. (2024). Optimizing short sprint interval training for young soccer players: unveiling optimal rest distributions to maximize physiological adaptations. J. Sports Sci. Med. 23, 475–486. doi:10.52082/jssm.2024.475
Liu Q., Wang W., Shu C. (2024). Effects of short sprint interval training frequency on physical and physiological performance adaptations in Male soccer players. J. Sports Sci. Med. 23, 707–717. doi:10.52082/jssm.2024.707
Marques D., Travassos B., Sousa A., Gil M., Ribeiro J., Marques M. (2019). Effects of low-moderate load high-velocity resistance training on physical performance of Under-20 futsal players. Sports 7, 69. doi:10.3390/sports7030069
Narazaki K., Berg K., Stergiou N., Chen B. (2008). Physiological demands of competitive basketball. Scand. J. Med. Sci. Sports 19, 425–432. doi:10.1111/j.1600-0838.2008.00789.x
Pareja-Blanco F., Suárez-Arrones L., Rodríguez-Rosell D., López-Segovia M., Jiménez-Reyes P., Bachero-Mena B., et al. (2016). Evolution of determinant factors of repeated sprint ability. J. Hum. Kinet. 54, 115–126. doi:10.1515/hukin-2016-0040
Radhouane Haj Sassi W. D., Mohamed H. A. J. Y., Nabil G., Gharbi M. E. M. (2009). Relative and absolute reliability of a modified agility T-test and its relationship with vertical jump and straight sprint. J. Strength and Cond. Res. 23, 1644–1651. doi:10.1519/JSC.0b013e3181b425d2
Rejc E., Floreani M., Taboga P., Botter A., Toniolo L., Cancellara L., et al. (2018). Loss of maximal explosive power of lower limbs after 2 weeks of disuse and incomplete recovery after retraining in older adults. J. Physiol. 596, 647–665. doi:10.1113/JP274772
Richards J. C., Johnson T. K., Kuzma J. N., Lonac M. C., Schweder M. M., Voyles W. F., et al. (2010). Short-term sprint interval training increases insulin sensitivity in healthy adults but does not affect the thermogenic response to beta-adrenergic stimulation. J. Physiol. 588, 2961–2972. doi:10.1113/jphysiol.2010.189886
Sassi R., Dardouri W., Yahmed M., Gmada N., Mahfoudhi M., Gharbi Z. (2009). Relative and absolute reliability of a modified agility T-test and its relationship with vertical jump and straight sprint. J. Strength Cond. Res. 23, 1644–1651. doi:10.1519/JSC.0b013e3181b425d2
Scanlan and Aaron T., Dascombe B. J., Reaburn P. R. J. (2012). The construct and longitudinal validity of the basketball exercise simulation test. J. Strength and Cond. Res. 26, 523–530. doi:10.1519/JSC.0b013e318220dfc0
Shalom A., Gottlieb R., Alcaraz P. E., Calleja-Gonzalez J. (2024). Unique specific jumping test for measuring explosive power in young basketball players: differences by gender, age, and playing positions. Sports (Basel) 12, 118. doi:10.3390/sports12050118
Skelton D. A., Kennedy J., Rutherford O. M. (2002). Explosive power and asymmetry in leg muscle function in frequent fallers and non-fallers aged over 65. Age Ageing 31, 119–125. doi:10.1093/ageing/31.2.119
Stockbrugger B. A., Haennel R. G. (2001). Validity and reliability of a medicine ball explosive power test. J. Strength Cond. Res. 15, 431–438. doi:10.1519/1533-4287(2001)015<0431:varoam>2.0.co;2
Stojanovic M. D., Ostojic S. M., Calleja-González J., Milosevic Z., Mikic M. (2012). Correlation between explosive strength, aerobic power and repeated sprint ability in elite basketball players. J. Sports Med. Phys. Fit. 52, 375–381.
Tillin N. A., Jimenez-Reyes P., Pain M. T., Folland J. P. (2010). Neuromuscular performance of explosive power athletes versus untrained individuals. Med. Sci. Sports Exerc 42, 781–790. doi:10.1249/MSS.0b013e3181be9c7e
Tsao J. P., Liu C. C., Chang B. F. (2022). Application of the motor abilities assessment as part of a talent identification system in tennis players: a pilot study. Int. J. Environ. Res. Public Health 19, 8963. doi:10.3390/ijerph19158963
Vučković I., Gadžić A., Marković S., Sekulić Ž. (2022). The validity and reliability of the reaction time and basketball defensive slide speed test.
Wang X., Qin X. M., Ji S., Dong D. (2023). Effects of resistance training with blood flow restriction on explosive power of lower limbs: a systematic review and meta-analysis. J. Hum. Kinet. 89, 259–268. doi:10.5114/jhk/168308
Young W., Miller I., Talpey S. (2015). Physical qualities predict change-of-direction speed but not defensive agility in Australian rules football. J. Strength Cond. Res. 29, 206–212. doi:10.1519/JSC.0000000000000614
Zamparo P., Antonutto G., Capelli C., Girardis M., Sepulcri L., Di Prampero P. E. (1997). Effects of elastic recoil on maximal explosive power of the lower limbs. Eur. J. Appl. Physiol. Occup. Physiol. 75, 289–297. doi:10.1007/s004210050163
Keywords: short sprint interval training (SSIT), female athletes, explosivepower, sprint performance, fatigue resistance, basketball conditioning, high-intensity training, agility
Citation: Cao J, Lin J, Wang X and Wang Y (2025) Effects of multiple-intensity SSIT pairing patterns on explosive power and skill performance in female basketball players. Front. Physiol. 16:1635508. doi: 10.3389/fphys.2025.1635508
Received: 26 May 2025; Accepted: 15 August 2025;
Published: 01 September 2025; Corrected: 08 September 2025.
Edited by:
Giuseppe D’Antona, University of Pavia, ItalyReviewed by:
Enrique Flórez Gil, Universidad Isabel I, SpainPanteleimon Bakirtzoglou, Aristotle University of Thessaloniki, Greece
Copyright © 2025 Cao, Lin, Wang and Wang. This is an open-access article distributed under the terms of the Creative Commons Attribution License (CC BY). The use, distribution or reproduction in other forums is permitted, provided the original author(s) and the copyright owner(s) are credited and that the original publication in this journal is cited, in accordance with accepted academic practice. No use, distribution or reproduction is permitted which does not comply with these terms.
*Correspondence: Xiangying Wang, ODM3ODcxMTc2QHFxLmNvbQ==; Jinyang Lin, NDIzMzA3MzAwQHFxLmNvbQ==; Yulong Wang, Mjc5MTQ1MTkyQHFxLmNvbQ==