 Aranyak Chakravarty
 Debjit Kundu
 Mahesh V. Panchagnula
 Alladi Mohan3
 Neelesh A. Patankar
- 1School of Nuclear Studies and Application, Jadavpur University, Kolkata, India
- 2Department of Applied Mechanics and Biomedical Engineering, Indian Institute of Technology Madras, Chennai, India
- 3Department of Medicine, Sri Venkateswara Institute of Medical Sciences, Tirupati, India
- 4Department of Mechanical Engineering, Northwestern University, Evanston, IL, United States
The need to understand how infection spreads to the deep lung was acutely realized during the severe acute respiratory syndrome coronavirus-2 (SARS-CoV-2) pandemic. The challenge of modeling virus laden aerosol transport and deposition in the airways, coupled with mucus clearance, and infection kinetics, became evident. This perspective provides a consolidated view of coupled one-dimensional physics-based mathematical models to probe multifaceted aspects of lung physiology. Successes of 1D trumpet models in providing mechanistic insights into lung function and optimalities are reviewed while identifying limitations and future directions. Key non-dimensional numbers defining lung function are reported. The need to quantitatively map various pathologies on a physics-based parameter space of non-dimensional numbers (a virtual disease landscape) is noted with an eye on translating modeling to clinical practice. This could aid in disease diagnosis, get mechanistic insights into pathologies, and determine patient specific treatment plan. 1D modeling could, thus, be an important tool in developing novel measurement and analysis platforms that could be deployed at point-of-care.
1 Introduction
Deep lung infections had occurred commonly during the severe acute respiratory syndrome coronavirus-2 (SARS-CoV-2) pandemic causing unprecedented number of deaths (Wiersinga et al., 2020). One critical question was why this virus was infecting the deep lung much more than other respiratory viruses? How was the virus reaching into the deep lung so efficiently? Was it through the blood or the mucus lining or through aerosol transport in airways or was it growing due to favorable infection kinetics (Hagman et al., 2020; Tan et al., 2020; Edwards et al., 2021; Basu et al., 2022; Chakravarty et al., 2022; Chen et al., 2022; Darquenne et al., 2022a)? Direct experimental evidence of the underlying mechanism was difficult due to anatomical complexities of the lung as well as limitations of current measurement techniques. The need to rely on indirect evidence together with physical models was, thus, evident (Basu et al., 2022; Chakravarty et al., 2022; Chen et al., 2022; Darquenne et al., 2022a). Lung function is multifaceted and the challenge of modeling virus-laden aerosol transport and deposition in the airways, coupled with mucus clearance and infection kinetics, became obvious (Chakravarty et al., 2022). This perspective reviews and consolidates various one-dimensional mathematical frameworks that can be a powerful tool to achieve this goal in the future.
One dimensional (1D) physics-based models have been providing useful mechanistic insights into lung function and optimalities (Taulbee and Yu, 1975; Darquenne and Paiva, 1994; Darquenne et al., 2022a). By 1D models, we imply that for each airway the physical variables are functions of the axial coordinate, while the radial and circumferential variations are averaged. We provide a unified view of the coupled physics to probe the multifaceted aspects of lung physiology. We interpret the results in a new light. For example, we highlight how steady-state solutions during inhalation are a limiting solution for gas invasion into the lung that can provide key insights into lung function. We provide an analytic steady-state solution for the first time and provide scaling arguments to guide our intuition about lung physiology. We show results based on known 1D models in literature to highlight the insights based on the effect of various non-dimensional numbers; understanding lung function via non-dimensional numbers is a perspective we emphasize in this article. We discuss how these calculations can be used to gain clinically relevant information for efficient drug delivery via lung or to understand deep lung infection (such as in SARS-CoV-2).
We tabulate the non-dimensional numbers defining lung function and discuss how it could provide a potential pathway to clinical translation. For example, we note an approach to measure and map various pathologies on a physics-based parameter space of non-dimensional numbers. Finally, this article supports the view that 1D modeling could be an important tool in developing novel platforms that can be deployed at point-of-care and that the physics community can contribute toward that vision.
1.1 Background of lung physiology and modeling
The respiratory system is one of the most exposed organ systems of the human body (West, 2012). It has a complex anatomy which can be broadly subdivided into two regions - the upper respiratory tract (URT) and the lower respiratory tract (LRT). The URT comprises the nose, paranasal sinuses, mouth, nasal cavity, pharynx and larynx. The LRT can be further demarcated into the tracheobronchial tree and the alveolar region. The tracheobronchial tree (also called upper or conducting airways) comprises the trachea and the dichotomous bifurcating bronchial structure (see Figures 1a,b), exhibiting self-similar fractal properties. The alveolar region consists of the terminal airways and the alveoli. The bronchial network, along with the alveolar region, is commonly referred to as the lung. The alveolar region is sometimes also termed the deep lung due to its terminal location (West, 2012; Weibel et al., 1963). Pertinent information on lung anatomy is summarized in Table 1.
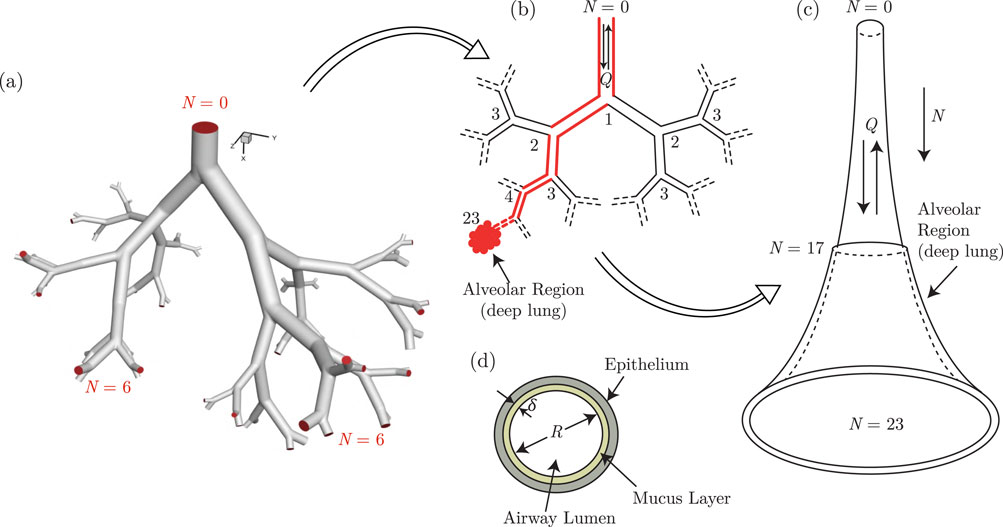
Figure 1. Illustration of the development of the trumpet model from an anatomical dichotomous branching network of the lower respiratory tract (LRT). (a) A typical branching network of the LRT is shown in the form of a model geometry up to the sixth generation (Ghorui et al., 2024) and the corresponding schematic representation is shown in (b) The red colored pathway highlights a single continuous link of the airway network connecting the extremities. The single continuous link, when lumped considering all branches of each generation, results in a single continuous channel of variable cross-sectional area. This is referred to as the trumpet model (c) The respiratory mucus lining the respiratory tract, as considered in the trumpet model, is shown in (d) Parts of this figure are reproduced with permission from (Ghorui et al., 2024; Chakravarty et al., 2022; Chakravarty et al., 2023).
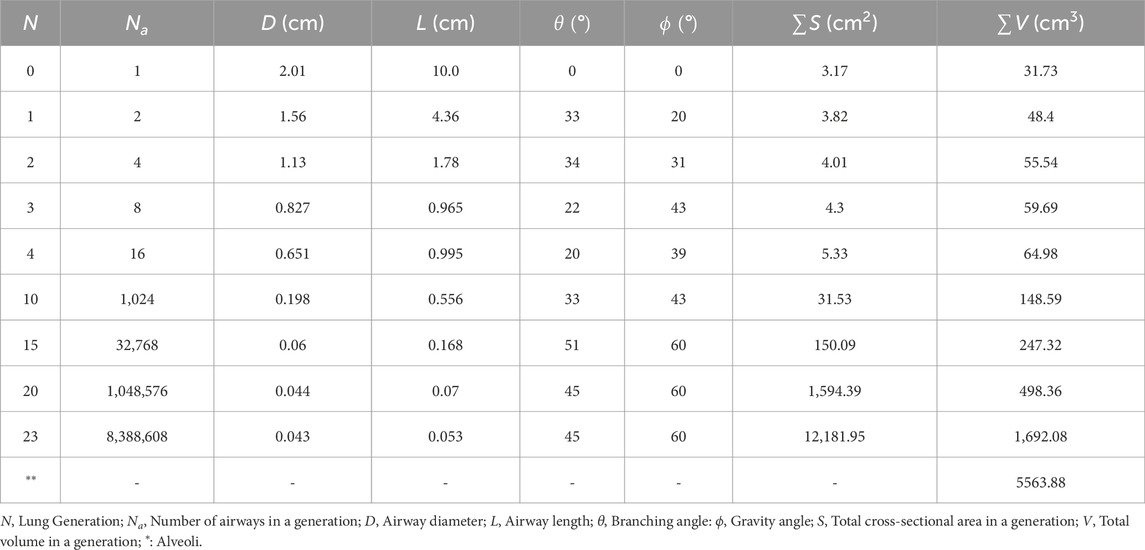
Table 1. Anatomical parameters for representative lung generations Yeh and Schum (1980).
The large surface area of the lung enables easier respiration through a mechanism which draws in ambient air during inhalation and releases expired air during exhalation. However, it also makes the pulmonary system (and in turn, other internal organs of the body) vulnerable to health hazards from polluting particles and infected droplets, among others, which may enter the respiratory tract during inhalation along with the ambient air. Air, along with suspended particles and droplets, is inhaled into the respiratory tract through the URT, which are transported deeper into the LRT through the conducting airways to reach the deep lung (Pedley, 1977). Gas exchange with the blood stream takes place in the deep lung. The reverse happens during exhalation. While some of the inhaled particles/droplets may get exhaled out, a considerable fraction of these may get deposited in the airway and alveoli as a result of various forces acting on them (Hofmann, 2011). Their deposition takes place in the respiratory mucosa - a thin layer of mucosal fluid that separates the airway lumen from the epithelial tissue (Mauroy et al., 2011; Karamaoun et al., 2018; Chakravarty et al., 2022). The thickness of the mucosal layer is
A large body of literature exists detailing the extensive investigations that have been carried out on gas exchange dynamics as well as particle/droplet transport and deposition within the respiratory tract (Pedley, 1977; Hofmann, 2011; Guha, 2008; Kleinstreuer and Zhang, 2010). Nonetheless, certain aspects - such as the dynamics of viral respiratory infections - still require further investigations (Neelakantan et al., 2022). Infected virus-laden droplets are the main source for transmission of viral respiratory infections such as SARS-CoV-2 (Wiersinga et al., 2020; Harrison et al., 2020; Mittal et al., 2020; Wang et al., 2021; Leung, 2021). These droplets are formed within the respiratory tract of an infected individual (Abkarian et al., 2020; Darquenne et al., 2022a; Morawska et al., 2022) and are subsequently exhaled out during breathing, coughing, sneezing, talking, etc. This leads to formation of turbulent clouds of air containing suspended virus-loaded droplets (Bourouiba, 2021). These droplets may be inhaled by other individuals causing the inhaled droplets to deposit in the respiratory mucosa releasing the entrained viruses and starting an infection in the new subject (Wiersinga et al., 2020; Grant et al., 2021). A complete spectrum of respiratory virus transmission, thus, includes the following components: a) droplet formation from infected respiratory mucosa inside the respiratory tract, b) external transmission of infected droplets through respiratory motions and the effect of preventive measures (such as masks) on such transmission, and c) internal transmission of the inhaled infected droplets within the respiratory tract. A thorough understanding of all of these components is, as such, required in order to fully comprehend the fluid dynamics of respiratory virus transmission.
Extensive studies have been carried out on external transmission of droplets (Abkarian and Stone, 2020; Bourouiba, 2021), especially since the beginning of the SARS-CoV-2 pandemic. These studies have analysed different physical settings with respect to transmission mechanisms, environmental factors, and physical configurations with a focus on identifying the risk of infection spread and possible preventive measures (Pal et al., 2023; Biswas et al., 2022). While there has been evidence of increased number of aerosols exhaled during SARS-CoV-2 infection (Edwards et al., 2021), relatively fewer studies have dealt with droplet formation from respiratory mucosa inside the respiratory tract (Hamed et al., 2020; Pairetti et al., 2021; Anzai et al., 2022; Haslbeck et al., 2010; Kant et al., 2023; Morawska et al., 2022; Saha et al., 2024). These droplets, once formed, may then be exhaled out or internally transmitted within the respiratory tract (Chakravarty et al., 2023; Anzai et al., 2022). Understanding the mechanism of formation of these droplets from respiratory mucosa is critical to identifying the conditions which aid droplet formation and hence, increase the risk of infection transmission - externally as well as internally. Internal transmission of infected droplets within the respiratory tract is also hypothesized to be a plausible mechanism by which a viral infection may spread to the inner regions of the respiratory tract, including the alveolar region (deep lung), where it may cause serious diseases such as pneumonia, acute respiratory distress syndrome etc. (Grant et al., 2021).
As discussed previously, many studies have been carried out on internal droplet transmission and deposition in the respiratory tract. These include analytical, computational as well as limited experimental studies (in vivo, in vitro as well as ex vitro) (Morawska et al., 2022). However, there are not many studies that have taken into account mucosal flow dynamics coupled with pathogen-specific effects, along with internal droplet transmission, while distinguishing between various types of infections and their spread (Quirouette et al., 2020). While discrete studies (experimental as well as computational) on mucus dynamics and infection kinetics are available (Baccam et al., 2006; Mauroy et al., 2011; Banerji et al., 2023; Looney et al., 2011; Ravi et al., 2025), the coupled effects need to be investigated to fully characterize the underlying phenomena. Experimental investigations of such coupled phenomena is prohibitively difficult due to various reasons (Morawska et al., 2022) necessitating reliance on computational studies. This perspective focuses specifically on this aspect–fluid dynamics of internal droplet transmission within the respiratory tract in addition to gas exchange, coupled with mucus flow dynamics and pathogen-specific effects. One dimensional (1D) models are surveyed due to their ease of use and efficacy in providing useful clinically relevant mechanistic insights.
Different computational techniques have been used in the past to model droplet transport and deposition in the respiratory tract (Hofmann, 2011; Guha, 2008; Koullapis et al., 2019; Neelakantan et al., 2022). Geometrical complexity of the respiratory tract, however, makes it difficult (if not impossible) to carry out high-resolution computational analyses considering the complete lung geometry. High-resolution investigations have, therefore, been carried out separately targeting specific truncated regions of the respiratory tract - the upper bronchial region (Koullapis et al, 2016; Basu, 2021), the central conducting airways (Koullapis et al., 2018b; Ghorui et al., 2024) or the terminal alveolar region (Chakravarty et al, 2019; Sznitman, 2013; Fishler et al., 2015) - with appropriate boundary conditions. Some studies have also considered combinations of these regions in their analyses by employing different coupling techniques (Koullapis et al., 2018a; Koullapis et al., 2020; Kuprat et al., 2021; Koullapis et al., 2023). Several studies have also been carried out on droplet transport and deposition in the URT (Basu et al., 2020; Basu, 2021). These studies are useful in modelling geometrical complexities of the respiratory tract (often using high-resolution data obtained from computed-tomography scans (Tawhai et al., 2004)) and provide useful information regarding the local fluid dynamics as well as insights into the mechanism of droplet deposition in the modelled region (Basu et al., 2020; Basu, 2021). Detailed information of droplet transport and deposition for the complete respiratory tract is expensive and difficult using this approach, although some advances has been made in this direction recently through development of computed tomography-based whole lung deposition models (Zhang et al., 2022) and use of self-similar bifurcating units, based on lung fractal geometry Ghorui et al. (2024). Simplified models of the respiratory tract are, therefore, useful when the goal is to capture the key trends of droplet transport and deposition for the complete respiratory tract. In this context, one-path lung models–which considers a single, representative airway path from the trachea to the alveoli–have been utilised. This concept originates from the “Typical Path Lung Model” introduced by Yeh and Schum (1980). Similar one-path models of the lung have been recently utilized for extensively studying flow perturbations through direct numerical simulations (Atzori et al., 2025) as well as for investigation of aerosol flow and deposition through experiments (Möller et al., 2021).
A different class of simplified models are based on morphometry of the respiratory tract (Weibel et al., 1963; Raabe, 1976) and can be broadly classified into semi-empirical regional compartment models and one-dimensional trumpet models (Hofmann, 2011). While these simplified models cannot account for the effects of heterogeneity in the lung, these are extremely useful for understanding the fundamental mechanisms and capturing key trends of aerosol transport and deposition for the whole lung. The compartment models assume that the lung morphology is comprised of four different compartments - extrathoracic, bronchial, bronchiolar, and alveolar regions (Hofmann, 2011; Neelakantan et al., 2022) Separate mathematical models have been developed for each of these compartments, based on analogy with an equivalent electrical circuit, in order to obtain the gas transport and exchange characteristics (Nunn, 1957; Ben-Tal, 2006). Different semi-empirical models are utilised, along with the gas transport models, for determining the deposition of inhaled aerosols within the compartments (Hofmann, 2011) This technique provides an estimate of the compartment-wise deposition of aerosols.
The trumpet model, on the other hand, is a 1D approximation of the anatomical dichotomous branching network of the complete respiratory tract (Paiva, 1973; Darquenne and Paiva, 1994; Choi and Kim, 2007; Devi et al., 2016; Chakravarty et al., 2022; 2023). This technique considers the respiratory tract to be a continuous channel of variable cross-sectional area (see Figure 1c). The length and cross-sectional area of the approximated channel are determined using different empirical correlations based on airway generation number
where
where
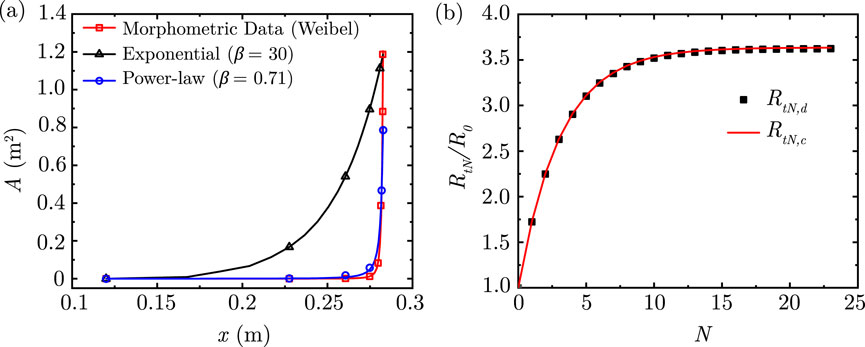
Figure 2. (a) Comparison of area variation in the lung along its length considering the exponential and power-law models with the morphometric data of Weibel (Weibel et al., 1963) (b) Comparison of airway resistance to airflow
This perspective starts with airway fluid dynamics based on 1D assumptions. It is followed by the transport equations for gas exchange, particle/droplet transport, deposition and clearance and finally, pathogen-specific effects. The goal is to consolidate key insights obtainable from 1D models because of which it has remained a useful model to draw mechanistic insights into lung physiology.
2 Airway fluid dynamics
2.1 Airflow
In order to develop the airflow transport equations, it is necessary to a priori examine the nature of airflow within the lung and make reasonable assumptions. Scaling based on relevant physiological parameters shows that Reynolds number
The pulsatile nature of breathing introduces unsteadiness to airflow in the upper airways. This allows the use of the Womersley number
The 1D transport equations for airflow dynamics are summarized next and the corresponding analysis is presented using the above approximations (also detailed in the subsequent sections). It is to be noted that while the balance equations for mass and momentum are fundamental to modeling lung airflow dynamics, the corresponding energy and entropy balances are typically not invoked. This is because temperature variations during normal respiration are small, viscous dissipation is negligible, and thermal nonequilibrium effects are minimal Pedley (1977), West (2012), Karamaoun et al. (2018) In addition, while some degree of phase change exists in the first few generations Karamaoun et al. (2018), it’s effect on airflow and particle deposition is not significant. Consequently, energy and entropy transport do not exert a meaningful influence on airflow or particle deposition.
2.1.1 1D unsteady airflow
The 1D transport equation for airflow in the idealized lung geometry can be expressed using Equations 3, 4 as
Mass transport:
Momentum transport:
where
2.1.2 1D steady state airflow
As noted earlier, the quasi-steady laminar nature of airflow through the lung also makes it possible to neglect the inertia terms in Equation 4 resulting in
Thus, the airflow in the lung is largely determined by a balance between the pressure gradient and the viscous resistance. This simplification makes it possible to estimate the resistance to airflow in the entire lung. Assuming that the lung has a symmetric branching structure (see Figure 1), then there are
Since. airflow through the branches is similar to flow through parallel channels (Popel, 1980; Soni et al., 2020), the total resistance for the Nth generation
Using Equation 1, this can be further reduced to
where,
Alternatively, the total airway resistance can also be determined by integrating the resistance per unit length over the entire length of the airway. Using Equation 1, the total airway length up to the
which gives us
Using Equations 7, 10, 11, the total airway resistance up to the end of the Nth generation
where
The two solutions obtained by Equations 9, 12 are compared in Figure 2b for physiologically relevant values of
2.2 Gas exchange
Along with airflow dynamics, it is essential to study the mechanism of transport and exchange of various constituent gases (of air) in the lung since breathing induces spatio-temporal variations in gas concentration within the lung (Hasler et al., 2019; Tsuda et al., 2008). The 1D transport equation for gases in the idealized lung geometry (see Figure 1) is expressed as
where
where
Steady and unsteady solutions to Equation 13 are provided in Sections 2.2.1, 2.2.2, respectively. Fluid motion and hence, gas transport during breathing is inherently unsteady with a time-periodic nature (Chakravarty et al., 2019) - it takes more than 10 breathing cycles (normal breathing cycle
2.2.1 1D steady-state gas exchange: a reference solution
The following assumptions are made while solving Equation 13 using the steady-state approach: a) all parameters are time-invariant, b) airflow within the lung geometry remains uniform and unidirectional, c) gas concentration at the entrance to the trachea
Considering these assumptions, Equation 13 simplifies to
which is solved analytically for two scenarios and numerically for a particular case. The analytic solutions are discussed first, followed by the numerical solution.
2.2.1.1 1D analytical solution: exponential variation
The total cross-sectional area
where
where
The magnitude of
2.2.1.2 1D analytical solution: power-law variation
An alternate approach for a better fit is to approximate the length
Since the length and area variation is assumed to be a function of
using
where,
The major governing parameters in Equation 20 are the Peclet number for gases
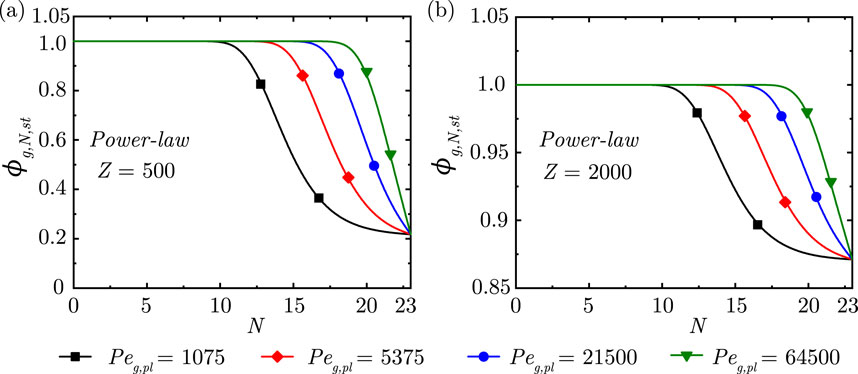
Figure 3. Change in steady-state dimensionless gas concentration
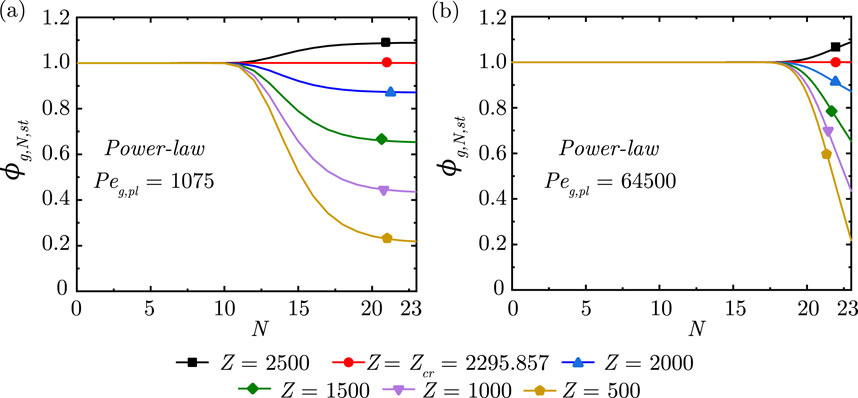
Figure 4. Change in steady-state dimensionless gas concentration
It is observed from Figure 3 that, as expected, the gas concentration front propagates deeper into the lung with increase in
The impact of
2.2.1.3 1D numerical solution
The theoretical solutions discussed in the preceding sections considered steady-state transport of gases within the lung for unidirectional air flow. Physiologically, air flow and hence, transport of gases is unsteady and bi-directional with periodic flow reversals depending on the breathing frequency. A numerical method is necessary to obtain an unsteady solution of gas transport equation (Equation 13). The following scaling parameters (Equation 21) are used to reduce Equation 13 to an appropriate dimensionless form (Equation 22) using the power-law assumption (Equation 1).
where,
where
Figure 5 shows the progression of
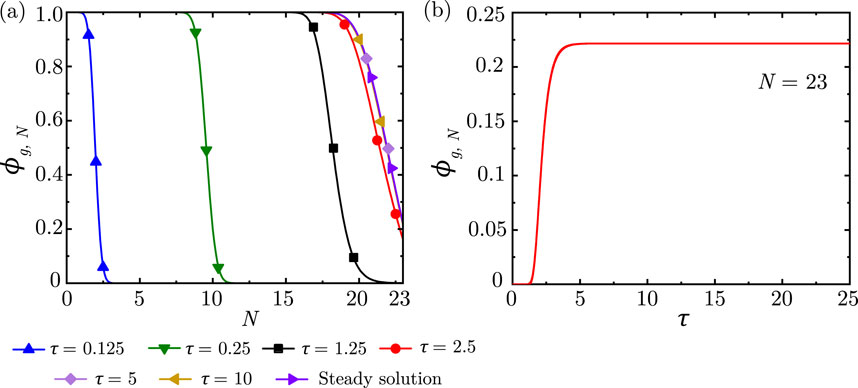
Figure 5. (a)
2.2.2 1D unsteady gas exchange
Physiologically realistic airflow in the lung is unsteady and bi-directional in natural breathing (quiet tidal breathing) as well as forced breathing (such as during exercise, coughing, or mechanical ventilation) (Deepa et al., 2025). For general insights, the numerical model (Equation 22) can be used to study gas transport within the lung considering physiologically relevant airflow variation during breathing by modeling it as a sinusoidal function i.e.,
The wash-in curve (Supplementary Figure S2) obtained using the numerical model is similar to that reported in previous studies (Wang et al., 2013). It is observed that the wash-in curve reaches a time-periodic state after a few breathing cycles
The nature of the wash-in/wash-out curve is also observed to depend on
The wash-in/wash-out curve is observed to qualitatively change at small
2.3 Particle transport and deposition
Transport of particles within the lung is fundamentally similar to transport of gases in the lung. Here, the term particle is used to denote solid particles as well as liquid droplets/aerosols. The one-dimensional transport equation for particles at any location in the idealised lung geometry can be expressed in a similar manner as that for gases (Equation 13) as follows (Chakravarty et al., 2022; Chakravarty et al., 2023; Choi and Kim, 2007; Taulbee and Yu, 1975; Mitsakou et al., 2005; Darquenne and Paiva, 1994) -
where,
A major physiological difference exists between the gas and particle transport mechanisms. While the gas molecules are exchanged between the blood stream and the lung in the alveoli, inhaled particles/droplets are deposited in the airway mucus throughout the lung. Therefore, the gas exchange term in Equation 13 is replaced by a deposition term
Equation 25 can be expressed in terms of lung generation number
where,
where,
The dimensionless equation is expressed as (Chakravarty et al., 2022; Chakravarty et al., 2023)
where,
Different empirical models available in the literature have been used to estimate
Diffusional deposition in the airways:
Sedimentation deposition in the airways:
where,
Impact deposition in the airways:
Diffusional deposition in the alveoli:
where,
Sedimentation deposition in the alveoli
where,
The transport equations (Equations 25 and 28, along with Equations 29–38) are formulated based on the assumption that the particle suspension is dilute and that the particles are mono-dispersed, do not undergo coagulation, and are decoupled from airflow in the lung (Kleinstreuer and Zhang, 2010). Based on the inherent physiology, it is also assumed that there is no additional source of particles present within the lung, and the inhaled particles are either deposited in the airway mucus or washed out of the airways. The developed mathematical model has been validated against in vivo experimental data of Heyder et al. (1986) for different inhaled, mono-dispersed particle sizes [see Chakravarty et al. (2022) for details]. This justifies the assumptions made in formulating the model.
Figure 6a illustrates the transport of particles within the lung airways in a particular breathing cycle. Once inhaled, the particles are carried along with the airflow inwards into the lung during the inhalation phase of the breathing cycle. The particle concentration
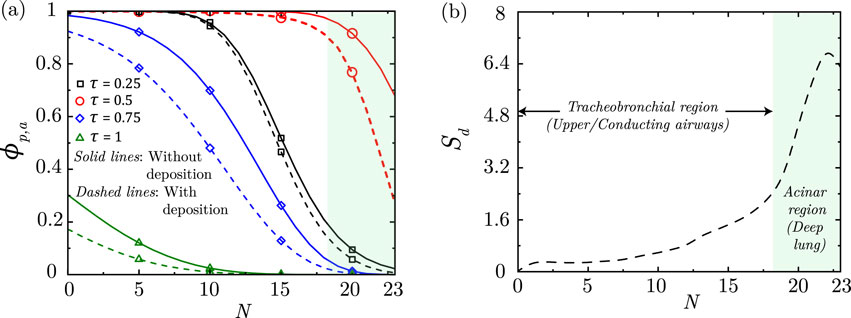
Figure 6. (a) Dimensionless particle concentration
As discussed, the inhaled particles may also get deposited in the airway mucus while being transported within the lung. As a result of deposition, the net
Particles are observed to deposit in the deep lung only when
A longer breathing time period (lower
The above discussed results are also consistent with the observations of various experimental studies on the effects of inhalation flow rate, particle size and inhalation duration on particle deposition in the lung (Heyder et al., 1986; Kim and Jaques, 2004). Further, the applicability of specific model hypotheses and observations from this study can be experimentally verified in the future (with suitable model augmentations, if required) through focused experiments that have been made possible through experimental advances that can mimic the lung structure and function (Sznitman, 2021; Fishler et al., 2015; Möller et al., 2021; Chen et al., 2025; Kant et al., 2023).
3 Mucus fluid dynamics
3.1 Mucus clearance
The mass and momentum balance equations of the mucus layer within the lung can be written, based on existing literature (Mauroy et al., 2004; Mauroy et al., 2011; Smith et al., 2008; Karamaoun et al., 2018), as
Mass balance:
Momentum balance:
where
where
Similarly, the momentum balance equation (Equation 40) can be converted in terms of lung generation number
where
In the expressions above,
In the expression for
In order to obtain the dimensionless form of Equations 42 and 43, we define the following
where
The dimensionless equations, thus, obtained using the scales defined in Equations 42, 43 can be written as
where
where
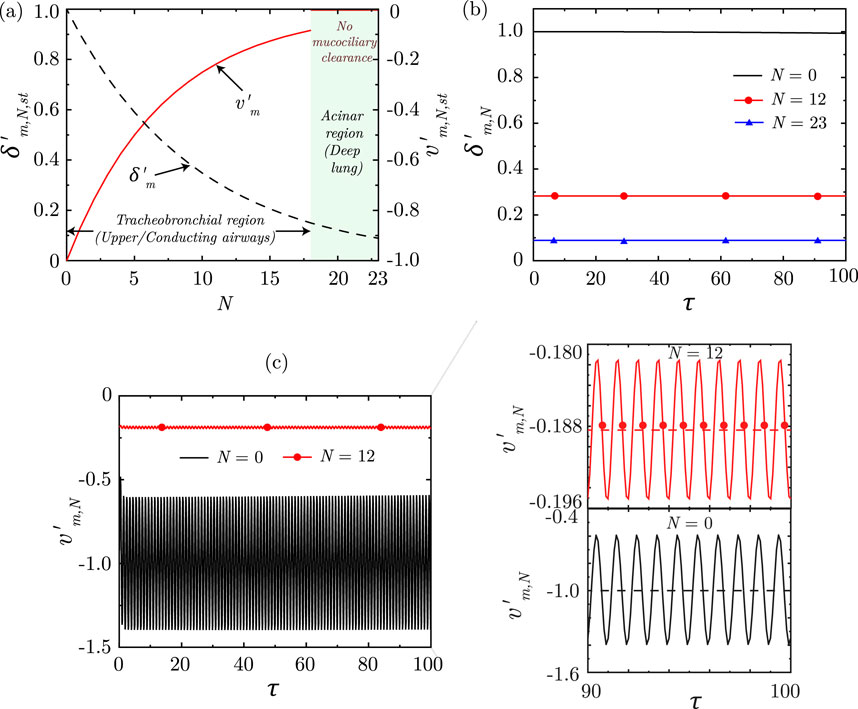
Figure 7. (a) Variation of dimensionless, steady-state magnitudes of mucus layer thickness
Solution of the equations indicate that the dimensionless mucus layer thickness
3.2 Clearance of deposited particles
The one-dimensional transport equation for the particles deposited in the lung mucus, by the various deposition mechanisms (see Section 2.3), is formulated considering mucociliary transport and diffusion of the deposited particles in the mucus. It can be expressed in a similar manner to Equation 25 as follows (Chakravarty et al., 2022; Chakravarty et al., 2023)
where
where
The particles that are inhaled into the lung are deposited in the respiratory mucus during breathing by various mechanisms (see Section 2.3) (Pedley, 1977; Guha, 2008; Kleinstreuer and Zhang, 2010). The deposited particles diffuse in the mucus layer and are also simultaneously transported upstream via mucociliary advection (Cu and Saltzman, 2009). However, mucociliary advection is appreciable only in the conducting airways of the lung
Particles deposited in the conducting airways are transported upstream towards the mouth
4 Pathogen infection dynamics
Pathogens are introduced into the LRT through the carrier particles (or droplets) which are transported in the respiratory tract along with airflow. The carrier particles (or droplets) may be inhaled or formed in-vivo through aerosolization of respiratory mucosa (Chakravarty et al., 2023; Darquenne et al., 2022a). The carrier particles (or droplets) deposit in the mucosa of the LRT (see Section 2.3), thereby, seeding an infection. The deposited particles (or droplets) are also simultaneously cleared through advective-diffusive transport (see Section 3.2). The infection - once seeded - may grow, spread and decay depending on various pathogen-specific parameters and the host’s immune responses. Modeling the dynamics of a pathogen infection within the respiratory tract, thus, requires simultaneous consideration of all the above mechanisms.
4.1 Pathogen transport in mucus
The one-dimensional pathogen transport equation within respiratory mucosa, thus formulated, is represented in its dimensionless form as (Chakravarty et al., 2023)
where
The modified target-cell limited model (Equations 55–57) assumes that the target cells are infected depending on the pathogen-specific infection rate and the local pathogen concentration (see Equation 55). The infected target cells remain in an eclipse phase for a certain duration before becoming infectious (Equation 56) after which they produce new pathogens for a certain time-span before undergoing apoptosis (Equation 57). The corresponding equations are expressed as follows:
where
4.2 Immune response to an infection
A simplified immune response model (Chakravarty et al., 2023), coupled with the infection kinetics model, is utilised to understand the impact of human body’s immune response to pathogen infections in the respiratory tract. The model has been formulated based on available experimentally-validated mathematical frameworks (Dobrovolny et al., 2013; Cao et al., 2015; Quirouette et al., 2020) and considers the effects of interferons, antibodies as well as cytotoxic
4.2.1 Interferon response
Interferons are assumed to affect infection progression by attenuating replication of the pathogens. The pathogen replication rate
where
where
4.2.2 Antibody response
Antibodies act by neutralising the pathogens present in the body. The pathogen clearance rate (
where
where
4.2.3
The cytotoxic
where
where
4.3 Infection progression
The pathogen transport model (Sections 4.1, 4.2) coupled with the particle transport and deposition model (Section 2.3) have been utilised to study the dynamics and progression of a SARS-CoV-2 infection in a human LRT (Chakravarty et al., 2023). The predictions of this model has been observed to appreciably predict viral load dynamics available from patient data (Néant et al., 2021; Wang et al., 2020), highlighting the potential future clinical utility of this mathematical model. It is assumed during this analysis that pathogen-loaded droplets are present in the naso-pharyngeal region of the respiratory tract. These droplets may be a combination of droplets inhaled from the environment (which have not deposited in the upper respiratory tract) and those formed due to aerosolization of nasopharyngeal mucosa, and are inhaled into the trachea during breathing. No other source of droplets are considered.
It is observed from the analysis that pathogen (SARS-CoV-2) concentration in mucus
In contrast to pathogens deposited in airways, pathogens deposited in the deep lung
The LRT infection is observed to grow as long as pathogen replication dominates over pathogen clearance. Once clearance becomes stronger, infection starts to recede (
5 Discussion
5.1 Utility and limitations of 1D models
High resolution computational simulations of the complete respiratory tract becomes difficult due to the geometrical complexity of the respiratory tract (Karamaoun et al., 2018; Ghorui et al., 2024). Analyses have shown that the transport phenomena within the respiratory tract has a time-periodic nature which enables 1D approximations with reasonable accuracy (Chakravarty et al., 2019). Simplified 1D computational models would be reasonable when the focus is to capture the key trends of droplet/particle/pathogen transport and deposition for the complete respiratory tract. While such simplified models cannot account for the effects of heterogeneity in the lung, it is a tractable approach and can help understand some of the key trends dependent on the entire respiratory tract (see Sections 2 and 3). Investigation of pulmonary drug delivery using a simplified 1D model (see Sections 2.3 and 3.2) has provided information regarding spatio-temporal drug deposition characteristics throughout the respiratory tract and also suggested ways of enhancing drug delivery efficacy (Chakravarty et al., 2022). The pathogen infection model (see Section 4.1) has been utilised to study the spatio-temporal evolution of SARS-CoV-2 infection in a human respiratory tract and provided useful information on the role played by various physiological and fluid dynamic parameters on infection characteristics (Chakravarty et al., 2023). Similar investigations can be carried out considering other viral infections as well.
It is worthwhile to note that the 1D single trumpet model does not fully resolve complicated flow patterns in the URT or the effect of heterogeneity in the lungs. This limits the use of 1D models in studying the effects of anatomical variability of the lung - multi-path models (Kundu and Panchagnula, 2023; 2025) and high-fidelity 3D simulations (Bartol et al., 2024) prove to be more well-suited in this regard. One workaround is through appropriate consideration of variation in the geometric parameters of reduced-order 1D models. Devi et al. (2016) used this approach in a 1D trumpet model to identify the particle sizes which showed the least inter-subject variability in deposition. In a recent study, Mate-Kole et al. (2024) employed machine learning techniques to enhance uncertainty quantification and sensitivity analysis in the ICRP model for inhaled radionuclides. A second approach could be through modelling of a network of dichotomously branched heterogeneous lung by approximating each branch as a 1D tube with similar governing equations as the trumpet model. This is reported before (Hasler et al., 2019; Kundu and Panchagnula, 2023) and also summarized in Section 5.3.3, below.
5.2 Dimensionless numbers determining lung function
Dimensionless numbers give an understanding of the dominant physics in the governing equations and therefore, the lung function. This is evident from the equations and results summarized in this article in the previous sections. Table 2 summarizes the dimensionless numbers that govern the various lung functions - airflow, gas exchange, particle deposition and clearance, and infection dynamics - and their typical physiological magnitudes. The magnitude of infection dynamics parameters listed are relevant for a typical SARS-CoV-2 infection (Chakravarty et al., 2022) and are subject to variations while modeling other respiratory infections. These dimensionless numbers listed in Table 2 could form the basis of constructing a virtual disease landscape discussed in Section 6 below.
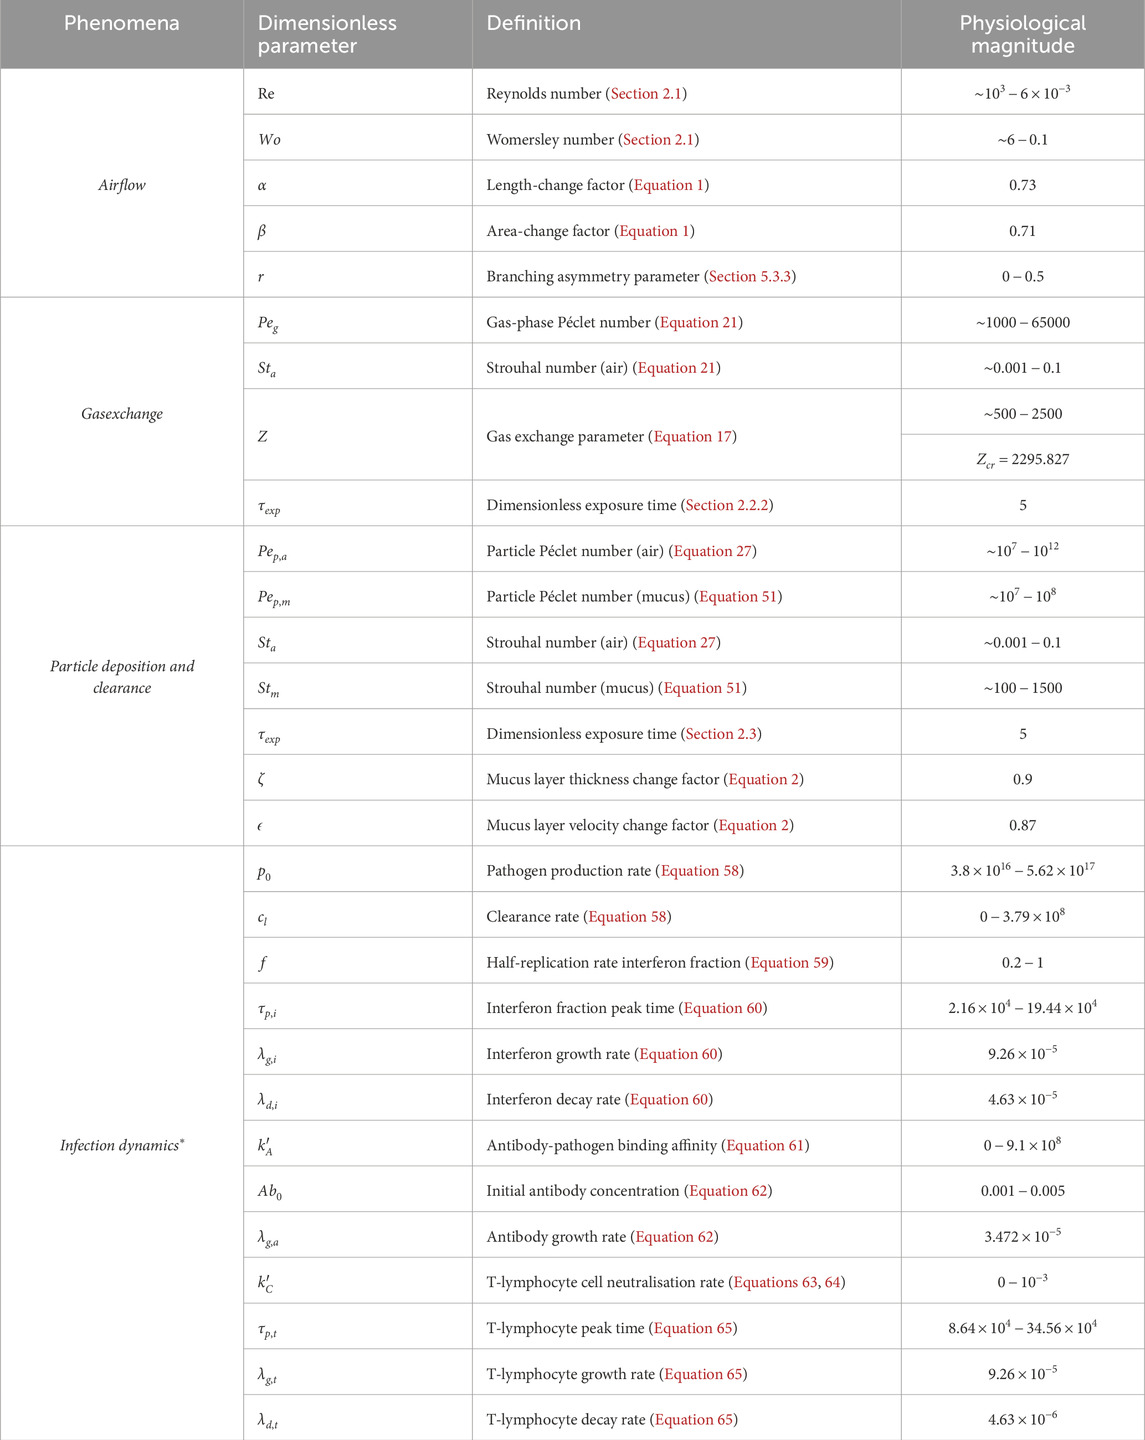
Table 2. Non-dimensional numbers and their physiological magnitudes encountered during airflow, gas exchange, particle deposition and clearance, and infections in the respiratory tract. These numbers are defined in the respective sections of this article. *The magnitudes corresponding to infection dynamics are relevant for a typical SARS-CoV-2 infection.
5.3 Optimal branching of the lung
One of the questions of interest is whether the lung morphology has developed to be optimal for certain function(s). And if so how would deviations from standard morphology potentially lead to pathologies? The primary function of the lung is gas exchange. Thus, its morphology might be optimal for air flow and/or gas exchange. The former has been reported in literature (see Section 5.3.1 below) and some insights on the latter are also discussed below (see Section 5.3.2). Asymmetry of the branching structure of the lung may also affect optimality (see Section 5.3.3).
While particle deposition and clearance in the lung has been extensively studied, more research is needed to determine whether the lung morphology is optimal to minimize particle deposition from inhaled air and to maximize particle removal via mucus clearance - necessary actions from the perspective of disease prevention. We note that particle deposition is different from gas exchange, although the governing equations are similar (see Sections 2.3 and 1). This is because, particles are not absorbed easily into the bloodstream like, say, oxygen because they are much bigger in size. Instead, particles deposit in the mucosal layer and mucus clearance transports the particles out of the lung.
5.3.1 Optimization based on air flow
There are at least two ways to investigate whether the lung morphology is optimal to minimize resistance to air flow. The first approach involves an analysis where the total length and volume of different dichotomous trees being compared are held fixed. Then
A second alternate approach is to fix the dimensions of the
The dimensionless ratio,
Maximizing
5.3.2 Optimization based on gas exchange
Optimization of lung structure for gas exchange is another consideration (Sapoval et al., 2002). Similar to the second approach for flow resistance-based optimization, one can optimize the resistance to the impalement of gas into the deep lung. To that end, consider the total resistance
where
5.3.3 Asymmetry and optimality
Although the aforementioned optimality results assumed symmetric branching, those results may be regarded to be relevant in the “average” sense. An important feature of airway branching structure is also its asymmetry. While a majority of human airway models have assumed a simplified morphology of the lung by considering symmetric bifurcations (Weibel et al., 1963), careful analysis of morphometric measurements have shown that the bifurcations are in fact asymmetrical in nature (Raabe, 1976). Surprisingly, there lies a consistency in the degree of asymmetry across all generations, although it varies from species to species (Majumdar et al., 2005). Studies on investigating the optimal degree of asymmetry have led to interesting results (Miguel, 2016; 2022; Florens et al., 2011; Mauroy et al., 2004; Kundu and Panchagnula, 2023). Mauroy et al. (2004) have shown that a mechanically optimal lung is vulnerable to broncho-constriction. Florens et al. (2011) showed how oxygenation times start decreasing sharply as the degree of asymmetry is increased beyond a critical point.
Through deterministic asymmetric multi-path models of the bronchial trees, Kundu and Panchagnula (2023) studied the optimality of the lung as a multi-functional organ. Their findings suggest that the number of terminal bronchioles, which is correlated to the gas exchange surface area, is maximized at symmetry (branching asymmetry parameter
However, airway structure in the respiratory system is inherently asymmetric. This is necessitated due to the role played by airway asymmetry in particle filtration - the secondary function of the lung. As aerosol-laden air is inhaled, the particles get deposited in the airways through three main physical mechanisms - diffusion, impaction and sedimentation (Chakravarty et al., 2023; Chakravarty et al., 2022; Kundu and Panchagnula, 2023). Kundu and Panchagnula (2023) have shown that for a finitely asymmetric bronchial tree, the particles get maximally deposited in the non-terminal branches of the lung, thereby protecting the deep lung from getting exposed to foreign particles (see Supplementary Figure S11d). The degree of asymmetry which theoretically maximizes this particle filtration efficiency is very close to that measured in human lung (Majumdar et al., 2005).
Thus, although symmetric branchings are the most optimal for maximizing gas exchange surface area, volume occupied and fluid dynamic resistance, asymmetry can maximize particle filtration by enhancing tracheo-bronchial deposition. This shift from mechanical optimality can enhance the protective mechanism of the airways.
5.4 Transition between convection and diffusion dominant regions
The concentration profiles during inhalation (e.g., SupplementaryFigure S1) show that in the upper generations of the lung the gas transport (e.g., of oxygen) is convection dominated. The concentration profile appears almost constant; this is called the “conductive” region of the lung. In the deeper generations, the concentration profile is diffusion dominated. It is characterised by lower concentrations with very small gradients. The concentration profile shows a distinct transition between these two regions. The location of this transition can be theoretically estimated in the limiting case of steady state profile as discussed below.
It follows from Equation 15 that
The last term is the diffusion-like term with an effective diffusion coefficient
The first two terms in Equation 69 are convection-like terms. Of these, the term involving
For the profile in the transition region, there will be an inflection point (see Figure 8). Consequently, at the inflection point in the plot of
Substituting relevant expression in Equation 70 and solving for the generation number
Figure 8 shows the change in location of the transition zone (in terms of
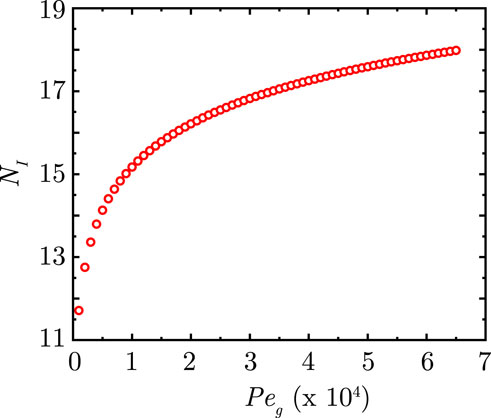
Figure 8. Change in position of the inflection point
Inserting scales in Equation 72, we get that the width
Equation 73 gives an estimate for
5.5 Nitrogen washout
Single or multiple-breadth washout (SBW or MBW) of nitrogen
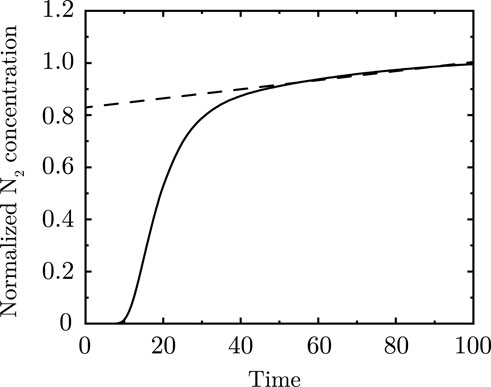
Figure 9. Nitrogen washout curve analytically calculated for two asymmetric branches merging. Dashed line represents the “phase III” slope of the washout curve.
Models with some degree of asymmetric branching are shown to capture the slope of the alveolar plateau (Paiva, 1989; Hasler et al., 2019; Crawford et al., 1985; Engel and Paiva, 1981). This can be understood as follows. During inhalation of pure
Using this transformation, the concentration vs.
5.6 Clinical relevance
The 1D models of droplet and particle transport discussed in this article (Sections 2 and 3) have been utilised to computationally study pulmonary drug delivery and retention (Chakravarty et al., 2022) with major focus on identifying physiological conditions conducive for delivering drugs to the deep lung. This is crucial for achieving systemic drug delivery. Salient results have been discussed in Section 2.3 using Supplementary Figures S6, S7. Drug delivery efficacy to the deep lung is observed to remain highest for
The pathogen transport model (Section 4.1), coupled with the droplet transport (Section 2.3) and immune response models (Section 4.2), can be utilised to study the spatio-temporal progression of infection within the lung. Chakravarty et al. (2023) utilised this model for understanding SARS-CoV-2 spread to the deep lung and proposed a new paradigm for this propagation called Reaerosolisation of Nasopharyngeal Mucosa (RNM). The model predicted that a severe infection (leading to pneumonia) develops within the deep lung within 2.5–7 days of symptom onset, in agreement with clinical findings. It was observed that immune responses, particularly antibodies and T-lymphocytes, play a critical role in preventing a severe infection. This also reinforces the role played by vaccination in managing a severe infection. The analysis also revealed that managing aerosolization of infected nasopharyngeal mucosa can be used as a potential strategy for minimizing infection spread and severity within the lung. These results have been discussed in Section 4.3 utilising Supplementary Figures S8-S10.
6 Outlook
6.1 Improvement of 1D models and disease specific modeling
1D models discussed in this perspective rely on reduced-order forms of various physical mechanisms (such as particle deposition). Similarly, a better understanding of aerosolization within the airways will help develop aerosolization source terms for use in the 1D governing equations. Aerosolization may take place due to mucosal layer bridge formation within small airways in the deep lung (“airway closure mechanism”) (Grotberg, 2011). A second route through shear layer atomization of the mucosal layer during coughing has been reproduced via simulations (Pairetti et al., 2021; Saha et al., 2024) and experiments (Kant et al., 2023). Although mucosal shear flow during normal breathing is stable, increased exhaled aerosol formation during SARS-CoV-2 infection has been reported (Edwards et al., 2021). In addition, shear flows of viscoelastic fluids (such as airway mucus) that are linearly stable have been found to be non-linearly unstable in the presence of large perturbations (Datta et al., 2022). Thus, non-linear stability of the mucosal layer that is driven (and disturbed) by ciliary beating needs further investigation as a potential source of aerosolization.
The need for better aerosolization models is particularly important in the context of SARS-CoV-2 specific modeling since mucosal aerosolization might be significantly enhanced in SARS-CoV-2 patients (Edwards et al., 2021; Pairetti et al., 2021; Morawska et al., 2022; Darquenne et al., 2022a). This requires information on how does SARS-CoV-2 (and other respiratory infections in general) impact mucosal layer viscoelastic properties, and how does that impact the degree of aerosolization within the airways and in the nasopharyngeal region? How would that impact aerosol transport in the airways and would it increase the chances of deep lung infection as seen in SARS-CoV-2 patients? These questions remain unanswered.
Another well-known airborne infection is pulmonary tuberculosis (TB) which continues to be a global menace. Sparse data are available regarding the mechanism underlying the occurrence of TB infection, wherein it is intriguing as to why only 70% of individuals exposed do not get infected, whereas only 30% develop infection (Sharma et al., 2005; Sharma and Mohan, 2017). Thus, careful experiments and fluid dynamics calculations would be important tools to gain these insights.
6.2 Generalization to tree network
Throughout this perspective, the 1D trumpet model is used to represent the entire lung and model different aspects. Several key insights into lung physiology have been reported through the years using this approach. While all aspects of lung physiology may not be captured by a 1D trumpet model for the entire lung (e.g.,
6.3 A virtual disease landscape
In this perspective, the 1D governing equations were presented in terms of non-dimensional numbers. These represent the fundamental parameters or metrics on which lung physiology would depend. Consequently, normal or pathological patient groups should occupy different regions in this parameter space defining a virtual disease landscape (VDL). The existence of a VDL was shown for esophageal function in one of our groups (Patankar) (Halder et al., 2022) and should be explored in the future for the lungs. The non-dimensional numbers defining the VDL could be utilised as a systematic set of metrics or physiomarkers for disease classification and diagnosis, as was shown for esophageal diseases (Zhao et al., 2023). This can help get mechanistic insights into pathologies. Disease progression could be tracked on the VDL, which coupled with machine learning techniques could be a powerful tool to predict future trajectory of diseases. Finally, the changes in physics-based parameters could be associated with biochemical alteration in the lungs. This connection between functional parameters space to the biochemical space can provide deeper insights into pathogenesis.
6.4 Hybrid diagnostics tools
Measuring the non-dimensional numbers on a patient specific basis to define the “mechanical health” of the lungs in the VDL remains a biomechanics challenge in clinical diagnostics. Reduced-order 1D models coupled with physiologic data from diagnostic tools and machine learning techniques could help measure the physiomarkers (e.g., non-dimensional numbers) for disease classification and diagnosis (Halder et al., 2021; Halder et al., 2022; Halder et al., 2023). This technology could potentially help personalize patient care and treatment planning. Improved and suitably generalized 1D modeling could be an important tool in developing novel physics-machine-learning-clinical-data-based hybrid platforms that could be deployed at point-of-care.
Data availability statement
The original contributions presented in the study are included in the article/Supplementary Material, further inquiries can be directed to the corresponding author.
Author contributions
AC: Formal Analysis, Methodology, Writing – original draft, Writing – review and editing, Software, Conceptualization. DK: Methodology, Writing – review and editing, Software. MP: Formal Analysis, Conceptualization, Writing – review and editing, Methodology. AM: Conceptualization, Writing – review and editing. NP: Formal Analysis, Writing – original draft, Conceptualization, Writing – review and editing, Methodology.
Funding
The author(s) declare that financial support was received for the research and/or publication of this article. The study was partially funded by Sri Balaji Arogya Vara Prasadini (SBAVP) scheme of Sri Venkateswara Institute of Medical Sciences, Tirupati, Tirumala Tirupati Devasthanams, Tirupati (Grant No. Faculty/ERPW/28/2016-17). DK would like to acknowledge the Prime Minister’s Research Fellows (PMRF) scheme, Ministry of Education, Government of India (project no. SB21221950 AMPMRF008445) for providing fellowship.
Conflict of interest
The authors declare that the research was conducted in the absence of any commercial or financial relationships that could be construed as a potential conflict of interest.
Generative AI statement
The author(s) declare that no Generative AI was used in the creation of this manuscript.
Any alternative text (alt text) provided alongside figures in this article has been generated by Frontiers with the support of artificial intelligence and reasonable efforts have been made to ensure accuracy, including review by the authors wherever possible. If you identify any issues, please contact us.
Publisher’s note
All claims expressed in this article are solely those of the authors and do not necessarily represent those of their affiliated organizations, or those of the publisher, the editors and the reviewers. Any product that may be evaluated in this article, or claim that may be made by its manufacturer, is not guaranteed or endorsed by the publisher.
Supplementary material
The Supplementary Material for this article can be found online at: https://www.frontiersin.org/articles/10.3389/fphys.2025.1635983/full#supplementary-material
References
Abkarian M., Stone H. (2020). Stretching and break-up of saliva filaments during speech: a route for pathogen aerosolization and its potential mitigation. Phys. Rev. Fluids 5, 102301. doi:10.1103/physrevfluids.5.102301
Abkarian M., Mendez S., Xue N., Yang F., Stone H. A. (2020). Speech can produce jet-like transport relevant to asymptomatic spreading of virus. Proc. Natl. Acad. Sci. 117, 25237–25245. doi:10.1073/pnas.2012156117
Anzai H., Shindo Y., Kohata Y., Hasegawa M., Takana H., Matsunaga T., et al. (2022). Coupled discrete phase model and eulerian wall film model for numerical simulation of respiratory droplet generation during coughing. Sci. Rep. 12, 14849. doi:10.1038/s41598-022-18788-3
Atzori M., Gallorini E., Cottini C., Benassi A., Quadrio M. (2025). Direct numerical simulations of inhalation in a 23-generation lung model. arXiv Prepr. arXiv:2506.14729. doi:10.48550/arXiv.2506.14729
Baccam P., Beauchemin C., Macken C. A., Hayden F. G., Perelson A. S. (2006). Kinetics of influenza a virus infection in humans. J. virology 80, 7590–7599. doi:10.1128/JVI.01623-05
Banerji R., Grifno G. N., Shi L., Smolen D., LeBourdais R., Muhvich J., et al. (2023). Crystal ribcage: a platform for probing real-time lung function at cellular resolution. Nat. methods 20, 1790–1801. doi:10.1038/s41592-023-02004-9
Bartol I. R., Graffigna Palomba M. S., Tano M. E., Dewji S. A. (2024). Computational multiphysics modeling of radioactive aerosol deposition in diverse human respiratory tract geometries. Commun. Eng. 3, 152. doi:10.1038/s44172-024-00296-z
Basu S. (2021). Computational characterization of inhaled droplet transport to the nasopharynx. Sci. Rep. 11, 1–13. doi:10.1038/s41598-021-85765-7
Basu S., Holbrook L. T., Kudlaty K., Fasanmade O., Wu J., Burke A., et al. (2020). Numerical evaluation of spray position for improved nasal drug delivery. Sci. Rep. 10, 10568–18. doi:10.1038/s41598-020-66716-0
Basu S., Akash M. M. H., Hochberg N. S., Senior B. A., Joseph-McCarthy D., Chakravarty A. (2022). From sars-cov-2 infection to covid-19 morbidity: an in silico projection of virion flow rates to the lower airway via nasopharyngeal fluid boluses. Rhinol. Online 5, 10–18. doi:10.4193/rhinol/21.053
Ben-Tal A. (2006). Simplified models for gas exchange in the human lungs. J. Theor. Biol. 238, 474–495. doi:10.1016/j.jtbi.2005.06.005
Biswas R., Pal A., Pal R., Sarkar S., Mukhopadhyay A. (2022). Risk assessment of covid infection by respiratory droplets from cough for various ventilation scenarios inside an elevator: an openfoam-based computational fluid dynamics analysis. Phys. Fluids 34, 013318. doi:10.1063/5.0073694
Bourouiba L. (2021). The fluid dynamics of disease transmission. Annu. Rev. Fluid Mech. 53, 473–508. doi:10.1146/annurev-fluid-060220-113712
Cao P., Yan A. W., Heffernan J. M., Petrie S., Moss R. G., Carolan L. A., et al. (2015). Innate immunity and the inter-exposure interval determine the dynamics of secondary influenza virus infection and explain observed viral hierarchies. PLoS Comput. Biol. 11, e1004334. doi:10.1371/journal.pcbi.1004334
Chakravarty A., Patankar N. A., Panchagnula M. V. (2019). Aerosol transport in a breathing alveolus. Phys. Fluids 31, 121901. doi:10.1063/1.5127787
Chakravarty A., Panchagnula M. V., Mohan A., Patankar N. A. (2022). Pulmonary drug delivery and retention: a computational study to identify plausible parameters based on a coupled airway-mucus flow model. PLOS Comput. Biol. 18, e1010143. doi:10.1371/journal.pcbi.1010143
Chakravarty A., Panchagnula M. V., Patankar N. (2023). Inhalation of virus-loaded droplets as a clinically plausible pathway to deep lung infection. Front. Physiology 14, 1073165. doi:10.3389/fphys.2023.1073165
Chen A., Wessler T., Daftari K., Hinton K., Boucher R. C., Pickles R., et al. (2022). Modeling insights into sars-cov-2 respiratory tract infections prior to immune protection. Biophysical J. 121, 1619–1631. doi:10.1016/j.bpj.2022.04.003
Chen L., Yousaf M., Xu J., Ma X., Zhou X., Li G., et al. (2025). Ultrafine particles deposition in human respiratory tract: experimental measurement and modeling. Ecotoxicol. Environ. Saf. 295, 118123. doi:10.1016/j.ecoenv.2025.118123
Choi J.-I., Kim C. S. (2007). Mathematical analysis of particle deposition in human lungs: an improved single path transport model. Inhal. Toxicol. 19, 925–939. doi:10.1080/08958370701513014
Crawford A., Makowska M., Paiva M., Engel L. (1985). Convection-and diffusion-dependent ventilation maldistribution in normal subjects. J. Appl. Physiology 59, 838–846. doi:10.1152/jappl.1985.59.3.838
Cu Y., Saltzman W. M. (2009). Mathematical modeling of molecular diffusion through mucus. Adv. drug Deliv. Rev. 61, 101–114. doi:10.1016/j.addr.2008.09.006
Darquenne C., Paiva M. (1994). One-dimensional simulation of aerosol transport and deposition in the human lung. J. Appl. Physiology 77, 2889–2898. doi:10.1152/jappl.1994.77.6.2889
Darquenne C., Borojeni A. A., Colebank M. J., Forest M. G., Madas B. G., Tawhai M., et al. (2022a). Aerosol transport modeling: the key link between lung infections of individuals and populations. Front. Physiology 13, 923945. doi:10.3389/fphys.2022.923945
Darquenne C., Theilmann R. J., Fine J. M., Verbanck S. A. (2022b). Nitrogen-based lung clearance index: a valid physiological biomarker for the clinic. J. Appl. Physiology 132, 1290–1296. doi:10.1152/japplphysiol.00511.2021
Datta S. S., Ardekani A. M., Arratia P. E., Beris A. N., Bischofberger I., McKinley G. H., et al. (2022). Perspectives on viscoelastic flow instabilities and elastic turbulence. Phys. Rev. fluids 7, 080701. doi:10.1103/physrevfluids.7.080701
Deepa M., Vidhyapriya R., Raagul A. (2025). A novel breath pattern model and analysis to minimize patient discomfort in medical ventilators. Sci. Rep. 15, 2075. doi:10.1038/s41598-025-86187-5
Devi S. K., Panchagnula M. V., Alladi M. (2016). Designing aerosol size distribution to minimize inter-subject variability of alveolar deposition. J. Aerosol Sci. 101, 144–155. doi:10.1016/j.jaerosci.2016.08.005
Dobrovolny H. M., Reddy M. B., Kamal M. A., Rayner C. R., Beauchemin C. A. (2013). Assessing mathematical models of influenza infections using features of the immune response. PloS one 8, e57088. doi:10.1371/journal.pone.0057088
Edwards D. A., Ausiello D., Salzman J., Devlin T., Langer R., Beddingfield B. J., et al. (2021). Exhaled aerosol increases with COVID-19 infection, age, and obesity. Proc. Natl. Acad. Sci. 118, e2021830118. doi:10.1073/pnas.2021830118
Engel L., Paiva M. (1981). Analyses of sequential filling and emptying of the lung. Respir. Physiol. 45, 309–321. doi:10.1016/0034-5687(81)90014-1
Fishler R., Hofemeier P., Etzion Y., Dubowski Y., Sznitman J. (2015). Particle dynamics and deposition in true-scale pulmonary acinar models. Sci. Rep. 5, 14071. doi:10.1038/srep14071
Florens M., Sapoval B., Filoche M. (2011). Optimal branching asymmetry of hydrodynamic pulsatile trees. Phys. Rev. Lett. 106, 178104. doi:10.1103/PhysRevLett.106.178104
Foster W., Langenback E., Bergofsky E. (1980). Measurement of tracheal and bronchial mucus velocities in man: relation to lung clearance. J. Appl. Physiology 48, 965–971. doi:10.1152/jappl.1980.48.6.965
Ghorui S., Kundu D., Chakravarty A., Panchagnula M. V. (2024). The impact of asymmetric branching on particle deposition in conducting airways. Int. J. Multiph. Flow 179, 104935. doi:10.1016/j.ijmultiphaseflow.2024.104935
Grant R. A., Morales-Nebreda L., Markov N. S., Swaminathan S., Querrey M., Guzman E. R., et al. (2021). Circuits between infected macrophages and T cells in SARS-CoV-2 pneumonia. Nature 590, 635–641. doi:10.1038/s41586-020-03148-w
Guha A. (2008). Transport and deposition of particles in turbulent and laminar flow. Annu. Rev. Fluid Mech. 40, 311–341. doi:10.1146/annurev.fluid.40.111406.102220
Hagman K., Hedenstierna M., Gille-Johnson P., Hammas B., Grabbe M., Dillner J., et al. (2020). Sars-cov-2 rna in serum as predictor of severe outcome in covid-19: a retrospective cohort study. Clin. Infect. Dis. 2020, 1285. doi:10.1093/cid/ciaa1285
Halder S., Acharya S., Kou W., Kahrilas P. J., Pandolfino J. E., Patankar N. A. (2021). Mechanics informed fluoroscopy of esophageal transport. Biomechanics Model. Mechanobiol. 20, 925–940. doi:10.1007/s10237-021-01420-0
Halder S., Yamasaki J., Acharya S., Kou W., Elisha G., Carlson D. A., et al. (2022). Virtual disease landscape using mechanics-informed machine learning: application to esophageal disorders. Artif. Intell. Med. 134, 102435. doi:10.1016/j.artmed.2022.102435
Halder S., Johnson E. M., Yamasaki J., Kahrilas P. J., Markl M., Pandolfino J. E., et al. (2023). Mri-mech: mechanics-informed mri to estimate esophageal health. Front. Physiology 14, 1195067. doi:10.3389/fphys.2023.1195067
Hamed R., Schenck D. M., Fiegel J. (2020). Surface rheological properties alter aerosol formation from mucus mimetic surfaces. Soft Matter 16, 7823–7834. doi:10.1039/d0sm01232g
Harrison A. G., Lin T., Wang P. (2020). Mechanisms of sars-cov-2 transmission and pathogenesis. Trends Immunol. 41, 1100–1115. doi:10.1016/j.it.2020.10.004
Haslbeck K., Schwarz K., Hohlfeld J. M., Seume J. R., Koch W. (2010). Submicron droplet formation in the human lung. J. aerosol Sci. 41, 429–438. doi:10.1016/j.jaerosci.2010.02.010
Hasler D., Anagnostopoulou P., Nyilas S., Latzin P., Schittny J., Obrist D. (2019). A multi-scale model of gas transport in the lung to study heterogeneous lung ventilation during the multiple-breath washout test. PLoS Comput. Biol. 15, e1007079. doi:10.1371/journal.pcbi.1007079
He S., Gui J., Xiong K., Chen M., Gao H., Fu Y. (2022). A roadmap to pulmonary delivery strategies for the treatment of infectious lung diseases. J. nanobiotechnology 20, 101. doi:10.1186/s12951-022-01307-x
Heyder J., Gebhart J., Rudolf G., Schiller C. F., Stahlhofen W. (1986). Deposition of particles in the human respiratory tract in the size range 0.005-15 μm. J. aerosol Sci. 17, 811–825. doi:10.1016/0021-8502(86)90035-2
Hofmann W. (2011). Modelling inhaled particle deposition in the human Lung—A review. J. Aerosol Sci. 42, 693–724. doi:10.1016/j.jaerosci.2011.05.007
Kant P., Pairetti C., Saade Y., Popinet S., Zaleski S., Lohse D. (2023). Bag-mediated film atomization in a cough machine. Phys. Rev. Fluids 8, 074802. doi:10.1103/physrevfluids.8.074802
Karamaoun C., Sobac B., Mauroy B., Van Muylem A., Haut B. (2018). New insights into the mechanisms controlling the bronchial mucus balance. PloS One 13, e0199319. doi:10.1371/journal.pone.0199319
Kassinos S. C., Sznitman J. (2025). Multiscale modeling of respiratory transport phenomena and intersubject variability. Annu. Rev. Fluid Mech. 57, 141–165. doi:10.1146/annurev-fluid-031424-103721
Kim C. S., Jaques P. A. (2004). Analysis of total respiratory deposition of inhaled ultrafine particles in adult subjects at various breathing patterns. Aerosol Sci. Technol. 38, 525–540. doi:10.1080/02786820490465513
Kleinstreuer C., Zhang Z. (2010). Airflow and particle transport in the human respiratory system. Annu. Rev. fluid Mech. 42, 301–334. doi:10.1146/annurev-fluid-121108-145453
Kou J., Chen Y., Zhou X., Lu H., Wu F., Fan J. (2014). Optimal structure of tree-like branching networks for fluid flow. Phys. A 393, 527–534. doi:10.1016/j.physa.2013.08.029
Koullapis P., Kassinos S. C., Bivolarova M. P., Melikov A. K. (2016). Particle deposition in a realistic geometry of the human conducting airways: effects of inlet velocity profile, inhalation flowrate and electrostatic charge. J. biomechanics 49, 2201–2212. doi:10.1016/j.jbiomech.2015.11.029
Koullapis P., Hofemeier P., Sznitman J., Kassinos S. C. (2018a). An efficient computational fluid-particle dynamics method to predict deposition in a simplified approximation of the deep lung. Eur. J. Pharm. Sci. 113, 132–144. doi:10.1016/j.ejps.2017.09.016
Koullapis P., Kassinos S. C., Muela J., Perez-Segarra C., Rigola J., Lehmkuhl O., et al. (2018b). Regional aerosol deposition in the human airways: the siminhale benchmark case and a critical assessment of in silico methods. Eur. J. Pharm. Sci. 113, 77–94. doi:10.1016/j.ejps.2017.09.003
Koullapis P., Ollson B., Kassinos S. C., Sznitman J. (2019). Multiscale in silico lung modeling strategies for aerosol inhalation therapy and drug delivery. Curr. Opin. Biomed. Eng. 11, 130–136. doi:10.1016/j.cobme.2019.11.003
Koullapis P., Stylianou F., Sznitman J., Olsson B., Kassinos S. (2020). Towards whole-lung simulations of aerosol deposition: a model of the deep lung. J. Aerosol Sci. 144, 105541. doi:10.1016/j.jaerosci.2020.105541
Krogh A., Lindhard J. (1917). The volume of the dead space in breathing and the mixing of gases in the lungs of man. J. physiology 51, 59–90. doi:10.1113/jphysiol.1917.sp001785
Kundu D., Panchagnula M. V. (2023). Asymmetric lung increases particle filtration by deposition. Sci. Rep. 13, 9040. doi:10.1038/s41598-023-36176-3
Kundu D., Panchagnula M. V. (2025). Stochastic asymmetric bronchial tree models for population-scale variability in dosimetry. J. Aerosol Sci. 189, 106622. doi:10.1016/j.jaerosci.2025.106622
Kuprat A., Jalali M., Jan T., Corley R., Asgharian B., Price O., et al. (2021). Efficient bi-directional coupling of 3d computational fluid-particle dynamics and 1d multiple path particle dosimetry lung models for multiscale modeling of aerosol dosimetry. J. aerosol Sci. 151, 105647. doi:10.1016/j.jaerosci.2020.105647
Kuprat A. P., Price O., Asgharian B., Singh R. K., Colby S., Yugulis K., et al. (2023). Automated bidirectional coupling of multiscale models of aerosol dosimetry: validation with subject-specific deposition data. J. Aerosol Sci. 174, 106233. doi:10.1016/j.jaerosci.2023.106233
Leung N. H. (2021). Transmissibility and transmission of respiratory viruses. Nat. Rev. Microbiol. 19, 528–545. doi:10.1038/s41579-021-00535-6
Looney M. R., Thornton E. E., Sen D., Lamm W. J., Glenny R. W., Krummel M. F. (2011). Stabilized imaging of immune surveillance in the mouse lung. Nat. methods 8, 91–96. doi:10.1038/nmeth.1543
Majumdar A., Alencar A. M., Buldyrev S. V., Hantos Z., Lutchen K. R., Stanley H. E., et al. (2005). Relating airway diameter distributions to regular branching asymmetry in the lung. Phys. Rev. Lett. 95, 168101. doi:10.1103/PhysRevLett.95.168101
Mate-Kole E. M., Howard S. C., Golden A. P., Dewji S. A. (2024). Machine learning-enhanced stochastic uncertainty and sensitivity analysis of the icrp human respiratory tract model for an inhaled radionuclide. J. Radiological Prot. 44, 041507. doi:10.1088/1361-6498/ad7ec3
Mauroy B., Filoche M., Weibel E., Sapoval B. (2004). An optimal bronchial tree May be dangerous. Nature 427, 633–636. doi:10.1038/nature02287
Mauroy B., Fausser C., Pelca D., Merckx J., Flaud P. (2011). Toward the modeling of mucus draining from the human lung: role of the geometry of the airway tree. Phys. Biol. 8, 056006. doi:10.1088/1478-3975/8/5/056006
Miguel A. F. (2016). Toward an optimal design principle in symmetric and asymmetric tree flow networks. J. Theor. Biol. 389, 101–109. doi:10.1016/j.jtbi.2015.10.027
Miguel A. F. (2022). An assessment of branching asymmetry of the tracheobronchial tree. Sci. Rep. 12, 10145. doi:10.1038/s41598-022-14072-6
Mitsakou C., Helmis C., Housiadas C. (2005). Eulerian modelling of lung deposition with sectional representation of aerosol dynamics. J. Aerosol Sci. 36, 75–94. doi:10.1016/j.jaerosci.2004.08.008
Mittal R., Ni R., Seo J.-H. (2020). The flow physics of COVID-19. J. Fluid Mech. 894, F2. doi:10.1017/jfm.2020.330
Möller G., Bieber M., Gürzing S., Thiebes A. L., Klein S., Cornelissen C. G., et al. (2021). Transparent 23-generation airway model for experimental investigation of aerosol flow and deposition within the human respiratory tract. J. Aerosol Sci. 156, 105782. doi:10.1016/j.jaerosci.2021.105782
Morawska L., Buonanno G., Mikszewski A., Stabile L. (2022). The physics of respiratory particle generation, fate in the air, and inhalation. Nat. Rev. Phys. 4, 723–734. doi:10.1038/s42254-022-00506-7
Napoli N. J., Rodrigues V. R., Davenport P. W. (2022). Characterizing and modeling breathing dynamics: flow rate, rhythm, period, and frequency. Front. Physiology 12, 772295. doi:10.3389/fphys.2021.772295
Néant N., Lingas G., Le Hingrat Q., Ghosn J., Engelmann I., Lepiller Q., et al. (2021). Modeling sars-cov-2 viral kinetics and association with mortality in hospitalized patients from the french covid cohort. Pro. Nat. Academy Sci. 118. e2017962118
Neelakantan S., Xin Y., Gaver D. P., Cereda M., Rizi R., Smith B. J., et al. (2022). Computational lung modelling in respiratory medicine. J. R. Soc. Interface 19, 20220062. doi:10.1098/rsif.2022.0062
Nunn J. (1957). Physiological aspects of artificial ventilation. BJA Br. J. Anaesth. 29, 540–552. doi:10.1093/bja/29.12.540
Otis A. B., Fenn W. O., Rahn H. (1950). Mechanics of breathing in man. J. Appl. physiology 2, 592–607. doi:10.1152/jappl.1950.2.11.592
Pairetti C., Villiers R., Zaleski S. (2021). On shear layer atomization within closed channels: numerical simulations of a cough-replicating experiment. Comput. and Fluids 231, 105125. doi:10.1016/j.compfluid.2021.105125
Paiva M. (1973). Gas transport in the human lung. J. Appl. Physiology 35, 401–410. doi:10.1152/jappl.1973.35.3.401
Paiva M., Engel L. (1981). The anatomical basis for the sloping n2 plateau. Respir. Physiol. 44, 325–337. doi:10.1016/0034-5687(81)90027-x
Paiva M., Lacquet L., van der Linden L. (1976). Gas transport in a model derived from hansen-ampaya anatomical data of the human lung. J. Appl. Physiology 41, 115–119. doi:10.1152/jappl.1976.41.1.115
Pal A., Biswas R., Pal R., Sarkar S., Mukhopadhyay A. (2023). A novel approach to preventing sars-cov-2 transmission in classrooms: a numerical study. Phys. Fluids 35, 013308. doi:10.1063/5.0131672
Pedley T. (1977). Pulmonary fluid dynamics. Annu. Rev. Fluid Mech. 9, 229–274. doi:10.1146/annurev.fl.09.010177.001305
Popel A. S. (1980). A model of pressure and flow distribution in branching networks. J. Appl. Mech. 47, 247–253. doi:10.1115/1.3153650
Pradhan K., Guha A. (2019). Fluid dynamics of oscillatory flow in three-dimensional branching networks. Phys. Fluids 31, 063601. doi:10.1063/1.5093724
Quirouette C., Younis N. P., Reddy M. B., Beauchemin C. A. (2020). A mathematical model describing the localization and spread of influenza A virus infection within the human respiratory tract. PLOS Comput. Biol. 16, e1007705. doi:10.1371/journal.pcbi.1007705
Raabe O. (1976). Tracheobronchial geometry-human, dog, rat, hamster. Lovelace Foundation for Medical Education and Research.
Ravi V. R., Korkmaz F. T., De Ana C. L., Lu L., Shao F.-Z., Odom C. V., et al. (2025). Lung cd4+ resident memory t cells use airway secretory cells to stimulate and regulate onset of allergic airway neutrophilic disease. Cell Rep. 44, 115294. doi:10.1016/j.celrep.2025.115294
Saha S., Manna M. K., Chakravarty A., Sarkar S., Mukhopadhyay A., Sen S. (2024). Insights into the fluid dynamics of bioaerosol formation in a model respiratory tract. Biomicrofluidics 18, 054106. doi:10.1063/5.0219332
Sapoval B., Filoche M., Weibel E. (2002). Smaller is better – but not too small: a physical scale for the design of the mammalian pulmonary acinus. Proc. Natl. Acad. Sci. 99, 10411–10416. doi:10.1073/pnas.122352499
Sharma S. K., Mohan A. (2017). Miliary Tuberculosis. John Wiley Sons, Ltd, 491–513. doi:10.1128/9781555819866.ch29
Sharma S. K., Mohan A., Sharma A., Mitra D. K. (2005). Miliary tuberculosis: new insights into an old disease. Lancet Infect. Dis. 5, 415–430. doi:10.1016/S1473-3099(05)70163-8
Smith D., Gaffney E., Blake J. (2008). Modelling mucociliary clearance. Respir. Physiology and Neurobiol. 163, 178–188. doi:10.1016/j.resp.2008.03.006
Soni B., Miguel A. F., Kumar Nayak A. (2020). A mathematical analysis for constructal design of tree flow networks under unsteady flow. Proc. R. Soc. A 476, 20200377. doi:10.1098/rspa.2020.0377
Sznitman J. (2013). Respiratory microflows in the pulmonary acinus. J. Biomechanics 46, 284–298. doi:10.1016/j.jbiomech.2012.10.028
Sznitman J. (2021). Revisiting airflow and aerosol transport phenomena in the deep lungs with microfluidics. Chem. Rev. 122, 7182–7204. doi:10.1021/acs.chemrev.1c00621
Tan C., Li S., Liang Y., Chen M., Liu J. (2020). SARS-CoV-2 viremia may predict rapid deterioration of COVID-19 patients. Braz. J. Infect. Dis. 24, 565–569. doi:10.1016/j.bjid.2020.08.010
Taulbee D. B., Yu C. (1975). A theory of aerosol deposition in the human respiratory tract. J. Appl. Physiology 38, 77–85. doi:10.1152/jappl.1975.38.1.77
Tawhai M. H., Hunter P., Tschirren J., Reinhardt J., McLennan G., Hoffman E. A. (2004). Ct-based geometry analysis and finite element models of the human and ovine bronchial tree. J. Appl. physiology 97, 2310–2321. doi:10.1152/japplphysiol.00520.2004
Tsuda A., Henry F. S., Butler J. P. (2008). Gas and aerosol mixing in the acinus. Respir. physiology and Neurobiol. 163, 139–149. doi:10.1016/j.resp.2008.02.010
Wang J.-Y., Suddards M., Mellor C., Owers-Bradley J. (2013). Lung function measurement with multiple-breath-helium washout system. Med. Eng. and Phys. 35, 457–469. doi:10.1016/j.medengphy.2012.06.010
Wang S., Pan Y., Wang Q., Miao H., Brown A. N., Rong L. (2020). Modeling the viral dynamics of sars-cov-2 infection. Math. Biosci. 328, 108438. doi:10.1016/j.mbs.2020.108438
Wang C. C., Prather K. A., Sznitman J., Jimenez J. L., Lakdawala S. S., Tufekci Z., et al. (2021). Airborne transmission of respiratory viruses. Science 373, eabd9149. doi:10.1126/science.abd9149
Weibel E., Gomez D. (1962). Architecture of the human lung. Use of quantitative methods establishes fundamental relations between size and number of lung structures. Science 137, 577–585. doi:10.1126/science.137.3530.577
Wiersinga W. J., Rhodes A., Cheng A. C., Peacock S. J., Prescott H. C. (2020). Pathophysiology, transmission, diagnosis, and treatment of coronavirus disease 2019 (COVID-19): a review. JAMA 324, 782–793. doi:10.1001/jama.2020.12839
Yeates D., Aspin N., Levison H., Jones M., Bryan A. (1975). Mucociliary tracheal transport rates in man. J. Appl. physiology 39, 487–495. doi:10.1152/jappl.1975.39.3.487
Yeh H.-C., Schum G. (1980). Models of human lung airways and their application to inhaled particle deposition. Bull. Math. Biol. 42, 461–480. doi:10.1007/BF02460796
Zhang X., Li F., Rajaraman P. K., Choi J., Comellas A. P., Hoffman E. A., et al. (2022). A computed tomography imaging-based subject-specific whole-lung deposition model. Eur. J. Pharm. Sci. 177, 106272. doi:10.1016/j.ejps.2022.106272
Keywords: gas exchange, mucus balance, infection dynamics, trumpet model, aerosol transport and deposition, particle transport and deposition
Citation: Chakravarty A, Kundu D, Panchagnula MV, Mohan A and Patankar NA (2025) Perspectives on physics-based one-dimensional modeling of lung physiology. Front. Physiol. 16:1635983. doi: 10.3389/fphys.2025.1635983
Received: 27 May 2025; Accepted: 28 August 2025;
Published: 24 September 2025.
Edited by:
Alexander V. Glushkov, Odessa National Polytechnic University, UkraineReviewed by:
Josue Sznitman, Technion Israel Institute of Technology, IsraelRohin Banerji, Boston University, United States
Copyright © 2025 Chakravarty, Kundu, Panchagnula, Mohan and Patankar. This is an open-access article distributed under the terms of the Creative Commons Attribution License (CC BY). The use, distribution or reproduction in other forums is permitted, provided the original author(s) and the copyright owner(s) are credited and that the original publication in this journal is cited, in accordance with accepted academic practice. No use, distribution or reproduction is permitted which does not comply with these terms.
*Correspondence: Neelesh A. Patankar, bi1wYXRhbmthckBub3J0aHdlc3Rlcm4uZWR1