 Anne V. Clough
 Pardis Taheri2,3
 Guru P. Sharma
 Elizabeth R. Jacobs
 Said H. Audi
- 1Department of Mathematical and Statistical Sciences, Marquette University, Milwaukee, WI, United States
- 2Joint Department of Biomedical Engineering, Medical College of Wisconsin, Marquette University, Milwaukee, WI, United States
- 3Research Service, Zablocki VA Medical Center, Milwaukee, WI, United States
- 4Department of Radiation Oncology, Medical College of Wisconsin, Milwaukee, WI, United States
- 5Department of Medicine (Cardiology), Feinberg School of Medicine, Northwestern University, Chicago, IL, United States
- 6Department of Medicine (Pulmonary), Medical College of Wisconsin, Milwaukee, WI, United States
Introduction: Exposure of adult rats to hyperoxia is a well-established model of human Acute Respiratory Distress Syndrome (ARDS). Although rats exposed to 100% O2 display clinical evidence of lung injury after ∼40 h and death by 72 h, rats exposed to 60% O2 for up to 7 days show little sign of injury. However, when subsequently exposed to hyperoxia, these pre-exposed rats become more susceptible to ARDS. The objective of this study is to evaluate the ability of imaging biomarkers to track this hyperoxia susceptibility and to elucidate underlying mechanisms.
Methods: Sprague-Dawley rats were exposed to either room air (normoxia), >95% O2 for 24 h (hyperoxia), 60% O2 for 7 days (H-S), or H-S followed by 24 h of hyperoxia (H-S+24). Following i.v. injection of 99mTc-duramycin (marker of cell death) and/or 99mTc-hexamethylpropelyneamine oxime (99mTc-HMPAO, marker of lung tissue redox status), in vivo scintigraphy images were acquired and lung uptake of these biomarkers was determined from the images.
Results: 99mTc-HMPAO uptake was 84% greater in hyperoxic rats compared to normoxic controls. Uptake in H-S rats was 34% higher than normoxics, but with no change with subsequent exposure to hyperoxia (H-S+24). 99mTc-duramycin uptake was 40% greater in hyperoxic rats than normoxics. Uptake in H-S rats was not different from normoxics but increased by 160% with H-S+24 in conjunction with enhanced hyperoxia susceptibility. 99mTc-HMPAO and 99mTc-duramycin uptake correlated with expression of 3-nitrotyrosine (oxidative stress) and cleaved-caspase 3 (cell death) measures acquired independently.
Discussion: Overall, these results suggest the potential utility of 99mTc-HMPAO and 99mTc-duramycin imaging for identifying those hosts that are more, or less, susceptible to progression to severe ARDS at a time of mild symptoms of lung injury.
Introduction
Acute Respiratory Distress Syndrome (ARDS) carries a mortality rate of approximately 40% due to lack of early detection tools, inability to identify patients at risk for progression, and limited therapies (Bellani et al., 2016; Fan et al., 2018; Levitt and Matthay, 2012, Fanelli et al., 2013) It is characterized by rapidly progressing hypoxic respiratory failure caused by direct and indirect sources including sepsis, pneumonia, systemic inflammation, trauma, and severe infections, including those caused by COVID-19 (Fan et al., 2018; Kallet and Matthay, 2013; Levitt and Matthay, 2012). Prior to COVID-19, the annual incidence in the U.S. of severe ARDS was ∼200,000 new cases (Levitt and Matthay, 2012; Ma et al., 2025).
Although high inspired oxygen (FiO2) ventilation, or hyperoxia, is not a common standalone cause of acute respiratory distress syndrome (ARDS), it is an unavoidable intervention in cases of severe ARDS (Fan et al., 2018). While often lifesaving, hyperoxia can itself contribute to lung injury, exacerbating pulmonary damage and increasing ICU mortality (Damiani et al., 2018; Girardis et al., 2016; Kallet and Matthay, 2013; Ligtenberg et al., 2013; Stolmeijer et al., 2013). Clinical studies have shown that liberal oxygen therapy in the ICU is associated with higher mortality among ARDS patients (Girardis et al., 2016; Chu et al., 2018), whereas conservative oxygen strategies are linked to reduced ICU mortality compared to conventional approaches (Girardis et al., 2016). Despite a wealth of cellular and molecular data regarding the pathogenesis of ARDS, the clinical course of patients with mild ARDS is still widely variable even for those with identical risk factors (Ware, 2005; Girardis et al., 2016; Bellani et al., 2016; Daenen et al., 2025). The Lung Injury Prevention Score (LIPS) can be used to identify patients at risk for severe ARDS (Gajic et al., 2011), however it has a low positive-predictive value. For instance, a LIPS cutoff of 4 is recommended as the criterion for implementing enhanced monitoring strategies. However, <7% of patients at that cutoff level actually progress to severe ARDS (Gajic et al., 2011). Individuals at elevated risk for oxygen-induced lung injury may be candidates for interventions such as tolerance of lower blood oxygenation (e.g., 86% saturation threshold), lower Hb thresholds for transfusions (due to the risk of transfusion reactions) or prone positioning. These therapies each carry risks of their own, and thus are not generally applied to all persons with ARDS. Thus, novel clinical means for stratifying the risk of severe ARDS in individual hosts with mild ARDS are needed.
Rat exposure to hyperoxia is a well-established model of human ARDS (Crapo et al., 1980; Kallet and Matthay, 2013). For most animal models, prolonged exposure to a 100% O2 environment is lethal due to acute lung injury (ALI) (Crapo and Tierney, 1974). Furthermore, when adult rats are exposed to 60% O2 for 7 days, they become more susceptible to the lethal effects of hyperoxia, as evidenced by a decrease in their subsequent survival time in 100% O2 (Hayatdavoudi et al., 1981). Conversely, when adult rats are preconditioned by exposure to 100% O2 for 2 days followed by a 24-h “rest period” in room air, they acquire tolerance of the otherwise lethal effects of hyperoxia (Frank et al., 1989; Crapo and Tierney, 1974). These unique models provide a platform for developing an approach to stratifying the risk of developing severe ARDS in animals with mild ARDS, and for elucidating the underlying mechanisms for such risk (Audi S. H. et al., 2012; Frank et al., 1989; Hayatdavoudi et al., 1981).
Oxidative stress, mitochondrial dysfunction, and inflammation are key pathways in the pathogenesis of ARDS, with the pulmonary capillary endothelium a primary and early target (Bannerman and Goldblum, 2003; Reiss, Uhlig, and Uhlig, 2012; Qiu et al., 2011; Xie et al., 2012; Chow et al., 2003; Herrero, Sanchez, and Lorente, 2018; Kellner et al., 2017). The pulmonary capillary endothelium, which has a large surface area and is in close contact with blood-borne compounds, can be targeted in vivo with single-photon emission computed tomography (SPECT) (Audi et al., 2016; Audi et al. 2022a; Audi et al. 2017; Audi S. H. et al., 2012; Clough et al., 2012; Audi et al., 2015). Previously, we demonstrated the utility of in vivo 99mTc-hexamethylpropyleneamine oxime (HMPAO) and 99mTc-duramycin imaging to detect oxidative stress and endothelial cell death, respectively, in rats exposed to hyperoxia (Audi et al., 2016; Audi et al. 2022a; Audi et al. 2017; Audi S. H. et al., 2012; Clough et al., 2012; Audi et al., 2015). Moreover, we recently demonstrated that in vivo 99mTc-HMPAO and 99mTc-duramycin imaging of pre-conditioned rats detects and predicts protection from ARDS when the rats are exposed to hyperoxia (Audi et al., 2022b). The results showed that a pattern of increasing lung uptake of 99mTc-HMPAO and 99mTc-duramycin correlates with advancing oxidative stress and cell death and worsening injury, whereas stable (or decreasing) 99mTc-HMPAO and stable 99mTc-duramycin reflects tolerance of hyperoxia. These outcomes suggest the potential utility of molecular imaging for identifying individual at-risk hosts that are more, or less, susceptible to progressing to more severe ARDS.
The objective of the current study is to evaluate the lung uptake of 99mTc-HMPAO and 99mTc-duramycin in rats with enhanced susceptibility for ARDS, before and after exposure to >95% O2. This will determine whether 99mTc-HMPAO and 99mTc-duramycin track this susceptibility. The activity of key cellular targets in H-S rats is also measured and correlated with injury and functional endpoints associated with ARDS to identify potential mechanisms of susceptibility that are tracked by 99mTc-HMPAO and 99mTc-duramycin.
Materials and methods
Materials
HMPAO (Ceretec®) was purchased in kit form from GE Healthcare (Arlington Heights, IL), and technetium-labeled macroaggregated albumin (99mTc-MAA, particle sizes 20–40 μm) was purchased from Cardinal Health (Wauwatosa, WI). Duramycin (3,035 g/mol MW) kits were prepared as previously described (Audi et al., 2015; Clough et al., 2012). For western blots, antibodies for 3-nitrotyrosine (3-NT) were purchased from Abcam (primary: cat # ab61392) and Thermo Fisher (secondary: cat #31430), for mitochondrial complex I from Sigma-Aldrich (primary: cat # ABN302) and Thermo Fisher (secondary: cat #31430), and for β−actin from Bio-Rad (primary: cat #AHP2417) and Thermo Fisher (secondary: cat #31460). For immunohistochemistry antibodies for cleaved caspase 3 were purchased from Cell Signal Technology (primary cat#9661 and reagent cat #8114).
Rat exposure to hyperoxia with and without preconditioning
All treatment protocols were approved by the Institutional Animal Care and Use Committees of the Clement J. Zablocki Veterans Administration Medical Center, Medical College of Wisconsin, and Marquette University.
For imaging and functional endpoint studies, male adult (10–12 weeks old) Sprague Dawley rats were obtained from Charles River, maintained on a 12 h day-night schedule, including during the study period, and experiments were performed during the day. They were randomized into four groups: 1.) Unconditioned: Rats (362.3 ± 40.1 (SD) g, n = 24) were housed in chambers with room air (normoxic controls). 2.) Unconditioned+24: Weight-matched rats (358.7 ± 23.9 g, n = 24) were housed adjacent to the room-air chambers in exposure chambers with >95% O2 for 24 h (h), as previously described (Audi et al., 2016). 3.) H-S: Another group of weight-matched rats (326.9 ± 24.6 g, n = 18) was housed in exposure chambers with 60% O2 for 7 days. 4.) H-S+24: The final group consisted of a subset of H-S rats (312.7 ± 12.1 g, n = 13) that were subsequently exposed to an additional 24 h of >95% O2. Twenty-four hours of subsequent exposure was chosen because the median time to death (LT50) for H-S rats in >95% O2 is 46 h, compared to 66 h for unconditioned rats (Hayatdavoudi et al., 1981). Since the time- or dose-response necessary to develop susceptibility to hyperoxia is not established in female rats, only male rats were used for this study.
For a randomly-selected subset of each group, the overall health of the rat prior to anesthetizing for the experimental protocols described below, was assigned a body score on a scale of 0–3 using the criteria shown in Table 1.
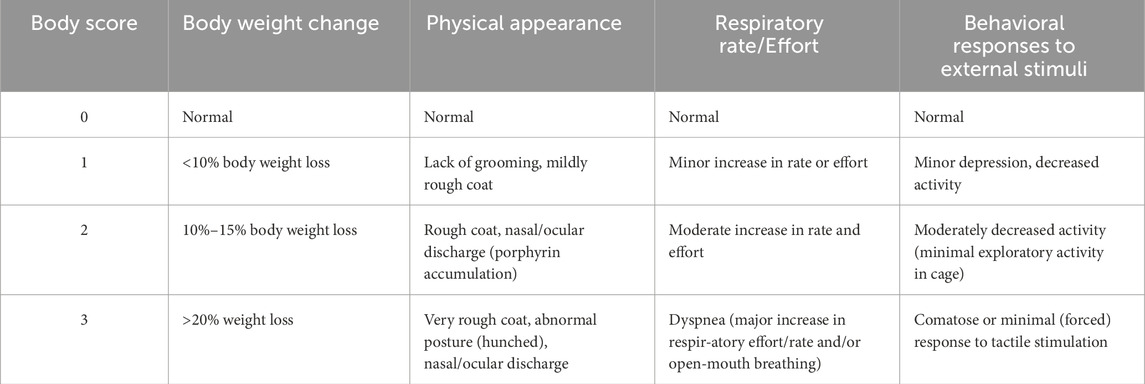
Table 1. Body scoring.
Lung wet-to-dry weight ratio
Heart and lungs were isolated as previously described (Audi et al., 2016). The lungs were then dissected free of the heart, trachea and mainstem bronchi and total lung wet weight was obtained. The left lung lobe was weighed and dried at 60 °C for 72 h for wet-to-dry weight ratio, and the remaining lung lobes were used for histological and western blot studies described below.
Imaging studies
In vivo imaging studies described below were conducted on randomly selected subsets of rats from each group. The number of rats for each group were chosen to achieve a power ≥85% using power analysis (ANOVA power) based on previously published means and standard deviations of the lung uptake of 99mTc-HMPAO and 99mTc-duramycin (Audi et al., 2016; Audi et al., 2017; Audi S. H. et al., 2012; Clough et al., 2012; Audi et al., 2015; Audi et al., 2022b). As a control, in all imaging studies at least one normoxic unconditioned rat was imaged using the same prepared batch of radiopharmaceutical.
99mTc-HMPAO and 99mTc-duramycin were prepared as previously described (Audi et al., 2017; Audi et al., 2015; Clough et al., 2012), Rats were anesthetized (ketamine/xylazine: 80–100 mgkg−1/5–10 mgkg−1, i.p. or isoflurane: 0.5%–3%) and a tail vein was cannulated. The rat was then placed supine on a plexiglass plate (4 mm) positioned directly on the face of a parallel-hole collimator (hole diameter = 2 mm, depth = 25 mm) attached to a modular gamma camera (Radiation Sensors, LLC) for planar imaging (Audi et al., 2015; Audi et al., 2016).
In one set of rats, an injection (37–56 MBq) of 99mTc-HMPAO was administered via the tail vein catheter. 99mTc-HMPAO reaches steady-state in the lung by 20 min post-injection, at which time five 30-s planar images were acquired (Audi et al., 2015; Audi et al., 2016). To investigate the role of the anti-oxidant glutathione (GSH) in the lung retention of 99mTc-HMPAO, a random subset of rats were then treated with the GSH-depleting agent diethyl maleate (DEM, 1 g/kg body wt i.p.) (Audi S. H. et al., 2012). Thirty minutes after DEM treatment and without relocation of the rat, a second injection of 99mTc-HMPAO was made and the animal reimaged 20 min later. This protocol is shown in Figure 1 as Protocol 1.
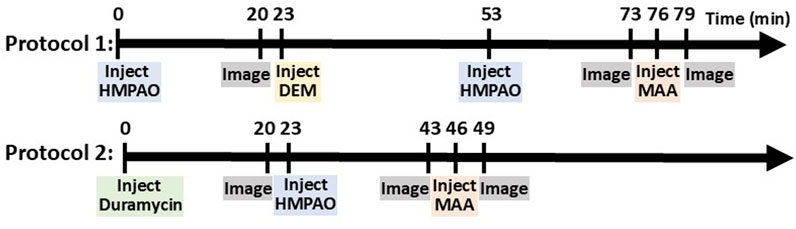
Figure 1. Diagram of imaging protocols showing the sequence of injections and imaging.
In another set of rats, an injection (37–56 MBq) of 99mTc-duramycin was first administered via the venous catheter and images were acquired 20 min post-injection. Subsequently, 99mTc-HMPAO was administered via the same venous catheter and the rats were re-imaged 20 min post-HMPAO injection (Figure 1, Protocol 2).
In all rats, a final injection of 99mTc-MAA (37 MBq) was made via the same venous cannula and the rat reimaged. The 99mTc-MAA injection provided a planar image in which the lung boundaries were clearly identified, since >95% of 99mTc-MAA lodges in the lungs (Clough et al., 2012). After imaging, the rats were euthanized with an overdose of ketamine/xylazine (160–200 mg/kg: 10–20 mg/kg i.p.).
Image analysis
The planar images were analyzed using MATLAB-based software developed in-house. The boundaries of the upper portion of the lungs were identified in the high-sensitivity 99mTc-MAA images and manually outlined to construct a lung region of interest (ROI) free of liver contribution (Audi et al., 2016). The 99mTc-MAA lung ROI mask was then superimposed on the biomarker image (99mTc-HMPAO, 99mTc-duramycin, or 99mTc-HMPAO - 99mTc-duramycin depending on the imaging protocol) yielding a lung biomarker ROI. No registration was required since the animal was maintained in the same location throughout the imaging study. Background regions in the upper forelimbs were also identified in the biomarker image to normalize lung activity for injected biomarker specific activity, dose, and decay (Audi et al., 2016; Audi et al., 2015). Mean counts/sec/pixel/injected dose within both the lung and forelimb-background ROIs were then determined. The ratio of the lung and background ROI signals averaged over the 5 × 30 s time interval, when the biomarker signal within the ROIs had reached steady state, was used as the measure of lung biomarker uptake (Audi et al., 2016; Audi et al., 2015).
Histology
In a randomly selected subset of rats from each group, excised lungs were fixed after inflation in 10% neutral buffered formalin (Fisher Scientific, Pittsburg, PA) and embedded in paraffin. Whole-mount sections of lung were cut (4 μm thick) and stained with hematoxylin and eosin (H&E, Richard Allan, Kalamazoo, MI). Using NDP.view2 (Hamamatsu) to visualize the high-resolution images of the slides, two investigators, masked to the treatment groups, obtained six representative images from pre-selected areas of each lung on each slide, avoiding large vessels or airways. We used a 0–2 scoring system published by Matute-Bello et al. for neutrophil influx, edema, and thickness of the diffusion barrier, cardinal features of ARDS (Table 2) (Matute-Bello et al., 2011). Each image was scored independently by both investigators, and the six image scores per animal were averaged to yield a single score per feature. Inter-observer reliability was high, with intraclass correlation coefficients (ICCs) exceeding 0.95 for all three features. Final scores for each feature in each treatment group were then calculated by averaging the single scores from both investigators on all animals in that group.

Table 2. Lung histology scoring.
Additional lung sections were immunostained with antibody to cleaved caspase 3 (CC3, a marker of caspase activation). Again, using jpeg images and ImageJ software, image thresholding was used to identify CC3-positive cells stained brown. Those cells were then colorized red for enhanced visualization in the images. The number of CC3 positive cells per image was counted by two investigators blinded to the treatment groups (with ICC = 0.91), and then averaged as described above for the histology images.
Western blots
Western blot analysis was carried out as previously described on whole lung tissue homogenate to quantify the expression of 3-nitrotyrosine (3-NT), as an indicator of oxidative stress [for electrophoresis, protein used was 30 μg/lane (Audi et al., 2017)]. For complex I expression, the selected primary antibody recognizes NADH-ubiquinone oxidoreductase protein in complex I (Madhu et al., 2020). The protein is a 75 kDa subunit of complex I that catalyzes electron transfer from NADH. Approximately 50 mg of lung tissue was homogenized in 500 μL of Radio-Immunoprecipitation Assay (RIPA) buffer. After centrifugation for 10 min at 10,000 g to remove debris, supernatants were denatured at 480 °C for 5 min. 30 μg protein/lane were loaded for electrophoresis. The primary complex I antibodies were diluted 1:250 in non-fat dry milk and Tris-buffered saline and Tween (TBST). After electrophoretic separation and washing, matched secondary antibodies were applied, and blots visualized using ECL Plus detection reagent. Complex I blots were cut at 50 kDa. The higher molecular weight band was probed for complex I (75 kDa) and the lower molecular weight band for β-actin (42 kDa). For a given lane and protein, the protein density was estimated by ImageJ software and was normalized to the corresponding density for β-actin (42 kDa). The resulting value is referred to as “relative protein.”
Statistical analysis
Statistical evaluation of data was carried out using GraphPad Prism v. 10.2.3 (Dotmatics Inc., Boston, MA). The level of statistical significance was set at 0.05 for all tests. Group results are expressed as mean ± SEM, unless noted otherwise. One of our primary objectives was to elucidate the differential effect of 24 h of hyperoxia on unconditioned versus preconditioned (H-S) rats. Thus, unless otherwise stated, we evaluated differences between two corresponding groups of rats (e.g., unconditioned vs. unconditioned+24 or H-S vs. H-S+24) using an unpaired two-tailed t-test for data passing the Kolmogorov-Smirnov normality test, or the nonparametric equivalent Mann-Whitney U test when data were not normally distributed.
Results
Body weight, lung wet/dry weight ratios, body score
Table 3 shows that rats exposed to 60% O2 for 7 days (H-S) gained body weight at a rate consistent with that for unconditioned rats (Gan et al., 2011). Unconditioned and H-S rats exposed to hyperoxia (100% O2 for 24 h) had no change in body weight. Exposure to hyperoxia or to H-S resulted in no changes in lung wet weight or wet/dry weight ratio compared to unconditioned (Table 4). Exposure to hyperoxia (H-S+24) following preconditioning (H-S) resulted in increases in both wet weight (43%) and weight/dry weight ratio (13%), and in significantly increased (worsened) body scores compared to H-S.
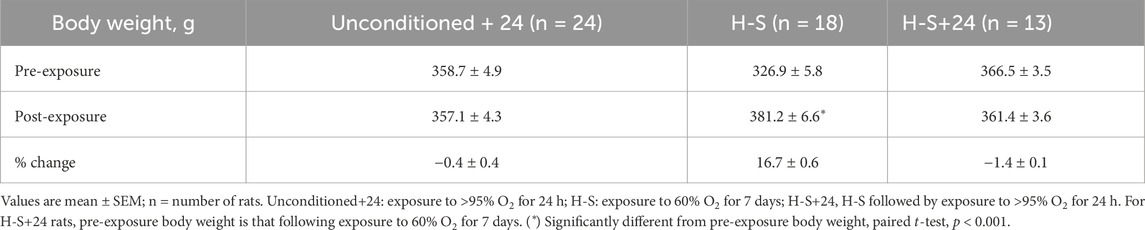
Table 3. Rat body weights.
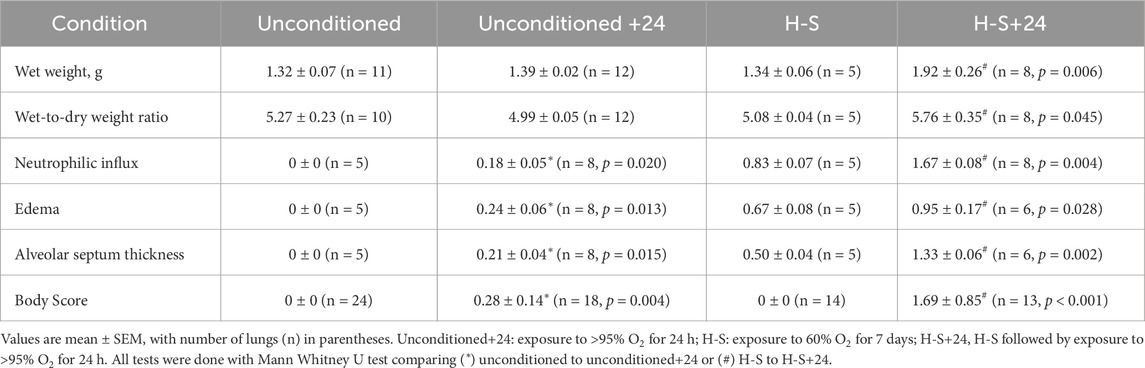
Table 4. Injury endpoints and lung histology scores.
Imaging
Lung uptake of 99mTc-HMPAO and 99mTc-duramycin was quantified from the biomarker images obtained from the four groups of rats. Figure 2 (top) shows lung uptake (the ratio of lung-to-forearm background signal at steady-state) of 99mTc-HMPAO in unconditioned+24 rats was 84% greater than in unconditioned rats. However, 99mTc-HMPAO uptake was not statistically different between the preconditioned (H-S) and preconditioned with subsequent 24 h exposure to hyperoxia (H-S+24).
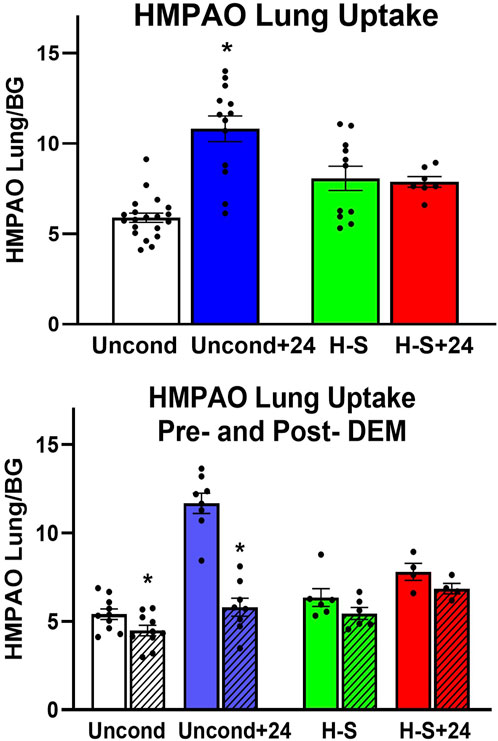
Figure 2. Top: Steady-state lung uptake [lung-to-background (BG) ratio] of 99mTc-HMPAO. Uncond: Unconditioned normoxic controls (n = 20). Uncond+24: exposure to >95% O2 for 24 h (n = 13). H-S: exposure to 60% O2 for 7 days (n = 11). H-S+24: preexposure to H-S followed by exposure to >95% O2 for 24 h (n = 7). (*) Statistical difference between unconditioned and unconditioned +24 h of hyperoxia, unpaired t-test, p < 0.001. Bottom: Steady-state lung uptake of 99mTc-HMPAO pre- (solid bars) and post- (hashed bars) administration of DEM (diethyl maleate) in the same rat. (*) Statistical difference between pre-DEM and post-DEM, paired t-test, p = 0.026 for unconditioned and p < 0.001 for unconditioned + 24 h of hyperoxia. The number of rats for unconditioned, unconditioned+24, H-S, and H-S+24 is n = 10, 8, 6, 4. Values are mean ± SEM.
We investigated the role of GSH in 99mTc-HMPAO lung uptake by imaging a subset of rats before and after treatment with DEM. A paired t-test was used to evaluate differences pre- and post- DEM for a given group. Figure 2 (bottom) shows that DEM treatment resulted in significantly reduced uptake in the unconditioned (15%) and unconditioned+24 (48%) groups, with a 12% but not statistically significant reduction in both the H-S and H-S+24 groups. These reductions are consistent with a role for GSH in the uptake of 99mTc-HMPAO (Audi et al., 2016; Audi et al., 2017; Audi S. H. et al., 2012; Audi et al., 2022b; Clough et al., 2012). The reduction in 99mTc-HMPAO uptake with DEM in unconditioned+24 (48%) was a greater fraction than that of unconditioned rats (15%). These data also indicate that lung uptake of 99mTc-HMPAO in unconditioned+24 after DEM administration (blue hashed bar) was about the same as uptake in the unconditioned prior to DEM (white bar). This observation suggests that most of the increased uptake of 99mTc-HMPAO in response to 24 h of hyperoxia (blue versus white bar) was a result of increased GSH content. Although the changes are smaller when comparing H-S to H-S+24, DEM again resulted in H-S+24 99mTc-HMPAO lung uptake (red hashed bar) about the same as that measured in H-S rats (green bar).
Figure 3 shows the results of 99mTc-duramycin imaging. 99mTc-duramycin uptake in lungs of unconditioned+24 rats was 40% greater than uptake in unconditioned normoxic rats. However, uptake in H-S+24 rats was 160% greater than H-S rats, associated with enhanced hyperoxia susceptibility/sensitivity.
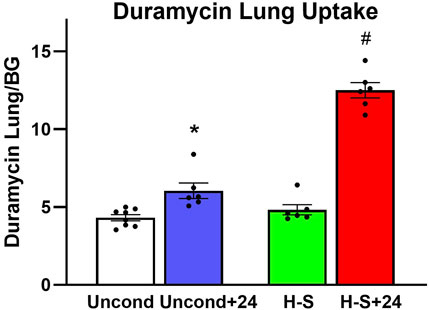
Figure 3. Steady-state lung uptake [lung-to-background (BG) ratio] of 99mTc-duramycin. (*) Statistical difference between unconditioned and unconditioned + 24 h of hyperoxia, unpaired t-test, p = 0.004. (#) Statistical difference between H-S and H-S+24, unpaired t-test, p < 0.001. The number of rats for unconditioned, unconditioned+24, H-S, and H-S+24 is n = 8, 6, 6, 6. Values are mean ± SEM.
Histology
Images of representative lung sections stained with H&E appear in Figure 4. Figure 4A shows the lacy architecture, single-cell alveolar septum thickness and no evidence of neutrophil infiltration or edema, typical of normoxic unconditioned lungs. Figure 4B shows little histological evidence of injury in unconditioned lungs after just 24 h of hyperoxia (unconditioned+24). Figure 4C from a H-S rat lung shows some thickening of the alveolar wall and neutrophil infiltration. Figure 4D from an H-S+24 rat shows significant thickening of the alveolar wall with many inflammatory cells concentrated in the perivascular space, along with proteinaceous material in perivascular and intra-alveolar spaces (non-cellular pink staining). Mean injury scores from the images (Table 4) show small, although statistically significant, differences between lungs from unconditioned versus unconditioned+24 rats. However neutrophil, edema, and alveolar septum thickness injury scores in lungs from H-S+24 rats were all significantly higher than those of H-S rats, and larger than the differences between unconditioned and unconditioned +24 rats.
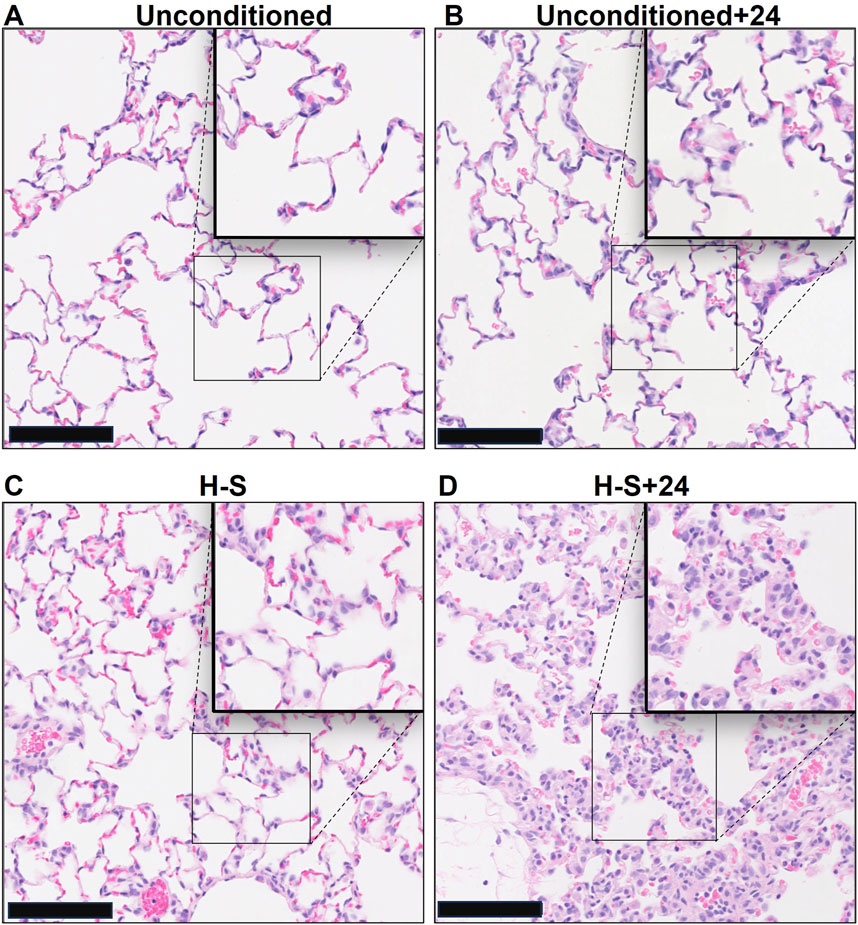
Figure 4. Representative unconditioned (A), unconditioned+24 (B), H-S (C), and H-S+24 (D) rat lung slices stained with hematoxylin and eosin (H&E). Scale bar is 100 microns.
Cleaved caspase 3 (CC3)
Figure 5 shows representative images of lung slices immunostained with antibody to CC3 as a marker of apoptotic cells. Scattered apoptotic cells are visible in unconditioned image (panel A), somewhat larger numbers are evident in unconditioned+24 (B) and H-S conditions (C), and a large number are present in the H-S+24 slice. Figure 6 (left) shows quantification of the number of CC3-positive cells per high-power field. The mean number in the unconditioned+24, H-S, and H-S+24 slices was ∼170%, 200% and 620% higher, respectively, than unconditioned (controls). Also, H-S+24 was 140% higher than H-S, consistent with duramycin imaging (Figure 3), providing additional evidence of hyperoxia sensitivity. Figure 6 (right) demonstrates that there is high correlation between lung uptake of 99mTc-duramycin (Figure 3) and the number of CC3 positive cells (Figure 6, left, colored symbols), and that results are consistent with 99mTc-duramycin imaging and CC3 measures obtained from rats exposed to different hyperoxia injury models (gray circles) (Audi et al., 2022b).
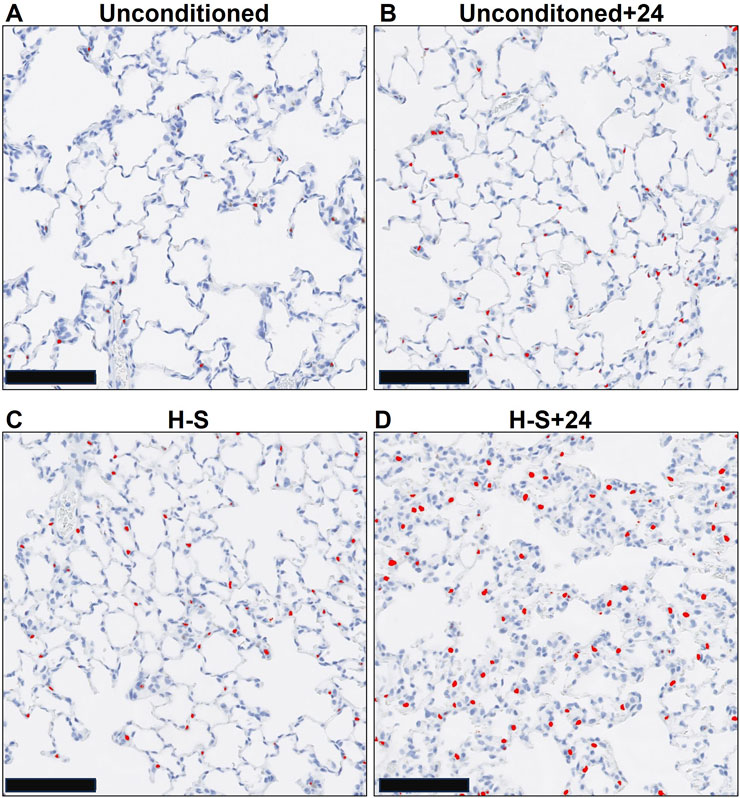
Figure 5. Representative unconditioned (A), unconditioned+24 (B), H-S (C), and H-S+24 (D) rat lung slices stained with antibodies to cleaved caspase 3 (CC3) as a marker of apoptotic cells. CC3-positive cells are colorized red. Scale bar is 100 microns.
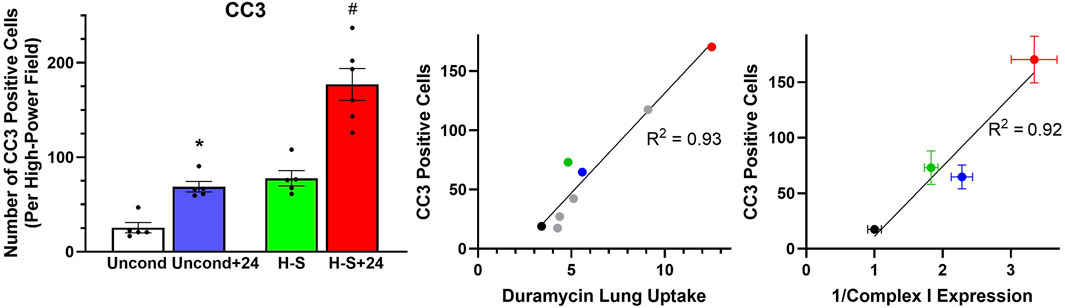
Figure 6. Left: Number of CC3-positive cells per high-power field. (*) Statistical difference between unconditioned and unconditioned + 24 h of hyperoxia, unpaired t-test, p = 0.008. (#) Statistical difference between H-S and H-S+24, Mann Whitney U test, p = 0.001. The number of rats for unconditioned, unconditioned+24, H-S, and H-S+24 is n = 5, 5, 5, 6. Center: Correlation between CC3-positive cells and 99mTc-duramycin lung uptake in unconditioned (black), unconditioned+24 (blue), H-S (green) and H-S+24 (red) rats from this study, as well as other previously published data [gray (Audi et al., 2022b)]. Right: Relationship between CC3-positive cells and the reciprocal of Complex I expression (data in Figure 8 right below) from unconditioned (black), unconditioned+24 (blue), H-S (green) and H-S+24 (red) rat lungs. Values are mean ± SEM.
Western blots
We proceeded to assess the expression of 3-NT, a marker of oxidative injury, in the four groups using western blot analysis, with representative blots shown in Supplementary Figure S1. Quantification results shown in Figure 7 (left) indicate that 3-NT expression is 120% greater in unconditioned+24 lungs compared to unconditioned controls, and 130% greater in H-S+24 lungs than in H-S lungs. Figure 7 (right) shows good correlation between 3-NT expression and lung uptake of 99mTc-HMPAO post DEM administration to deplete glutathione. This graph depicts new data from the current study using the colored symbols, while data from previous studies under different experimental hyperoxic conditions are shown by the gray circles (Audi et al., 2022b).
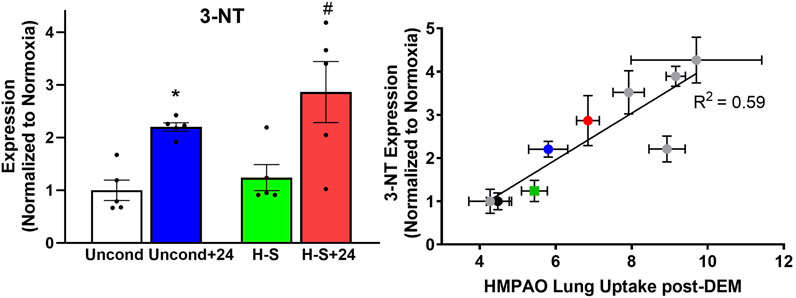
Figure 7. Left: Lung 3-NT protein expression (normalized to expression of β-actin) relative to unconditioned control value. (*) Statistical difference between unconditioned and unconditioned +24 h of hyperoxia, unpaired t-test, p < 0.001. (#) Statistical difference between H-S and H-S+24, unpaired t-test, p = 0.003. n = 5 rats for each group. Right: Correlation between lung 3-NT expression and 99mTc-HMPAO lung uptake following DEM administration in unconditioned (black), unconditioned+24 (blue), H-S (green) and H-S+24 (red) rats from this study, as well as other previously published data (gray) (Audi et al., 2022b). Values are mean ± SEM.
To assess the role of mitochondrial dysfunction in rat susceptibility to hyperoxia, we also evaluated the expression of mitochondrial complex I in lungs using western blots. Figure 8 shows that Complex I expression was 44% lower in unconditioned+24 lungs compared to unconditioned controls. and 45% lower in H-S+24 relative to H-S, which in turn was 70% lower than unconditioned.
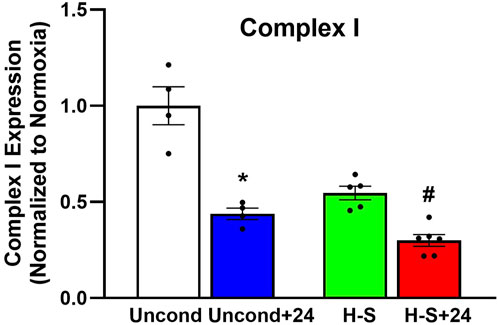
Figure 8. Lung mitochondrial complex I expression (normalized to expression of β-actin) relative to unconditioned control. (*) Statistical difference between unconditioned and unconditioned + 24 h of hyperoxia, Mann-Whitney U test, p = 0.029. (#) Statistical difference between H-S and H-S+24, Mann-Whitney U test, p = 0.004. The number of rats for unconditioned, unconditioned+24, H-S, and H-S+24 is n = 4, 4, 5, 6. Values are mean ± SEM.
Discussion
Consistent with this pre-exposure protocol, our results show that rats exposed to 60% oxygen for 7 days (H-S) become susceptible to hyperoxia-induced lung injury (Hayatdavoudi et al., 1981). This is evidenced by the relatively large increases in lung wet weight, histologic measures of injury, CC3, body scores, and lung tissue expression of 3-NT, after just 24 h of hyperoxia exposure (H-S+24). For these endpoints, the change in signal between H-S and H-S+24 was significantly larger than the change between unconditioned and unconditioned+24. For instance, Table 4 shows that unconditioned rats exhibited relatively small changes in histological markers of lung injury, including neutrophilic influx and edema, after 24 h of hyperoxia. In contrast, H-S rats displayed a larger increase in these markers following the same 24 h exposure period (H-S+24). Previously we showed that hyperoxia-tolerant (H-T) rats displayed smaller increases in lung injury endpoints (including those reported in the present study) than unconditioned rats following exposure to hyperoxia for 60 h (Table 5) (Audi et al., 2022b).
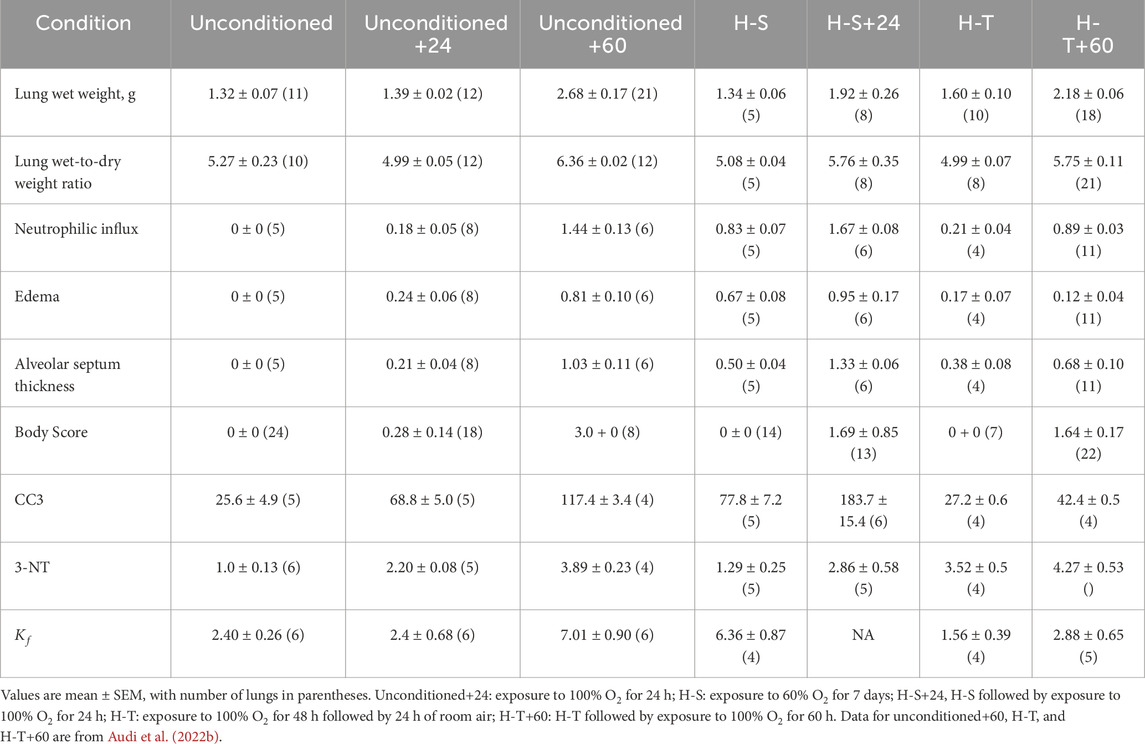
Table 5. Injury endpoints in rat models of hyperoxia.
Imaging results in Figures 2, 3 indicate that susceptibility to hyperoxia is marked by a lack of change in 99mTc-HMPAO uptake and a significant increase in 99mTc-duramycin uptake in lungs of H-S rats exposed to hyperoxia for 24 h (H-S+24). In contrast, unconditioned rats subjected to 24 h of hyperoxia show a substantial increase in 99mTc-HMPAO uptake, along with only a modest increase in 99mTc-duramycin uptake.
Normobaric hyperoxic exposure causes a dose-dependent oxidative injury consistent with ARDS in rats and humans (Fisher and Beers, 2008). Rodent hyperoxia is a good model of human ALI, and is particularly relevant because of the two-hit hypothesis of lung injury (Hoegl et al., 2018). To this point, hyperoxia alone is not a common cause of ARDS, but its use is unavoidable in patients with this condition (Fan et al., 2018).
While lifesaving, ventilation with gases with high fractions of oxygen (FiO2) itself leads to injury amplifying lung damage (Gajic et al., 2011; Chen and Ware, 2015; Santos et al., 2016; Villar et al., 2016; Fisher and Beers, 2008; Kallet and Matthay, 2013; Stolmeijer et al., 2013; Ligtenberg et al., 2013). Rats exposed to hyperoxia develop increased lung wet weights, histological and imaging features of ARDS, including higher edema scores that translate to roentgenographic infiltrates in humans (Table 4), and increased gradients to oxygen exchange (Audi et al., 2016). Pre-exposures or treatments render rats more or less susceptible to lung injury (Frank et al., 1989; Taheri et al., 2024; Audi et al., 2022b; Hayatdavoudi et al., 1981). Thus, our injury model is highly relevant to clinical ARDS, and is optimally suited to testing the potential of lung imaging to reflect either evolving oxidative states and damage or disease regression.
Previously, we demonstrated the ability of 99mTc-HMPAO and 99mTc-duramcyin to track hyperoxia tolerance in a rat model (Audi et al., 2022b). Specifically, we found that hyperoxia-tolerant (H-T) rats exhibited either stable or decreased 99mTc-HMPAO lung uptake in response to 60 h of hyperoxia exposure, while 99mTc-duramycin lung uptake remained unchanged. Conversely, unconditioned rats displayed progressive increases in both 99mTc-HMPAO and 99mTc-duramycin lung uptake over the 60-h exposure (Audi et al., 2022b). These findings alongside those from the current study are depicted in Figure 9, where these distinctive trends are observed in response to hyperoxia. Thus, molecular imaging with these biomarkers at two different time points could be a promising tool to stratify susceptibility of subjects to lung injury (as measured by the non-imaging invasive end points in this study not possible in humans) when exposed to hyperoxia.
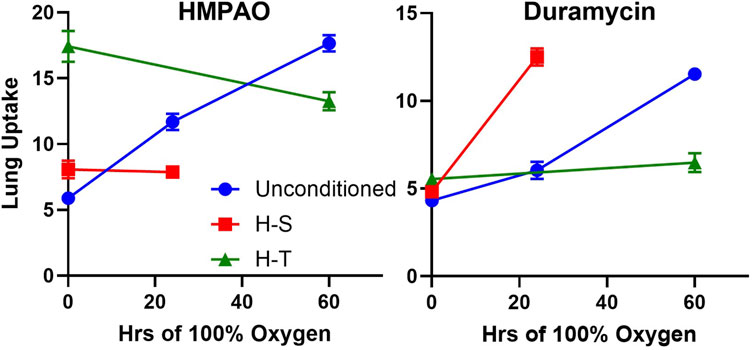
Figure 9. Lung uptake of 99mTc-HMPAO (left) and 99mTc-duramycin (right) in unconditioned (blue circles), H-S (hyperoxia-sensitive, red squares), and H-T (hyperoxia-tolerant, green triangles [Audi et al., 2022b)] exposed to up to 60 h of >95% O2 hyperoxia.
The findings of this study also build upon and extend our previous work, where we demonstrated the utility of 99mTc-HMPAO imaging for early detection of lung injury, even in the absence of clinically significant symptoms, following exposure to hyperoxia or low-dose lipopolysaccharide (LPS) (Audi et al., 2016). That work also showed its capability to track the progression of hyperoxia-induced acute lung injury (ALI) and the reversibility of LPS-induced ALI. Furthermore, we established that both 99mTc-HMPAO and 99mTc-duramycin can detect the protective effects of inhaled hydrogen therapy against hyperoxia-induced ALI (Audi et al., 2017).
99mTc-HMPAO lung uptake
99mTc-HMPAO was originally developed as a brain perfusion agent but its uptake and retention in other tissues has been shown to serve as a marker of tissue redox state (Neirinckx et al., 1988; Jacquier-Sarlin, Polla, and Slosman, 1996). Uptake of its oxidized (lipophilic) form from the circulation is dependent on its rate of diffusion across the plasma membrane (Andersen et al., 1988; Neirinckx et al., 1988; Clough et al., 2019). 99mTc-HMPAO reduction and thus its cellular retention, has been shown to be strongly dependent on the oxidoreductive state of the tissue including intracellular glutathione (GSH) content and other factors involving mitochondrial function (Andersen et al., 1988; Neirinckx et al., 1988; Clough et al., 2019; Audi S. H. et al., 2012).
Previously, we showed that 99mTc-HMPAO lung uptake can be separated into GSH- dependent and independent components by assessing its lung uptake prior and post administration of the GSH depleting agent DEM (Audi et al., 2016; Audi et al., 2017; Audi S. H. et al., 2012; Audi et al., 2022b; Clough et al., 2012). The portion of measured 99mTc-HMPAO uptake that is DEM-insensitive, i.e., GSH-independent, is shown in Figure 2 (bottom) by the hashed bars (post-DEM), while the difference between the solid bars and the hashed bars represents the DEM-sensitive (GSH-dependent) component. The increased 99mTc-HMPAO lung uptake in unconditioned rats following exposure to hyperoxia for 24 h [Figure 2 (top)] reflects the response of those lung cells accessible to 99mTc-HMPAO to hyperoxia-induced oxidative stress. Figure 2 (bottom) shows that most of this increase was GSH-dependent in that following DEM administration unconditioned+24 lung uptake (blue hashed bar) was similar to unconditioned lung uptake (white bar). This is consistent with the ability of lung cells of unconditioned rats to respond to oxidative stress by increasing their antioxidant capacity, and with results from a previous study that showed that exposure of unconditioned rats to hyperoxia for 24 h increased lung GSH tissue content by ∼17% (Audi et al., 2016).
For H-S rats, Figure 2 (top) shows that there was no significant change in 99mTc-HMPAO lung uptake following exposure to hyperoxia for 24 h, and that lung uptake of 99mTc-HMPAO in both H-S and HS+24 rats was predominantly DEM-insensitive. These results are consistent with the lack of response from lung cells accessible to 99mTc-HMPAO in both H-S and H-S+24 rats to oxidative stress, including change in their antioxidant capacity. This may contribute to the hyperoxia susceptibility of H-S rats. Previously we reported an increase (∼19%) in lung tissue GSH content of H-S rats compared to that in unconditioned rats (Audi S. H. et al., 2012), which as stated above, could be in cells not accessible to 99mTc-HMPAO.
In our previous work investigating hyperoxia tolerance, we reported much higher 99mTc-HMPAO lung uptake in H-T rats than in unconditioned rats, with most of the increase being DEM-sensitive (Audi et al., 2022b). We also reported ∼44% higher GSH content in lung tissue of H-T versus unconditioned rats (Audi et al., 2022b; Audi S. H. et al., 2012). These results are consistent with a higher antioxidant capacity in lung cells accessible to 99mTc-HMPAO in lungs of H-T compared to unconditioned rats. Taken together, these studies provide strong evidence that rat tolerance or susceptibility to hyperoxia ALI is associated with its antioxidant capacity and/or the ability of the organism to rapidly increase its lung antioxidant enzymes in response to hyperoxia exposure as measured by the DEM-sensitive fraction of 99mTc-HMPAO lung uptake.
Results from this study shown in Figure 2 (bottom) indicate that the DEM-insensitive (GSH-independent) component of 99mTc-HMPAO lung uptake was unchanged following hyperoxia exposure in both the unconditioned (white hashed vs. blue hashed bars) and H-S rats (green hashed versus red hashed bars). Previous studies have suggested several GSH-independent factors that could contribute to 99mTc-HMPAO tissue retention, including vascular permeability, mitochondrial dysfunction, and endothelial amine metabolism dysfunction (Ahn et al., 1994; Gardner et al., 2008; Kuo, Yang, and Chen, 2005; Shih et al., 1991; Suga et al., 1994; Audi et al., 2022b; Taheri et al., 2024). We have previously demonstrated that exposure of unconditioned rats to hyperoxia for 24 h had no effect on the pulmonary vascular endothelium filtration coefficient (Kf) (Audi et al., 2016), which is consistent with the histological edema score in the present study (Table 4), and suggests that increased vascular permeability is not a strong contributor to the increased DEM-insensitive 99mTc-HMPAO tissue retention reported here.
Figure 7 right shows correlation between 3-NT expression, a marker of oxidative stress induced by reactive nitrogen species, and the DEM-insensitive component of 99mTc-HMPAO lung uptake. Furthermore, Figure 10 shows that changes in the DEM-insensitive portion of 99mTc-HMPAO uptake (left) in unconditioned, H-S, and H-T rats in response to hyperoxia exposure mirror the corresponding changes in lung tissue 3-NT expression (right).
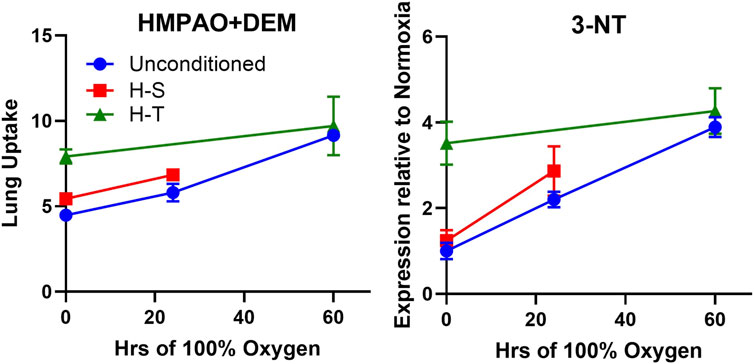
Figure 10. Independent markers of oxidoreductive state measured in unconditioned (blue circles), H-S (hyperoxia-sensitive, red squares), and H-T [hyperoxia-tolerant, green triangles (Audi et al., 2022b)] rats exposed to up to 60 h of >95% O2 hyperoxia. Left: DEM-insensitive 99mTc-HMPAO (GSH-independent signal), Right: 3-NT expression normalized to unconditioned value.
Additional studies would be needed to assess the contribution of mitochondrial and 3-NT related processes to the DEM-insensitive portion of 99mTc-HMPAO lung uptake.
99mTc-duramycin lung uptake
99mTc-duramycin is a SPECT biomarker of tissue injury sensing cell death via apoptosis and/or necrosis (Audi S. et al., 2012; Audi et al., 2017; Audi et al. 2015; Audi et al. 2022b; Clough et al., 2012). Previously we demonstrated that lung uptake of 99mTc-duramycin is highly correlated with the number of CC3-positive cells, and that apoptotic endothelial cells contribute more than other cell types to the enhanced 99mTc-duramycin lung signal in hyperoxic rats (Audi et al., 2015). Data from the present study are consistent with this result (Figure 6 center) and show that changes in 99mTc-duramycin lung uptake in unconditioned, H-T, and H-S rats in response to hyperoxia are similar to those of both CC3-positive cells and histological edema scores (Figure 11).
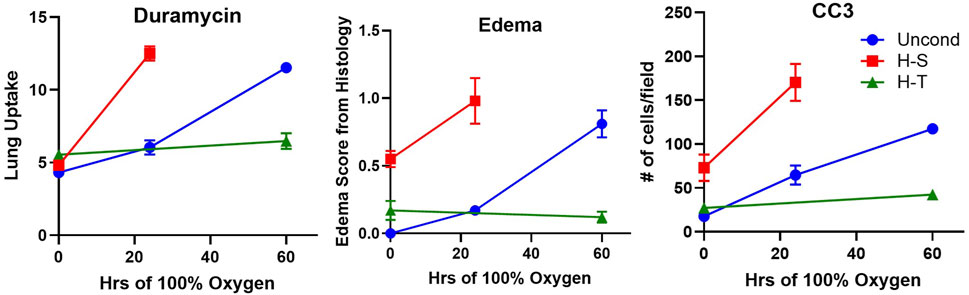
Figure 11. Independent markers of cell death measured in unconditioned (blue circles), H-S (hyperoxia-sensitive, red squares), and H-T [hyperoxia-tolerant, green triangles (Audi et al., 2022b)] rats exposed to up to 60 h of >95% O2 hyperoxia. Left: 99mTc-duramycin, Center: histological edema score, Right: Number of cleaved caspase 3 (CC3) positive cells per field.
Results from previous studies indicated high correlation between apoptosis (as measured by 99mTc-duramycin lung uptake and CC3 positive cells) and microvascular permeability lung injury (Kf) (Gill et al., 2014; Martin, Nakamura, and Matute-Bello, 2003; Medhora et al., 2016). The higher edema score in lungs of H-S rats compared to unconditioned rats measured in the present study (Table 4) is consistent with the high Kf previously measured in unconditioned rat lungs (Table 5) (Taheri et al., 2024). The edema score was also significantly higher in lungs of H-S+24 rats than H-S rats (Table 4). In comparison, we have previously reported that this edema score did not increase in lungs of H-T rats following exposure to hyperoxia for 60 h (Table 5) (Audi et al., 2022b). Exposure to hyperoxia of both unconditioned and H-S rats decreased the expression of mitochondrial complex I (Figure 8).
Figure 6 (right) shows a strong relationship between CC3 and mitochondrial complex I expression. This is consistent with release of cytochrome c triggered by mitochondrial dysfunction, leading to apoptosis, caspase activation, and eventual cell death (Jiang and Wang, 2004). In combination with other data in this manuscript, our results provide new evidence that even moderate hyperoxia (FiO2 = 60%), associated with very few histological or systemic signs of damage, can predispose to lung injury in preclinical animal models, consistent with previous reports (Minkove et al., 2023; Hayatdavoudi et al., 1981).
Limitations
One potential limitation of the present study is that the imaging and injury endpoints were not measured longitudinally in the same rats from pertinent groups (unconditioned vs. unconditioned+24 and H-S vs. H-S+24), but rather in independent groups of rats. (The animals were distributed over different order groups all from the same vendor.) Also, all rats used in this study were male in order to provide comparison of our results with previously reported data, since we are not aware of evidence that ARDS susceptibility (H-S) can be induced in female rats. Based on the promising results here, future studies could address these limitations. We also note that all results from rodents might not parallel exactly those in humans due to species differences, including that some rat species are burrowing animals and may experience periods of relative hypoxia and/or hypercarbia. Another limitation is that lung uptake of 99mTc-HMPAO and 99mTc-duramycin is affected predominantly by pulmonary endothelial cells since these cells are in direct contact with blood and account for ∼50% of the lung cells, whereas lung tissue assays, including glutathione tissue content and lung tissue expression of 3-NT, are affected by all lung cells. Nonetheless, good correlation with imaging quantification is demonstrated by the strong correlation in Figures 5, 6 (right).
Potential implications of the imaging results
In a clinical setting, information about serial, directional changes in oxidative processes, whether derived from imaging or other diagnostic tests, could aid clinicians in stratifying the risk of ARDS progression in individual patients. Specifically, a patient exhibiting rising levels of 99mTc-duramycin, alongside either increasing or stable 99mTc-HMPAO lung uptake, may be at higher risk for oxidative lung injury compared to those showing stable or decreasing uptake of both 99mTc-duramycin and 99mTc-HMPAO. Individuals at elevated risk for oxygen-induced lung injury may be candidates for interventions such as tolerance of lower blood oxygenation (e.g., 86% saturation threshold), lower Hb thresholds for transfusions (due to the risk of transfusion reactions) or prone positioning. However, these therapies each carry risks of their own, and thus are not generally applied to all persons with ARDS. For example, switching a patient from the supine to prone position carries a risk of accidental extubation or inadvertent removal of central lines. This demonstrates the importance of tests such as SPECT imaging that can identify those with favorable risk/benefit ratios for interventions not universally implemented. At present, no reliable, noninvasive tests or scales to meet this need are available. For this reason, other markers of cell death and oxidative lung injury should be investigated. If their value is established, serial images using 99mTc-HMPAO and 99mTc-duramycin (or other readily acquired markers of cell death and/or oxidative stress) have the potential to enhance the value of existing lung injury prediction scores to better define risks for progression or improvement in individual patients with ARDS (Gajic et al., 2011; Daenen et al., 2025).
Data availability statement
The raw data supporting the conclusions of this article will be made available by the authors, without undue reservation.
Ethics statement
The animal study was approved by Institutional Animal Care and Use Committees of the Clement J. Zablocki Veterans Administration Medical Center, Medical College of Wisconsin, and Marquette University. The study was conducted in accordance with the local legislation and institutional requirements.
Author contributions
AC: Conceptualization, Formal Analysis, Investigation, Methodology, Software, Supervision, Writing – original draft, Writing – review and editing. PT: Data curation, Investigation, Software, Writing – review and editing. GS: Investigation, Methodology, Writing – review and editing. MZ: Resources, Writing – review and editing. EJ: Resources, Writing – review and editing. SA: Conceptualization, Funding acquisition, Investigation, Methodology, Project administration, Resources, Writing – original draft, Writing – review and editing.
Funding
The author(s) declare that financial support was received for the research and/or publication of this article. Research reported in this publication was supported by the National Heart, Lung, and Blood Institute of the National Institutes of Health under award numbers 2R15HL129209-03 (SA, AC) and NIH R01HL152712 (MZ), and VA Merit Review Award BX001681 (EJ, SA, and AC).
Acknowledgments
We thank Sushma Kaul for assistance with experiments.
Conflict of interest
The authors declare that the research was conducted in the absence of any commercial or financial relationships that could be construed as a potential conflict of interest.
Generative AI statement
The author(s) declare that no Generative AI was used in the creation of this manuscript.
Any alternative text (alt text) provided alongside figures in this article has been generated by Frontiers with the support of artificial intelligence and reasonable efforts have been made to ensure accuracy, including review by the authors wherever possible. If you identify any issues, please contact us.
Publisher’s note
All claims expressed in this article are solely those of the authors and do not necessarily represent those of their affiliated organizations, or those of the publisher, the editors and the reviewers. Any product that may be evaluated in this article, or claim that may be made by its manufacturer, is not guaranteed or endorsed by the publisher.
Supplementary material
The Supplementary Material for this article can be found online at: https://www.frontiersin.org/articles/10.3389/fphys.2025.1648159/full#supplementary-material
References
Ahn C. S., Tow D. M., Yu C. C., Greene R. W. (1994). Effect of metabolic alterations on the accumulation of technetium-99m-labeled d,l-HMPAO in slices of rat cerebral cortex. J. Cereb. Blood Flow. Metab. 14, 324–331. doi:10.1038/jcbfm.1994.39
Andersen A. R., Friberg H., Lassen N. A., Kristensen K., Neirinckx R. D. (1988). Assessment of the arterial input curve for [99mTc]-d,l-HM-PAO by rapid octanol extraction. J. Cereb. Blood Flow. Metab. 8, S23–S30. doi:10.1038/jcbfm.1988.29
Audi S. H., Roerig D. L., Haworth S. T., Clough A. V. (2012a). Role of glutathione in lung retention of 99mTc-Hexamethylpropyleneamine oxime in two unique rat models of hyperoxic lung injury. J. Appl. Physiol. 113, 658–665. doi:10.1152/japplphysiol.00441.2012
Audi S., Li Z., Capacete J., Liu Y., Fang W., Shu L. G., et al. (2012b). Understanding the in vivo uptake kinetics of a phosphatidylethanolamine-binding agent (99m)Tc-Duramycin. Nucl. Med. Biol. 39, 821–825. doi:10.1016/j.nucmedbio.2012.02.004
Audi S. H., Jacobs E. R., Zhao M., Roerig D. L., Haworth S. T., Clough A. V. (2015). In vivo detection of hyperoxia-induced pulmonary endothelial cell death using (99m)Tc-duramycin. Nucl. Med. Biol. 42, 46–52. doi:10.1016/j.nucmedbio.2014.08.010
Audi S. H., Clough A. V., Haworth S. T., Medhora M., Ranji M., Densmore J. C., et al. (2016). 99MTc-Hexamethylpropyleneamine oxime imaging for early detection of acute lung injury in rats exposed to hyperoxia or lipopolysaccharide treatment. Shock 46, 420–430. doi:10.1097/SHK.0000000000000605
Audi S. H., Jacobs E. R., Zhang X., Camara A. K., Zhao M., Medhora M. M., et al. (2017). Protection by inhaled hydrogen therapy in a rat model of acute lung injury can be tracked in vivo using molecular imaging. Shock 48, 467–476. doi:10.1097/SHK.0000000000000872
Audi S. H., Jacobs E. R., Taheri P., Ganesh S., Clough A. V. (2022a). Assessment of protection offered by the Nrf2 pathway against hyperoxia-induced acute lung injury in Nrf2 knockout rats. Shock 57, 274–280. doi:10.1097/SHK.0000000000001882
Audi S. H., Taheri P., Zhao M., Hu K., Jacobs E. R., Clough A. V. (2022b). In vivo molecular imaging stratifies rats with different susceptibilities to hyperoxic acute lung injury. Am. J. Physiol. Lung Cell Mol. Physiol. 323, L410–L422. doi:10.1152/ajplung.00126.2022
Bannerman D. D., Goldblum S. E. (2003). Mechanisms of bacterial lipopolysaccharide-induced endothelial apoptosis. Am. J. Physiol. Lung Cell Mol. Physiol. 284, L899–L914. doi:10.1152/ajplung.00338.2002
Bellani G., Laffey J. G., Pham T., Fan E., Brochard L., Esteban A., et al. (2016). Epidemiology, patterns of care, and mortality for patients with acute respiratory distress syndrome in intensive care units in 50 countries. JAMA 315, 788–800. doi:10.1001/jama.2016.0291
Chen W., Ware L. B. (2015). Prognostic factors in the acute respiratory distress syndrome. Clin. Transl. Med. 4, 65. doi:10.1186/s40169-015-0065-2
Chow C. W., Herrera Abreu M. T., Suzuki T., Downey G. P. (2003). Oxidative stress and acute lung injury. Am. J. Respir. Cell Mol. Biol. 29, 427–431. doi:10.1165/rcmb.F278
Chu D. K., Kim L. H., Young P. J., Zamiri N., Almenawer S. A., Jaeschke R., et al. (2018). Mortality and morbidity in acutely ill adults treated with liberal versus conservative oxygen therapy (IOTA): a systematic review and meta-analysis. Lancet 391, 1693–1705. doi:10.1016/S0140-6736(18)30479-3
Clough A. V., Audi S. H., Haworth S. T., Roerig D. L. (2012). Differential lung uptake of 99mTc-Hexamethylpropyleneamine oxime and 99mTc-Duramycin in the chronic hyperoxia rat model. J. Nucl. Med. 53, 1984–1991. doi:10.2967/jnumed.112.108498
Clough A. V., Barry K., Rizzo B. M., Jacobs E. R., Audi S. H. (2019). Pharmacokinetics of (99m)Tc-HMPAO in isolated perfused rat lungs. J. Appl. Physiol. 127, 1317–1327. doi:10.1152/japplphysiol.00717.2018
Crapo J. D., Tierney D. F. (1974). Superoxide dismutase and pulmonary oxygen toxicity. Am. J. Physiol. 226, 1401–1407. doi:10.1152/ajplegacy.1974.226.6.1401
Crapo J. D., Barry B. E., Foscue H. A., Shelburne J. (1980). Structural and biochemical changes in rat lungs occurring during exposures to lethal and adaptive doses of oxygen. Am. Rev. Respir. Dis. 122, 123–143. doi:10.1164/arrd.1980.122.1.123
Daenen K., Stoof S. C. M., van Willigen H., Boyd A., Dalm V. A. S. H., Diederik A. M. P. J., et al. (2025). Prediction models for mortality in patients with moderate to severe ARDS treated in the ICU: a systematic review and meta-analysis. CHEST Crit. Care 3 (2), 100132. doi:10.1016/j.chstcc.2025.100132
Damiani E., Donati A., Girardis M. (2018). Oxygen in the critically ill: friend or foe? Curr. Opin. Anaesthesiol. 31, 129–135. doi:10.1097/ACO.0000000000000559
Fan E., Brodie D., Slutsky A. S. (2018). Acute respiratory distress syndrome: advances in diagnosis and treatment. JAMA 319, 698–710. doi:10.1001/jama.2017.21907
Fanelli V., Vlachou A., Ghannadian S., Simonetti U., Slutsky A. S., Zhang H. (2013). Acute respiratory distress syndrome: new definition, current and future therapeutic options. J. Thorac. Dis. 5 (3), 326–334. doi:10.3978/j.issn.2072-1439.2013.04.05
Fisher A. B., Beers M. F. (2008). Hyperoxia and acute lung injury. Am. J. Physiol. Lung Cell Mol. Physiol. 295, L1066; author reply L1067. doi:10.1152/ajplung.90486.2008
Frank L., Iqbal J., Hass M., Massaro D. (1989). New “rest period” protocol for inducing tolerance to high O2 exposure in adult rats. Am. J. Physiol. 257, L226–L231. doi:10.1152/ajplung.1989.257.4.L226
Gajic O., Dabbagh O., Park P. K., Adesanya A., Chang S. Y., Hou P., et al. (2011). Early identification of patients at risk of acute lung injury: evaluation of lung injury prediction score in a multicenter cohort study. Am. J. Respir. Crit. Care Med. 183, 462–470. doi:10.1164/rccm.201004-0549OC
Gan Z., Roerig D. L., Clough A. V., Audi S. H. (2011). Differential responses of targeted lung redox enzymes to rat exposure to 60 or 85% oxygen. J. Appl. Physiol. 111, 95–107. doi:10.1152/japplphysiol.01451.2010
Gardner A., Salmaso D., Nardo D., Micucci F., Nobili F., Sanchez-Crespo A., et al. (2008). Mitochondrial function is related to alterations at brain SPECT in depressed patients. CNS Spectr. 13, 805–814. doi:10.1017/s1092852900013936
Gill S. E., Taneja R., Rohan M., Wang L., Mehta S. (2014). Pulmonary microvascular albumin leak is associated with endothelial cell death in murine sepsis-induced lung injury in vivo. PLoS One 9, e88501. doi:10.1371/journal.pone.0088501
Girardis M., Busani S., Damiani E., Donati A., Rinaldi L., Marudi A., et al. (2016). Effect of conservative vs conventional oxygen therapy on mortality among patients in an intensive care unit: the Oxygen-ICU randomized clinical trial. JAMA 316, 1583–1589. doi:10.1001/jama.2016.11993
Hayatdavoudi G., O'Neil J. J., Barry B. E., Freeman B. A., Crapo J. D. (1981). Pulmonary injury in rats following continuous exposure to 60% O2 for 7 days. J. Appl. Physiol. 51, 1220–1231. doi:10.1152/jappl.1981.51.5.1220
Herrero R., Sanchez G., Lorente J. A. (2018). New insights into the mechanisms of pulmonary edema in acute lung injury. Ann. Transl. Med. 6, 32. doi:10.21037/atm.2017.12.18
Hoegl S., Burns N., Angulo M., Francis D., Osborne C. M., Mills T. W., et al. (2018). Capturing the multifactorial nature of ARDS - “Tto-hit” approach to model murine acute lung injury. Physiol. Rep. 6, e13648. doi:10.14814/phy2.13648
Jacquier-Sarlin M. R., Polla B. S., Slosman D. O. (1996). Oxido-reductive state: the major determinant for cellular retention of technetium-99m-HMPAO. J. Nucl. Med. 37, 1413–1416.
Jiang X., Wang X. (2004). Cytochrome C-mediated apoptosis. Annu. Rev. Biochem. 73, 87–106. doi:10.1146/annurev.biochem.73.011303.073706
Kallet R. H., Matthay M. A. (2013). Hyperoxic acute lung injury. Respir. Care 58, 123–141. doi:10.4187/respcare.01963
Kellner M., Noonepalle S., Lu Q., Srivastava A., Zemskov E., Black S. M. (2017). ROS signaling in the pathogenesis of acute lung injury (ALI) and acute respiratory distress syndrome (ARDS). Adv. Exp. Med. Biol. 967, 105–137. doi:10.1007/978-3-319-63245-2_8
Kuo S. J., Yang K. T., Chen D. R. (2005). Objective and noninvasive detection of sub-clinical lung injury in breast cancer patients after radiotherapy. Eur. J. Surg. Oncol. 31, 954–957. doi:10.1016/j.ejso.2005.07.006
Levitt J. E., Matthay M. A. (2012). Clinical review: early treatment of acute lung injury - paradigm shift toward prevention and treatment prior to respiratory failure. Crit. Care 16, 223. doi:10.1186/cc11144
Ligtenberg J. J., Stolmeijer R., Broekema J. J., Ter Maaten J. C., Zijlstra J. G. (2013). A little less saturation? Crit. Care 17, 439. doi:10.1186/cc12726
Ma W., Tang S., Yao P., Zhou T., Niu Q., Liu P., et al. (2025). Advances in acute respiratory distress syndrome: focusing on heterogeneity, pathophysiology, and therapeutic strategies. Signal Transduct. Target Ther. 10 (1), 75. doi:10.1038/s41392-025-02127-9
Madhu V., Boneski P. K., Silagi E., Qiu Y., Kurland I., Guntur A. R., et al. (2020). Hypoxic regulation of mitochondrial metabolism and mitophagy in nucleus pulposus cells is dependent on HIF-1α-BNIP3 axis. J. Bone Min. Res. 35, 1504–1524. doi:10.1002/jbmr.4019
Martin T. R., Nakamura M., Matute-Bello G. (2003). The role of apoptosis in acute lung injury. Crit. Care Med. 31, S184–S188. doi:10.1097/01.CCM.0000057841.33876.B1
Matute-Bello G., Downey G., Moore B. B., Groshong S. D., Matthay M. A., Slutsky A. S., et al. (2011). an official American thoracic society workshop report: features and measurements of experimental acute lung injury in animals. Am. J. Respir. Cell Mol. Biol. 44, 725–738. doi:10.1165/rcmb.2009-0210ST
Medhora M., Haworth S., Liu Y., Narayanan J., Gao F., Zhao M., et al. (2016). Biomarkers for radiation pneumonitis using noninvasive molecular imaging. J. Nucl. Med. 57, 1296–1301. doi:10.2967/jnumed.115.160291
Minkove S., Dhamapurkar R., Cui X., Li Y., Sun J., Cooper D., et al. (2023). Effect of low-to-moderate hyperoxia on lung injury in preclinical animal models: a systematic review and meta-analysis. Intensive Care Med. Exp. 11, 22. doi:10.1186/s40635-023-00501-x
Neirinckx R. D., Burke J. F., Harrison R. C., Forster A. M., Andersen A. R., Lassen N. A. (1988). The retention mechanism of technetium-99m-HM-PAO: intracellular reaction with glutathione. J. Cereb. Blood Flow. Metab. 8, S4–S12. doi:10.1038/jcbfm.1988.27
Qiu X., Li H., Tang H., Jin Y., Li W., Sun X., et al. (2011). Hydrogen inhalation ameliorates lipopolysaccharide-induced acute lung injury in mice. Int. Immunopharmacol. 11, 2130–2137. doi:10.1016/j.intimp.2011.09.007
Reiss L. K., Uhlig U., Uhlig S. (2012). Models and mechanisms of acute lung injury caused by direct insults. Eur. J. Cell Biol. 91, 590–601. doi:10.1016/j.ejcb.2011.11.004
Santos R. S., Silva P. L., Rocco J. R., Pelosi P., Rocco P. R. (2016). A mortality score for acute respiratory distress syndrome: predicting the future without a crystal ball. J. Thorac. Dis. 8, 1872–1876. doi:10.21037/jtd.2016.06.76
Shih W. J., Gruenwald F., Biersack H. J., Berger R., Brandenburg S., Coupal J., et al. (1991). Tc-99m HMPAO diffuse pulmonary uptake demonstrated in cigarette smokers. Clin. Nucl. Med. 16, 668–672. doi:10.1097/00003072-199109000-00012
Stolmeijer R., Ter Maaten J. C., Zijlstra J. G., Ligtenberg J. J. (2013). Oxygen therapy for sepsis patients in the emergency department: a little less? Eur. J. Emerg. Med. 21, 233–235. doi:10.1097/MEJ.0b013e328361c6c7
Suga K., Uchisako H., Nishigauchi K., Shimizu K., Kume N., Yamada N., et al. (1994). Technetium-99m-HMPAO as a marker of chemical and irradiation lung injury: experimental and clinical investigations. J. Nucl. Med. 35, 1520–1527.
Taheri P., Dave D. D., Dash R. K., Sharma G. P., Clough A. V., Jacobs E. R., et al. (2024). Mitochondrial function in lungs of rats with different susceptibilities to hyperoxia-induced acute lung injury. J. Appl. Physiol. 137, 233–253. doi:10.1152/japplphysiol.00243.2024
Villar J., Ambros A., Soler J. A., Martinez D., Ferrando C., Solano R., et al. (2016). Age, PaO2/FIO2, and Plateau pressure score: a proposal for a simple outcome score in patients with the acute respiratory distress syndrome. Crit. Care Med. 44, 1361–1369. doi:10.1097/CCM.0000000000001653
Ware L. B. (2005). Prognostic determinants of acute respiratory distress syndrome in adults: impact on clinical trial design. Crit. Care Med. 33, S217–S222. doi:10.1097/01.ccm.0000155788.39101.7e
Keywords: ARDS, molecular imaging, glutathione, HMPAO, single photon emission computedtomography (SPECT)
Citation: Clough AV, Taheri P, Sharma GP, Zhao M, Jacobs ER and Audi SH (2025) Lung uptake of two SPECT markers identifies sensitivity to hyperoxia-induced acute respiratory distress syndrome in rats. Front. Physiol. 16:1648159. doi: 10.3389/fphys.2025.1648159
Received: 16 June 2025; Accepted: 28 August 2025;
Published: 12 September 2025.
Edited by:
Roberto Massari, National Research Council (CNR), ItalyReviewed by:
Arun Kumar Malaisamy, International Centre for Genetic Engineering and Biotechnology, IndiaTyler Hillman, Loma Linda University, United States
Yehuda Arieli, Galilee Medical Center, Israel
Copyright © 2025 Clough, Taheri, Sharma, Zhao, Jacobs and Audi. This is an open-access article distributed under the terms of the Creative Commons Attribution License (CC BY). The use, distribution or reproduction in other forums is permitted, provided the original author(s) and the copyright owner(s) are credited and that the original publication in this journal is cited, in accordance with accepted academic practice. No use, distribution or reproduction is permitted which does not comply with these terms.
*Correspondence: Anne V. Clough, YW5uZS5jbG91Z2hAbWFycXVldHRlLmVkdQ==