 Sadid Al Amaz
 Suman Poudel
 Rajesh Jha
 Birendra Mishra
- Department of Human Nutrition, Food and Animal Sciences, College of Tropical Agriculture and Human Resilience, University of Hawaiʻi at Manoa, Honolulu, HI, United States
The chorioallantoic membrane (CAM) is essential for ion transport, acid-base homeostasis, and respiratory gas exchange during chicken embryonic development. The temporal expression of ion transporter-related genes in CAM is still inadequately investigated. This study examined the developmental regulation of genes associated with the transport of calcium (Ca), sodium (Na), bicarbonate (HCO3−), potassium (K), protons (H+), and chloride (Cl−) in the CAM at embryonic days (ED) 12, 15, and 18. Six hundred fertilized Cobb 500 broiler eggs were obtained from a local hatchery. After candling, on ED 10, a total of 236 eggs were selected for this experiment. All the eggs were incubated in an automated temperature regulation of 37.5°C, 55% relative humidity (RH), and egg rotation every 2 h. On days 12, 15, and 18 of the embryonic period, CAM tissues were collected (n = 6 per group), total RNA isolated, and target genes were analyzed using qPCR. At ED 12, chloride transporter genes (CLCN2, SLC4A1, and SLC26A9) were significantly upregulated compared to ED 18 (P < 0.05). At ED 15, calcium transporters (ATP2A2, ATP2A3, ITPR1, ATP2B4, SLC8A1, SLC8A3, TRPV6, and RYR1) were significantly upregulated compared to ED 12 and/or ED 18 (P < 0.05). Sodium transporters (ATP1A1 and SCNN1B), bicarbonate transporters (SLC4A4 and SLC4A10), potassium transporters (KCNMA1), and proton transporters (CA7 and CA9) were also significantly upregulated at ED 15 compared to ED 12 (P < 0.05). At ED 18, sodium transporter (ATP1B1, SCNN1A, and SGK1) and proton transporter (CA2) were significantly upregulated compared to ED 12 and/or ED 15 (P < 0.05). The results indicate a synchronized, stage-dependent transcriptional activation of ion transporter genes in the CAM, especially at the mid-embryonic stage.
1 Introduction
The partial fusion of the chorion and allantois forms the corioallointoic membrane (CAM) between embryonic days (ED) 5 and 6 (Melkonian et al., 2002). This structure develops incrementally, adhering to the acellular inner shell membrane located directly beneath the eggshell, and by ED 11 to 12, it completely encases the embryo and the residual egg contents (Gabrielli and Accili, 2010). The chick CAM is a fundamental extraembryonic membrane that performs several functions during embryonic development, including vasculature development (collagens, integrins, and laminins), respiratory gas exchange (annexins, hemoglobins, and tubulins), calcium ion (ATPases, CaBPs, and carbonic anhydrases) transport from the eggshell, embryonic acid-base homeostasis, ion and H2O reabsorption from the allantoic fluid, and chemical defense against infectious pathogens (cystatins, histones, and serpins) (Gabrielli and Accili, 2010; Ahmed et al., 2022).
Despite the immense importance of CAM during embryogenesis, gene expression related to ion transportation, acid-base balance, and gaseous exchange has not been widely investigated. Therefore, considering the importance, we hypothesize that the ion transportation, acid-base balance, and gaseous exchange-related gene expression would be upregulated in the mid-embryonic stage as the CAM is functionally activated by ED 12. So, this study aims to investigate the Ca (ATP2A2, ATP2A3, ATP2B1, ATP2B2, ATP2B4, ITPR1, RYR1, TRPV6, SLC8A1, and SLC8A34), Na (ATP1A1, ATP1B1, SCNN1A, SGK1, and SCNN1B), HCO3− (SLCA4, SLC4A5, SLC4A7, SLC4A8, and SLC4A10), K (KCNJ15, KCNJ16, and KCNMA1), proton (CA2, CA4, CA7, and CA9), and Cl (CLCN2, CLCN5, SLC4A1, SLC26A9, and CFTR) ion transporter-related genes expression at ED 12, ED 15 and ED 18 of embryonic period.
We selected ED 12, ED 15, and ED 18 to represent key transitional and functional stages in CAM development—specifically the shift from vascularization (ED 12) to peak ion transport and respiratory function (ED 15), and finally to intensive mineral mobilization and osmoregulation prior to hatching (ED 18) (Givisiez et al., 2020). By analyzing multiple ion transporters and acid-base regulatory genes, we aimed to assess the coordinated molecular network underlying CAM functions, such as calcium mobilization for skeletal development (Halgrain et al., 2022), bicarbonate and chloride exchange for pH homeostasis (Everaert et al., 2008), and fluid/electrolyte transport is crucial for embryonic viability (Hamburger and Hamilton, 1992). These genes work synergistically to ensure proper embryonic development, particularly during the critical pre-hatch phase.
2 Materials and methods
2.1 Incubation
All animal experimentation followed the regulations approved by the Institutional Animal Care and Use Committee of the University of Hawaii (Approval No. 17-2605-6). This research utilized animal experimentation from our previous studies (Al Amaz et al., 2024a). Briefly, six hundred fertilized Cobb 500 broiler eggs were procured from Asagi Hatchery Inc. (Honolulu, HI). The eggs were randomly allocated among three incubators (GQF Incubator, Savannah, GA), each containing 200 eggs, despite the total capacity of the incubators being 270 eggs. Following candling at ED 10, a total of 474 eggs with viable embryos were chosen for the experiment. From there, 236 eggs were selected for this experiment and transferred to one incubator. The remaining embryos were used for other experiments (Al Amaz et al., 2024a; Al Amaz et al., 2025a; Amaz et al., 2024b; Al Amaz et al., 2024c). All the eggs were incubated according to the standard protocol, which involved automated temperature control at 37.5°C and 55% relative humidity (RH), as well as egg rotation every 2 h.
2.2 Sample collection
The CAM tissues were collected on ED 12, ED 15, and ED 18 (n = 6/group). The eggs were initially broken into petri dishes, followed by the euthanization of the embryos through carbon dioxide asphyxiation for sampling purposes. The CAM tissue was collected, rapidly snap-frozen, and stored at −80°C until RNA extraction.
2.3 Quantitative real-time PCR (qPCR)
Total RNA was extracted from CAM tissue using TRIzol reagent (Invitrogen, Carlsbad, CA) according to the manufacturer’s instructions. The RNA concentration was quantified using a NanoDrop™ spectrophotometer (ThermoFisher Scientific, Madison, WI) by measuring purity (A260/280∼2.0). The quality of the RNA was determined by running samples on 2% agarose gel. On the gel, high-quality RNA showed two distinct rRNA bands (28S and 18S), with the 28S band approximately twice as intense as the 18S band. The absence of smearing indicated minimal degradation, confirming the RNA was intact and suitable for downstream applications. Then, the RNAs were reverse transcribed into complementary DNA (cDNA), and the target genes were analyzed using qPCR following the established protocol as previously described (Chaudhary et al., 2023; Amaz et al., 2025b). The primer sequences utilized for gene expression analysis are enumerated in Table 1. The NCBI Primer-Blast tool created particular primer pairs for each gene’s detection. A High-Capacity cDNA Reverse Transcription Kit (Applied Biosystems, Foster City, CA) was used to reverse-transcribe 1 μg of total RNA (20 μL of reverse transcription reaction mixture) into cDNA, which was subsequently diluted with nuclease-free water (1:25). qPCR was carried out using the PowerUp SYBR Green Master Mix (Applied Biosystems, Foster City, CA) and real-time PCR equipment (Applied Biosystems). To achieve a final reaction volume of 10 μL, the qPCR reaction mixture included 3 μL of cDNA, 5 μL of PowerUp SYBR Green Master Mix, and 1 μL of each forward and reverse primer at a concentration of 5 μmol. The qPCR reaction was conducted using the standard cycling mode. The qPCR thermal profile consists of an initial denaturation at 95°C for 2 min, followed by 40 cycles of denaturation at 95°C for 15 s and annealing/extension at 60°C for 30 s. A melting curve analysis was conducted to validate the SYBR Green-based amplicon. Furthermore, the specificity of each primer pair was evaluated through 1% gel electrophoresis of the qPCR products. The analysis was performed in triplicate for three housekeeping genes: GAPDH, β-actin, and TBP. The TBP expression was consistently stable across the CAM tissues. Post-amplification, the cycle threshold (Ct) values were documented, and gene expression levels were determined utilizing TBP as the reference gene, following the 2−ΔΔCT method (Livak and Schmittgen, 2001).
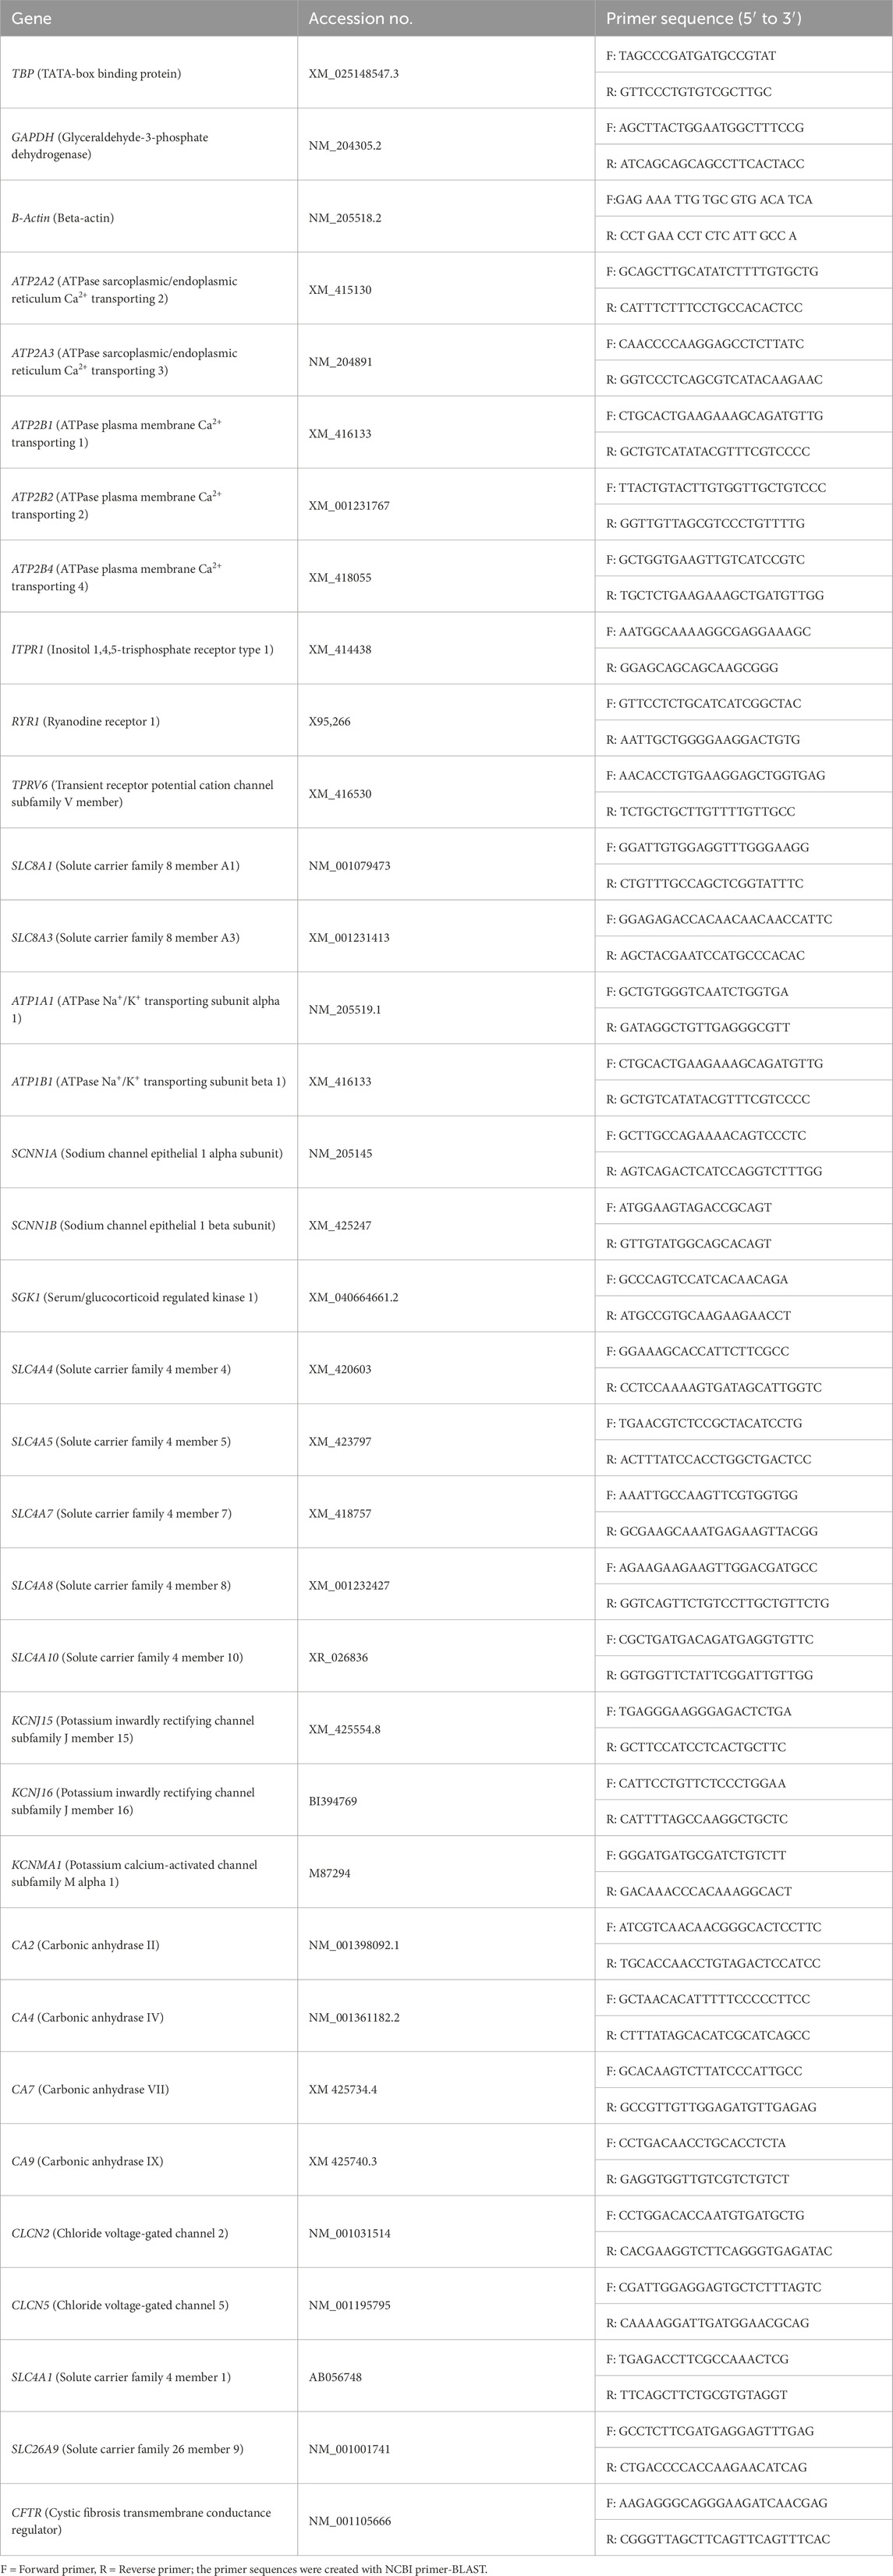
Table 1. List of 35 primers used in qPCR.
2.4 Statistical analysis
The gene expression was evaluated utilizing GraphPad (GraphPad Software, San Diego, CA). After conducting a one-way analysis of variance (ANOVA), the Tukey-HSD test was employed to compare the means of the different treatment groups. All data are expressed as mean ± Standard error of the mean (SEM). SEM represents the variability of the sample mean and is calculated as the standard deviation (SD) divided by the square root of the sample size (n). The threshold for statistical significance was established at P < 0.05.
3 Result
3.1 Calcium (Ca) transporter-related gene expression
The expression pattern of the Ca transporter-related genes (ATP2A2, ATP2A3, ATP2B1, ATP2B2, ATP2B4, ITPR1, RYR1, TRPV6, SLC8A1, and SLC8A3) in the CAM were summarized in Figure 1. The expressions of ATP2A2, ATP2A3, and ITPR1 were significantly increased at ED 15 compared to the other days (P < 0.05). ATP2B4, SLC8A1, and SLC8A3 were significantly lower at ED 12 than at ED 15 (P < 0.05), while TRPV6 was significantly lower at ED 12 compared to the other days (P < 0.05). ATP2B2 was significantly lower at ED 18 compared to the other days (P < 0.05), while RYR1 was significantly lower at ED 18 compared to ED 15 (P < 0.05). ATP2B1 expression remained unchanged across the time points.
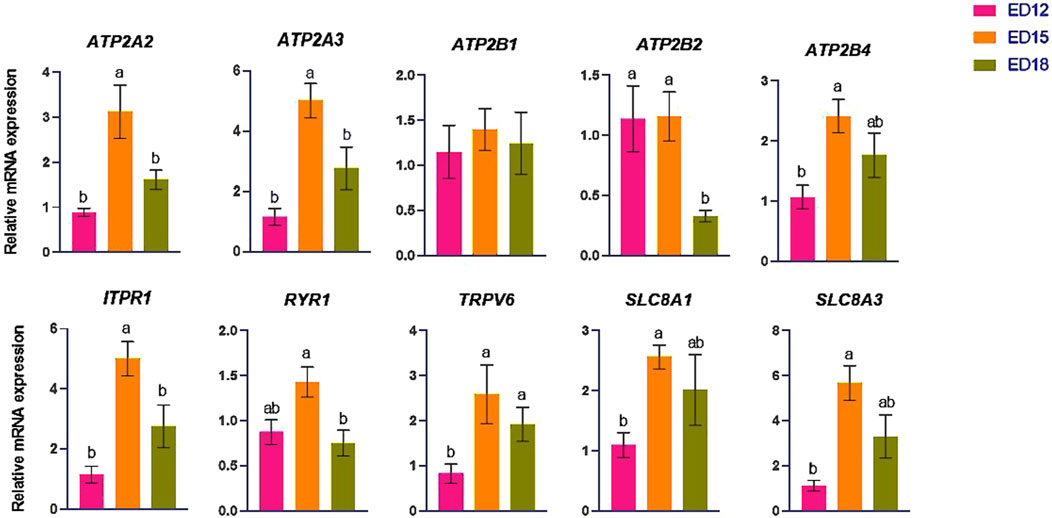
Figure 1. Changes in calcium ion transporter genes during embryonic days (ED) in the Corioallionic membrane of broiler embryos (n = 6/group). Data presented as mean ± SEM. Different letters indicate a significant difference (P < 0.05) among the age groups. No letters means no significant difference.
3.2 Sodium (Na) transporter-related gene expression
The Na transporter-related genes (ATP1A1, ATP1B1, SCNN1A, SGK1, and SCNN1B) are shown in Figure 2. ATP1A1 was significantly higher at ED 15 than in ED 12 (P < 0.05), while SCNN1B was significantly higher at ED 15 compared to the other groups (P < 0.05). ATP1B1 and SGK1 were significantly higher at ED 18 than at ED 12 (P < 0.05). SCNN1A was significantly higher at ED 18 compared to the other groups (P < 0.05).
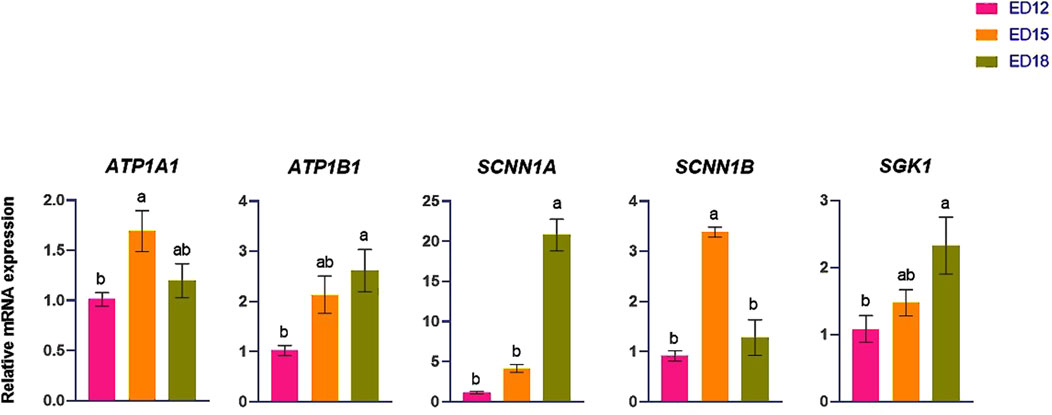
Figure 2. Changes in sodium ion transporter genes during embryonic days (ED) in the Corioallionic membrane of broiler embryos (n = 6/group). Data presented as mean ± SEM. Different letters indicate a significant difference (P < 0.05) among the age groups. No letters means no significant difference.
3.3 Bicarbonate (HCO3−) transporter-related gene expression
The HCO3− -transporter-related genes (SLCA4, SLC4A5, SLC4A7, SLC4A8, and SLC4A10) are shown in Figure 3. SLCA4 and SLC4A10 were significantly higher at ED 15 compared to ED 12 and ED 18 (P < 0.05). SLC4A5, SLC4A7, and SLC4A8 expression were not changed at any time points.
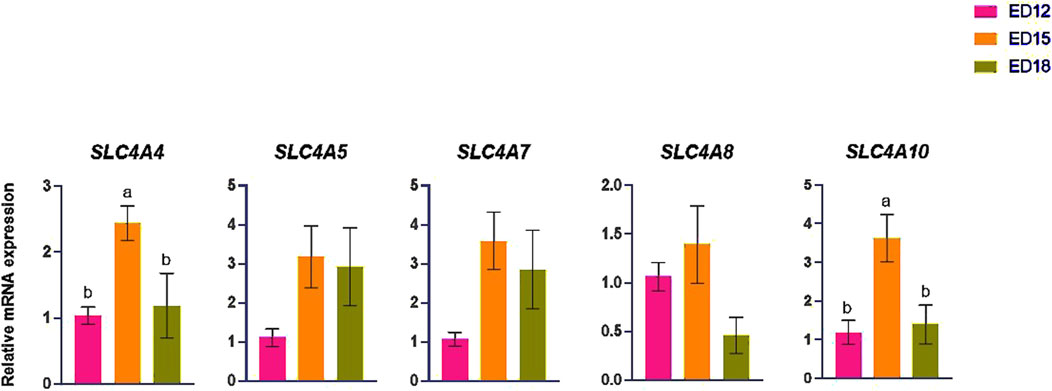
Figure 3. Changes in bicarbonate ion transporter genes during embryonic days (ED) in the Corioallionic membrane of broiler embryos (n = 6/group). Data presented as mean ± SEM. Different letters indicate a significant difference (P < 0.05) among the age groups. No letters means no significant difference.
3.4 Potassium (K) and proton (H+) transporter-related gene expression
The K transporter-related genes (KCNJ15, KCNJ16, and KCNMA1) and H+ transporter-related genes (CA2, CA4, CA7, and CA9) are presented in Figures 4A,B. KCNMA1 was significantly higher at ED 15 compared to ED 12 (P < 0.05). CA2 was significantly higher at ED 18 than in the other groups (P < 0.05). CA7 and CA9 were significantly higher at ED 15 compared to ED 12 (P < 0.05). KCNJ15, KCNJ16, and CA4 were not changed at ED12,15 nad 18.
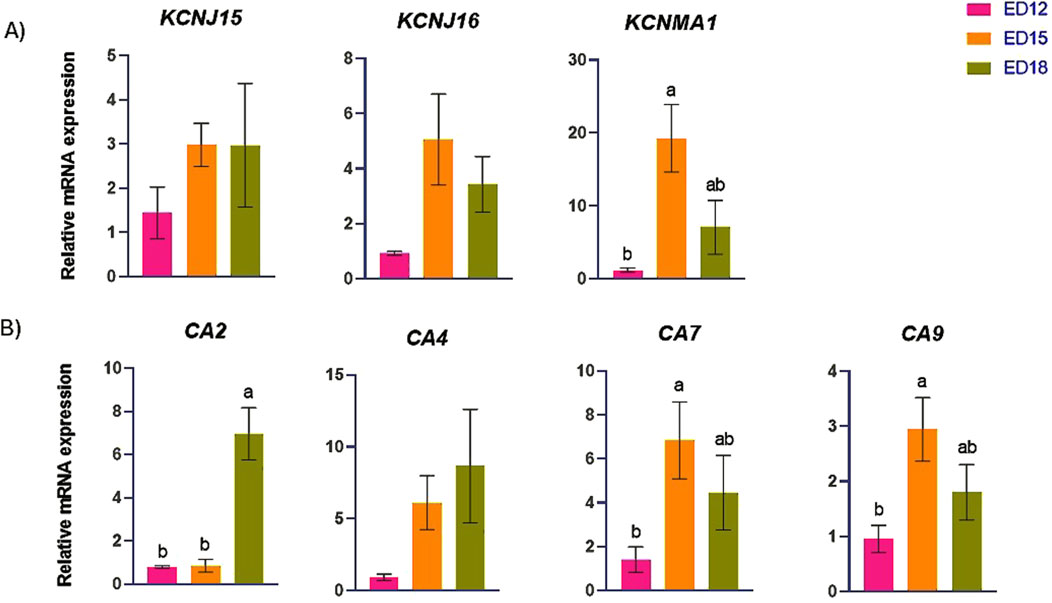
Figure 4. Changes in (A) potassium and (B) proton transporter genes during embryonic days (ED) in the Corioallionic membrane of broiler embryos (n = 6/group). Data presented as mean ± SEM. Different letters indicate a significant difference (P < 0.05) among the age groups. No letters means no significant difference.
3.5 Chlorine (Cl) transporter-related gene expression
The Cl transporter genes (CLCN2, CLCN5, SLC4A1, SLC26A9, and CFTR) are presented in Figure 5. CLCN2, SLC4A1, and SLC26A9 were significantly higher at ED 12 than at ED 18 (P < 0.05). CLCN5 and CFTR remained unchanged across the time points.
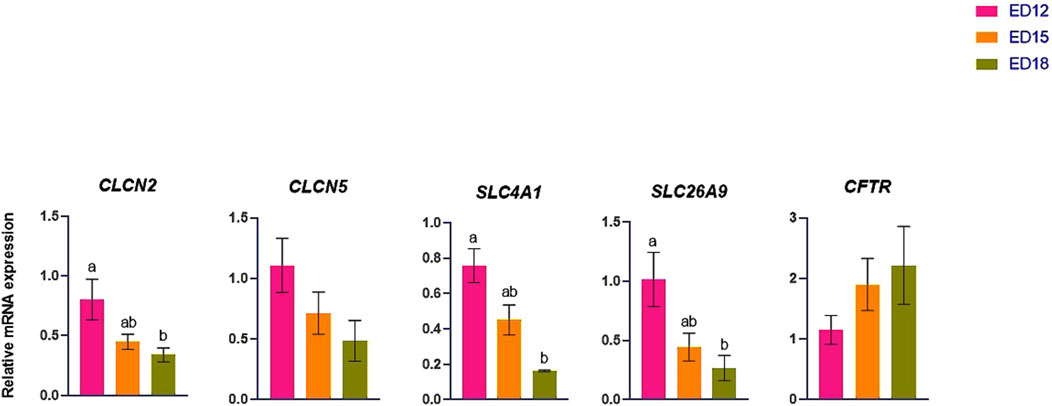
Figure 5. Changes in chloride ion transporter genes during embryonic days (ED) in the Corioallionic membrane of broiler embryos (n = 6/group). Data presented as mean ± SEM. Different letters indicate a significant difference (P < 0.05) among the age groups. No letters means no significant difference.
4 Discussion
4.1 Calcium (Ca) ion transportation
Calcium is reabsorbed from the eggshell and transported to the embryo for bone development throughout the embryonic period (Johnston and Comar, 1955). Transporting calcium from the eggshell into the embryonic circulation requires Ca2+-activated ATPase. This membrane-bound enzyme, which necessitates ATP and Mg2+ and is activated by Ca2+, is specifically situated within the CAM ectoderm, the layer adjacent to the shell. Its activity markedly escalates during phases of swift calcium accumulation, underscoring its significance in skeletogenesis (Tuan and Knowles, 1984). In this study, ATP2A2 and ATP2A3 were significantly higher at ED 15 than at the other time points, while ATP2B4 was significantly higher at ED 15 than at ED 12. However, ATP2B2 was significantly higher at ED 15 and ED 12 than at ED 18. Taken together, it is evident that the peak initiation of calcium transportation happens at ED 12 and then peaks at ED 15 during bone mineralization. This coincides with the known period of active calcium mobilization and mineralization of the embryonic skeleton, which has been documented to intensify between ED12 and ED16 in chickens (Halgrain et al., 2022). IP3R1 encodes ITPR1, a member of the IP3 receptor family (IP3R1–3), and is essential for intracellular calcium signaling because it releases calcium ions into the cytosol from the endoplasmic reticulum (Sun et al., 2025). ITPR1 was significantly higher at ED 15 than in the other groups. The RYR1 codes ryanodine receptor 1, a protein essential for the release of calcium and contraction of skeletal muscle (Alvarellos et al., 2016). Significantly higher ITPR1 and RYR1 expressions at ED 15 indicate heightened intracellular calcium signaling. TRPV6 is crucial in initiating calcium transport in CAM (Huang et al., 2022). The SLC8A1 and SLC8A3, belonging to the solute carrier family 8, encode sodium/calcium exchangers in the plasma membrane. These exchangers function bidirectionally, crucially contributing to calcium homeostasis by facilitating the exchange of intracellular Ca2+ and extracellular Na+ ions (Gabellini et al., 2002). TRPV6, SLC8A1, and SLC8A3 were significantly higher at ED 15 than ED 12, allowing increased transcellular calcium influx and efflux.
4.2 Sodium (Na) ion transporation
The coordinated expression of Na+ ion transport genes precisely controls the regulation of sodium homeostasis in the embryonic CAM. The ATP1A1 is essential for cation transport and generates and maintains the Na+/K+ ion electrochemical gradients throughout the cell membrane (Lin et al., 2021). In this study, ATP1A1 was significantly higher at ED 15 than at ED 12, suggesting enhanced sodium transport activity during mid-embryonic development. The Epithelial Sodium Channel consists of α, β, and γ subunits, encoded by the SCNN1A, SCNN1B, and SCNN1G, corresponding to the sodium channel epithelial 1 subunits α, β, and γ, respectively (Pierandrei et al., 2021). SGK1 regulates sodium retention, potassium excretion, and mineral and nutrient transport across renal, gastric, and intestinal tissues. It also influences salt appetite, blood coagulation, blood pressure, and insulin-dependent glucose uptake (Lang et al., 2006). SGK1 and SCNN1A were significantly higher at ED 18 than ED 12, indicating their role in the terminal phase of ENaC activation and effective sodium absorption in anticipation of hatching, when the demand for sodium transport is at its highest. However, SCNN1B was significantly higher at ED 15 than at the other time points. SCNN1B may facilitate channel assembly at an earlier stage, whereas SCNN1A may serve as a rate-limiting factor for the complete functionality of ENaC, which becomes essential as hatching approaches when the embryo necessitates optimal ion and fluid homeostasis. This temporal separation facilitates the sodium transport pathway’s synchronized accumulation and activation.
4.3 Bicarbonate (HCO3−) ion transportation
The solute carrier family 4 is a crucial protein that mediates various physiological processes, including molecular transduction, protein-to-protein interactions, and the transport of different ions across the cell membrane (Zhong et al., 2023). In chickens, SLC4A4 encodes the electrogenic sodium bicarbonate cotransporter 1. This protein is essential for transporting sodium and bicarbonate ions across cellular membranes (Bahadoran et al., 2018). Acid extrusion is mediated by SLC4A10, which explicitly uses the transmembrane gradient of Na+ to promote cellular net uptake of HCO3− (Maroofian et al., 2024). SLC4A4 and SLC4A10 were significantly upregulated at ED 15 compared to the other time points, signifying increased bicarbonate transport and pH buffering during this phase. In neuronal and epithelial tissues, SLC4A8 encodes the Na+-driven Cl−/HCO3− exchanger, which couples sodium influx with chloride–bicarbonate exchange to regulate intracellular pH and secrete bicarbonate (Remigante et al., 2022). SLC4A5 is a transmembrane protein that operates as an electrogenic cotransporter, facilitating the concurrent transport of HCO3− and Na+ ions in the same direction (Stütz et al., 2009). The SLC4A5, SLC4A7, and SLC4A8 showed numerically higher expression at ED 15 compared to the other time points, bolstering the higher bicarbonate-transporting activity during the mid-embryonic phase. These findings underscore a stage-specific activation of bicarbonate transport mechanisms, presumably to accommodate higher metabolic demands and preserve intracellular pH equilibrium during accelerated embryonic development. This aligns with previous studies indicating that embryonic metabolic rate and CO2 production significantly increase during this window, requiring tight regulation of intracellular pH (Tazawa, 1980).
4.4 Potassium (K) and proton (H+) transportation
Potassium voltage-gated channel subfamily J member 16 (KCNJ16) protein encodes the inward rectifier potassium channel Kir5.1, dimerizes with Kir4.2 (encoded by KCNJ15) and Kir4.1 (encoded by KCNJ10) to form functional heteromeric channels that help control membrane potential and potassium ion transport (Zhang et al., 2021). The “Big K+” (BK) large-conductance calcium and voltage-activated K+ channel’s pore-forming α subunit is encoded by KCNMA1. Both excitable and non-excitable cells are found in tissues with a large distribution of BK channels (Bailey et al., 2019). In this study, KCNJ15 expression remained stable across developmental stages, suggesting a constitutive role in baseline K+ conductance that may not require transcriptional regulation during this period. In contrast, KCNJ16 showed a trend toward upregulation at ED15, which may reflect a supportive role in enhancing Na+/K+-ATPase function or accommodating increased ion exchange demands as CAM ion transport activity peaks. This subtle change may indicate post-transcriptional regulation or gradual recruitment of K+ channels to meet the increased ionic flux during mid-embryogenesis. However, KCNMA1 was significantly upregulated at ED 15 compared to ED 12. This upregulation indicates a developmentally regulated activation of BK channels, presumably facilitating rapid cellular activity, volume regulation, or signal transduction during the mid-embryonic phase. Carbonic anhydrases (CAs) are widespread metalloenzymes that facilitate the crucial reaction of converting carbon dioxide (CO2) and water (H2O) into bicarbonate (HCO3−) and protons (H+) (Occhipinti and Boron, 2019). The calcium carbonate (CaCO3) is broken down into Ca2+ and HCO3− by the protons generated by CA2, which acidify the region surrounding the eggshell. Specialized cells in the CAM subsequently absorb the released calcium ions and transfer them to the growing chick embryo (Huang et al., 2022). The CA7 may enhance acid-base equilibrium and CO2 transport in the CAM, which is essential for embryonic gas exchange and pH regulation (Supuran, 2008). The transmembrane enzyme CA9 catalyzes the reversible hydration of CO2 to bicarbonate and protons, preserving pH homeostasis in hypoxic environments (Swietach et al., 2010). In this study, CA2 was significantly upregulated at ED 18, whereas CA7 and CA9 were significantly upregulated at ED 15 compared to ED 12. The initial increase in CA7 and CA9 suggests an upregulation of respiratory and pH homeostasis facilitation. In contrast, the subsequent induction of CA2 is associated with calcium extraction for osseous development, indicating a sequential functional transition in CA isozyme activity as embryogenesis progresses.
4.5 Chloride (Cl−) ion transporation
A voltage-gated chloride channel (CLC-2), widely expressed and distributed throughout the body, is encoded by chloride voltage-gated channel 2 (CLCN2). This encoded transmembrane protein is essential for electrogenesis, homeostatic cell volume regulation, and ion gradient maintenance. It also stabilizes chloride ion homeostasis in various cells (Thiemann et al., 1992). The voltage-gated chloride channel (ClC-5) encoded by CLCN5 mainly involves ion transport and endosomal acidification, controlling vesicular trafficking and electrolyte balance in the epithelium (Jentsch and Pusch, 2018). In this study, CLCN2 was significantly upregulated at ED 12 compared to ED 18, suggesting an aid in the electrogenesis and initial stabilization of chloride ions during the early stages of vascular and epithelial growth and development in CAM. In erythrocytes and epithelial tissues, anion exchanger 1, a transmembrane protein that facilitates chloride–bicarbonate exchange and is necessary for CO2 transportation and pH regulation, is encoded by SLC4A1 (Alper, 2006). SLC26A9 either physically or functionally interacts with the CFTR chloride channel to control CFTR activity or is controlled by CFTR (Remigante et al., 2022). SLC4A1 and SLC26A9 were significantly decreased from ED 12 to ED 18. The decrease in ED 18 expression indicates a developmental shift from chloride-driven acid-base regulation as mineral demands and calcium mobilization become more important in later stages.
5 Conclusion
This study demonstrates that the embryonic CAM’s ion transport and pH-regulating systems are activated in a tightly controlled, stage-specific manner. Early development is marked by improved gas exchange and chloride-driven acid-base balance, driven by chloride, which promotes epithelial growth and CO2 elimination (Figure 6). Increased ion mobilization, especially of calcium and sodium, is seen in the mid to late stages to promote fluid homeostasis and bone formation. The temporal separation of calcium/sodium transport and chloride-mediated pH regulation ensures adequate metabolic support, mineral delivery, and physiological preparation for hatching. This study reveals that the CAM acts as a dynamic interface incorporating developmental demands, acid-base regulation, and ion transport. Our findings provide a strong foundation for conducting functional validation studies. Future efforts will focus on localizing proteins and quantifying them at various stages of embryonic development to determine if changes in gene expression are correlated with protein activity. Functional experiments, such as ion flux measurements and pharmacological inhibition, will clarify the physiological significance of these genes. Integrating transcriptome data with metabolic, physiological, and morphological outcomes will ultimately enhance our understanding of how CAM maturation supports embryo survival and development. This information may also improve poultry breeding practices for selecting future breeding flocks and enhance biomedical models that utilize the CAM.
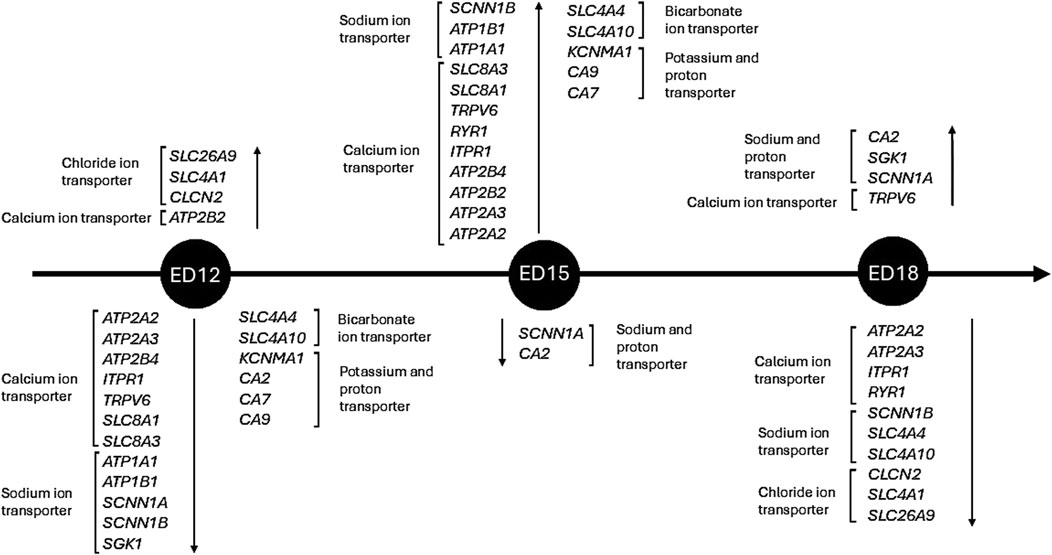
Figure 6. Timeline of ion transportation-related genes in Corioallionic membrane development. Only significant differences (P < 0.05) are considered in the timeline.
Data availability statement
The datasets presented in this study can be found in online repositories. The names of the repository/repositories and accession number(s) can be found in the article/supplementary material.
Ethics statement
The animal study was approved by Institutional Animal Care and Use Committee of the University of Hawaii. The study was conducted in accordance with the local legislation and institutional requirements.
Author contributions
SA: Project administration, Validation, Formal Analysis, Data curation, Visualization, Conceptualization, Methodology, Supervision, Writing – review and editing, Investigation, Resources, Software, Writing – original draft. SP: Formal Analysis, Visualization, Conceptualization, Writing – review and editing. RJ: Writing – review and editing, Investigation, Validation. BM: Conceptualization, Methodology, Supervision, Writing – review and editing, Data curation, Investigation, Validation, Funding acquisition, Resources, Visualization.
Funding
The author(s) declare that financial support was received for the research and/or publication of this article. BM obtained financial assistance for this project through a Start-up grant from CTAHR, the University of Hawaii at Manoa, and USDA Multistate (2052R). In addition to offering financial assistance, these organizations refrained from developing experimental protocols or manuscripts.
Acknowledgments
We sincerely thank Socorro Tauyan for her assistance with animal experiments. We thank Ajay Chaudhary, Prem Lal Mahato, Pravin Mishra, and Razib Das for supporting the sample collection.
Conflict of interest
The authors declare that the research was conducted in the absence of any commercial or financial relationships that could be construed as a potential conflict of interest.
The author(s) declared that they were an editorial board member of Frontiers, at the time of submission. This had no impact on the peer review process and the final decision.
Generative AI statement
The author(s) declare that no Generative AI was used in the creation of this manuscript.
Publisher’s note
All claims expressed in this article are solely those of the authors and do not necessarily represent those of their affiliated organizations, or those of the publisher, the editors and the reviewers. Any product that may be evaluated in this article, or claim that may be made by its manufacturer, is not guaranteed or endorsed by the publisher.
References
Ahmed T. A. E., Cordeiro C. M. M., Elebute O., Hincke M. T. (2022). Proteomic analysis of chicken chorioallantoic membrane (CAM) during embryonic development provides functional insight. BioMed Res. Int. 2022, 7813921. doi:10.1155/2022/7813921
Al Amaz S., Chaudhary A., Mahato P. L., Jha R., Mishra B. (2024a). Pre-hatch thermal manipulation of embryos and post-hatch baicalein supplementation mitigated heat stress in broiler chickens. J. Anim. Sci. Biotechnol. 15, 8. doi:10.1186/s40104-023-00966-6
Al Amaz S., Shahid M. A. H., Jha R., Mishra B. (2024c). Prehatch thermal manipulation of embryos and posthatch baicalein supplementation increased liver metabolism, and muscle proliferation in broiler chickens. Poult. Sci. 103, 104155. doi:10.1016/j.psj.2024.104155
Al Amaz S., Shahid M. A. H., Jha R., Mishra B. (2025a). Early embryonic thermal programming and post-hatch flavonoid (Scutellaria baicalensis) supplementation enhanced immune response markers in broiler chickens. Front. Vet. Sci. 12, 1537116. doi:10.3389/fvets.2025.1537116
Alper S. L. (2006). Molecular physiology of SLC4 anion exchangers. Exp. Physiol. 91, 153–161. doi:10.1113/expphysiol.2005.031765
Alvarellos M. L., Krauss R. M., Wilke R. A., Altman R. B., Klein T. E. (2016). PharmGKB summary: very important pharmacogene information for RYR1. Pharmacogenetics Genomics 26, 138–144. doi:10.1097/FPC.0000000000000198
Amaz S. A., Shahid M. A. H., Chaudhary A., Jha R., Mishra B. (2024b). Embryonic thermal manipulation reduces hatch time, increases hatchability, thermotolerance, and liver metabolism in broiler embryos. Poult. Sci. 103, 103527. doi:10.1016/j.psj.2024.103527
Amaz S. A., Wasti S., Adnan M. R., Chaudhary A., Jha R., Mishra B. (2025b). Dried plum supplementation enhanced the expression of liver antioxidant capacity, metabolism, and epigenetic-related gene markers in broiler chickens under heat stress conditions: dried plum increased liver metabolism in broiler. Poult. Sci. 104, 104911. doi:10.1016/j.psj.2025.104911
Bahadoran S., Dehghani Samani A., Hassanpour H. (2018). Effect of heat stress on the gene expression of ion transporters/channels in the uterus of laying hens during eggshell formation. Stress 21, 51–58. doi:10.1080/10253890.2017.1394291
Bailey C. S., Moldenhauer H. J., Park S. M., Keros S., Meredith A. L. (2019). KCNMA1 -linked channelopathy. J. General Physiology 151, 1173–1189. doi:10.1085/jgp.201912457
Chaudhary A., Mishra P., Amaz S. A., Mahato P. L., Das R., Jha R., et al. (2023). Dietary supplementation of microalgae mitigates the negative effects of heat stress in broilers. Poult. Sci. 102, 102958. doi:10.1016/j.psj.2023.102958
Everaert N., De Smit L., Debonne M., Witters A., Kamers B., Decuypere E., et al. (2008). Changes in acid-base balance and related physiological responses as a result of external hypercapnia during the second half of incubation in the chicken embryo. Poult. Sci. 87, 362–367. doi:10.3382/ps.2007-00345
Gabellini N., Bortoluzzi S., Danieli G. A., Carafoli E. (2002). The human SLC8A3 gene and the tissue-specific Na+/Ca2+ exchanger 3 isoforms. Gene 298 (1), 1–7. doi:10.1016/s0378-1119(02)00982-4
Gabrielli M. G., Accili D. (2010). The chick chorioallantoic membrane: a model of molecular, structural, and functional adaptation to transepithelial ion transport and barrier function during embryonic development. J. Biomed. Biotechnol. 2010, 940741–12. doi:10.1155/2010/940741
Givisiez P. E. N., Moreira Filho A. L. B., Santos M. R. B., Oliveira H. B., Ferket P. R., Oliveira C. J. B., et al. (2020). Chicken embryo development: metabolic and morphological basis for in ovo feeding technology. Poult. Sci. 99, 6774–6782. doi:10.1016/j.psj.2020.09.074
Halgrain M., Bernardet N., Crepeau M., Même N., Narcy A., Hincke M., et al. (2022). Eggshell decalcification and skeletal mineralization during chicken embryonic development: defining candidate genes in the chorioallantoic membrane. Poult. Sci. 101, 101622. doi:10.1016/j.psj.2021.101622
Hamburger V., Hamilton H. L. (1992). A series of normal stages in the development of the chick embryo. Dev. Dyn. 195, 231–272. doi:10.1002/aja.1001950404
Huang Q., Yang R., Wang Q., Teng H., Song H., Geng F., et al. (2022). Transcriptome-based insights into the calcium transport mechanism of chick chorioallantoic membrane. Food Sci. Hum. Wellness 11, 383–392. doi:10.1016/j.fshw.2021.11.018
Jentsch T. J., Pusch M. (2018). CLC chloride channels and transporters: structure, function, physiology, and disease. Physiol. Rev. 98, 1493–1590. doi:10.1152/physrev.00047.2017
Johnston P. M., Comar C. L. (1955). Distribution and contribution of calcium from the albumen, yolk and shell to the developing chick embryo. Am. J. Physiology-Legacy Content 183, 365–370. doi:10.1152/ajplegacy.1955.183.3.365
Lang F., Böhmer C., Palmada M., Seebohm G., Strutz-Seebohm N., Vallon V. (2006). (Patho)physiological significance of the serum- and glucocorticoid-inducible kinase isoforms. Physiol. Rev. 86, 1151–1178. doi:10.1152/physrev.00050.2005
Lin Z., Li J., Ji T., Wu Y., Gao K., Jiang Y. (2021). ATP1A1 de novo mutation-related disorders: clinical and genetic features. Front. Pediatr. 9, 657256. doi:10.3389/fped.2021.657256
Livak K. J., Schmittgen T. D. (2001). Analysis of relative gene expression data using real-time quantitative PCR and the 2(-Delta Delta C(T)) method. Methods 25, 402–408. doi:10.1006/meth.2001.1262
Maroofian R., Zamani M., Kaiyrzhanov R., Liebmann L., Karimiani E. G., Vona B., et al. (2024). Biallelic variants in SLC4A10 encoding a sodium-dependent bicarbonate transporter lead to a neurodevelopmental disorder. Genet. Med. 26, 101034. doi:10.1016/j.gim.2023.101034
Melkonian G., Munoz N., Chung J., Tong C., Marr R., Talbot P. (2002). Capillary plexus development in the day five to day six chick chorioallantoic membrane is inhibited by cytochalasin D and suramin. J. Exp. Zool. 292, 241–254. doi:10.1002/jez.10014
Occhipinti R., Boron W. F. (2019). Role of carbonic anhydrases and inhibitors in acid–base physiology: insights from mathematical modeling. IJMS 20, 3841. doi:10.3390/ijms20153841
Pierandrei S., Truglio G., Ceci F., Del Porto P., Bruno S. M., Castellani S., et al. (2021). DNA methylation patterns correlate with the expression of SCNN1A, SCNN1B, and SCNN1G (epithelial sodium channel, ENaC) genes. IJMS 22, 3754. doi:10.3390/ijms22073754
Remigante A., Spinelli S., Pusch M., Sarikas A., Morabito R., Marino A., et al. (2022). Role of SLC4 and SLC26 solute carriers during oxidative stress. Acta Physiol. 235, e13796. doi:10.1111/apha.13796
Stütz A. M., Teran-Garcia M., Rao D. C., Rice T., Bouchard C., Rankinen T. (2009). Functional identification of the promoter of SLC4A5, a gene associated with cardiovascular and metabolic phenotypes in the HERITAGE family study. Eur. J. Hum. Genet. 17, 1481–1489. doi:10.1038/ejhg.2009.64
Sun B., Ni M., Li Y., Song Z., Wang H., Zhu H.-L., et al. (2025). Inositol 1,4,5-Trisphosphate receptor 1 gain-of-function increases the risk for cardiac arrhythmias in mice and humans. Circulation 151, 847–862. doi:10.1161/CIRCULATIONAHA.124.070563
Supuran C. T. (2008). Carbonic anhydrases: novel therapeutic applications for inhibitors and activators. Nat. Rev. Drug Discov. 7, 168–181. doi:10.1038/nrd2467
Swietach P., Hulikova A., Vaughan-Jones R. D., Harris A. L. (2010). New insights into the physiological role of carbonic anhydrase IX in tumour pH regulation. Oncogene 29, 6509–6521. doi:10.1038/onc.2010.455
Tazawa H. (1980). Oxygen and CO2 exchange and acid-base regulation in the Avian embryo. Am. Zool. 20, 395–404. doi:10.1093/icb/20.2.395
Thiemann A., Gründer S., Pusch M., Jentsch T. J. (1992). A chloride channel widely expressed in epithelial and non-epithelial cells. Nature 356, 57–60. doi:10.1038/356057a0
Tuan R. S., Knowles K. A. (1984). Calcium-activated ATPase of the chick embryonic chorioallantoic membrane. Identification, developmental expression, and topographic relationship with calcium-binding protein. J. Biol. Chem. 259, 2754–2763. doi:10.1016/S0021-9258(17)43210-8
Zhang J., Han J., Li L., Zhang Q., Feng Y., Jiang Y., et al. (2021). Inwardly rectifying potassium channel 5.1: structure, function, and possible roles in diseases. Genes and Dis. 8, 272–278. doi:10.1016/j.gendis.2020.03.006
Keywords: broiler, embryogenesis, gene expression, ion transporter, transcriptomics
Citation: Amaz SA, Poudel S, Jha R and Mishra B (2025) Early and mid-embryonic upregulation of chloride, calcium, and sodium transporter genes mark functional maturation of the chorioallantoic membrane in broiler embryos. Front. Physiol. 16:1652828. doi: 10.3389/fphys.2025.1652828
Received: 24 June 2025; Accepted: 28 July 2025;
Published: 28 August 2025.
Edited by:
Monika Proszkowiec-Weglarz, Agricultural Research Service, United StatesReviewed by:
Sara Cloft, Purdue University, United StatesKuan Ling Liu, Agricultural Research Service (USDA), United States
Copyright © 2025 Amaz, Poudel, Jha and Mishra. This is an open-access article distributed under the terms of the Creative Commons Attribution License (CC BY). The use, distribution or reproduction in other forums is permitted, provided the original author(s) and the copyright owner(s) are credited and that the original publication in this journal is cited, in accordance with accepted academic practice. No use, distribution or reproduction is permitted which does not comply with these terms.
*Correspondence: Birendra Mishra, Ym1pc2hyYUBoYXdhaWkuZWR1