 Claire Game1
 Tom Walsh
 Scott C. Wearing
- 1Podiatry Professionals, Canberra, ACT, Australia
- 2Division of Medical Services, Princess Alexandra Hospital, Brisbane, QLD, Australia
- 3Brain Modelling Group, QIMR Berghofer, Brisbane, QLD, Australia
- 4Department of Neurosurgery, Ulm University, Ulm, Germany
- 5School of Medicine and Health, Technical University of Munich, Munich, Germany
- 6Basel Academy for Quality and Research in Medicine, Basel, Switzerland
Background: Athletes have been shown to have greater tolerance and, to a lesser extent, a lower sensitivity to mechanical pain. However, little is known as to whether the pressure-pain sensitivity of the plantar tissues of the foot of runners, which are exposed to repeated, high-impact forces during running, differs to those of non-runners. This study evaluated topographical pressure-pain sensitivity maps of the plantar foot, and at a reference site of the palmar hand, in competitive distance runners and healthy, non-runners and explored the relationship between pressure-pain thresholds and skin and subcutaneous tissue morphology.
Methods: Mechanical pressure-pain thresholds (PPTs) were measured using an algometer fitted with a cylindrical probe (1 cm2) in 23 competitive distance runners [mean (±SD) age, 39.7 ± 12.0 years; height, 1.75 ± 0.09 m; weight, 68.0 ± 8.4 kg] and an equivalent number of healthy non-runners [mean (±SD) age, 36.6 ± 10.1 years; height, 1.73 ± 0.10 m; weight, 77.6 ± 15.9 kg]. PPTs were determined, bilaterally, using an increasing ramp of ≈30 kPa/s at six standardised sites of the plantar foot, including the centre of the plantar calcaneal area (PCA), the Abductor Hallucis muscle belly (ABH), the plantar metatarsal area of the first (1MH), third (3MH), and fifth (5MH) metatarsal heads, the Abductor Digiti Minimi muscle belly (ADM), as well as the Abductor Pollicis Brevis muscle belly (THE) of the corresponding hand. Skin and subcutaneous tissue thickness at each site was measured using B-mode ultrasound equipped with an 18–4 MHz linear array transducer. Potential differences in PPT values and tissue thickness between groups were assessed using three-way repeated-measures ANOVA and pairwise comparisons with Šidák’s adjustment for multiple comparisons. Relationships between measures of PPT and tissue thickness were explored using nonlinear regression with skin and subcutaneous tissue thickness as the independent variable. Akiake’s Information Criterion was used to assess logit and polynomial fits (linear, quadratic and cubic).
Results: Mean PPT values in runners were, on average, 24% higher than those of non-runners, across all sites (F1,43 = 4.6, P = 0.038). Pain sensitivity varied significantly across the plantar surface of the foot in both runners and non-runners (F3.2, 139.9 = 82.5, P <0 .001). PPTs at the PCA were significantly higher (range, 18.6–31.7 kPa) and the ABH significantly lower (range, −31.7 − −6.2 kPa) than those at all other foot sites (P < 0.05). Similarly, mean PPT measured at the THE was significantly lower than that measured at all plantar foot sites (range, −36.9 − −5.1 kPa) in both groups. Runners also presented with significantly thinner tissues than non-runners (F4, 177 = 14.1, P = 0.016) at the PCA [−1.5 mm (−2.8, −0.2), P <0 .05], 1MH [−1.0 mm (−2.0, −0.1), P <0 .05], and ADM [−1.4 mm (−2.6, −0.2), P <0 .05]. The relationship between PPT and tissue thickness was best described by a logit function in runners and non-runners (range R2, 88%–95%). Normalization of pedal PPT values to those of the hand, mitigated the bias in plantar foot PPTs between groups, without altering the shape of the logit function.
Conclusion: Distance runners presented with lowered sensitivity to mechanical pain than non-runners, despite relatively thinner plantar foot tissues. The topographical variation in PPTs across the plantar foot can be effectively modeled as a function of relative plantar tissue thickness, and the hypoalgesic bias in runners may be mitigated by the normalization of PPT values to those of the hand, without altering the shape of the logit function. Hence, centrally-mediated pathways may underpin the mechanical hypoalgesia of the plantar foot in runners.
1 Introduction
Pressure dolorimetry is commonly used as part of established quantitative sensory testing protocols to mechanically induce deep tissue pain and measure mechanical pain sensitivity (Graven-Nielsen, 2022; Rolke et al., 2006). Deep pressure-pain thresholds (PPTs), which involve the blunt mechanical indentation of skin and subcutaneous tissues, reflect the lowest principal stress that first elicits pain (Fischer, 1987), and are classically thought to be mostly mediated by low-threshold mechanoreceptors of thinly-myelinated A-delta fibres and, to a lesser extent C-fibers, via the anterior spinothalamic tract (Rolke et al., 2006; Yam et al., 2018; Simone et al., 1994). More recently, high-threshold, polymodal receptors of large-diameter, thickly-myelinated, A-delta fibers (Fleckenstein et al., 2017; Nagi et al., 2019), primarily located deep within the superficial fascia and the deep fascial tissues (Case et al., 2021), have also been implicated. PPTs evaluating discrete sites of the foot have been reported within the literature for over half a century, and have most commonly been used as remote test sites to aid in the identification of widespread mechanical hyperalgesia (Weidenbacker et al., 1963; Brennum et al., 1989; Rolke et al., 2005; Graven-Nielsen et al., 2010). Discrete PPTs of the plantar foot are well known to be higher than those of the palmar hand, presumably reflecting the lower density and higher activation thresholds of mechanoreceptors of the distal lower extremity (Rolke et al., 2005; Ro et al., 2006; Kennedy and Inglis, 2002; Strzalkowski et al., 2018; Corniani and Saal, 2020).
More recently, topographical pressure-pain sensitivity maps of the plantar aspect of the feet have become an area of increased research interest, particularly within the context of athletic footwear research (Hodge et al., 2009; Xiong et al., 2011; Xiong et al., 2013; Weerasinghe et al., 2016; Tornero-Caballero et al., 2016; Wu et al., 2024; Madeleine et al., 2014). Such maps have reinforced the concept that afferent innervation and pain sensitivity in healthy adults varies across the sole of the foot (Strzalkowski et al., 2018), with higher pain thresholds and lower sensitivity commonly reported beneath the heel and plantar metatarsal area (Hodge et al., 2009; Xiong et al., 2011; Xiong et al., 2013; Weerasinghe et al., 2016; Tornero-Caballero et al., 2016; Wu et al., 2024; Madeleine et al., 2014). Purported to reflect, in part, the morphology or mechanical properties of the skin and subcutaneous tissues (Kennedy and Inglis, 2002; Xiong et al., 2013; Weerasinghe et al., 2016; Rodrigo et al., 2013; Strzalkowski et al., 2015a; Katic et al., 2022), these sites have also been shown to experience the highest principal stress on the foot during walking and running (Wearing et al., 2001; Hong et al., 2012; Hohmann et al., 2016). It is surprising, therefore, that minimal research has evaluated whether pressure-pain sensitivity maps of the feet of distance runners, in which the plantar tissues are exposed to repeated impacts associated with foot strike, differ to those of non-runners. It is particularly surprising, given that aerobic exercise has been shown to induce an acute, but transitory, hypoalgesia in healthy adults (Tomschi et al., 2024), and that athletes have often been shown to have moderately higher PPTs and, therefore, lower sensitivity to mechanical pain, than non-athletes across a wide variety of body sites (Thornton et al., 2024; Pacheco-B et al., 2020). However, as noted in a recent systematic review, which included 17 studies, involving 1,397 athletes, there is a need to evaluate pain sensitivity in specific athletic groups given the considerable heterogeneity in mechanical PPTs observed across different athlete cohorts (Thornton et al., 2024).
Consequently, this study aimed to evaluate whether pressure-pain sensitivity of the plantar surface of the foot, and a remote site of the palmar hand, differed in healthy, competitive distance runners compared to non-runners. Specifically, we tested the null hypothesis that there would be no difference in pressure pain thresholds across the plantar aspect of the foot and palmar hand of competitive runners and non-runners. We also evaluated whether PPT values could be effectively modelled as a function of relative plantar tissue thickness in each group.
2 Materials and methods
2.1 Participants
Participants were recruited over an 8-month period. Advertisements for volunteers were placed in running and triathlon clubs across the greater metropolitan area including online advertising and flyers distributed throughout the University faculty and students. In accordance with established criteria, participants were classified as runners if they self-reported that; (a) they trained with a purpose of performance enhancement and to compete, (b) partook in regular endurance running training at least three times per week, and (c) were formally registered with a regional or national sport federation (McKay et al., 2022; MacMahon and Parrington, 2017). The latter two criteria were also confirmed independently by evaluation of training log books and federation registers by a member of the research team. Non-runners, in contrast, were active individuals who did not participate in activities where running was a primary focus, did not participate in running-related competitions, and did not run for competitive performance enhancement.
As there is currently no published data regarding PPT values involving the plantar tissues of the foot in runners and non-runners to guide a sample size calculation, the study sample size was calculated a priori based on previously published PPT values reported for plantar foot sites in healthy, middle-aged adults recruited from the general population (Ríos-León et al., 2019). A sample size of 22 runners, and an equivalent number of non-runners, was estimated to have sufficient statistical power (β = 0.10) at an alpha (α) level of 0.05 to identify the minimal detectable change in PPT (98 kPa) reported for the plantar calcaneal area (Nagi et al., 2019). Hence, the study was not only statistically powered to identify mean differences in PPT values reported in the literature for individuals with and without plantar heel pain (Ríos-León et al., 2019; Fernandez-Lao et al., 2016), but also for locally reported changes in PPTs following high-intensity exercise (Tomschi et al., 2024). The project was undertaken in accordance with the principles of the Declaration of Helsinki. Written consent was obtained from all study participants after a verbal and written explanation of the project as per the requirements of the University Human Research Ethics Committee clearance.
2.2 Protocol
All participants presented to thermoneutral laboratory wearing lightweight comfortable clothing and having abstained from vigorous physical activity, caffeinated beverages and the use of analgesics or muscle relaxants within the previous 24 h. Measurements of body height (stretch stature) were made to the nearest millimeter, using a Harpenden stadiometer (Cranlea and Co, Birmingham, UK), and body weight was recorded to the nearest 0.1 kg using a digital scale (8W8600, Tanita, Tokyo, Japan). The Patient-Reported Outcome Measurement Information System (PROMIS) Profile-29 was used to assess six domains of physical, mental and social health, including Physical Function, Anxiety, Depression, Fatigue, Sleep Disturbance, and Social Dysfunction. The self-reported PROMIS questionnaire contained four items for each domain and raw scores for each domain were standardized and expressed as t-scores with a population mean of 50 and a standard deviation of 10 (Schalet et al., 2016). Thus, the higher the numerical score for a given domain, the more of the attribute that was measured (Haupt et al., 2023).
2.2.1 Mechanical pressure-pain thresholds (PPTs)
Topographical pressure-pain sensitivity was measured bilaterally, over seven locations, by a single, trained operator using standardised instructions and according to the methods outlined by Ríos-León et al. (2019). In brief, a single operator manually applied pressure, perpendicular to the skin, at each measurement site using a customised electronic algometer (FDIX-25, Wagner Instruments, Greenwich, CT, United States). The load cell of the algometer had a full-scale of 112 N and resolution of 0.05 N, and was fitted with a cylindrical polyurethane probe (Ø, 11 mm), with a contact area of 1 cm2. The algometer was modified to provide the operator with a real-time visual display of the applied force and was fitted with an external mechanical trigger that enabled participants to stop the acquisition of data once they perceived the applied pressure first changed to pain. The algometer was calibrated prior to data collection. Pressure-pain thresholds were determined bilaterally at seven sites; six involving the plantar surface of the foot and one site involving the palmar surface of the hand (Figure 1). To aid comparison to previous research (Tornero-Caballero et al., 2016; Ríos-León et al., 2019; Fernandez-Lao et al., 2016), standardised sites of the foot included the centre of the plantar calcaneal area (PCA), the Abductor Hallucis muscle belly (ABH), the plantar metatarsal area of the first (1MH), third (3MH), and fifth (5MH) metatarsal heads, and the Abductor Digiti Minimi muscle belly (ADM). The Abductor Pollicis Brevis muscle belly (THE) of the corresponding hand was also evaluated (Ríos-León et al., 2019). The THE was specifically selected as a remote test site to evaluate potential widespread effects, as it is innervated by the median nerve (T1) rather than lumbosacral plexus which innervates the plantar tissues of the foot.
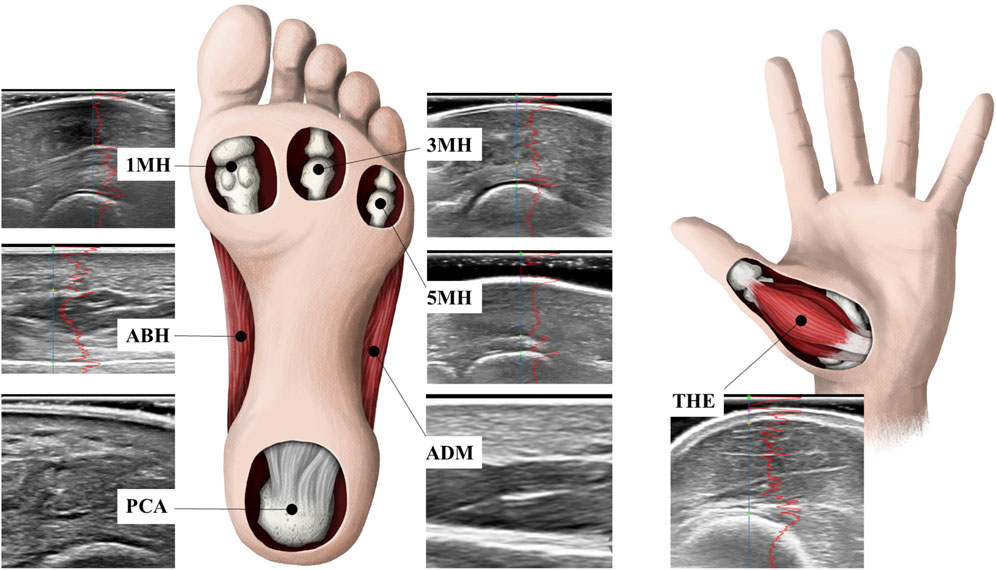
Figure 1. Pressure-pain thresholds and skin and subcutaneous tissue thickness were determined bilaterally at standardised sites including the centre of the plantar calcaneal area (PCA), the Abductor Hallucis muscle belly (ABH), the plantar metatarsal area of the first (1MH), third (3MH), and fifth (5MH) metatarsal heads, the Abductor Digiti Minimi muscle belly (ADM), as well as the Abductor Pollicis Brevis muscle belly (THE) of the corresponding hand.
Participants were positioned prone, with the knee and ankle of the test limb flexed to 45° and the dorsal surface of the foot and ventral surface of the hand resting on a rigid support surface. Prior to testing, the method was first demonstrated at a non-test site involving the arm and plantar foot to familiarize participants with the protocol. The pressure pain threshold (PPT) was subsequently determined at each site using two series of ascending stimulus intensities, each manually applied to match a slowly increasing ramp of 30 kPa/s which was shown on a built-in visual display. Participants were blinded to the display and requested to press the trigger to cease the test once the sensation of pressure first changed to pain (Fischer, 1987; Saban and Masharawi, 2016). There was no upper pressure limit applied by the operator during testing and the order of testing was randomized between sites and counterbalanced between limbs. A minimum rest period of 30-s was provided between trials in order to minimize potential temporal summation (Nie et al., 2005). Force data were sampled at a rate of 100 Hz and the peak pressure calculated. The mean PPT from two trials was calculated at each site and used for later analysis. The technical error of measurement for repeated measures of PPT and loading rate determined across all sites and in both limbs in the current study was 76.3 ± 21.1 kPa and 1.8 ± 0.5 kPa/s, respectively. As calculated in the current study, the technical error of measurement is identical to that of the “within-subject standard deviation” popularized by Bland and Altman (Bland and Altman, 1996) and is often interpreted as the typical range of measurement error that can be expected to occur with repeated measurement (Harris and Smith, 2009). According to Saban and Masharawi (2016) and others (Walton et al., 2011), the minimal detectable change in PPT values for the plantar calcaneal area and ventral shank are in the order of 98–161 kPa. Given that the normalization of PPT values to those of remote sites tends to show greater sensitivity and less temporal drift than absolute values (Rolke et al., 2005; Kosek et al., 1993; Fredriksson et al., 2000), PPT values at each site were also normalized to those of the THE of the corresponding hand and expressed as a proportion.
2.2.2 Skin and subcutaneous tissue thickness
Blinded ultrasound examination of each site was undertaken by an experienced operator using a high-resolution B-mode ultrasound machine (iU22, Philips Medical Systems, Bothell, WA, United States), equipped with an 18–4 MHz linear array transducer and a standardized protocol. Ultrasonic examination of the unloaded skin and subcutaneous tissues was undertaken using a modified method to that outlined by Lin et al. (2015). Participants were positioned prone with a neutral ankle and the knee flexed at right angles (Maemichi et al., 2020). Each site was initially imaged transversely and axially in dynamic mode to allow active movement and to aid identification of key structures, including muscle tendon, epitendinous and paratendinous structures. Each location was subsequently marked using an indelible skin marker to ensure consistent placement for ultrasound and PPT testing. The ultrasound transducer was then positioned over the center of the measurement site, coincident with the long axis of the foot. Sagittal images were acquired using a thick layer of acoustic coupling gel, such that the site of measurement was located at the center of the image. Care was taken to ensure the transducer did not touch the plantar surface of the foot or compress the plantar fibro-adipose tissues (Lin et al., 2015). Only images in which acoustic coupling gel could be clearly visualized between the transducer and the surface of the skin were stored for later analysis. Up to eight replicate images were acquired for all structures, with the order of imaging counterbalanced between limbs and sites. All ultrasound images were subsequently exported in DICOM format to PC for post processing. The thickness of the skin and subcutaneous tissue at each site was analyzed using custom, semi-automated MATLAB software (MathWorks Inc., Natick, MA) with the aid of a grayscale profile. All measurements were undertaken by a second operator and in a blinded manner. The technical error of measurement for repeated measures of tissue thickness at all sites was less than 1.0%.
2.3 Statistical analysis
Statistical analysis was performed using IBM-SPSS statistical software (version 26, IBM Corp. Armonk, NY, United States). All data were evaluated for normality using the Shapiro Wilk’s test. Outcome variables were determined to be normally distributed and hence, means and standard deviations have been used as summary statistics. The homogeneity of variances was assessed using Levene’s statistic. Potential differences in age and anthropometric characteristics and patient reported outcome measures of health-related quality of life (PROMIS subscales) between runners and non-runners were analyzed using independent t-tests. Differences in sex-distribution between groups was examined using Fischer’s exact test. Potential differences in absolute and normalized PPT values and tissue thickness were assessed using three-way repeated-measures ANOVA within a generalized linear modelling framework. In each case, group (runners and non-runners) was treated as a between–subject factor, while limb (left and right) and site (PCA, ABH, 1MH, 3MH, 5MH, ADM, and THE) were treated as within–subject factors. Underlying assumptions regarding the uniformity of the variance–covariance matrix were assessed using Mauchly’s test of sphericity. When the assumption of uniformity was violated, an adjustment to the degrees of freedom of the F ratio was made using Greenhouse–Geisser Epsilon, thereby making the F-test more conservative. Significant effects were subsequently investigated using pairwise comparisons with Šidák’s adjustment for multiple comparisons. Potential relationships among measures of PPT, tissue thickness, anthropometric characteristics and measures of health-related quality of life were investigated using Pearson correlations. Relationships among measures of absolute and normalized PPT and tissue thickness were further explored graphically, and, subsequently, a logit function was fit to the data using nonlinear regression with skin and subcutaneous tissue thickness as the independent variable (x) and PPT as the dependent variable (y). The logit functional form fit to the data is defined as,
where
3 Results
3.1 Participant characteristics and health-related quality of life
Table 1 summarises the demographic characteristics and health-related quality of life of healthy runners and non-runners. As anticipated, non-runners were significantly heavier than competitive runners (t33 = 2.6, P = 0.015), and presented with a significantly higher body mass index (BMI) (t26 = 3.6, P = 0.002). According to World Health Organisation guidelines, all trained runners were within a “normal weight” range, while non-runners ranged from “normal weight” through to “Obese Class II” (WHO Expert Consultation, 2004). There was no significant difference between groups for patient reported outcome measures of health-related quality of life, with the exception of anxiety, which was significantly lower in runners than non-runners (t42 = 2.69, P = 0.010).
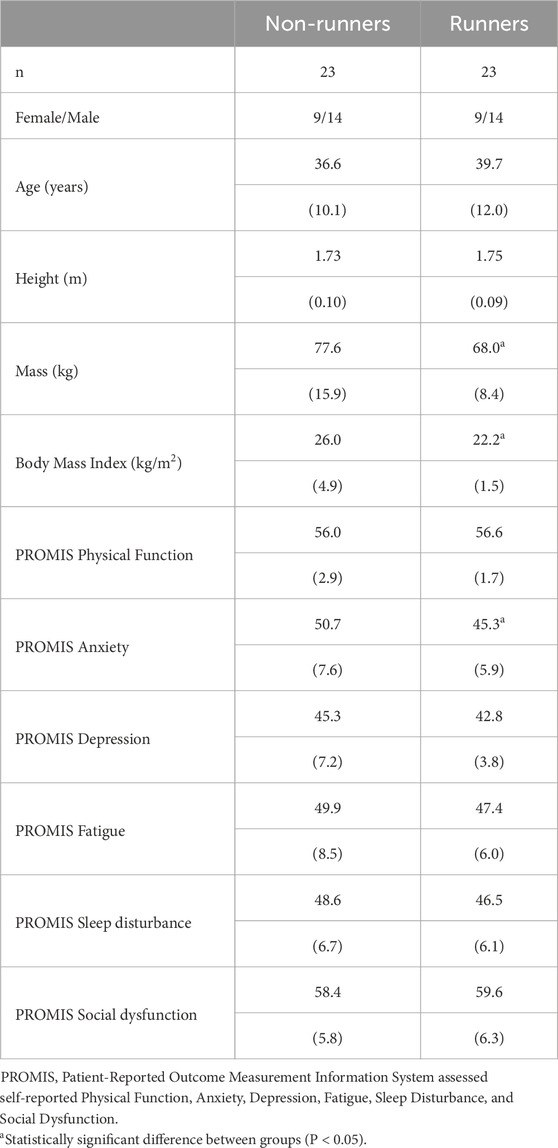
Table 1. Characteristics of healthy, trained runners and non-runners.
3.2 Skin and subcutaneous tissue thickness
Runners presented with significantly thinner skin and subcutaneous tissues than non-runners across all sites [mean difference (95%CI) = −0.8 mm (−1.5, −0.0), P < 0.05]. As expected, there was also a significant main effect of measurement site on tissue thickness (F4, 177 = 1,005.1, P < 0.001). Mean skin and subcutaneous tissue thickness was greatest at the PCA [group mean (95%CI) = 16.4 mm (15.8, 17.1)] and thinnest at the THE [group mean (95%CI) = 1.9 mm (1.8, 2.1)]. Post hoc analysis revealed that, irrespective of group, skin and subcutaneous tissue thickness was significantly different between all sites (P < 0.001). The ANOVA model also revealed a significant group by site interaction (F4, 177 = 14.1, P = 0.016), whereby runners presented with significantly thinner tissues at the PCA [mean difference (95%CI) = −1.5 mm (−2.8, −0.2), P < 0.05], 1MH [mean difference (95%CI) = −1.0 mm (−2.0, −0.1), P < 0.05], and ADM [mean difference [95%CI) = −1.4 mm (−2.6, −0.2), P < 0.05]. There was no significant main effect for limb or interaction effects between group and limb or limb and site.
Pearson correlations among patient characteristics and subcutaneous tissue thickness at each site in runners and non-runners are summarised in Tables 2, 3. Plantar tissue thickness in non-runners tended to be positively, though modestly, correlated with body mass at all foot sites (P < 0.05) and with BMI at all foot sites (P < 0.05), except for 3MH and 5MH. In contrast, tissue thickness in runners was not significantly correlated with BMI at any site, but rather was positively associated with both body mass and body height across all foot sites (P <0.05), except 1MH. The thickness of the skin and subcutaneous tissues in runners was also negatively correlated with age at the PCA, ADM and 5MH, bilaterally (P < 0.05). Pearson correlations revealed no significant linear relationships among tissue thickness and health-related quality of life variables in either group.
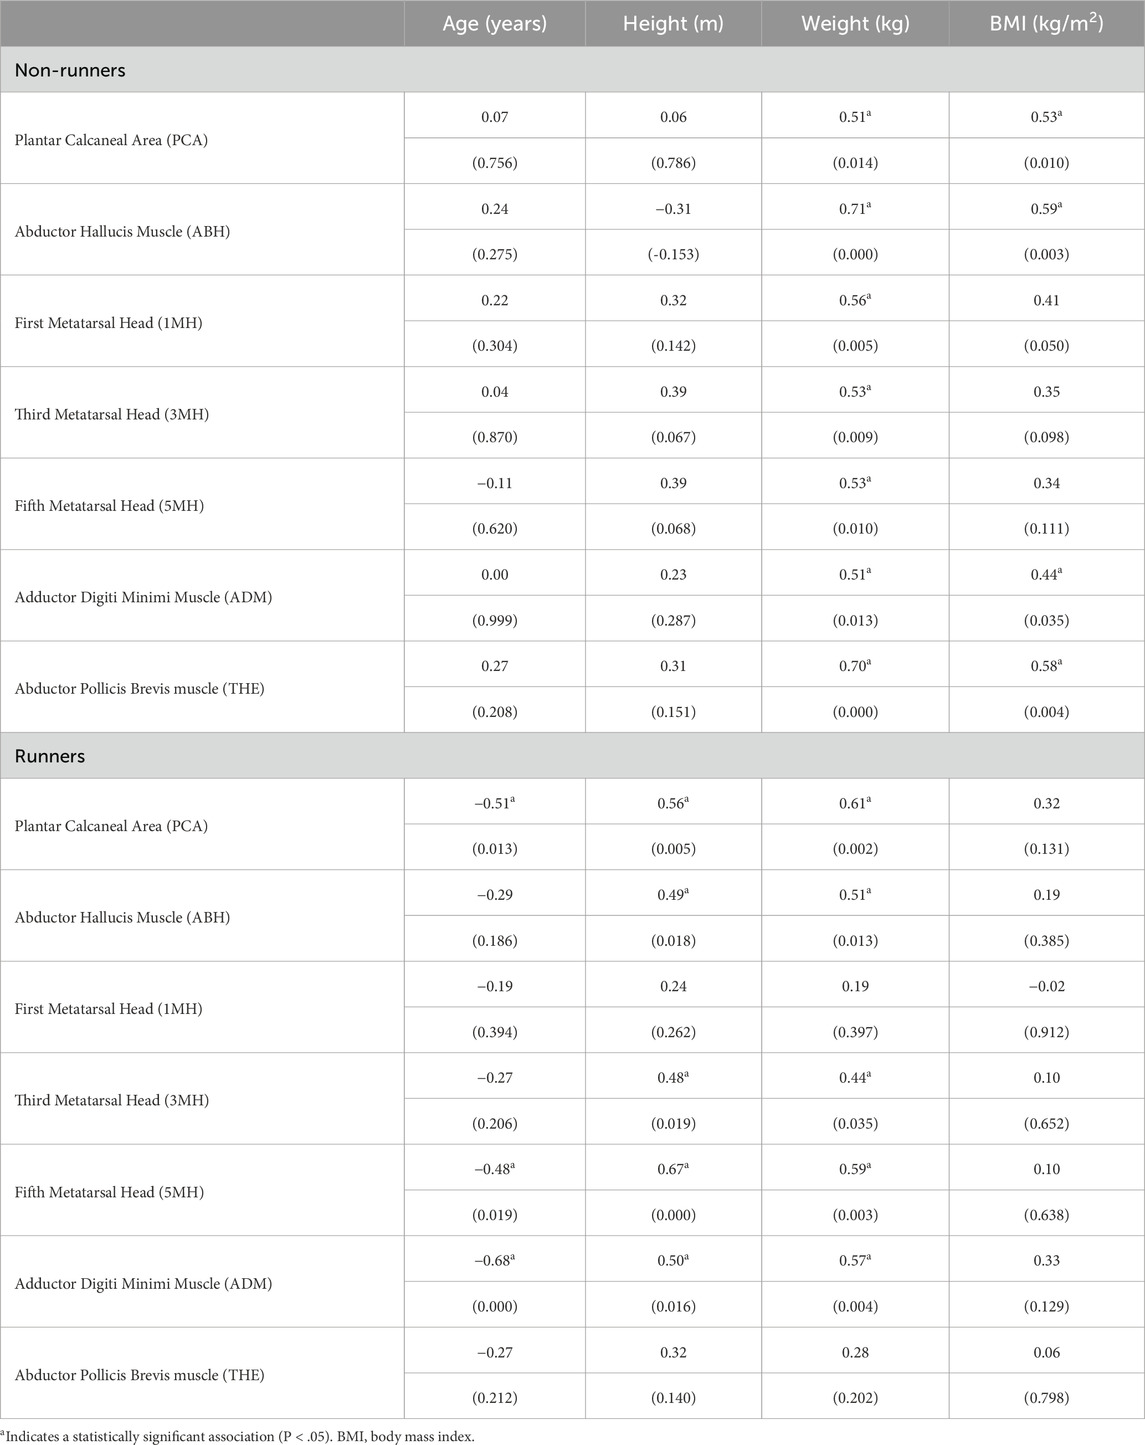
Table 2. Correlation coefficients (P value) among participant characteristics and plantar skin and subcutaneous tissue thickness at sites of the left foot in runners and non-runners (n = 23).
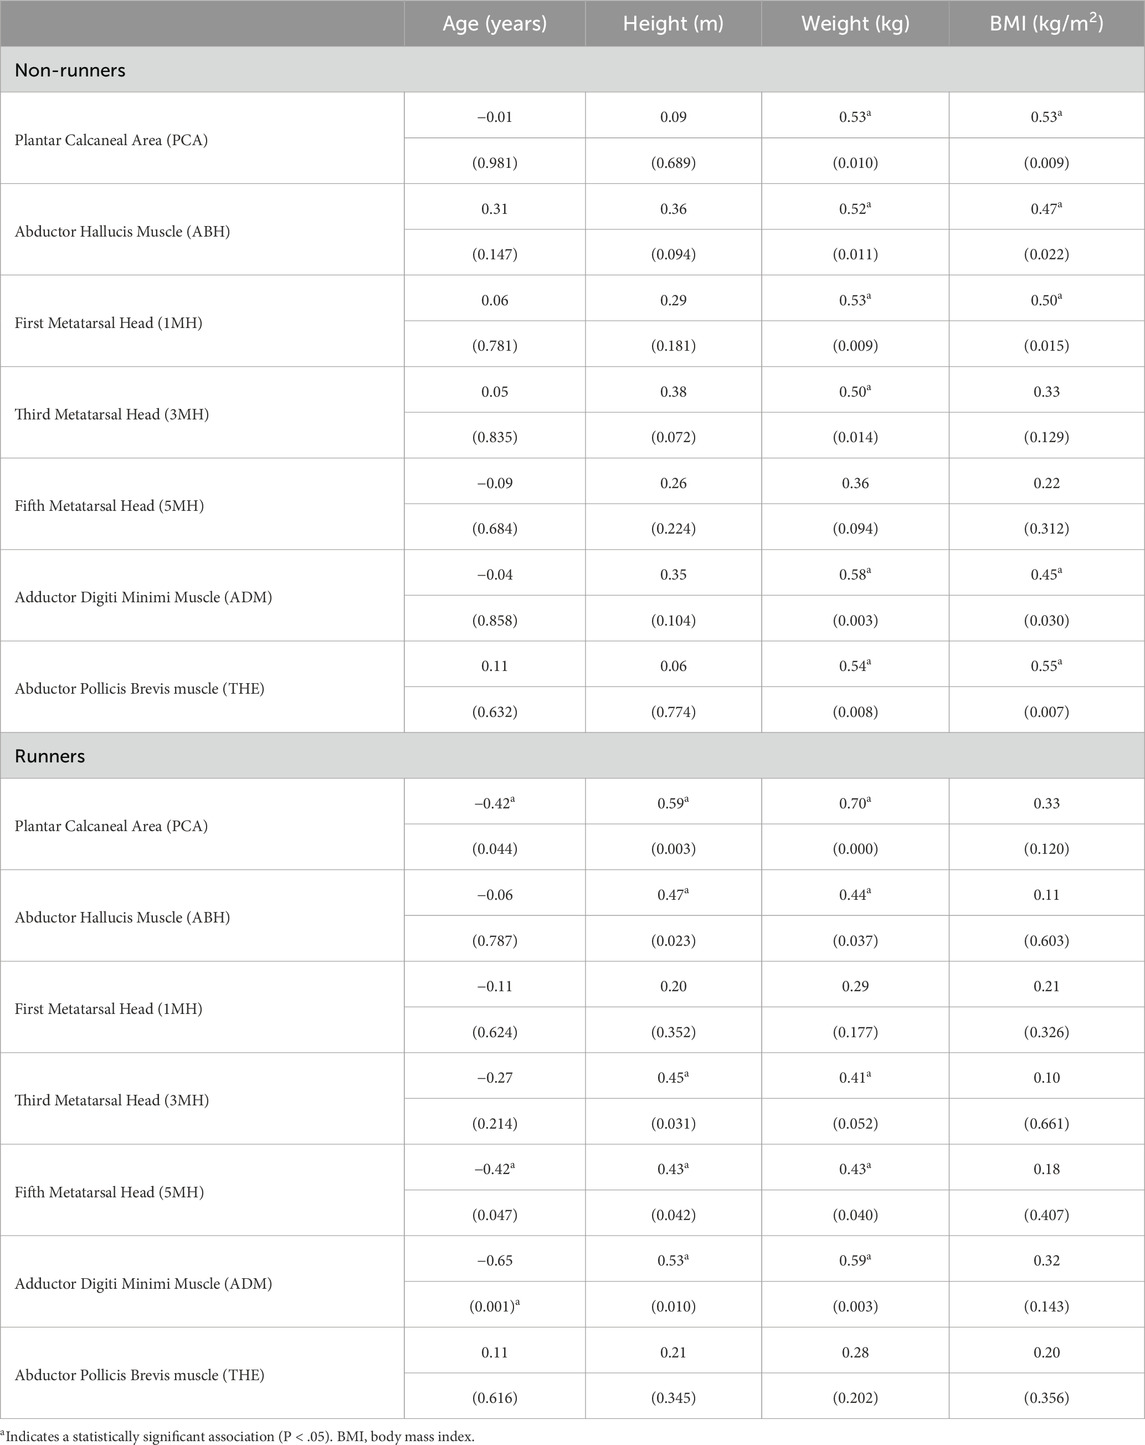
Table 3. Correlation coefficients (P value) among participant characteristics and plantar skin and subcutaneous tissue thickness at sites of the right foot in runners and non-runners (n = 23).
3.3 Mechanical pressure-pain thresholds
The mean loading rate across all groups, limbs and sites was 27 ± 1 kPa/s. Table 4 shows mean PPT values measured at the hand (THE) and plantar foot in runners and non-runners. The ANOVA model demonstrated a significant main effect for group on PPT values (F1,43 = 4.6, P = 0.038). Post hoc analysis revealed that mean PPT values of runners were, on average, 24% higher than those of non-runners across all sites [mean difference (95%CI) = 90.0 kPa (5.1, 174.8), P < 0 .05]. There was also a significant main effect for site on PPT values (F3.2, 139.9 = 82.5, P < 0.001). The mean PPT measured at the THE was significantly lower than that measured at all plantar foot sites (range, −36.9 − −5.1 kPa), irrespective of group. In considering only plantar sites of the foot, the mean PPT determined at the ABH was also significantly lower (range, −31.7 − −6.2 kPa) across groups, and the PCA significantly higher (range, 18.6–31.7 kPa), than that measured at all other foot sites (P < 0.05). Mean PPTs determined at the 1MH were also significantly lower than those measured at 3MH [mean difference (95%CI) = −5.1 kPa (−8.8, −1.4)], 5MH [mean difference (95%CI) = −7.0 kPa (−12.4 − −1.7)], and ADM [mean difference (95%CI) = −6.1 kPa (−11.8, −0.4)]. There were no significant between-site differences in PPT values measured at 3MH, 5MH and ADM. Similarly, there was no significant main effect for limb nor interaction effects between group, limb and site.

Table 4. Mean (SD) pressure-pain threshold values (kPa) for runners and non-runners.
Figure 2 demonstrates mean PPT values in each limb of runners and non-runners as a function of skin and subcutaneous tissue thickness. In general, the data were best fit by the logit function, which had the lowest AIC compared to polynomial fits and R2 values of 88%–95% (Table 5). The logit function supports the observed findings with a heightened β3 coefficient (elevated PPT) and lower β2 coefficient (reduced maximum skin and subcutaneous tissue thickness) in runners than non-runners.

Figure 2. Mean pressure-pain thresholds of the plantar sole of the left (dashed line) and right foot (solid line) in active runners (red shading) and non-runners (black shading) presented as a function of the thickness of the skin and subcutaneous tissues. Error bars represent standard error. Data was best fit by a logit model (R2, 88%–95%).
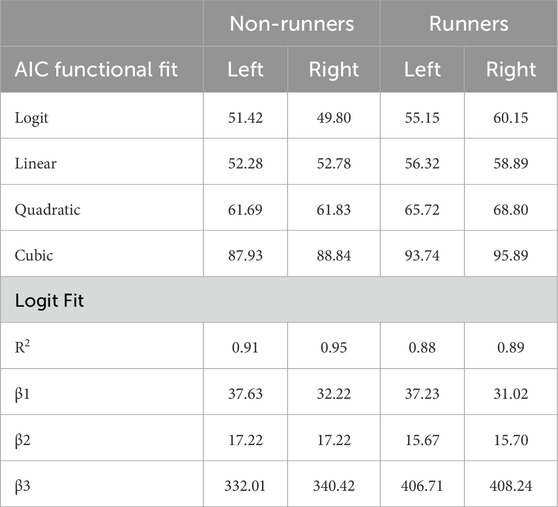
Table 5. Akiake’s Information Criterion (AIC) for logit and polynomial fits of pressure-pain thresholds in limbs of runners and non-runners as a function of tissue thickness. Coefficients and r-squared values for goodness of the logit are also shown.
With the exception of fatigue, which was modestly, though negatively, correlated with PPTs at the PCA of both the left (r = −0.45, P < 0.030) and right (r = −0.47, P < 0.022) feet of runners, univariate correlations revealed no other significant associations among PPTs, anthropometric variables and self-reported health-related quality of life in either group.
3.4 Normalized pressure-pain thresholds
Table 6 shows PPT values at plantar foot sites following normalization to PPT values at the hand (THE) in runners and non-runners. In contrast to raw PPT values, there was no significant main effect for group on normalized PPT values. There was, however, a significant main effect for site on normalized PPT values (F3, 132 = 73.9, P < 0.001). Differences in normalized PPT showed the same pattern between sites as raw PPT values. Mean normalized PPT values at the ABH were significantly lower (range, −1.20 − −0.24), and those at the PCA significantly higher (range, 1.20–0.70), than that measured at all other foot sites (P < 0.05). Normalized PPTs determined at the 1MH were also significantly lower than those measured at 3MH [mean difference (95%CI) = −0.19 (−0.33, −0.04), P < 0.05], 5MH [mean difference (95%CI) = −0.26 (−0.45 − −0.08), P < 0.05], and ADM [mean difference (95%CI) = −0.25 (−0.44, −0.06), P < 0.05]. There were no significant between-site differences in normalized PPT values measured at 3MH, 5MH and ADM. Similarly, there was no significant main effect for limb or interaction effects between group, limb and site.
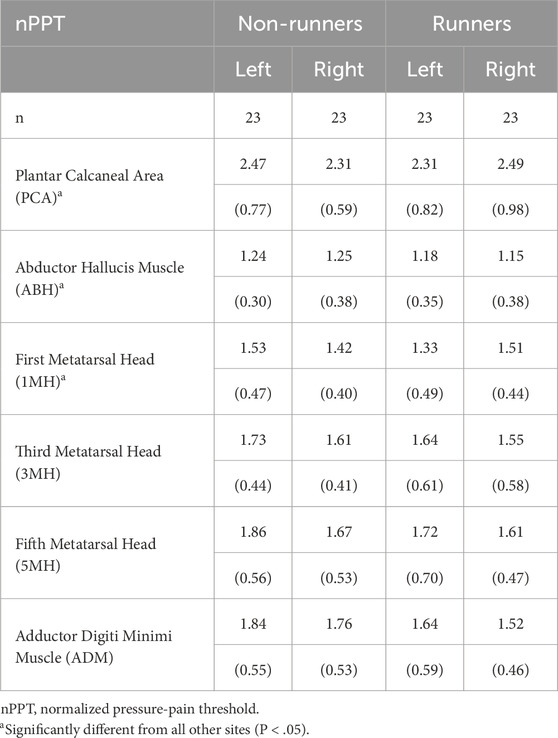
Table 6. Pressure-pain threshold values normalized to hand values in runners and non-runners.
Figure 3 shows normalized PPT values in each group as a function of skin and subcutaneous tissue thickness. Normalization of PPTs of the plantar foot to those of the THE reduced the overall accuracy of the fit (R2 range, 53%–69%) and, as expected, primarily affected the β1, and to a lesser extent, β3 coefficients, which govern the overall gain and offset of the fit, respectively. There was negligible effect of normalization of PPTs on the β2 coefficient (Table 7).
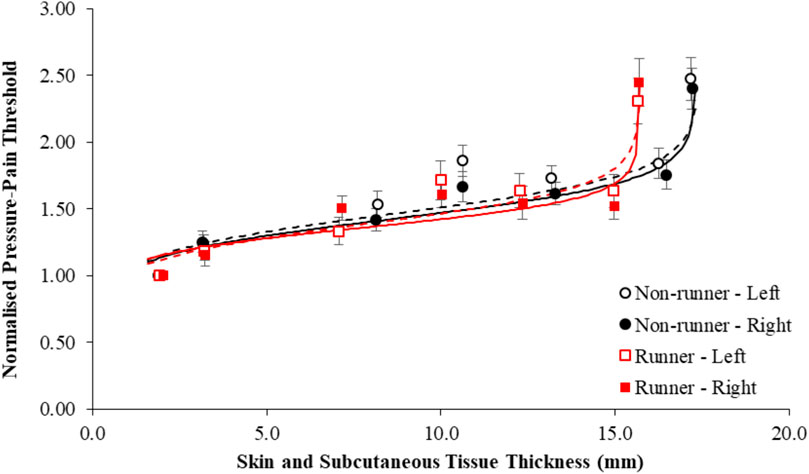
Figure 3. Mean pressure-pain thresholds of the plantar sole of the left (dashed line) and right foot (solid line) normalized to those of the hand in active runners (red shading) and non-runners (black shading) and presented as a function of the thickness of the skin and subcutaneous tissues. Error bars represent standard error. Data was best fit by a logit model (R2, 53%–69%).
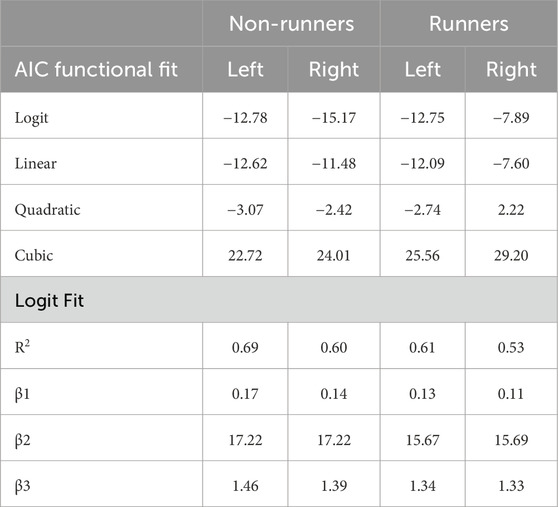
Table 7. Akiake’s Information Criterion (AIC) for logit and polynomial fits of normalized pressure-pain thresholds as a function of tissue thickness in limbs of runners and non-runners. Coefficients and r-squared values for goodness of the logit are also shown.
There were no significant correlations among normalized PPTs and anthropometric or health-related quality of life variables at any site in either group.
4 Discussion
This study evaluated the mechanical pressure-pain sensitivity of the plantar surface of the foot in competitive distance runners and non-runners. Mean PPT values at plantar foot sites in both groups span the broad range of values (273–947 kPa) cited for healthy adults measured using probes of the same contact area and with comparable loading rates (Hodge et al., 2009; Tornero-Caballero et al., 2016; Wu et al., 2024; Madeleine et al., 2014; Ríos-León et al., 2019). However, despite significantly thinner plantar subcutaneous tissues, trained distance runners were found to have systematically higher PPTs, bilaterally, and hence lower mechanical pain sensitivity, at all sites of the plantar foot, and thenar eminence of the hand, than non-runners. The standardized mean difference in PPTs between runners and non-runners in the current study (Hedge’s g = 0.76), reflects a moderate-to-large effect and is comparable to the magnitude of the widespread hypoalgesia (Hedge’s g, 0.40–0.69) reported previously in meta-analyses involving a wide range of athletes, across a broad range of test sites (Thornton et al., 2024; Tesarz et al., 2012). Although beyond the scope of the current study, the mechanism underpinning the widespread mechanical hypoalgesia in athletes is not entirely understood. Physical, physiological and psychological factors have been suggested to influence PPTs in athletes (Thornton et al., 2024; Lemley et al., 2015), including exercise induced hypoalgesia, in which both heightened pain inhibitory and lowered pain facilitatory pathways have been commonly, though variably, implicated using condition-pain modulation and temporal-summation paradigms, respectively (Vaegter and Jones, 2020). As noted by Vaegter et al. (2020); Vaegter et al. (2014), hypoalgsia induced by exercise and the condition-pain modulation paradigm may reflect opioidergic as well as nonopioidergic mechanisms, such as arterial baroreceptor inhibition (Ring et al., 2008), as well as altered psychological states (Pettersen et al., 2020), the recruitment of high threshold motor units (Hoeger Bement et al., 2008), and/or activation of the primary motor cortex (Jin et al., 2023). Indeed, research involving functional magnetic resonance imaging and electroencephalography has shown differences in the neural processing of nociceptive information between endurance athletes and non-athletes (Ge et al., 2021; Anders et al., 2023), while conditioned pain modulation protocols typically suggest athletes may have more effective endogenous inhibition (Flood et al., 2017; Geisler et al., 2020). Hence centrally, rather than peripherally, mediated pathways are currently thought to underpin mechanical hypoalgesia in athletes. The finding that topographical pressure-pain sensitivity in the feet and hands is systematically heightened in healthy runners in the current study lends further support to current dogma. However, further research involving temporal summation and condition pain modulation paradigms is needed to ascertain the potential contribution of facilitatory and inhibitory pathways to the widespread hypoalgesia observed at the plantar foot in runners observed in the current study.
In considering alternate explanations that may underpin the widespread mechanical hypoalgesia observed in runners in the current study, it is important to note that runners were found to differ with respect to non-runners in at least two key ways. First, runners in the current study reported significantly lower levels of anxiety, as determined by the PROMIS-29, than non-runners. The PROMIS-29 uses standardised T-scores, indicating that, in the current study, runners had lower levels of anxiety than the general population. The mean difference between groups exceeded the minimally important difference (4 points) reported for the questionnaire (Kroenke et al., 2019). Hence, the lower levels of anxiety in runners are likely to be clinically meaningful. Regular physical activity, including running, has been shown to improve mood states, and lower anxiety in healthy populations and in certain groups with chronic-pain (Oswald et al., 2020; Pereira et al., 2021; Bustamante et al., 2025; Wu et al., 2025). There is even evidence, that amongst runners, those who participate in a similar training profile to that of runners in the current study (regular competition in 10 km races and training at least 3 days a week), have the lowest scores for cognitive and somatic anxiety of all runners (Prieto and González-García, 2022). Whether the multidimensional construct of anxiety might influence mechanical pain sensitivity, however, is not clear. Although there is some evidence that mechanical pressure sensitivity may be related to symptoms of heightened stress in young adults (Waller et al., 2016; Waller et al., 2020), there is also evidence from animal and human studies that heightened anxiety leads to increased pain reactivity, while fear results in decreased reactivity. Racine et al. (2012), in a systematic review of 129 research articles, found the association between pressure-pain sensitivity and various measures of anxiety and depression to be largely inconsistent and contradictory with regard to their direction across outcome measures. Moreover, in the current study, we observed no significant associations between anxiety and PPTs at any site in either group. Rather curiously, however, we did observe a modest, though negative, correlation between self-reported fatigue and PPTs at the heel, bilaterally, but only in the group of runners. While there is emerging evidence that the reporting of symptoms of fatigue may be genetically linked with symptoms of negative affect, such as anxiety, and somatic complaints (Vassend et al., 2018), there is also some, albeit limited, evidence that pressure-pain thresholds beneath the PCA may be modestly reduced in healthy adults (Hedge’s g = 0.41) following a physically fatiguing, 3-h mountain trek (Barzegar et al., 2023) and that running-induced fatigue can lead to increased loading beneath the heel in rearfoot footstrikers (Hamzavi and Esmaeili, 2021).
The second point of difference between runners and non-runners in this study, was that all runners in the current study were within a “normal weight” range, while non-runners were significantly heavier, with a BMI that ranged from “normal weight” through to “Obese Class II” (WHO Expert Consultation, 2004). Overweight and obesity have been widely suggested to alter pain and somatosensory processing in humans (Walsh et al., 2018). While experimental evidence regarding pain sensitivity and adiposity is mixed (Vervullens et al., 2022), exigent research suggests that obesity is associated with heightened mechanical pain sensitivity (lowered PPTs) (Xiong et al., 2011; Tashani et al., 2017), while others have shown that greater fat free (lean) body mass is associated with lowered mechanical pain sensitivity (heightened PPTs), albeit generally in healthy, older adults (Johnson et al., 2024; Peterson et al., 2022), and in those with musculoskeletal pathology (Sylwander et al., 2021; Ferreira et al., 2022; Meert et al., 2024). Hence, it is possible that the differences observed in PPTs between runners and non-runners in the current study reflect differences in body composition between groups. It should be noted, however, that we found no significant correlations between BMI and PPT at any of the sites evaluated in either group. Moreover, as cautioned by Tashani et al. (2017) it is likely that the interaction between body composition and mechanical pain sensitivity may vary between body sites and with different stimulus types and intensities. To date, few studies have investigated the effect of body composition on mechanical pain sensitivity maps of the plantar aspect of the foot. However, it is noteworthy, that research evaluating pressure-discomfort thresholds, which might be considered a precursor to pain (Hodge et al., 2009; Johansson et al., 1999), have reported the opposite effect, in which obese individuals were found to have higher mechanical discomfort thresholds than the non-obese, but only beneath the heel, midfoot and first metatarsal head (Dueñas et al., 2021). Interestingly, the subcutaneous tissue at these sites typically demonstrates higher mechanical and electrical resistance (Frahm et al., 2013; Guo et al., 2023), and the heel and first metatarsal head are reportedly exposed to greater increases in principal stress during changes in speeds from walking to running (Mei et al., 2020; Rosenbaum et al., 1994). It is also noteworthy that in the current study, subcutaneous tissues at these same sites were significantly thicker in non-runners and were modestly, though positively, correlated with BMI (r = 0.41–0.52, P < 0.05), but only in non-runners where there was a greater range of BMI values. As noted by Finocchietti et al. (2011), a thicker superficial adipose tissue layer results in lower principal stress in deep tissue. Non-runners in the current study might, therefore, be expected to have artificially inflated PPTs at these sites, and hence, show less difference to runners than at other sites where differences in skin and thickness were less pronounced, such as the THE. As shown in Figure 2, this was not the case. Thus, while between-groups differences in the material properties of the skin and subcutaneous cannot be ruled out, we propose the hypoalgesic bias observed in runners most likely reflects a centrally mediated effect. Nonetheless, whether the widespread hypoalgesia observed in runners is best explained in terms of sensory differences or reflects a change as to what a runner considers painful requires further research. Based on the findings of the current study, future research directed toward unravelling potential relationships among body composition, psychological health, fatigue, tissue properties and mechanical pain sensitivity of the foot sole appears to be warranted.
Despite differences in the absolute magnitude of PPTs between groups, the current study observed a similar topographical pressure-pain sensitivity pattern in both runners and non-runners. Consistent with previous studies (Hodge et al., 2009; Xiong et al., 2011; Xiong et al., 2013; Weerasinghe et al., 2016; Tornero-Caballero et al., 2016; Wu et al., 2024; Ríos-León et al., 2019; Messing and Kilbom, 2001), the plantar heel (PCA) was observed to have the highest PPT in both groups, and hence the lowest sensitivity to deep pressure pain of all foot sites. Interestingly, mean PPTs observed beneath the heel of non-runners in the current study are approximately twice the peak principal stress reported beneath the heel during barefoot walking (≈250–300 kPa) at preferred speeds (≈1.0–1.3 m/s), but are only marginally higher (≈12%) than the peak stress reported beneath the heel during shod walking (≈500 kPa) (Mei et al., 2020; Wearing et al., 2009). Mean PPTs beneath the heel of runners, in contrast, are marginally lower (≈13%) than the peak stress reported beneath the heel during shod running (≈800 kPa) at preferred speed (3.0 m/s) (Mei et al., 2020). Hence, it would appear that PPTs beneath the heel are closely matched to the peak pressures that repeatedly occur with the predominant activity undertaken by each group.
In contrast to the heel, pressure-pain sensitivity was greatest for the soft tissues overlying the ABH and 1MH (Ríos-León et al., 2019). The observation of a proximal-to-distal and to a lesser extent lateral-to-medial increase in pain sensitivity across the foot sole in the current study is consistent with previous research (Ríos-León et al., 2019), and, in part, mirrors the spatial distribution reported for plantar tactile sensitivity of the foot sole in healthy adults (Dueñas et al., 2021). Spatial differences in the mechanical pain sensitivity are thought to reflect a number of peripheral factors, including the density and firing sensitivity of the deep nociceptive afferents, and the thickness and mechanical properties of the overlying plantar tissue, in addition to central pain processing mechanisms (Rodrigo et al., 2013; Vervullens et al., 2022). Although reports from microneurographic studies vary in regard to the distribution, and density of sensory afferents (Kennedy and Inglis, 2002; Corniani and Saal, 2020; Fallon et al., 2005; Strzalkowski et al., 2015b), exigent evidence currently suggests an innervation-density gradient exists across the plantar surface of the foot, which increases from proximal to distal, and to a lesser extent from medial to lateral (Kennedy and Inglis, 2002; Strzalkowski et al., 2018). While heightened innervation densities and/or excitability of mechanosensitive nociceptors are broadly believed to increase the probability of sensory activation and pain perception, differences in the thickness and mechanical properties of the skin and subcutaneous tissues are, in turn, thought to influence the mechanotransductional environment of deep tissue nociceptors (Fleckenstein et al., 2017; Strzalkowski et al., 2015a; Finocchietti et al., 2011; Melia et al., 2019).
Skin and superficial subcutaneous tissues are known to be inhomogeneous, anisotropic, and multilayered materials, which are typically in pre-stressed state, and demonstrate non-linear deformation with loading (Finocchietti et al., 2011). It is perhaps not surprising, therefore, that the relationship between PPTs and skin and superficial subcutaneous tissue thickness observed in the current study was also highly non-linear in both runners and non-runners (Figure 1). In a three-dimensional finite-element model, in which these overlaying tissues were modeled as homogeneous and hyper-elastic, Finocchietti et al. (2011) demonstrated that thicker subcutaneous tissue layers resulted in more localized and lower internal tissue stress and strain within deeper tissue and, hence, heightened PPTs. Similarly, harder skin and subcutaneous tissue layers have been shown to evoke heightened sensory and perception thresholds (Strzalkowski et al., 2015a; Strzalkowski et al., 2015b). Accurate determination of soft tissue properties, however, is challenging. Studies using standard indentometry to evaluate both PPT and tissue hardness in vivo have shown the PCA to be structurally stiffer than other sites of the plantar foot (Xiong et al., 2013; Weerasinghe et al., 2016; Rodrigo et al., 2013), while other studies incorporating indentation with tissue imaging approaches, have reported the opposite, with the PCA shown to have a lower material stiffness than other plantar foot tissues (Kwan et al., 2010; Chao et al., 2011; Klaesner et al., 2002). Mechanical testing of plantar tissue specimens ex vivo have also shown mixed results, with the material properties of the PCA reportedly higher (Ledoux and Blevins, 2007), lower (Pai and Ledoux, 2010) or no different (Pai and Ledoux, 2011) to that of other plantar tissues. Moreover, PPTs are also thought to be influenced by the mechanical properties of the deeper tissues themselves. For a given stress applied to the surface of the skin, a lower peak strain is evoked in a harder deep tissue than a softer tissue, and, as a consequence, higher pressure stimulation intensities are required to reach the strain dependent pain threshold (Finocchietti et al., 2011). Indeed, PPTs of the plantar surface of the foot have been shown to be positively correlated (r = 0.63–0.98) with indentation-based measures of secondary tissue stiffness or hardness under specified testing conditions (Xiong et al., 2013; Weerasinghe et al., 2016; Rodrigo et al., 2013). Given the obvious challenges in defining the mechanical properties of plantar tissues in vivo, it is interesting to note that, similar to sensitivity to light touch (Strzalkowski et al., 2015a), PPT values in both runners and non-runners in the current study could be effectively modelled as a function of the relative plantar tissue thickness, in this case using a simple logit function.
Logit functions have been widely used in value-based decision making models in marketing, economics and transportation for more than 50 years, and models decisions as a sum of weighted factors to yield the log odds (Coskunoḡl et al., 1985). More recently, the approach has also been used to describe choices related to multiple factors in both humans and animals, including sensory input and multisensory integration (Carandini, 2024). It is interesting to note that the observed bias in PPT between runners and non-runners in the current study, was primarily related to the β3 coefficient, which governs the offset in PPT, as opposed to the β1 and β2 coefficients which reflect the overall gain in PPT, and the sigmoidal shape of the curve as a function of relative tissue thickness, respectively. Although speculative, given the cross-sectional design of the current study, it is possible that the hypoalgesic offset might reflect a long-term mechanical adaptation or habituation of nociceptors to ambient stimulation levels associated with repeated foot impacts in runners. In support, animal and human studies have typically shown that net somatosensory activity is progressively reduced with repeated exposure to familiar stimuli, which is thought to aid in sensory discrimination and minimize sensitization and may be either peripherally- or centrally-mediated (Dobler et al., 2024; Barros-Zulaica et al., 2019; Klöcker et al., 2016; Graczyk et al., 2018; Brenner et al., 2000). The observations that PPTs at all test sites were heightened in runners and that normalization of PPTs of the foot to those of the hand effectively mitigated the hypoalgesic offset in runners but without influencing the shape of the PPT-tissue-thickness function, as denoted by β2 coefficients, further suggests that centrally-mediated processes may prevail in runners over differences in peripheral factors related to the structural and mechanical properties of the skin and subcutaneous tissue, per se. Moreover, it would appear that any centrally- or peripherally-mediated effect that may account for the bias in pain sensitivity between groups, does not substantively alter the spatial distribution pattern of PPTs across the plantar aspect of the foot. It is also worth noting that β2 coefficients in this study were always within 50 microns of measures of skin and subcutaneous tissue thickness at the PCA, which falls well within expected measurement error of sonographic-based measures of tissue thickness, and suggests that the material properties of plantar tissue across foot sites were relatively uniform.
Consistent with previous research, we also observed that the THE of the palmar hand was more sensitive to mechanical pain than the plantar foot (Rolke et al., 2005), with PPTs ranging from 40% to 80% of those of the plantar foot; presumably, reflecting its lower tissue thickness and greater innervation density (Kennedy and Inglis, 2002; Strzalkowski et al., 2018). While the models demonstrated adequate fit for each limb, it should be noted that normalization not only lowered the overall range of PPT values in runners but also reduced the overall accuracy of the fit, suggesting that there are minor site-specific differences between palmar and plantar foot innervation in runners and non-runners. We specifically normalized plantar foot values to those of the THE given its ease of accessibility, its remote, non-weight-bearing location and that the thickness of the skin and subcutaneous tissue at the site is minimal but also comparable between groups. Although such remote sites are commonly evaluated clinically, to aid in the evaluation of peripheral versus centralized pain (Eckenrode et al., 2019), their use in the normalization of PPT values has received comparatively little scientific attention. Of the few studies that have been undertaken, normalization of PPT values to remote sites tended to show greater sensitivity and less temporal drift over the short term than absolute values and greater stability over time (Rolke et al., 2005; Kosek et al., 1993; Fredriksson et al., 2000). Here, we show that it may also be a useful and relatively quick method for ensuring homogenous comparator groups in case-control studies in which comparisons in pressure-pain sensitivity of the plantar foot are planned.
As with all research, this study has a number of limitations and delimitations. Chiefly, while the cross-sectional nature of the current study effectively allowed for the evaluation of differences in topographic pressure sensitivity of the plantar foot in runners and non-runners, the design does not allow for conclusions regarding potential cause-and-effect to be made. Thus, it is unknown whether the bilateral hypoalgesia observed at the sole of the feet of runners in this study reflects an adaptive response to endurance running or whether it preceded the uptake of endurance running in the study cohort. Similarly, this study did not quantify the running history and training loads of runners in detail, nor measure all of the physiological and psychological factors that have been suggested to influence PPTs in athletes (Lemley et al., 2015). Moreover, the current study specifically explored the role of relative skin and subcutaneous tissue thickness rather than the material properties of these tissues, given challenges associated with the accurate quantification of soft tissue properties in vivo and the current limitations associated with the use of elastographic and indentation-based methods to estimate the viscoelastic properties of tissues (Chatzistergos et al., 2022; Oddes and Solav, 2023; Wearing et al., 2024). Given the current findings, however, it is recommended that future prospective research evaluate the temporal relationship of topographical pressure sensitivity maps of the hands and feet with estimates of running history, training load, psycho-physiological factors, and the relative thickness and material stiffness of the plantar tissues in trained, endurance runners and non-runners as well as in endurance athletes involved in largely non-weightbearing sports, such as swimming.
In conclusion, the current study has demonstrated that, despite having thinner plantar soft tissues than healthy non-runners, endurance runners demonstrate systematically higher PPTs beneath all sites of the foot, and at the thenar eminence of the hand. The hypoalgesic bias in plantar foot PPTs in active runners and topographical variation in PPTs observed across the plantar aspect of the foot in both groups can be effectively modelled as a function of relative plantar tissue thickness, using a simple three-component logit model. Moreover we show, for the first time, that the hypoalgesic bias in runners may be mitigated through the normalization of pedal PPT values to those of the thenar eminence of the hand, without appreciably altering the overall shape of the logit function.
Data availability statement
The raw data supporting the conclusions of this article will be made available by the authors, without undue reservation.
Ethics statement
The studies involving humans were approved by the University Human Research and Ethics Committe (UHREC). The studies were conducted in accordance with the local legislation and institutional requirements. The participants provided their written informed consent to participate in this study.
Author contributions
CG: Formal Analysis, Writing – review and editing, Data curation, Conceptualization, Writing – original draft, Investigation. TW: Resources, Validation, Formal Analysis, Funding acquisition, Project administration, Supervision, Writing – original draft, Methodology, Software, Conceptualization, Writing – review and editing. NS: Formal Analysis, Data curation, Software, Visualization, Writing – original draft, Writing – review and editing. WK: Writing – original draft, Formal Analysis, Writing – review and editing. SW: Data curation, Conceptualization, Writing – original draft, Methodology, Validation, Visualization, Investigation, Supervision, Funding acquisition, Formal Analysis, Software, Writing – review and editing, Project administration, Resources.
Funding
The author(s) declare that financial support was received for the research and/or publication of this article. This research received external funding from the Queensland Academy of Sport.
Acknowledgments
We thank Dr. James Smeathers and Dr. Sue Hooper for their assistance with preparation of the manuscript and Simon Riviere for his contribution to the design and production of the illustrations.
Conflict of interest
The authors declare that the research was conducted in the absence of any commercial or financial relationships that could be construed as a potential conflict of interest.
Generative AI statement
The author(s) declare that no Generative AI was used in the creation of this manuscript.
Any alternative text (alt text) provided alongside figures in this article has been generated by Frontiers with the support of artificial intelligence and reasonable efforts have been made to ensure accuracy, including review by the authors wherever possible. If you identify any issues, please contact us.
Publisher’s note
All claims expressed in this article are solely those of the authors and do not necessarily represent those of their affiliated organizations, or those of the publisher, the editors and the reviewers. Any product that may be evaluated in this article, or claim that may be made by its manufacturer, is not guaranteed or endorsed by the publisher.
References
Anders M., Dreismickenbecker E., Fleckenstein J., Walter C., Enax-Krumova E. K., Fischer M. J. M., et al. (2023). Eeg-based sensory testing reveals altered nociceptive processing in elite endurance athletes. Exp. Brain Res. 241 (2), 341–354. doi:10.1007/s00221-022-06522-4
Barros-Zulaica N., Villa A. E. P., Nuñez A. (2019). Response adaptation in barrel cortical neurons facilitates stimulus detection during rhythmic whisker stimulation in anesthetized mice. eNeuro 6 (2), 0471–18.2019. doi:10.1523/ENEURO.0471-18.2019
Barzegar B. M., Barati A. H., Haghgighi M. (2023). The effect of fatigue on the pain threshold in the soles of the feet of mountaineers before and after a mountaineering session. Asian J. Sports Med. 14 (3), e134651. doi:10.5812/asjsm-134651
Bland J. M., Altman D. G. (1996). Measurement error. BMJ 313 (7059), 744. doi:10.1136/bmj.313.7059.744
Brenner N., Bialek W., de Ruyter van Steveninck R. (2000). Adaptive rescaling maximizes information transmission. Neuron 26 (3), 695–702. doi:10.1016/s0896-6273(00)81205-2
Brennum J., Kjeldsen M., Jensen K., Jensen T. S. (1989). Measurements of human pressure-pain thresholds on fingers and toes. Pain Med. 38 (2), 211–217. doi:10.1016/0304-3959(89)90240-6
Bustamante E. E., Brellenthin A. G., Brown D. R., O'Connor P. J. (2025). Up for debate: does regular physical activity really improve mental health? Med. Sci. Sports Exerc 57 (5), 1056–1066. doi:10.1249/mss.0000000000003636
Carandini M. (2024). Sensory choices as logistic classification. Neuron 112, 2854–2868.e1. doi:10.1016/j.neuron.2024.06.016
Case L. K., Liljencrantz J., Madian N., Necaise A., Tubbs J., McCall M., et al. (2021). Innocuous pressure sensation requires a-type afferents but not functional Ριεζο2 channels in humans. Nat. Commun. 12 (1), 657. doi:10.1038/s41467-021-20939-5
Chao C. Y. L., Zheng Y.-P., Cheing G. L. Y. (2011). Epidermal thickness and biomechanical properties of plantar tissues in diabetic foot. Ultrasound Med. and Biol. 37 (7), 1029–1038. doi:10.1016/j.ultrasmedbio.2011.04.004
Chatzistergos P. E., Allan D., Chockalingam N., Naemi R. (2022). Shore hardness is a more representative measurement of bulk tissue biomechanics than of skin biomechanics. Med. Eng. Phys. 105, 103816. doi:10.1016/j.medengphy.2022.103816
Corniani G., Saal H. P. (2020). Tactile innervation densities across the whole body. J. Neurophysiol. 124 (4), 1229–1240. doi:10.1152/jn.00313.2020
Coskunoḡlu O., Hansotia B. J., Shaikh M. A. (1985). A New logit model for decision making and its application. J. Operational Res. Soc. 36, 35–41. doi:10.1057/jors.1985.5
Dobler Z., Suresh A., Chari T., Mula S., Tran A., Buonomano D. V., et al. (2024). Adapting and facilitating responses in mouse somatosensory cortex are dynamic and shaped by experience. Curr. Biol. 34 (15), 3506–21.e5. doi:10.1016/j.cub.2024.06.070
Dueñas L., Arnal-Gómez A., Aparicio I., Balasch-Bernat M., López-Bueno L., González J. C., et al. (2021). Influence of age, gender and obesity on pressure discomfort threshold of the foot: a cross-sectional study. Clin. Biomech. 82, 105252. doi:10.1016/j.clinbiomech.2020.105252
Eckenrode B. J., Kietrys D. M., Stackhouse S. K. (2019). Pain sensitivity in chronic achilles tendinopathy. Int. J. Sports Phys. Ther. 14 (6), 945–956. doi:10.26603/ijspt20190945
Fallon J. B., Bent L. R., McNulty P. A., Macefield V. G. (2005). Evidence for strong synaptic coupling between single tactile afferents from the sole of the foot and motoneurons supplying leg muscles. J. Neurophysiol. 94, 3795–3804. doi:10.1152/jn.00359.2005
Fernandez-Lao C., Galiano-Castillo N., Cantarero-Villanueva I., Martin-Martin L., Prados-Olleta N., Arroyo-Morales M. (2016). Analysis of pressure pain hypersensitivity, ultrasound image, and quality of life in patients with chronic plantar pain: a preliminary study. Pain Med. 17 (8), 1530–1541. doi:10.1093/pm/pnv022
Ferreira A. S., Lack S., Taborda B., Pazzinatto M. F., de Azevedo F. M., De Oliveira S. D. (2022). Body fat and skeletal muscle mass, but not body mass index, are associated with pressure hyperalgesia in young adults with patellofemoral pain. Braz J. Phys. Ther. 26 (4), 100430. doi:10.1016/j.bjpt.2022.100430
Finocchietti S., Mørch C. D., Arendt-Nielsen L., Graven-Nielsen T. (2011). Effects of adipose thickness and muscle hardness on pressure pain sensitivity. Clin. J. Pain 27 (5), 414–424. doi:10.1097/AJP.0b013e31820c5353
Fischer A. A. (1987). Pressure algometry over normal muscles. Standard values, validity and reproducibility of pressure threshold. Pain 30 (1), 115–126. doi:10.1016/0304-3959(87)90089-3
Fleckenstein J., Simon P., Konig M., Vogt L., Banzer W. (2017). The pain threshold of high-threshold mechanosensitive receptors subsequent to maximal eccentric exercise is a potential marker in the prediction of doms associated impairment. PLoS One 12 (10), e0185463. doi:10.1371/journal.pone.0185463
Flood A., Waddington G., Thompson K., Cathcart S. (2017). Increased conditioned pain modulation in athletes. J. Sports Sci. 35 (11), 1066–1072. doi:10.1080/02640414.2016.1210196
Frahm K. S., Mørch C. D., Grill W. M., Andersen O. K. (2013). Experimental and model-based analysis of differences in perception of cutaneous electrical stimulation across the sole of the foot. Med. Biol. Eng. Comput. 51 (9), 999–1009. doi:10.1007/s11517-013-1079-9
Fredriksson L., Alstergren P., Kopp S. (2000). Absolute and relative facial pressure-pain thresholds in healthy individuals. J. Orofac. Pain 14 (2), 98–104.
Geisler M., Ritter A., Herbsleb M., Bar K. J., Weiss T. (2021). Neural mechanisms of pain processing differ between endurance athletes and nonathletes: a functional connectivity magnetic resonance imaging study. Hum. Brain Mapp. 42 (18), 5927–5942. doi:10.1002/hbm.25659
Geisler M., Herbsleb M., Bar K. J., Weiss T. (2020). Dissociation of endogenous pain inhibition due to conditioned pain modulation and placebo in male athletes versus nonathletes. Front. Psych. 11, 553530. doi:10.3389/fpsyg.2020.553530
Graczyk E. L., Delhaye B. P., Schiefer M. A., Bensmaia S. J., Tyler D. J. (2018). Sensory adaptation to electrical stimulation of the somatosensory nerves. J. Neural Eng. 15 (4), 046002. doi:10.1088/1741-2552/aab790
Graven-Nielsen T. (2022). Mechanisms and manifestations in musculoskeletal pain: from experimental to clinical pain settings. Pain 163 (1 Suppl. l), S29–S45. doi:10.1097/j.pain.0000000000002690
Graven-Nielsen T., Arendt-Nielsen L. (2010). Assessment of mechanisms in localized and widespread musculoskeletal pain. Nat. Rev. Rheumatol. 6 (10), 599–606. doi:10.1038/nrrheum.2010.107
Guo J., He M., Li Z., Cai S., Xiong X., Cheng Z. (2023). Piezoresistivity modeling of soft tissue electrical-mechanical properties: a validation study. Proc. Inst. Mech. Eng. H. 237 (8), 936–945. doi:10.1177/09544119231183545
Hamzavi B., Esmaeili H. (2021). Effects of running-induced fatigue on plantar pressure distribution in runners with different strike types. Gait and Posture 88, 132–137. doi:10.1016/j.gaitpost.2021.05.018
Harris E. F., Smith R. N. (2009). Accounting for measurement error: a critical but often overlooked process. Arch. Oral Biol. 54 (Suppl. 1), S107–S117. doi:10.1016/j.archoralbio.2008.04.010
Haupt E. T., Porter G. M., Charlton T., Thordarson D. (2023). Accuracy of pain tolerance self-assessment versus objective pressure sensitivity. J. Am. Acad. Orthop. Surg. 31 (9), e465–e472. doi:10.5435/JAAOS-D-22-00500
Hodge M. C., Nathan D., Bach T. M. (2009). Plantar pressure pain thresholds and touch sensitivity in rheumatoid arthritis. Foot Ankle Int. 30 (1), 1–9. doi:10.3113/FAI.2009.0001
Hoeger Bement M. K., Dicapo J., Rasiarmos R., Hunter S. K. (2008). Dose response of isometric contractions on pain perception in healthy adults. Med. Sci. Sports Exerc 40 (11), 1880–1889. doi:10.1249/MSS.0b013e31817eeecc
Hohmann E., Reaburn P., Tetsworth K., Imhoff A. (2016). Plantar pressures during long distance running: an investigation of 10 marathon runners. J. Sports Sci. Med. 15 (2), 254–262.
Hong Y., Wang L., Li J. X., Zhou J. H. (2012). Comparison of plantar loads during treadmill and overground running. J. Sci. Med. Sport 15 (6), 554–560. doi:10.1016/j.jsams.2012.01.004
Jin H., Witjes B., Roy M., Baillet S., de Vos C. C. (2023). Neurophysiological Oscillatory markers of hypoalgesia in conditioned pain modulation. Pain Rep. 8 (6), e1096. doi:10.1097/pr9.0000000000001096
Johansson L. L., Kjellberg A., Kilbom A., Hagg G. M. (1999). Perception of surface pressure applied to the hand. Ergon 42 (10), 1274–1282. doi:10.1080/001401399184947
Johnson A. J., Peterson J. A., Vincent H. K., Manini T., Cruz-Almeida Y. (2024). Body composition and body mass index are independently associated with widespread pain and experimental pain sensitivity in older adults: a pilot investigation. Front. Pain Res. 5, 1386573. doi:10.3389/fpain.2024.1386573
Katic N., Siqueira R. K., Cleland L., Strzalkowski N., Bent L., Raspopovic S., et al. (2022). Modeling foot sole cutaneous afferents: footsim. iScience 26 (1), 105874. doi:10.1016/j.isci.2022.105874
Kennedy P. M., Inglis J. T. (2002). Distribution and behaviour of glabrous cutaneous receptors in the human foot sole. J. Physiol. 538 (Pt 3), 995–1002. doi:10.1113/jphysiol.2001.013087
Klaesner J. W., Hastings M. K., Zou D., Lewis C., Mueller M. J. (2002). Plantar tissue stiffness in patients with diabetes mellitus and peripheral neuropathy. Arch. Phys. Med. Rehabil. 83, 1796–1801. doi:10.1053/apmr.2002.35661
Klöcker A., Gueorguiev D., Thonnard J. L., Mouraux A. (2016). Peripheral vs. Central determinants of vibrotactile adaptation. J. Neurophysiol. 115 (2), 685–691. doi:10.1152/jn.00519.2015
Kosek E., Ekholm J., Nordemar R. (1993). A comparison of pressure pain thresholds in different tissues and body regions. Long-term reliability of pressure algometry in healthy volunteers. Scand. J. Rehabil. Med. 25 (3), 117–124. doi:10.2340/165019771993117124
Kroenke K., Baye F., Lourens S. G. (2019). Comparative responsiveness and minimally important difference of common anxiety measures. Med. Care 57 (11), 890–897. doi:10.1097/MLR.0000000000001185
Kwan R. L.-C., Zheng Y.-P., Cheing G. L.-Y. (2010). The effect of aging on the biomechanical properties of plantar soft tissues. Clin. Biomech. 25, 601–605. doi:10.1016/j.clinbiomech.2010.04.003
Ledoux W. R., Blevins J. J. (2007). The compressive material properties of the plantar soft tissue. J. Biomechanics 40, 2975–2981. doi:10.1016/j.jbiomech.2007.02.009
Lemley K. J., Hunter S. K., Bement M. K. H. (2015). Conditioned pain modulation predicts exercise-induced hypoalgesia in healthy adults. Med. Sci. Sports Exerc 47 (1), 176–184. doi:10.1249/MSS.0000000000000381
Lin C. Y., Lin C. C., Chou Y. C., Chen P. Y., Wang C. L. (2015). Heel pad stiffness in plantar heel pain by shear wave elastography. Ultrasound Med. Biol. 41 (11), 2890–2898. doi:10.1016/j.ultrasmedbio.2015.07.004
MacMahon C., Parrington L. (2017). Not all athletes are equal, but don't call me an exerciser: response to Araujo and scharhag. Scand. J. Med. Sci. Sports 27 (8), 904–906. doi:10.1111/sms.12864
Madeleine P., Hoej B., Fernández-de-las-Peñas C., Rathleff M., Kaalund S. (2014). Pressure pain sensitivity changes after usage of shock-Absorbing insoles among young soccer players training on artificial turf: a randomized controlled trial. J. Orthop. Sports Phys. Ther. 44, 587–594. doi:10.2519/jospt.2014.5117
Maemichi T., Tsutsui T., Matsumoto M., Iizuka S., Torii S., Kumai T. (2020). The relationship of heel fat pad thickness with age and physiques in Japanese. Clin. Biomech. 80, 105110. doi:10.1016/j.clinbiomech.2020.105110
McKay A. K., Stellingwerff T., Smith E. S., Martin D. T., Mujika I., Goosey-Tolfrey V. L., et al. (2022). Defining training and performance caliber: a participant classification framework. Int. J. Sports Physiol. Perform. 17 (2), 317–331. doi:10.1123/ijspp.2021-0451
Meert L., Vervullens S., Heusdens C. H. W., Smeets RJEM, Meeus M., Mertens MGCAM (2024). Unravelling relationships between obesity, diabetes, and factors related to somatosensory functioning in knee osteoarthritis patients. Clin. Rheumatol. 43 (8), 2637–2645. doi:10.1007/s10067-024-07022-2
Mei Q., Gu Y., Xiang L., Yu P., Gao Z., Shim V., et al. (2020). Foot shape and plantar pressure relationships in shod and barefoot populations. Biomech. Model Mechanobiol. 19 (4), 1211–1224. doi:10.1007/s10237-019-01255-w
Melia M., Geissler B., König J., Ottersbach H. J., Umbreit M., Letzel S., et al. (2019). Pressure pain thresholds: subject factors and the meaning of peak pressures. Eur. J. Pain 23 (1), 167–182. doi:10.1002/ejp.1298
Messing K., Kilbom A. (2001). Standing and very slow walking: foot pain-pressure threshold, subjective pain experience and work activity. Appl. Ergon. 32, 81–90. doi:10.1016/s0003-6870(00)00030-2
Nagi S. S., Marshall A. G., Makadani A., Jarocka E., Liljencrantz J., Ridderström M., et al. (2019). An ultrafast System for signaling mechanical pain in human skin. Sci. Adv. 5 (7), eaaw1297. doi:10.1126/sciadv.aaw1297
Nie H., Arendt-Nielsen L., Andersen H., Graven-Nielsen T. (2005). Temporal summation of pain evoked by mechanical stimulation in deep and superficial tissue. J. Pain 6, 348–355. doi:10.1016/j.jpain.2005.01.352
Oddes Z., Solav D. (2023). Identifiability of soft tissue constitutive parameters from in-Vivo macro-indentation. J. Mech. Behav. Biomed. Mater 140, 105708. doi:10.1016/j.jmbbm.2023.105708
Oswald F., Campbell J., Williamson C., Richards J., Kelly P. (2020). A scoping review of the relationship between running and mental health. Int. J. Environ. Res. Public Health 17 (21), 8059. doi:10.3390/ijerph17218059
Pacheco-Barrios K., Carolyna Gianlorenço A., Machado R., Queiroga M., Zeng H., Shaikh E., et al. (2020). Exercise-induced pain threshold modulation in healthy subjects: a systematic review and meta-analysis. Princ. Pract. Clin. Res. 6 (3), 11–28. doi:10.21801/ppcrj.2020.63.2
Pai S., Ledoux W. R. (2010). The compressive mechanical properties of diabetic and non-diabetic plantar soft tissue. J. Biomechanics 43, 1754–1760. doi:10.1016/j.jbiomech.2010.02.021
Pai S., Ledoux W. R. (2011). The quasi-linear viscoelastic properties of diabetic and non-diabetic plantar soft tissue. Ann. Biomed. Eng. 39 (5), 1517–1527. doi:10.1007/s10439-011-0263-z
Pereira H. V., Palmeira A. L., Encantado J., Marques M. M., Santos I., Carraa E. V., et al. (2021). Systematic review of psychological and behavioral correlates of recreational running. Front. Psych. 12, 624783. doi:10.3389/fpsyg.2021.624783
Peterson J. A., Lohman C., Larson R. D., Bemben M. G., Black C. D. (2022). Lean mass is associated with, but does not mediate sex differences in pressure pain sensitivity in healthy adults. J. Pain Res. 15, 3981–3994. doi:10.2147/JPR.S387635
Pettersen S. D., Aslaksen P. M., Pettersen S. A. (2020). Pain processing in elite and high-level athletes compared to non-athletes. Front. Psych. 11, 1908. doi:10.3389/fpsyg.2020.01908
Prieto J. M., González-García H. (2022). Precompetitive anxiety profiles in runners: differences in the running motives. J. Am. Coll. Health 72 (8), 2512–2519. doi:10.1080/07448481.2022.2119395
Racine M., Tousignant-Laflamme Y., Kloda L. A., Dion D., Dupuis G., Choinière M. (2012). A systematic literature review of 10 Years of research on sex/gender and pain perception - Part 2: do biopsychosocial factors alter pain sensitivity differently in women and men? Pain Med. 153 (3), 619–635. doi:10.1016/j.pain.2011.11.026
Ring C., Edwards L., Kavussanu M. (2008). Effects of isometric exercise on pain are mediated by blood pressure. Biol. Psychol. 78 (1), 123–128. doi:10.1016/j.biopsycho.2008.01.008
Ríos-León M., Ortega-Santiago R., Madeleine P., Fernández-de-Las-Peñas C., Plaza-Manzano G. (2019). Topographical pressure pain sensitivity maps of the feet reveal bilateral pain sensitivity in patients with unilateral plantar heel pain. J. Orthop. Sports Phys. Ther. 49 (9), 640–646. doi:10.2519/jospt.2019.8813
Rolke R., Baron R., Maier C., Tölle T. R., Treede -D. R., Beyer A., et al. (2006). Quantitative sensory testing in the German research network on neuropathic pain (Dfns): standardized protocol and reference values. Pain 123 (3), 231–243. doi:10.1016/j.pain.2006.01.041
Rodrigo A. S., Goonetilleke R. S., Xiong S. (2013). Load distribution to minimise pressure-related pain on foot: a model. Ergon 56 (7), 1180–1193. doi:10.1080/00140139.2013.797111
Rolke R., Andrews Campbell K., Magerl W., Treede R.-D. (2005). Deep pain thresholds in the distal limbs of healthy human subjects. Eur. J. Pain 9, 39–48. doi:10.1016/j.ejpain.2004.04.001
Rolke R., Magerl W., Campbell K. A., Schalber C., Caspari S., Birklein F., et al. (2006). Quantitative sensory testing: a comprehensive protocol for clinical trials. Eur. J. Pain 10 (1), 77–88. doi:10.1016/j.ejpain.2005.02.003
Rosenbaum D., Hautmann S., Gold M., Claes L. (1994). Effects of walking speed on plantar pressure patterns and hindfoot angular motion. Gait and Posture 2 (3), 191–197. doi:10.1016/0966-6362(94)90007-8
Saban B., Masharawi Y. (2016). Pain threshold tests in patients with heel pain syndrome. Foot Ankle Int. 37 (7), 730–736. doi:10.1177/1071100716642038
Schalet B. D., Hays R. D., Jensen S. E., Beaumont J. L., Fries J. F., Cella D. (2016). Validity of promis physical function measured in diverse clinical samples. J. Clin. Epidemiol. 73, 112–118. doi:10.1016/j.jclinepi.2015.08.039
Simone D. A., Marchettini P., Caputi G., Ochoa J. L. (1994). Identification of muscle afferents subserving sensation of deep pain in humans. J. Neurophysiol. 72 (2), 883–889. doi:10.1152/jn.1994.72.2.883
Strzalkowski N. D., Triano J. J., Lam C. K., Templeton C. A., Bent L. R. (2015a). Thresholds of skin sensitivity are partially influenced by mechanical properties of the skin on the foot sole. Physiol. Rep. 3 (6), e12425. doi:10.14814/phy2.12425
Strzalkowski N. D., Mildren R. L., Bent L. R. (2015b). Thresholds of cutaneous afferents related to perceptual threshold across the human foot sole. J. Neurophysiol. 114, 2144–2151. doi:10.1152/jn.00524.2015
Strzalkowski N. D. J., Peters R. M., Inglis J. T., Bent L. R. (2018). Cutaneous afferent innervation of the human foot sole: what can we learn from single-unit recordings? J. Neurophysiol. 120 (3), 1233–1246. doi:10.1152/jn.00848.2017
Sylwander C., Larsson I., Haglund E., Bergman S., Andersson M. L. E. (2021). Pressure pain thresholds in individuals with knee pain: a cross-sectional study. BMC Musculoskelet. Disord. 22 (1), 516. doi:10.1186/s12891-021-04408-0
Tashani O. A., Astita R., Sharp D., Johnson M. I. (2017). Body mass index and distribution of body fat can influence sensory detection and pain sensitivity. Eur. J. Pain 21 (7), 1186–1196. doi:10.1002/ejp.1019
Tesarz J., Schuster A. K., Hartmann M., Gerhardt A., Eich W. (2012). Pain perception in athletes compared to normally active controls: a systematic review with meta-analysis. Pain Med. 153 (6), 1253–1262. doi:10.1016/j.pain.2012.03.005
Thornton C., Baird A., Sheffield D. (2024). Athletes and experimental pain: a systematic review and meta-analysis. J. Pain 25 (6), 104450. doi:10.1016/j.jpain.2023.12.007
Tomschi F., Schmidt A., Soffner M., Hilberg T. (2024). Hypoalgesia after aerobic exercise in healthy subjects: a systematic review and meta-analysis. J. Sports Sci. 42 (7), 574–588. doi:10.1080/02640414.2024.2352682
Tornero-Caballero M. C., Salom-Moreno J., Cigarán-Méndez M., Morales-Cabezas M., Madeleine P., Fernández-de-las-Peñas C. (2016). Muscle trigger points and pressure pain sensitivity maps of the feet in women with fibromyalgia syndrome. Pain Med. 17 (10), 1923–1932. doi:10.1093/pm/pnw090
Vaegter H. B., Jones M. D. (2020). Exercise-induced hypoalgesia after acute and regular exercise: experimental and clinical manifestations and possible mechanisms in individuals with and without pain. Pain Rep. 5 (5), e823. doi:10.1097/pr9.0000000000000823
Vaegter H. B., Handberg G., Graven-Nielsen T. (2014). Similarities between exercise-induced hypoalgesia and conditioned pain modulation in humans. Pain 155 (1), 158–167. doi:10.1016/j.pain.2013.09.023
Vaegter H. B., Fehrmann E., Gajsar H., Kreddig N. (2020). Endogenous modulation of pain: the role of exercise, stress, and cognitions in humans. Clin. J. Pain 36 (3), 150–161. doi:10.1097/AJP.0000000000000788
Vassend O., Røysamb E., Nielsen C. S., Czajkowski N. O. (2018). Fatigue symptoms in relation to neuroticism anxiety-depression, and musculoskeletal pain. A longitudinal twin study. PLoS One 13 (6), e0198594. doi:10.1371/journal.pone.0198594
Vervullens S., Haenen V., Meert L., Meeus M., Smeets RJEM, Baert I., et al. (2022). Personal influencing factors for pressure pain threshold in healthy People: a systematic review and meta-analysis. Neurosci. Biobehav Rev. 139, 104727. doi:10.1016/j.neubiorev.2022.104727
Waller R., Smith A. J., O'Sullivan P. B., Slater H., Sterling M., Alexandra McVeigh J., et al. (2016). Pressure and cold pain threshold reference values in a large, young adult, pain-free population. Scand. J. Pain 13, 114–122. doi:10.1016/j.sjpain.2016.08.003
Waller R., Smith A. J., OʼSullivan P. B., Slater H., Sterling M., Straker L. M. (2020). The association of early life stressors with pain sensitivity and pain experience at 22 years. Pain Med. 161 (1), 220–229. doi:10.1097/j.pain.0000000000001704
Walsh T. P., Arnold J. B., Evans A. M., Yaxley A., Damarell R. A., Shanahan E. M. (2018). The association between body fat and musculoskeletal pain: a systematic review and meta-analysis. BMC Musculoskelet. Disord. 19 (1), 233. doi:10.1186/s12891-018-2137-0
Walton D. M., Macdermid J. C., Nielson W., Teasell R. W., Chiasson M., Brown L. (2011). Reliability, standard error, and minimum detectable change of clinical pressure pain threshold testing in People with and without acute neck pain. J. Orthop. Sports Phys. Ther. 41 (9), 644–650. doi:10.2519/jospt.2011.3666
Wearing S. C., Urry S. R., Smeathers J. E. (2001). Ground reaction forces at discrete sites of the foot derived from pressure plate measurements. Foot Ankle Int. 22 (8), 653–661. doi:10.1177/107110070102200807
Wearing S. C., Smeathers J. E., Yates B., Urry S. R., Dubois P. (2009). Bulk compressive properties of the heel fat pad during walking: a pilot investigation in plantar heel pain. Clin. Biomech. 24 (4), 397–402. doi:10.1016/j.clinbiomech.2009.01.002
Wearing S. C., Hooper S. L., Langton C. M., Keiner M., Horstmann T., Crevier-Denoix N., et al. (2024). The biomechanics of musculoskeletal tissues during activities of daily living: dynamic assessment using quantitative transmission-mode ultrasound techniques. Healthcare 12 (13), 1254. doi:10.3390/healthcare12131254
Weerasinghe T. W., Goonetilleke R. S., Reischl U. (2016). Pressure thresholds and stiffness on the plantar surface of the human foot. Ergon 60 (7), 985–996. doi:10.1080/00140139.2016.1229042
Weidenbacker R., Sandry M., Moed G. (1963). Sensory discrimination of children with cerebral palsy: pressure/pain thresholds on the foot. Percept. Mot. Ski. 17 (2), 603–610. doi:10.2466/pms.1963.17.2.603
WHO Expert Consultation (2004). Appropriate body-mass index for asian populations and its implications for policy and intervention strategies. Lancet 363 (9403), 157–163. doi:10.1016/S0140-6736(03)15268-3
Wu F., Liu Y., Qu X. (2024). Pressure pain threshold of the whole foot: protocol and dense 3d sensitivity map. Appl. Ergon. 121, 104372. doi:10.1016/j.apergo.2024.104372
Wu P., Chen X., Wang S., Chen X., Liu J. (2025). Effects of exercise on depression and anxiety in patients with chronic pain: a systematic review and meta-analysis of randomized controlled trials. J. Affect Disord. 389, 119630. doi:10.1016/j.jad.2025.119630
Xiong S., Goonetilleke R. S., Jiang Z. (2011). Pressure thresholds of the human foot: measurement reliability and effects of stimulus characteristics. Ergon 54 (3), 282–293. doi:10.1080/00140139.2011.552736
Xiong S., Goonetilleke R. S., Asanka W. D., Rodrigo S., Zhao J. (2013). A model for the perception of surface pressure on human foot. Appl. Ergon. 44 (1), 1–10. doi:10.1016/j.apergo.2012.04.019
Keywords: dolorimetry, algometer, pain sensitivity, foot sole, perception, connective tissue, somatosensory, biomechanics
Citation: Game C, Walsh T, Stevenson N, Klingler W and Wearing SC (2025) Pressure-pain thresholds of the plantar foot reflect relative tissue thickness and are systematically higher in active runners than non-runners. Front. Physiol. 16:1660803. doi: 10.3389/fphys.2025.1660803
Received: 06 July 2025; Accepted: 25 August 2025;
Published: 09 September 2025.
Edited by:
Ali Karahan, Usak Universitesi Tip Fakultesi, TürkiyeReviewed by:
Jessica Peterson, New Mexico State University, United StatesZhenzhen Jiang, Shaoxing People’s Hospital, China
Copyright © 2025 Game, Walsh, Stevenson, Klingler and Wearing. This is an open-access article distributed under the terms of the Creative Commons Attribution License (CC BY). The use, distribution or reproduction in other forums is permitted, provided the original author(s) and the copyright owner(s) are credited and that the original publication in this journal is cited, in accordance with accepted academic practice. No use, distribution or reproduction is permitted which does not comply with these terms.
*Correspondence: Scott C. Wearing, cy53ZWFyaW5nQHR1bS5kZQ==