 Yuxiao Hu
 Weijun Liu2†
 Zhigang Gong
- 1Key Lab of Aquatic Sports Training Monitoring and Intervention of General Administration of Sport of China, Faculty of Physical Education, Jiangxi Normal University, Nanchang, China
- 2College of Arts and Physical Education, Nanchang Jiaotong Institute, Nanchang, China
Purpose: This study aimed to determine the optimal recovery time for maximizing post-activation performance enhancement in resistance-trained males grouped by local muscle endurance, and evaluate its effects on anaerobic performance and neuromuscular activity.
Methods: Twenty-four healthy men were grouped by repetitions completed at 80% of 1 repetition maximum (1RM) back squat, serving as a functional proxy for muscle endurance characteristics: Low-Muscle-Endurance (LME, n = 8, 20.5 ± 1.2 years), Intermediate-Muscle-Endurance (IME, n = 8, 20.3 ± 1.3 years), and High-Muscle-Endurance (HME, n = 8, 20.1 ± 1.1 years). Participants completed a control session (CON) and three experimental trials involving a back squat conditioning protocol (3 × 3 repetitions at 80% 1RM), followed by a 30-s Wingate Anaerobic Test (WAnT) after 3 (T3), 8 (T8), or 12 (T12) minutes of recovery. Surface electromyography (EMG) signals were recorded from the right rectus femoris (RF), biceps femoris (BF), and gastrocnemius lateralis (GL) during WAnT and analyzed for integrated EMG (IEMG) and mean power frequency (MPF).
Results: A clear hierarchy in baseline peak power (PP) was observed across groups, with LME > IME > HME (all p < 0.05). The LME group also demonstrated a higher fatigue index (FI) than both HME and IME groups (all p < 0.05). Regarding the time course of PAPE, PP for the cohort was significantly higher at T12 than at CON (p = 0.021). RF IEMG at T12 was significantly elevated versus CON (p = 0.024), while BF IEMG increased at T8 (p = 0.011). BF MPF was also higher at T12 compared to CON (p = 0.039). No significant recovery effects were observed for mean power (MP).
Conclusion: Individuals stratified by local muscle endurance exhibited distinct baseline anaerobic capacities and fatigue profiles. The optimal PAPE window occurred 8–12 min post-activation, marked by initial biceps femoris neural drive enhancement, followed by peak power and improved neuromuscular efficiency at 12 min. These findings support this practical stratification method for personalizing recovery strategies, linking PAPE magnitude differences to physiological traits reflected in endurance-based grouping.
Introduction
Post-activation performance enhancement (PAPE) describes the acute improvement in voluntary muscular performance following a conditioning activity, a phenomenon increasingly applied in strength and conditioning regimens (Krzysztofik et al., 2021). Common conditioning activities include high-intensity efforts such as sprinting (Yetter and Moir, 2008; Dello Iacono et al., 2016; Matusiński et al., 2021) and jumping (Dobbs et al., 2019; Dos Santos Silva et al., 2023), often resulting in performance outputs approaching 80%–90% of maximal capacity. Its manifestation, however, is a net outcome of the competition between two opposing factors: fatigue and post-activation potentiation (PAP) (Sale, 2002). PAP is a short-lived (<2 min) increase in muscle contractility, mediated by enhanced myofilament calcium sensitivity and myosin regulatory light chain phosphorylation in type II fibers, leading to an increased rate of force development (Blazevich and Babault, 2019). In contrast, PAPE is a more complex and longer-lasting phenomenon (peaking several minutes post-activity) that is thought to involve a combination of factors, including increased muscle temperature, intramuscular fluid shifts, and potential contributions from spinal-level excitability and motivational changes (Blazevich and Babault, 2019).
The transition from a fatigued state to a potentiated one is critically governed by recovery duration (Boullosa et al., 2020). While an optimal window of 3–12 min is often reported, significant inter-individual variability exists (Hamada et al., 2000; Wilson et al., 2013). A compelling yet underexplored source of this variability is an athlete’s inherent local muscle endurance capacity. This capacity, functionally assessed via repetitions to failure at 80% 1RM, reflects fatigue resistance, a trait fundamentally linked to muscle fiber typology. We propose that this performance metric offers a more direct and practical predictor of an individual’s recovery kinetics than estimations of fiber-type composition alone. This is because it functionally integrates the key physiological dilemma of fast-twitch fibers: while they possess a high potential for potentiation, they are also highly fatigable. Consequently, individuals with lower local endurance (indicative of a fast-twitch profile) are expected to accumulate more fatigue, thereby requiring a longer recovery to reveal the PAPE window compared to their high-endurance counterparts.
To test this, the present study employed a heavy back squat as a conditioning stimulus and assessed performance via the Wingate Anaerobic Test (WAnT) for its sensitivity to transient power output (Castañeda-Babarro, 2021). Recovery intervals of 3, 8, and 12 min were selected to probe the critical phases where the balance between fatigue and potentiation shifts. Whereas previous studies have often applied uniform recovery periods, we systematically stratified resistance-trained males based on their 80% 1RM back squat performance to explicitly determine how local muscle endurance capacity influences the optimal recovery time for maximizing PAPE.
We hypothesize that individuals with low local muscle endurance will exhibit a distinct PAPE response, characterized by an optimal recovery window between 8 and 12 min, leading to greater enhancements in peak power output and neuromuscular activity compared to individuals with high local muscle endurance.
Methods
Participants
An a priori power analysis was performed using G*Power 3.1.9.7 (Faul et al., 2007) to determine the sample size required to detect the interaction effect in a repeated-measures ANOVA (within-between interaction) design. The calculation was conducted for the primary outcome variable, Peak Power (PP). A large effect size (f = 0.40, corresponding to η2 = 0.14) was assumed based on similar studies in the PAPE literature (Cohen, 1988), with a correlation of 0.5 among the repeated measurements (the four time points: CON, T3, T8, T12), an alpha (α) level of 0.05, and a statistical power (1 – β) of 0.80. The results indicated that a minimum total sample size of 15 participants was required. To account for potential attrition and ensure robust group comparisons, we recruited 24 participants, exceeding this minimum requirement. Initially, 40 healthy male participants with recreational resistance training experience were recruited from Jiangxi Normal University. The inclusion criteria were: (i) no musculoskeletal injuries within the past 3 months and no diagnosed neuromuscular, cardiovascular, or neurological disorders; (ii) more than 3 years of structured training experience; (iii) at least 2 years of resistance training experience with a back squat 1-repetition maximum (1-RM) greater than 1.5 times body mass; and (iv) engagement in physical activity 2–3 times per week. After a detailed explanation of the experimental procedures and potential risks (Lloria-Varella et al., 2023), 24 eligible participants provided written informed consent and completed all experimental protocols. The study was approved by the Institutional Review Board of Jiangxi Normal University (IRB-JXNU-PEC-2024018) and conducted in accordance with the ethical principles of the Declaration of Helsinki.
The muscle endurance group was determined by an assessment method based on 80% 1RM (Hall et al., 2021; Karp, 2001). Participants were stratified into three groups based on their local muscle endurance performance, as measured by the maximum number of repetitions completed at 80% 1RM in the back squat. According to the criteria established by Karp (2001), individuals completing ≤7 repetitions were classified as the Low-Muscle-Endurance (LME) group, those achieving 8–11 repetitions as the Intermediate-Muscle-Endurance (IME) group, and those completing ≥12 repetitions as the High-Muscle-Endurance (HME) group. The basic information of participants is shown in Table 1.

Table 1. Participant demographic and anthropometric characteristics.
Study design
This investigated the effects of different recovery intervals following PAPE (3-min recovery, T3, 8-min recovery, T8, 12-min recovery, T12) on anaerobic performance and neuromuscular activity. Following institutional ethics approval and written informed consent, 24 healthy male participants completed health screenings, anthropometric measurements, standardized exercise technique instruction, and protocol familiarization. The protocol comprised one familiarization session, one control session (CON, which involved no conditioning activity to establish a baseline for comparison), and three PAPE sessions (T3, T8, T12). Each experimental session was separated by a minimum of 72 h to ensure recovery and minimize residual training effects (Figure 1). Sessions were conducted within a consistent 2-h time window relative to each participant’s initial session in an environmentally controlled laboratory (21 °C–24 °C, 44%–56% relative humidity) (Zhang et al., 2024). To minimize confounding variables, participants were instructed to adhere to the following guidelines within the 24 h preceding the experiment: avoidance of high-intensity lower extremity training, abstinence from caffeine and alcohol, and maintenance of habitual nutrition, sleep patterns, and training routines. Additionally, participants were instructed to consume a light, habitual meal at least 3 h before arrival, while strictly avoiding caffeinated beverages, alcohol, and unfamiliar or high-fat foods. They were also required to ensure adequate hydration and rest (Zhang et al., 2024; El-Sayed et al., 2005).

Figure 1. Flowchart of experimental design. Note: RM, repetition maximum; HME, High-Muscle-Endurance; IME, Intermediate-Muscle-Endurance; LME, Low-Muscle-Endurance; CON, baseline; T3, 3 min rest after back squat activation; T8, 8 min rest after back squat activation; T12, 12 min rest after back squat activation; 30 s WAnT, 30-s Wingate Anaerobic test. The same below.
Procedures
One repetition maximum (1RM) test and grouping
Participants first completed a dynamic warm-up using body weight exercises. The 1-RM protocol comprised progressive loading trials (NSCA-National Strength & Conditioning Association, 2021): an initial set of 5–10 repetitions at a submaximal load, followed by 3–5 repetitions at ∼50% of the estimated 1-RM after 1–2 min of rest. Subsequent trials included 2–3 repetitions at 85%–90% of the estimated 1-RM following 2–3 min of recovery. Weight was then increased by 15–20 kg (or 10%–20% of baseline load) for a maximal single attempt after 2–4 min of rest. Load adjustments of 5%–10% were made based on success or failure until the true 1-RM was determined within five attempts. Muscle enduration was estimated through parallel back squats at 80% 1-RM, with participants categorized as (Hall et al., 2021; Karp, 2001): Low-Muscle-Endurance (LME) if completing <7 repetitions, Intermediate-Muscle-Endurance (IME) for 7–12 repetitions, or High-Muscle-Endurance (HME) if exceeding 12 repetitions.
Familiarization and warm-up
Participants underwent anthropometric assessments (height, body mass, BMI) and a comprehensive protocol familiarization. This session included individualized cycle ergometer configuration (seat height, handlebar position), practice of the Wingate test protocol to minimize learning effects, and correction of movement techniques (Zhang et al., 2024). Standardized instructions on procedures and safety were provided prior to all experimental sessions. Each trial commenced with an identical warm-up on a calibrated cycle ergometer (CYCLUS 2, Germany), consisting of 5 min of cycling at a self-selected cadence against 50 W resistance. The warm-up incorporated maximal sprints of at least 3 s at the 3-min and 5-min marks, with a target heart rate range of 130–140 beats per minute (Mastalerz et al., 2024; Sauvé et al., 2024).
Post-activation performance enhancement (PAPE)
Following the standardized warm-up, participants rested for 10 min off the cycle ergometer. In the PAPE condition, participants performed 3 sets × 3 repetitions of parallel back squats at 80% 1RM with 2-min interset rest, followed by 30-s Wingate anaerobic tests at designated post-intervention timepoints (3, 8, or 12 min). For the CON, participants proceeded directly to the Wingate test after the 10-min rest period without performing squats.
Surface electromyography selection and placement
Based on the biomechanical characteristics of the squat exercise and the kinematic profiles of the hip, knee, and ankle joints during cycling, supplemented by relevant literature, the primary muscle groups activated were identified. Consequently, the rectus femoris (RF), biceps femoris (BF), and gastrocnemius lateralis (GL) were selected for surface electromyography (sEMG) assessment (Hug and Dorel, 2009). Prior to electrode placement, the skin over the muscle bellies was prepared by shaving to remove hair, lightly abrading with fine-grit sandpaper, and cleansing with 75% alcohol to effectively reduce skin impedance (McManus et al., 2021). In accordance with SENIAM guidelines (Hermens et al., 2000), bipolar disposable Ag/AgCl surface electrodes were placed parallel to the muscle on the designated muscle bellies, with an inter-electrode distance of 2 cm. Electrode placement was verified by having the participant perform brief, low-intensity isometric contractions specific to each muscle. All lead wires were secured with medical adhesive tape to minimize motion artifact. sEMG signals were collected using the Delsys Trigno system. The raw signals were sampled at 1500 Hz, and electrode impedance was confirmed to be below 5 kΩ at the start of data collection. For signal processing, the raw sEMG data were first band-pass filtered between 20 and 450 Hz using a zero-lag fourth order Butterworth filter. Two key parameters were then extracted for analysis: the Integrated Electromyography (IEMG) and the Mean Power Frequency (MPF). The IEMG was calculated by full-wave rectifying the filtered signal followed by numerical integration over the entire cycling trial epoch to represent the total muscle electrical activity. Simultaneously, the MPF was derived by performing a Fast Fourier Transform (FFT) on successive data epochs of the raw signal to obtain the power spectral density, from which the mean frequency was computed.
Wingate testing
The Wingate test was performed on the same calibrated cycle ergometer (CYCLUS 2, Germany) used for the warm-up. Surface electromyography (sEMG) signals were recorded using a Delsys Trigno system (United States). Following skin preparation (cleansing with alcohol and light abrasion), electrodes were positioned over the RF, BF, and GL (Table 2), and signal stability was verified. The test began with an auditory “go” command, after which participants performed a 30-s maximal sprint against a resistance equivalent to 7.5% of their body mass. Standardized verbal encouragement was provided throughout to ensure maximal effort. The test was conducted according to an established protocol (Liu et al., 2025), starting from a static position with preloaded resistance. Peak power (PP), mean power (MP), and fatigue index (FI) were automatically recorded. Raw sEMG signals were band-pass filtered (10–480 Hz), full-wave rectified, and exported for subsequent analysis.

Table 2. Muscles studied and EMG electrode placement sites (Hermens et al., 2000; Zipp, 1982).
Index selection
Peak Power (PP) refers to the maximum power output achievable within a brief period, reflecting the capacity for explosive muscular force. It is primarily dependent on the energy supply from the phosphocreatine system, with higher values indicating superior explosive strength. Mean Power (MP) represents the average power maintained throughout the 30-s sprint, serving as an indicator of speed endurance. MP reflects the power output sustained by anaerobic metabolic pathways. Higher mean power values are associated with better speed endurance and greater anaerobic work capacity. The Fatigue Index (FI) quantifies the rate of fatigue development by measuring the decline in power output over time, thereby indicating the body’s ability to resist fatigue under anaerobic conditions (Liu et al., 2025). Integrated electromyography (IEMG) denotes the cumulative electrical activity of motor units over a specific period, which is derived from the amplitude of the EMG signal. It reflects both the number of activated motor units and their firing frequency. Mean Power Frequency (MPF) is defined as the centroid of the power spectrum curve and serves as an effective indicator of muscular activation and functional state. It is also used to assess the degree of muscle fatigue (Shiming et al., 2016; Liu et al., 2025).
Statistical analysis
Prior to the two-way repeated-measures analysis of variance (ANOVA), the normality of all data distributions was confirmed using Shapiro-Wilk tests. A two-way repeated-measures ANOVA was then employed to examine the effects of muscle endurance group (between-subjects factor: LME, IME, HME), recovery time following PAPE (within-subjects factor: CON, T3, T8, T12), and their interaction on Wingate test-derived anaerobic power indices (PP, MP, FI) and electromyographic (EMG) indices (IEMG, MPF). Where a significant interaction or significant main effect for muscle endurance group was observed (p < 0.05), simple effects analyses were conducted. If only the main effect for muscle endurance group was significant (p < 0.05) and neither the main effect for time nor the interaction was significant (p > 0.05), data were collapsed across muscle endurance groups, and post hoc pairwise comparisons with Tukey’s HSD correction for multiple comparisons were performed on the time factor. All statistical analyses were conducted using IBM SPSS Statistics (Version 25.0). Effect sizes were assessed using partial eta-squared (
Results
Muscle endurance capacity modulated the recovery of anaerobic power
The results of PP, MP and FI after 30 s Wingate test are summarized in Tables 3, 4. Repeated-measures ANOVA of PP during the 30-s Wingate test revealed significant main effects for group (F (2,21) = 5.461, p = 0.012,
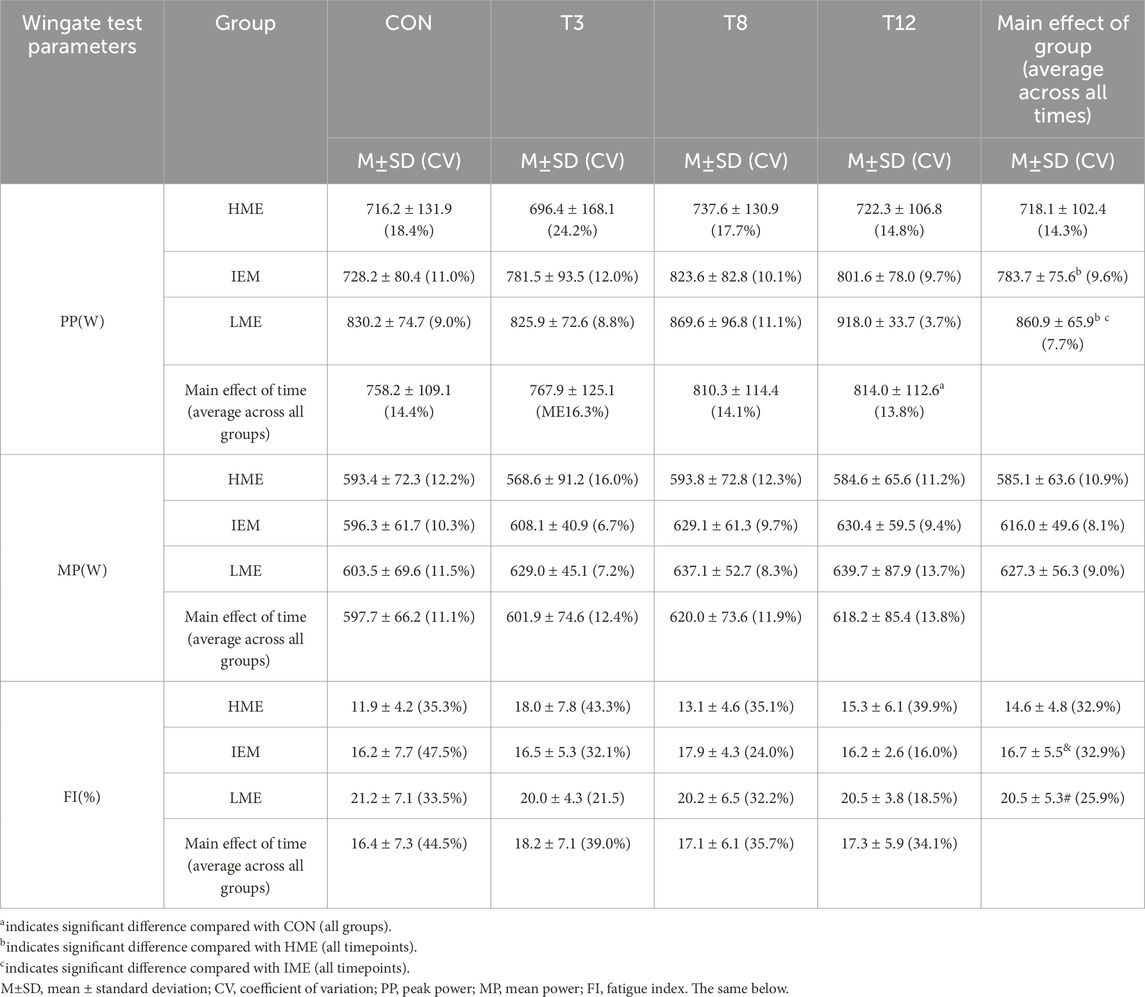
Table 3. Wingate test comparison across different muscle endurance and recovery durations.

Table 4. Analysis results of the effects of group, duration, and their interaction on Wingate Performance.
For MP, no significant main effect of group (F (2, 21) = 1.298, p = 0.294,
For FI, repeated-measures ANOVA revealed a significant main effect of group (F (2,21) = 4.875, p = 0.018,

Figure 2. Effects of muscle fiber typology and recovery time on power output and fatigue. Note: * indicates significant difference compared with CON (all groups), # indicates significant difference compared with HME (all times), and indicates significant difference compared with IME (all times). (A) Peak power (W), (B) Mean power (W), (C) Fatigue index (%). The same below.
Surface EMG recovery is modulated by muscle endurance capacity
A repeated-measures ANOVA was performed on the IEMG data (Tables 5, 6). For the RF, there were no significant main effects for group (F (2, 21) = 1.186, p = 0.325,

Table 5. Comparison of IEMG from the Wingate test under different muscle endurance and recovery conditions.

Table 6. Analysis results of the effects of group, duration, and their interaction on IEMG.

Figure 3. Test results of IEMG with different muscle endurance and recovery durations. (A) Rectus femoris IEMG (μV), (B) Biceps femoris IEMG (μV), (C) Gastrocnemius lateralis IEMG (μV). The same below.
As shown in Tables 7, 8, a repeated-measures ANOVA on MPF revealed muscle-specific patterns. Non-significant group main effects were observed for RF (F (2,21) = 0.003, p = 0.997,

Table 7. Comparison of MPF from the Wingate test under different muscle endurance and recovery conditions.

Table 8. Analysis results of the effects of group, duration, and their interaction on MPF.

Figure 4. Test results of MPF with different muscle endurance and recovery durations. (A) Rectus femoris MPF (Hz), (B) Biceps femoris MPF (Hz), (C) Gastrocnemius lateralis MPF (Hz). The same below.
Discussion
This study systematically investigated neuromuscular responses to PAPE in resistance-trained males grouped based on muscle endurance. The 30-s Wingate Anaerobic Test (WAnT) was selected over shorter, high-intensity tests (e.g., vertical jumps or short sprints) for a key methodological reason: it allows for the simultaneous evaluation of both peak power output (a key marker of PAPE) and the subsequent fatigue profile within a single, standardized maximal effort. While shorter tests are excellent isolated measures of explosive power, the WAnT uniquely captures the dynamic interplay between potentiation and fatigue, a central aspect of PAPE physiology (Doma et al., 2019; Peñailillo et al., 2013; Ericson et al., 1986). This was particularly relevant for our study, as we hypothesized that individuals with a fast-twitch tendency (inferred via low local muscle endurance) would not only exhibit greater potentiation but also a distinct fatigue profile. The WAnT provided the necessary data granularity (Peak Power, Mean Power, and Fatigue Index) to test this hypothesis comprehensively, offering insights into the time-course of performance changes that a single, brief explosive test could not. Furthermore, in terms of reproducibility, which is crucial in repeated-measures designs such as ours, the WAnT has been widely established as a tool with high test-retest reliability for peak power in trained populations. Although a formal reliability analysis was not a primary aim of our study, its consistency is well documented in the literature (Zupan et al., 2009; Mendez-Villanueva et al., 2007; Paton and Hopkins, 2001). We have added a sentence in the Methods section to acknowledge this established reliability. A central finding was the critical influence of muscle endurance capacity on PAPE. This was demonstrated by a clear, hierarchical enhancement in peak power output across groups (LME > IME > HME). The large effect sizes (≥0.34) for these between-group differences in PP and FI underscore that an individual’s muscle endurance profile is a substantial physiological determinant of both the magnitude of PAPE and the rate of fatigue. This finding extends beyond statistical significance, highlighting its practical relevance for personalizing training regimens. LME group generated significantly greater power than HME and IEM groups, attributable to enhanced glycolytic capacity, accelerated sarcoplasmic reticulum Ca2+ release kinetics, and elevated myosin ATPase activity (Sale, 2002; Bottinelli et al., 1996). Paradoxically, this power advantage was accompanied by significantly elevated fatigue index (FI) in LME versus HME and IME groups, as a direct consequence of accelerated metabolite accumulation and sustained energy demands from myosin light chain phosphorylation. Notably, no significant between-group differences occurred in MP during the 30-s Wingate test (p > 0.05). This equivalence stems from compensatory mechanisms: the initial power advantage in LME individuals was offset by accelerated fatigue, while HME participants maintained output via superior oxidative capacity and lactate clearance (Schiaffino and Reggiani, 2011; Brooks, 2018). Moreover, differences in phosphocreatine (PCr) resynthesis rates and lactate shuttle dynamics, mediated by fiber-specific expression of monocarboxylate transporters (e.g., MCT4 in type II fibers), further modulated the net metabolic response and fatigue resistance between groups. Consequently, convergent neuromuscular strategies yielded comparable time-integrated power across groups during sustained anaerobic efforts. Methodologically, the 30-s WAnT test duration represents a critical transition phase (15–45 s) where neither purely anaerobic (<15 s) nor aerobic-dominant (>45 s) energy systems prevail, attenuating inherent fiber-type advantages (Gastin, 2001; Harris et al., 1976). HME participants leveraged inherent oxidative advantages, which facilitate rapid lactate shuttling as a metabolic fuel and signal, and drive the high-rate resynthesis of phosphocreatine (PCr) (Glancy et al., 2021). In contrast, LME exhibited comparable recovery rates, potentially due to training-induced adaptations such as enhanced mitochondrial biogenesis within type II fibers and increased expression of monocarboxylate transporter 4 (MCT4), which facilitates lactate efflux (Bonen, 2000). These metabolic adaptations, along with variations in central drive and motor unit recruitment thresholds, may partially compensate for the inherently lower oxidative capacity of LME, reducing inter-group differences in recovery kinetics during the WAnT.
Electromyographic analysis indicated a biphasic PAPE response in the RF and BF, albeit with distinct temporal profiles. For the BF, IEMG amplitude increased significantly at T8 compared with the CON condition. In contrast, the RF exhibited a significant IEMG elevation later, at T12 relative to CON. This was accompanied by an increase in MPF at T12, suggesting improved motor unit firing synchrony. The differential timing of PAPE emergence between the RF and BF corresponds to their functional roles during the squat: the BF serves as a primary hip extensor and knee stabilizer, activating earlier and more intensely, while the RF, as a bi-articular muscle involved in both hip flexion and knee extension, may demonstrate delayed potentiation (Neumann, 2010). No significant PAPE effects were observed in the GL, likely due to its submaximal recruitment during the back squat (Escamilla et al., 1998; Bryanton et al., 2012). Additionally, the GL typically exhibits a higher oxidative capacity and a greater proportion of type I fibers compared to more glycolytic muscles like the rectus femoris (RF), as supported by established data on fiber-type distribution and metabolic enzyme activity in human lower limb muscles (Johnson et al., 1973; Ariano et al., 1973). This inherent characteristic may reduce its susceptibility to the rapid potentiation mechanisms that are more pronounced in muscles with a higher glycolytic potential. The biphasic IEMG–MPF response observed in the RF and BF aligns with phosphorylation-dependent mechanisms that are predominantly active in type II fibers. The initial increase in IEMG may indicate enhanced excitation–contraction coupling mediated by rapid Ca2+ release (Schiaffino and Reggiani, 2011). In contrast, the subsequent rise in MPF could be attributed to phosphorylation of the myosin regulatory light chain, which improves cross-bridge cycling kinetics (Rose and Hargreaves, 2010). The pronounced fatigability of type II fibers after intense exercise may be related to their high metabolic demand and relatively inefficient calcium reuptake (Allen et al., 2008). Although MPF is influenced by muscle fiber conduction velocity and can be altered by fatigue, its utility in discriminating fiber-type composition remains limited. This is due to spatial averaging over heterogeneous muscle regions and confounding factors such as motor unit synchronization (Piperi et al., 2024; Brad and Sherry, 2004). No significant among-group differences in recovery kinetics were observed (p > 0.05). The absence of PAPE at T3 is consistent with literature indicating that 8 min of recovery are generally needed to overcome metabolic fatigue and allow potentiation to dominate (Garbisu-Hualde and Santos-Concejero, 2021). The high-intensity squat protocol (3 × 3 repetitions at 80% 1RM) likely induced substantial fatigue, masking any early potentiation at shorter recovery intervals (Jo et al., 2010; Chen et al., 2023). Individual differences in central drive, motor unit recruitment strategy, and metabolic recovery (e.g., PCr resynthesis, lactate clearance) further modulated the fatigue–potentiation balance, likely explaining the lack of inter-group differences.
A notable aspect of this study is the implementation of a practical, performance-based stratification framework, employing repetition capacity at 80% 1RM in the back squat as a surrogate indicator of fiber-type dominance as a proxy for fiber-type dominance to guide PAPE timing. Our findings reveal that individuals classified as fast-twitch-dominant reached peak performance enhancement at approximately 12 min, while those identified as slow-twitch-dominant exhibited markedly attenuated responses. These results support extending the recovery window to 8–12 min for fast-twitch-dominant individuals to optimize PAPE, thereby refining current guidelines that often overlook interindividual differences in muscle typology. It must be acknowledged, however, that this repetition-based approach offers only an approximate estimation of fiber-type distribution. It cannot distinguish between subtype variations (e.g., type IIa vs. IIx) or confirm actual physiological composition in the absence of direct biological validation such as muscle biopsy, magnetic resonance spectroscopy, or advanced imaging. Nevertheless, the clear response differences observed between stratification groups underscore the utility of this method in tailoring recovery strategies. Substantial inter-individual heterogeneity was observed within the study cohort, particularly with respect to sEMG-derived parameters, for which coefficients of variation frequently exceeded 50%. The persistence of such variability even after stratification by the primary physiological determinant of muscle endurance suggests the involvement of additional modulating factors. These are likely to encompass inter-individual differences in training adaptations, neuromotor coordination, central activation, and the kinetics of key metabolic processes such as phosphocreatine resynthesis and lactate clearance. Therefore, although fiber typology offers a robust framework for predicting group-level responses, our findings ultimately underscore the necessity of individualized PAPE protocols, with recovery strategies tailored according to specific athlete characteristics and physiological responses.
Conclusion
This study demonstrates that a heavy back squat conditioning activity elicits a significant PAPE effect, with the optimal window for enhanced anaerobic performance and neuromuscular activity occurring between 8 and 12 min of recovery. The findings reveal a muscle-specific pattern of potentiation, with the biceps femoris demonstrating earlier (T8) and the rectus femoris later (T12) elevations in neuromuscular activity. Crucially, muscle endurance capacity, as stratified by performance at 80% 1RM, was identified as a pivotal moderator of the PAPE response. Individuals with low muscle endurance (LME) exhibited superior peak power output and a more pronounced PAPE effect compared to their high-endurance (HME) counterparts, albeit with a concomitant higher fatigue index. This establishes muscle endurance profile as a key determinant for individualizing recovery strategies to optimize post-activation performance enhancement.
Limitations
Despite the insightful findings, this study has several limitations. First, the classification of muscle fiber dominance was based on the maximum repetitions at 80% 1RM. While this is a validated and practical non-invasive method, it remains an indirect proxy and can be influenced by factors such as neuromuscular efficiency and technique, unlike direct histological analysis. Second, although participants were instructed to maintain their habitual diet and avoid specific substances, the precise nutritional intake and hydration status were not monitored or controlled, which could have introduced variability in metabolic and performance responses. Third, the relatively small and homogeneous sample of recreationally trained young males limits the generalizability of our findings to other populations, including females, elite athletes, and older adults. Future research should incorporate more direct fiber-type assessments, include more diverse cohorts, and implement stricter nutritional control to further elucidate the individualized nature of PAPE kinetics.
Data availability statement
The raw data supporting the conclusions of this article will be made available by the authors, without undue reservation.
Ethics statement
The studies involving humans were approved by the Institutional Review Board of Jiangxi Normal University (IRB-JXNU-PEC-2024018). The studies were conducted in accordance with the local legislation and institutional requirements. The participants provided their written informed consent to participate in this study.
Author contributions
YH: Writing – original draft, Data curation, Investigation. WL: Funding acquisition, Writing – review and editing. QD: Data curation, Writing – review and editing, Funding acquisition. ZG: Writing – review and editing, Writing – original draft.
Funding
The authors declare that financial support was received for the research and/or publication of this article. The financial support provided by the Research Project Funded by Jiangxi Provincial Sports Bureau (2024011) and the Graduate Innovation Fund of Jiangxi Provincial Education Department of China (YC2023-S324).
Acknowledgements
There was no conflict of interests associated with this research. The authors would like to thank the participants for their enthusiastic participation. The authors gratefully acknowledge the financial support provided by the Research Project Funded by Jiangxi Provincial Sports Bureau (2024011) and the Graduate Innovation Fund of Jiangxi Provincial Education Department of China (YC2023-S324).
Conflict of interest
The authors declare that the research was conducted in the absence of any commercial or financial relationships that could be construed as a potential conflict of interest.
Generative AI statement
The authors declare that no Generative AI was used in the creation of this manuscript.
Any alternative text (alt text) provided alongside figures in this article has been generated by Frontiers with the support of artificial intelligence and reasonable efforts have been made to ensure accuracy, including review by the authors wherever possible. If you identify any issues, please contact us.
Publisher’s note
All claims expressed in this article are solely those of the authors and do not necessarily represent those of their affiliated organizations, or those of the publisher, the editors and the reviewers. Any product that may be evaluated in this article, or claim that may be made by its manufacturer, is not guaranteed or endorsed by the publisher.
References
Allen D. G., Lamb G. D., Westerblad H. (2008). Skeletal muscle fatigue: cellular mechanisms. Physiol. Rev. 88 (1), 287–332. doi:10.1152/physrev.00015.2007
Ariano M. A., Armstrong R. B., Edgerton V. R. (1973). Hindlimb muscle fiber populations of five mammals. J. Histochem. Cytochem. 21 (1), 51–55. doi:10.1177/21.1.51
Blazevich A. J., Babault N. (2019). Post-activation potentiation Versus post-activation performance enhancement in humans: historical perspective, underlying mechanisms, and current issues. Front. Physiol. 10, 1359. doi:10.3389/fphys.2019.01359
Bonen A. (2000). Lactate transporters (MCT proteins) in heart and skeletal muscles. Med. Sci. Sports Exerc. 32 (4), 778–789. doi:10.1097/00005768-200004000-00010
Bottinelli R., Canepari M., Pellegrino M. A., Reggiani C. (1996). Force-velocity properties of human skeletal muscle fibres: Myosin heavy chain isoform and temperature dependence. J. Physiol. 495 (Pt2), 573–586. doi:10.1113/jphysiol.1996.sp021617
Boullosa D., Beato M., Dello Iacono A., Cuenca-Fernández F., Doma K., Schumann M., et al. (2020). A new taxonomy for postactivation potentiation in sport. Int. J. Sports Physiol. Perform. 15 (8), 1197–1200. doi:10.1123/ijspp.2020-0350
Brad S., Sherry S., Enoka R. M. (2004). The extraction of neural strategies from the surface EMG. J. Appl. Physiol. 96 (4), 1486–1495. doi:10.1152/japplphysiol.01070.2003
Brooks G. A. (2018). The science and translation of lactate shuttle theory. Cell Metab. 27 (4), 757–785. doi:10.1016/j.cmet.2018.03.008
Bryanton M. A., Kennedy M. D., Carey J. P., Chiu L. Z. (2012). Effect of squat depth and barbell load on relative muscular effort in squatting. J. Strength Cond. Res. 26 (10), 2820–2828. doi:10.1519/JSC.0b013e31826791a7
Castañeda-Babarro A. (2021). The wingate anaerobic test, a narrative review of the protocol variables that affect the results obtained. Appl. Sci. 11 (16), 7417. doi:10.3390/app11167417
Chen Y., Su Q., Yang J., Li G., Zhang S., Lv Y., et al. (2023). Effects of rest interval and training intensity on jumping performance: a systematic review and meta-analysis investigating post-activation performance enhancement. Front. Physiol. 14, 1202789. doi:10.3389/fphys.2023.1202789
Cohen J. (1988). Statistical power analysis for the behavioral sciences. 2nd ed. Lawrence Erlbaum Associates. doi:10.4324/9780203771587
Dello Iacono A., Martone D., Padulo J. (2016). Acute effects of drop-jump protocols on explosive performances of elite handball players. J. Strength Cond. Res. 30 (11), 3122–3133. doi:10.1519/JSC.0000000000001393
Dobbs W. C., Tolusso D. V., Fedewa M. V., Esco M. R. (2019). Effect of postactivation potentiation on explosive vertical jump: a systematic review and meta-analysis. J. Strength Cond. Res. 33 (7), 2009–2018. doi:10.1519/JSC.0000000000002750
Doma K., Deakin G. B., Schumann M., Bentley D. J. (2019). Training considerations for optimising endurance development: an alternate concurrent training perspective. Sports Medicine Auckl. N.Z. 49 (5), 669–682. doi:10.1007/s40279-019-01072-2
D. Dos Santos Silva, D. Boullosa, E. V. Moura Pereira, M. D. de Jesus Alves, M. S. de Sousa Fernandes, G. Badicuet al. (2023). Post-activation performance enhancement effect of drop jump on long jump performance during competition. Sci Rep. 13 (1), 16993. doi:10.1038/s41598-023-44075-w
El-Sayed M. S., Ali N., El-Sayed Ali Z. (2005). Interaction between alcohol and exercise: physiological and haematological implications. Sports Med. (N.Z.) 35 (3), 257–269. doi:10.2165/00007256-200535030-00005
Ericson M. O., Bratt A., Nisell R., Arborelius U. P., Ekholm J. (1986). Power output and work in different muscle groups during ergometer cycling. Eur. J. Appl. Physiol. Occup. Physiol. 55 (3), 229–235. doi:10.1007/BF02343792
Escamilla R. F., Fleisig G. S., Zheng N., Barrentine S. W., Wilk K. E., Andrews J. R. (1998). Biomechanics of the knee during closed kinetic chain and open kinetic chain exercises. Med. Sci. Sports Exerc. 30 (4), 556–569. doi:10.1097/00005768-199804000-00014
Faul F., Erdfelder E., Lang A. G., Buchner A. (2007). G*Power 3: a flexible statistical power analysis program for the social, behavioral, and biomedical sciences. Behav. Res. Methods 39 (2), 175–191. doi:10.3758/bf03193146
Garbisu-Hualde A., Santos-Concejero J. (2021). Post-activation potentiation in strength training: a systematic review of the scientific literature. J. Hum. Kinet. 78, 141–150. doi:10.2478/hukin-2021-0034
Gastin P. B. (2001). Energy system interaction and relative contribution during maximal exercise. Sports Med. 31 (10), 725–741. doi:10.2165/00007256-200131100-00003
Glancy B., Kane D. A., Kavazis A. N., Goodwin M. L., Willis W. T., Gladden L. B. (2021). Mitochondrial lactate metabolism: history and implications for exercise and disease. J. Physiol. 599 (3), 863–888. doi:10.1113/JP278930
Hall E. C. R., Lysenko E. A., Semenova E. A., Borisov O. V., Andryushchenko O. N., Andryushchenko L. B., et al. (2021). Prediction of muscle fiber composition using multiple repetition testing. Biol. Sport 38 (2), 277–283. doi:10.5114/biolsport.2021.99705
Hamada T., Sale D. G., MacDougall J. D., Tarnopolsky M. A. (2000). Postactivation potentiation, fiber type, and Twitch contraction time in human knee extensor muscles. J. Appl. Physiol. 88 (6), 2131–2137. doi:10.1152/jappl.2000.88.6.2131
Harris R. C., Edwards R. H. T., Hultman E., Nordesj L. O., Sahlin K. (1976). The time course of phosphorylcreatine resynthesis during recovery of the quadriceps muscle in man. Pflugers Arch. 367 (2), 137–142. doi:10.1007/BF00585149
Hermens H. J., Freriks B., Disselhorst-Klug C., Rau G. (2000). Development of recommendations for SEMG sensors and sensor placement procedures. J. Electromyogr. Kinesiol. 10 (5), 361–374. doi:10.1016/s1050-6411(00)00027-4
Hug F., Dorel S. (2009). Electromyographic analysis of pedaling: a review. J. Electromyogr. Kinesiol. 19 (2), 182–198. doi:10.1016/j.jelekin.2007.10.010
Jo E., Judelson D. A., Brown L. E., Coburn J. W., Dabbs N. C. (2010). Influence of recovery duration after a potentiating stimulus on muscular power in recreationally trained individuals. J. Strength Cond. Res. 24 (2), 343–347. doi:10.1519/JSC.0b013e3181cc22a4
Johnson M. A., Polgar J., Weightman D., Appleton D. (1973). Data on the distribution of fibre types in thirty-six human muscles. An autopsy study. J. Neurol. Sci. 18 (1), 111–129. doi:10.1016/0022-510x(73)90023-3
Karp J. R. (2001). Muscle fiber types and training. Strength Cond. J. 23 (5), 21–26. doi:10.1519/00126548-200110000-00004
Krzysztofik M., Wilk M., Stastny P., Golas A. (2021). Post-activation performance enhancement in the bench press throw: a systematic review and meta-analysis. Front. Physiol. 11, 598628. doi:10.3389/fphys.2020.598628
Liu Y., Yan J., Gong Z., Liu Q. (2025). The impact of the wingate test on anaerobic power in the lower limbs of athletes with varied duration and load. Front. Physiol. 16, 1582875. doi:10.3389/fphys.2025.1582875
Lloria-Varella J., Koral J., Ravel A., Féasson L., Murias J. M., Busso T. (2023). Neuromuscular and autonomic function is fully recovered within 24 h following a sprint interval training session. Eur. J. Appl. Physiol. 123 (10), 2317–2329. doi:10.1007/s00421-023-05249-6
Mastalerz A., Johne M., Mróz A., Bojarczuk A., Stastny P., Petr M., et al. (2024). Changes of anaerobic power and lactate concentration following intense glycolytic efforts in elite and sub-elite 400-meter sprinters. J. Hum. Kinet. 91, 165–174. doi:10.5114/jhk/186074
Matusiński A., Pietraszewski P., Krzysztofik M., Gołaś A. (2021). The effects of resisted post-activation sprint performance enhancement in elite female sprinters. Front. Physiol. 12, 651659. doi:10.3389/fphys.2021.651659
McManus L., Lowery M., Merletti R., Søgaard K., Besomi M., Clancy E. A., et al. (2021). Consensus for experimental design in electromyography (CEDE) project: terminology matrix. J. Electromyogr. Kinesiol. 59, 102565. doi:10.1016/j.jelekin.2021.102565
Mendez-Villanueva A., Hamer P., Bishop D. (2007). Physical fitness and performance. Fatigue responses during repeated sprints matched for initial mechanical output. Med. Sci. Sports Exerc. 39 (12), 2219–2225. doi:10.1249/mss.0b013e31815669dc
Neumann D. (2010). Kinesiology of the hip: a focus on muscular actions. J. Orthop. Sports Phys. Ther. 40 (2), 82–94. doi:10.2519/jospt.2010.3025
NSCA-National Strength & Conditioning Association (Ed.). (2021). Essentials of strength training and conditioning. Human kinetics.
Paton C. D., Hopkins W. G. (2001). Tests of cycling performance. Sports Med. 31 (7), 489–496. doi:10.2165/00007256-200131070-00004
Peñailillo L., Blazevich A., Numazawa H., Nosaka K. (2013). Metabolic and muscle damage profiles of concentric versus repeated eccentric cycling. Med. Sci. Sports Exerc. 45 (9), 1773–1781. doi:10.1249/MSS.0b013e31828f8a73
Piperi A., Warnier G., VAN Doorslaer De Ten Ryen S., Benoit N., Antoine N., Copine S., et al. (2024). Repeated sprint training in hypoxia improves repeated sprint ability to exhaustion similarly in active males and females. Med. Sci. Sports Exerc. 56 (10), 1988–1999. doi:10.1249/MSS.0000000000003485
Rose A. J., Hargreaves M. (2010). Exercise increases Ca2+-calmodulin-dependent protein kinase II activity in human skeletal muscle. J. Physiol. 553 (1), 303–309. doi:10.1113/jphysiol.2003.054171
Sale D. G. (2002). Postactivation potentiation: role in human performance. Exerc. Sport Sci. Rev. 30 (3), 138–143. doi:10.1097/00003677-200207000-00008
Sauvé B., Haugan M., Paulsen G. (2024). Physical and physiological characteristics of elite CrossFit athletes. Sports (Basel, Switz.) 12 (6), 162. doi:10.3390/sports12060162
Schiaffino S., Reggiani C. (2011). Fiber types in mammalian skeletal muscles. Physiol. Rev. 91 (4), 1447–1531. doi:10.1152/physrev.00031.2010
Shiming L., Quansheng X., Zhai J., Bu Y., Han L. (2016). Estimation of dynamic fatigue in muscle cycles induced by increasing load based on sEMG time-frequency analysis. China Sports Sci. Technol. 52 (03), 48–55. doi:10.16470/j.csst.201603007
Wilson J. M., Duncan N. M., Marin P. J., Brown L. E., Loenneke J. P., Wilson S. M., et al. (2013). Meta-analysis of postactivation potentiation and power: effects of conditioning activity, volume, gender, rest periods, and training status. J. Strength Cond. Res. 27 (3), 854–859. doi:10.1519/JSC.0b013e31825c2bdb
Yetter M., Moir G. L. (2008). The acute effects of heavy back and front squats on speed during forty-meter sprint trials. J. Strength Cond. Res. 22 (1), 159–165. doi:10.1519/JSC.0b013e31815f958d
Zhang Y., Diao P., Wang J., Li S., Fan Q., Han Y., et al. (2024). The effect of post-activation performance enhancement enhancement alone or in combination with caffeine on anaerobic performance in boxers: a double-blind, randomized crossover study. Nutrients 16 (2), 14. doi:10.3390/nu16020235
Zipp P. (1982). Recommendations for the standardization of lead positions in surface electromyography. Eur. J. Appl. Physiol. 50 (1), 41–54. doi:10.1007/BF00952243
Keywords: post-activation performance enhancement (PAPE), muscle endurance, recovery duration, surface electromyography, wingate test
Citation: Hu Y, Liu W, Duan Q and Gong Z (2025) Muscle activity and power output recovery: the roles of rest duration and underlying endurance capacity in the wingate test. Front. Physiol. 16:1674597. doi: 10.3389/fphys.2025.1674597
Received: 28 July 2025; Accepted: 27 November 2025;
Published: 11 December 2025.
Edited by:
Darryl Cochrane, Massey University, New ZealandReviewed by:
Leonardo Coelho Rabello de Lima, University of São Paulo, BrazilVenugopal Gopinath, NSS College of Engineering, India
Daniel Santarém, University of Trás-os-Montes and Alto Douro, Portugal
Copyright © 2025 Hu, Liu, Duan and Gong. This is an open-access article distributed under the terms of the Creative Commons Attribution License (CC BY). The use, distribution or reproduction in other forums is permitted, provided the original author(s) and the copyright owner(s) are credited and that the original publication in this journal is cited, in accordance with accepted academic practice. No use, distribution or reproduction is permitted which does not comply with these terms.
*Correspondence: Zhigang Gong, Z29uZ3poaWdhbmdAanhudS5lZHUuY24=
†ORCID: Yuxiao Hu, orcid.org/0009-0004-0384-1216; Weijun Liu, orcid.org/0009-0001-1985-4650; Qingqing Duan, orcid.org/0009-0000-5702-049X; Qingqing Duan, orcid.org/0000-0002-1899-6243