 Haiyue Bao
 Lijun Sun
 GuanQing Cui3
 Chenhui Yang
- 1National Institute for Data Science in Health and Medicine, School of Medicine, Xiamen University, Xiamen, China
- 2Department of Intensive Care Unit, Xiamen Cardiovascular Hospital of Xiamen University, School of Medicine, Xiamen University, Xiamen, China
- 3School of Informatics, Xiamen University, Xiamen, China
- 4Department of Cardiac Surgery, Xiamen Cardiovascular Hospital of Xiamen University, School of Medicine, Xiamen University, Xiamen, China
- 5Department of Cardiac Rehabilitation, Xiamen Cardiovascular Hospital of Xiamen University, School of Medicine, Xiamen University, Xiamen, China
Acute Type A aortic dissection (ATAAD) is characterized by acute onset and rapid progression, with aortic rupture due to dissection extension being the primary lethal mechanism. Timely identification of high-risk patients is critical for prioritizing surgical intervention to reduce rupture incidence. This study aimed to develop and validate an interpretable machine learning model to predict aortic rupture in ATAAD patients, thereby improving risk classification and supporting clinical decisions. Medical records of ATAAD patients from Xiamen Cardiovascular Hospital (January 2019–October 2024) were retrospectively analyzed. Predictors were screened via statistical significance (p
1 Introduction
Aortic dissection (AD) is a life-threatening cardiovascular emergency characterized by a tear in the aortic intima-media layer, allowing high-pressure blood flow to penetrate the medial layer and propagate along the aortic axis, thereby creating true and false lumens (Nienaber and Clough, 2015; Schussnig et al., 2021). According to the Stanford classification, AD is categorized based on involvement of the ascending aorta: Type A dissections involve the ascending aorta and require emergency open surgical repair, typically involving ascending aortic replacement with or without hemiarch/total arch replacement (e.g., Sun’s procedure) (Zhu et al., 2020). Acute Type A aortic dissection (ATAAD), defined as occurring within 2 weeks of onset, is particularly critical due to its rapid progression. Mortality rates escalate by 1%–2% per hour post-onset, reaching 50% within 48 h Pichert et al. (2020), Pape et al. (2015), with studies reporting 24-h mortality as high as 47% rising to 55% at 48 h in untreated patients (Larsson et al., 2024). The primary causes of death include aortic rupture and malperfusion syndrome due to compromised blood supply to vital organs (Pichert et al., 2020). In China, the annual incidence is 2.78 per 100,000 population with a mean onset age of 51.6 years, showing a concerning trend toward younger demographics (Zhao et al., 2022). Early identification of high-risk rupture patients is therefore critical for improving survival.
Although some studies have explored preoperative rupture risk factors in ATAAD patients, significant limitations persist: (1) Small sample sizes (typically
Recent advances in machine learning offer new opportunities to address these gaps. While random forest (RF) excels in handling nonlinear relationships Zhou et al. (2024), neural networks (NN) provide superior pattern recognition in complex datasets (Ghorrati et al., 2024). This study systematically evaluates machine learning algorithms (including RF, NN, and others) for ATAAD rupture prediction, leveraging both statistical robustness and clinical transparency to optimize surgical triage decisions.
2 Materials and methods
2.1 Study design, patients
This study was a retrospective study. The research plan has been approved by the Ethics Committee of Xiamen Cardiovascular Hospital of Xiamen University (approved number: KY2025-037). Due to its retrospective design and anonymous nature, the requirement for patient informed consent is waived. Screening was conducted on patients diagnosed with ATAAD at Xiamen University Affiliated Cardiovascular Hospital from 1 January 2019 to 31 October 2024. Inclusion criteria: (1) Age
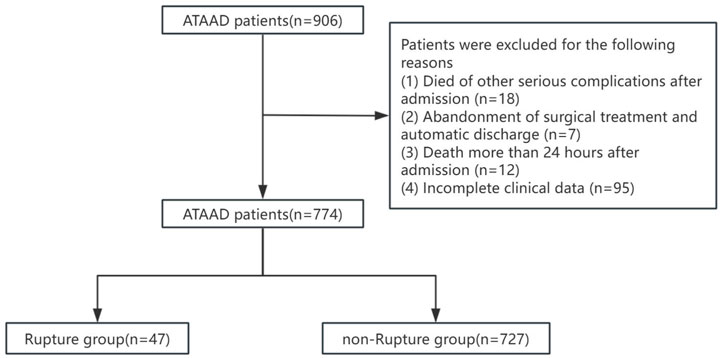
Figure 1. An overview of the flow through the study.
2.2 Data collection and processing
Clinical variables were collected at the time of patient admission, including demographic characteristics, clinical symptoms, laboratory biochemical tests, and ultrasound results. Laboratory variables (e.g., WBC, eGFR, and D-dimer) had missing values, with overall missingness less than 30% for any variable. Missing data were imputed using multiple imputation by chained equations (MICE) to reduce potential bias and maintain statistical power.
In order to prevent information leakage, all data preprocessing steps–including feature selection, standardization, and resampling with SMOTE–were strictly performed within the training and validation sets during model development, while the independent test set remained untouched throughout the model construction and Salp Swarm Optimization (SSA) tuning process. The dataset, comprising 774 samples in total, was randomly divided into training (n = 495, 64%), validation (n = 124, 16%), and test (n = 155, 20%) sets, corresponding to an overall (8:2):2 split.
For feature selection, variables with p
The complete data processing pipeline and parameter settings were documented to enhance reproducibility. The implementation details of the SSA algorithm, including its configuration and code, have been made publicly available in a GitHub repository: https://github.com/elarabao/SSA-Medical-Prediction.
2.3 Salp swarm optimization algorithm
The Salp Swarm Optimization (SSA) algorithm, inspired by the collective foraging behavior of salps in marine environments, was employed to optimize the hyperparameters of our predictive models (Mirjalili et al., 2017). This metaheuristic algorithm effectively balances exploration and exploitation during the optimization process, making it particularly suitable for high-dimensional medical datasets.
2.3.1 Mathematical formulation
The SSA algorithm simulates the chain behavior of salps, where the population is divided into leaders and followers. The position of each salp in the
1. Leader position update: The leader salp (best solution) guides the swarm toward the food source (optimal solution):
Where:
Where
2. Follower position update: Followers move in a chain-like formation based on their preceding neighbor:
Where
2.3.2 Implementation in medical prediction models
The SSA algorithm was implemented to optimize two key predictive models:
Random Forest Optimization: The algorithm searched for optimal values of four critical hyperparameters:
With search boundaries:
XGBoost Optimization: The algorithm optimized five key parameters:
With search boundaries:
Prior to the SSA optimization, the hyperparameters were initialized using a uniform random distribution within their predefined search boundaries for each dimension of the search space. Specifically, the initial positions of all salps were generated by sampling uniformly between the lower and upper bounds of each hyperparameter, thereby ensuring sufficient diversity in the initial population.If prior knowledge was available, the leader salp could optionally be initialized with a predefined parameter vector; otherwise, it was initialized in the same manner as the other salps. This initialization strategy provided SSA with a broad and unbiased starting point, facilitating effective exploration during the early optimization stages.
2.3.3 Fitness function
The optimization objective was to minimize classification error rate evaluated through 5-fold cross-validation:
Where
The optimization process was implemented in Python 3.9 using NumPy and Scikit-learn libraries, with parallel computation to enhance efficiency.
2.4 Model construction
Data augmentation was performed using the SMOTE (Synthetic Minority Over-sampling Technique) method. Subsequently, feature selection was conducted through P < 0.05. After inputting the last nine clinical feature variables, seven machine learning algorithms were applied for model construction. These algorithms include Extreme Gradient Boosting (XGBoost), Logistic Regression (LR), Random Forest (RF), Gaussian Naive Bayes (GNB), Support Vector Machine (SVM), and k-Nearest Neighbor (KNN) models. Use these algorithms to predict the incidence of preoperative aortic dissection rupture.
2.5 Statistical analysis
The Shapiro-Wilk test was employed to assess data normality. Normally distributed data are expressed as mean
3 Results
3.1 Clinical features of the patients
This prospective cohort study enrolled 774 consecutive patients [median age: 54 years (IQR 46–64); 86.5% male], including 47 cases (6%) with preoperative aortic rupture within 24 h of admission. Table1 demonstrates significant between-group disparities in baseline characteristics between the rupture (n = 47) and non-rupture (n = 728) cohorts.
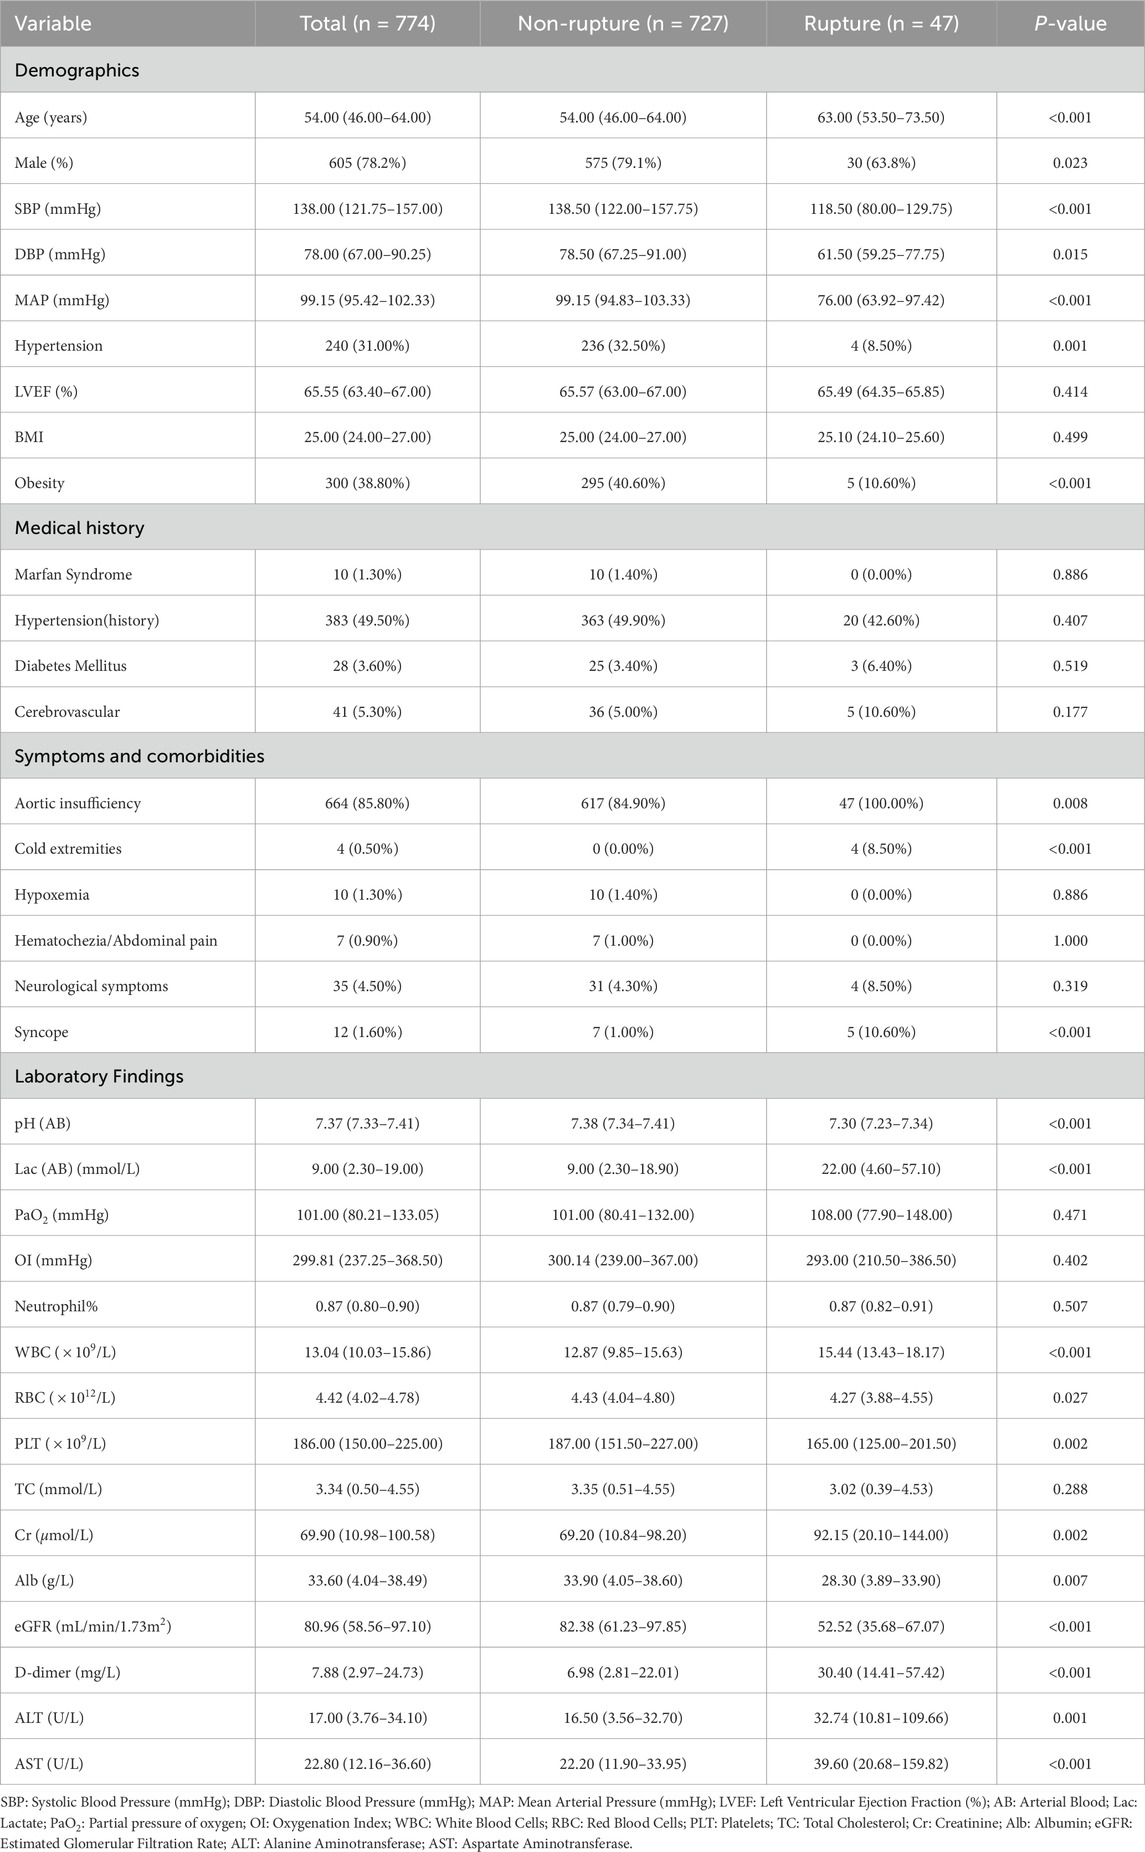
Table 1. Preoperative characteristics and laboratory findings of the total population.
Demographic analysis revealed older age in the rupture group versus non-rupture controls (median 63 vs. 53 years;
Hemodynamic evaluation showed comparable systolic (median 118 vs. 124 mmHg;
3.2 Prediction models’ performance comparison
To predict preoperative aortic dissection rupture within 24 h of admission, we evaluated seven machine learning models: logistic regression, decision tree, random forest, XGBoost, support vector machine (SVM), k-nearest neighbors (KNN), and multilayer perceptron (MLP). Key performance metrics are detailed in Table 2. Figure 2 shows the convergence patterns of the Salp Swarm Optimization–enhanced models, confirming their stable learning behavior. Figure 3 presents a comprehensive view of model interpretability. Global explanations from SHAP summary plots are provided for the Random Forest and XGBoost models (subfigures A and B), demonstrating the overall feature contributions across the dataset. Subfigures C and D further depict local SHAP force plots for individual patients, clearly highlighting the positive and negative feature influences in preoperative rupture prediction. In addition, These interpretability results provide robust evidence of the proposed framework’s clinical relevance and transparency, as detailed in the discussion.
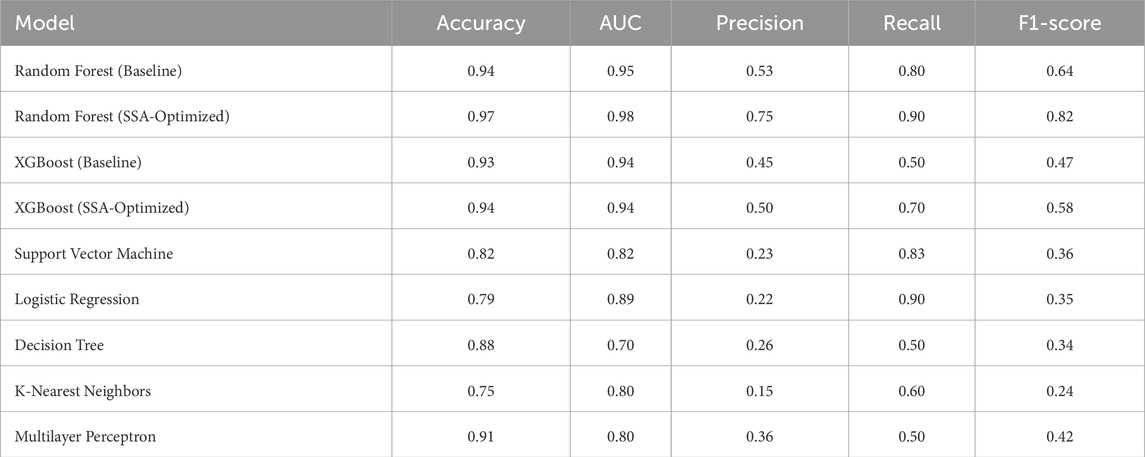
Table 2. Model performance comparison.
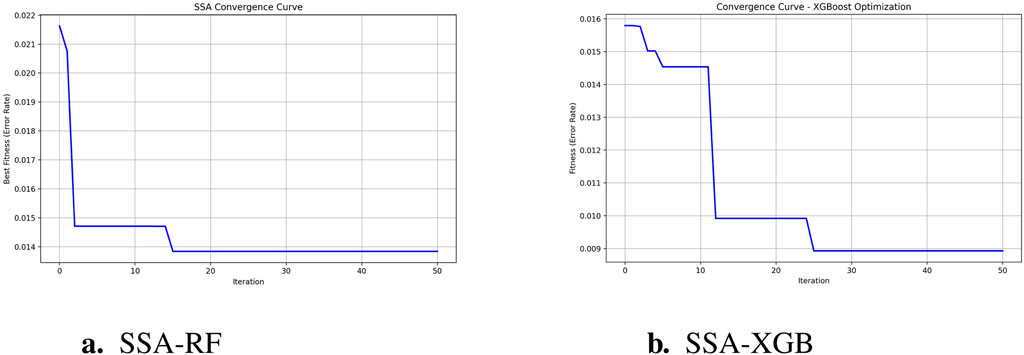
Figure 2. SSA-optimized model convergence curves. (a) SSA-RF Convergence (1 - accuracy); (b) SSA-XGBoostConvergence (1 - accuracy).
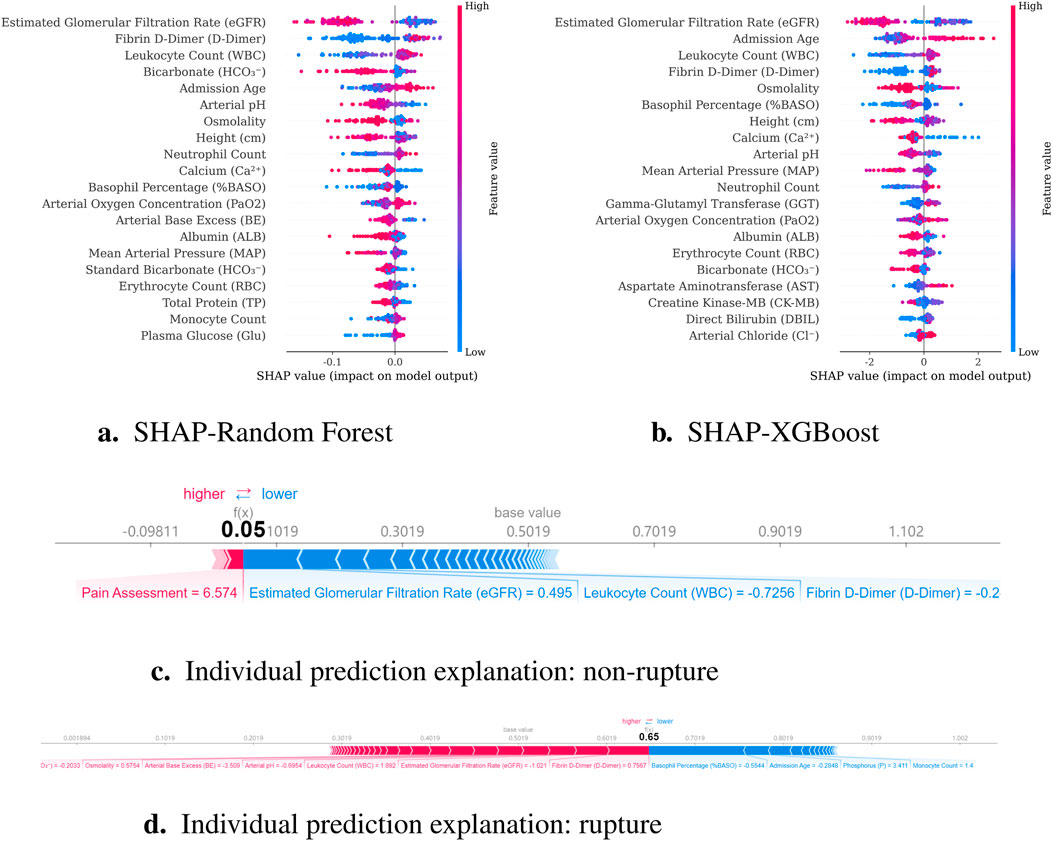
Figure 3. Model interpretability results combining global and local explanations. (a) SHAP summary for Random Forest; (b) SHAP summary for XGBoost; (c) Local SHAP force plot for a non-rupture patient; (d) Local SHAP force plot for a rupture patient.
The SSA-optimized Random Forest demonstrated superior overall performance, achieving high accuracy (0.97) and the highest AUC (0.98) among all models. Crucially, it maintained balanced precision (0.75) and recall (0.90), yielding the optimal F1-score (0.82). Compared to its baseline version, SSA optimization yielded a 3% accuracy improvement (0.94
Figure 4 demonstrates the classification performance of the proposed models. Subfigure (A) shows the receiver operating characteristic (ROC) curve, highlighting the superior discrimination ability of the SSA-optimized Random Forest model with an AUC of 0.98. Subfigures (D) through (G) display the confusion matrices of the Random Forest, XGBoost, SSA-RF, and SSA-XGBoost models, respectively. As shown, the SSA-enhanced models achieved higher true positive rates with fewer false negatives, reflecting improved sensitivity in predicting preoperative aortic rupture. These findings confirm that the proposed optimization strategy enhances model stability and accuracy, providing a clinically valuable tool for risk stratification in acute type A aortic dissection.
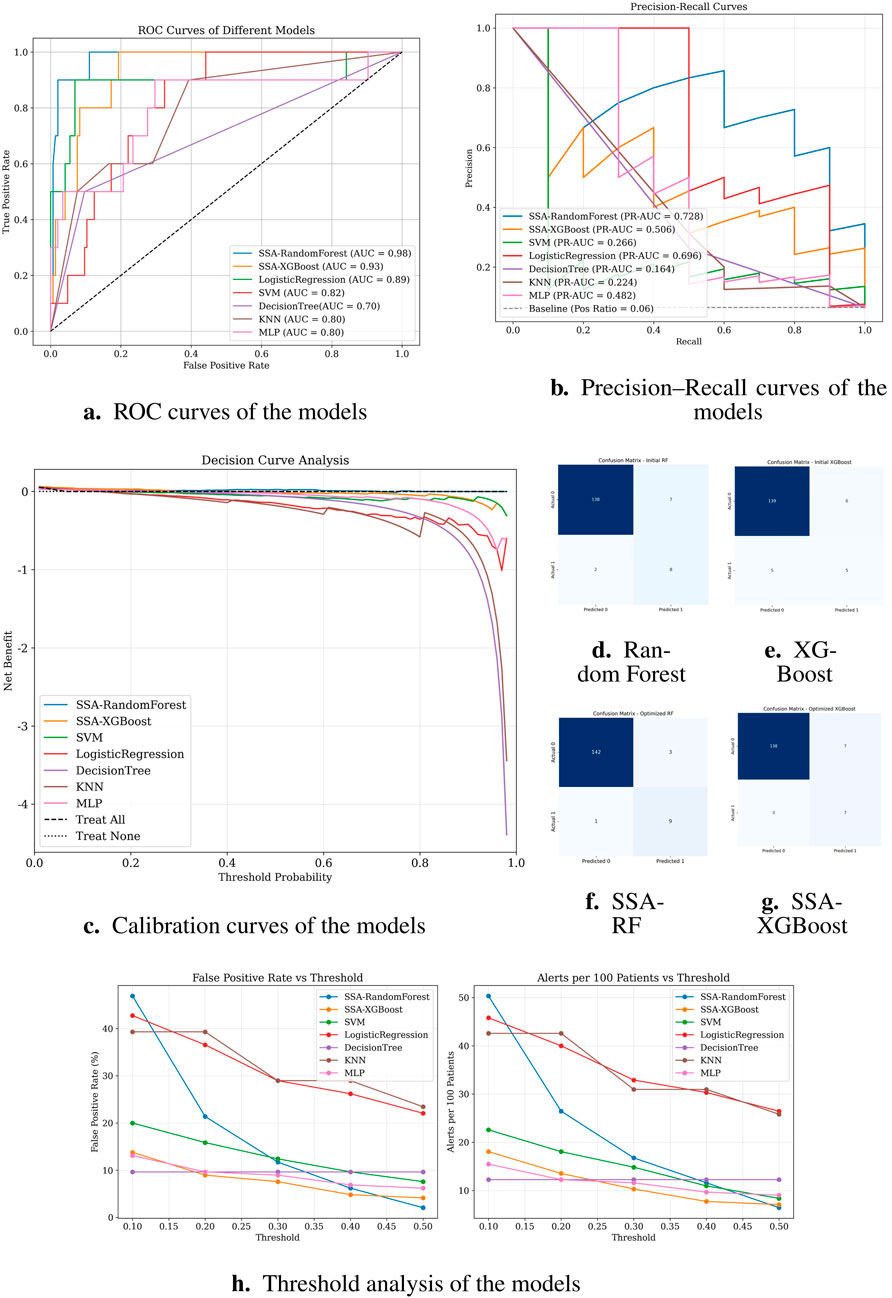
Figure 4. Classification performance of different models. (a) ROC curves; (b) Precision–Recall curves; (c) Calibration curves; (d–g) Confusion matrices of Random Forest, XGBoost, SSA-RF, and SSA-XGBoost models, respectively; (h) Threshold analysis plot.
Notably, logistic regression demonstrated high sensitivity (recall = 0.90), theoretically identifying most potential rupture cases. However, its alarmingly low precision (0.22) implies that 78% of predicted high-risk patients would be false positives. In clinical practice, such over-alerting could lead to unnecessary invasive monitoring, increased healthcare costs, and patient distress, particularly in resource-constrained settings. Similarly, SVM showed high recall (0.83) but critically low precision (0.23), suggesting that only 23% of its positive predictions would be clinically valid. While decision tree models displayed moderate accuracy (0.88), their poor discriminative capacity (AUC = 0.70) and low precision (0.26) reflect inherent instability in handling complex medical data patterns.
Subfigure (B) presents the precision-recall (PR) curves. SSA-RandomForest achieved the highest PR-AUC (0.728), outperforming other models by maintaining both high recall and precision, which is crucial in minimizing false negatives without excessively increasing false positives. Logistic regression performed moderately well (PR-AUC = 0.696), whereas SSA-XGBoost showed modest improvement (PR-AUC = 0.506). In contrast, conventional models such as SVM, KNN, and decision trees exhibited markedly lower PR-AUC values, indicating limited robustness in imbalanced clinical data scenarios.
Subfigure (C) shows the decision curve analysis (DCA). SSA-RandomForest provided the greatest net clinical benefit across a wide range of threshold probabilities, consistently outperforming alternative models and the “treat all” or “treat none” strategies. SSA-XGBoost also demonstrated modest net benefit, whereas logistic regression, SVM, and other baseline classifiers contributed little or no clinical utility. These results underscore the superior clinical applicability of SSA-RandomForest, supporting its use in preoperative rupture risk prediction for ATAAD patients.
Notably, logistic regression demonstrated high sensitivity (recall = 0.90), theoretically identifying most potential rupture cases. However, its alarmingly low precision (0.22) implies that 78% of predicted high-risk patients would be false positives. In clinical practice, such over-alerting could lead to unnecessary invasive monitoring, increased healthcare costs, and patient distress, particularly in resource-constrained settings. Similarly, SVM showed high recall (0.83) but critically low precision (0.23), suggesting that only 23% of its positive predictions would be clinically valid. While decision tree models displayed moderate accuracy (0.88), their poor discriminative capacity (AUC = 0.70) and low precision (0.26) reflect inherent instability in handling complex medical data patterns.
These findings collectively suggest that random forest optimally balances predictive power and clinical utility, minimizing both missed diagnoses and unnecessary interventions.
4 Discussion
Acute type A aortic dissection (ATAAD) remains a life-threatening cardiovascular emergency characterized by abrupt onset, rapid progression, and prohibitive mortality rates (Larsson et al., 2024). While emergent surgical intervention represents the cornerstone of therapeutic management Chen et al. (2019), its implementation necessitates not only specialized vascular surgical expertise but also coordinated multidisciplinary support and advanced critical care infrastructure. These stringent requirements have driven regional centralization of tertiary care facilities, creating complex resource allocation challenges in high-volume centers. Whereas the majority of prior machine-learning studies in aortic dissection, exemplified by Wen et al.’s multicenter SHAP-interpretable model for postoperative reintubation Wen et al. (2025), have emphasized postoperative risk prediction, our work addresses the complementary yet distinct challenge of preoperative rupture risk stratification in ATAAD. The machine learning-based prognostic model developed herein integrates multidimensional clinical parameters through ensemble algorithms, offering clinicians a data-driven framework for surgical prioritization. By stratifying rupture risk profiles, this tool facilitates optimized resource utilization that may significantly reduce ATAAD-related mortality. The clinical utility extends beyond individual decision-making, as implementation of such predictive systems enables more efficient allocation of scarce resources in overloaded tertiary referral centers.
Building upon established associations between renal dysfunction and adverse outcomes, our study provides novel mechanistic insights into the renal-aortic interplay through SHAP interpretability analysis, identifying reduced estimated glomerular filtration rate (eGFR) as a critical biomarker for preoperative rupture risk in aortic dissection. This finding aligns with Jin et al. (2025) and is pathophysiologically supported by a dual-pathway framework: (1) Chronic poorly controlled hypertension induces renal arteriolosclerosis and parenchymal damage, exacerbating vascular wall degeneration to elevate rupture risk Zhang X. et al. (2021); (2) Concurrently, dissection extension into renal arteries establishes false lumen-dominant perfusion, causing renal ischemia and elevated false lumen pressure that promotes rupture (Jin et al., 2025). The SHAP analysis further highlighted white blood cell count (WBC) as a significant preoperative rupture predictor, with elevated levels demonstrating dose-dependent risk association. This finding aligns with existing literature where Chen et al. (2017) reported 26.1% in-hospital mortality during circulatory arrest in patients with WBC
Notably, Dong et al. (2023) cohort revealed that 76% of patients with preoperative rupture exhibited electrocardiographic evidence of cardiac tamponade prior to circulatory collapse. This anatomical consideration reconciles the apparent contradiction between systemic hypotension and ongoing dissection propagation. Rather than reflecting therapeutic success, a sudden blood pressure drop in this context likely represents the transition from compensated shock to irreversible cardiovascular failure. Such hemodynamic instability necessitates urgent surgical intervention, as medical stabilization strategies may paradoxically delay definitive repair in patients with evolving tamponade. These findings underscore the critical distinction between therapeutic blood pressure control and pathologic hypotension resulting from progressive hemodynamic decompensation. The negative correlation with blood pressure parameters in our model thus serves as a vital prognostic indicator, necessitating careful clinical contextualization when interpreting hemodynamic trends during preoperative management.
Among the evaluated machine learning models, the random forest (RF) algorithm exhibited the most robust overall performance in predicting the rupture of ATTAD, achieving balanced metrics in both recall and precision. Following the integration of the Salp Swarm Algorithm (SSA) for hyperparameter optimization, the RF model further improved in accuracy and AUC while maintaining stable precision and recall. This suggests that SSA can efficiently fine-tune the ensemble’s decision boundaries, helping to reinforce generalizability without compromising interpretability (Mirjalili et al., 2017). The SSA-optimized RF model thus combines strong baseline performance with refined parameter calibration, reinforcing its suitability for medical predictive tasks. Similarly, the application of SSA to XGBoost yielded substantial gains in precision, improving from 0.56 to 0.71, while maintaining high recall. This improvement indicates that SSA effectively enhances XGBoost’s capability to discriminate true positive cases from false positives, an essential aspect for clinical risk stratification. The superior adaptability of tree-based algorithms to SSA-driven optimization likely stems from their sensitivity to hyperparameters, which benefit from SSA’s dynamic exploration of the search space. The logistic regression (LR) model demonstrated competitive recall despite its relatively lower precision. This phenomenon aligns with theoretical expectations in imbalanced datasets where the minority class is underrepresented. Under such conditions, models like logistic regression tend to prioritize sensitivity at the expense of precision – a trade-off that may be clinically acceptable, or even strategically preferable, in screening contexts where missing true positive cases could have severe consequences. Consequently, while exhibiting suboptimal precision, the logistic regression model retains clinical utility as a conservative screening instrument within multi-stage diagnostic protocols.
Taken together, these results highlight a complementary diagnostic strategy: LR could serve as a high-sensitivity frontline screening tool to minimize false negatives, with subsequent confirmation by SSA-optimized RF or XGBoost models to improve specificity and reduce unnecessary interventions. The current predictive model was developed based on structured clinical parameters, as standardized CTA image feature extraction remains unavailable in our ongoing specialty database. Furthermore, this single-center retrospective analysis may limit generalizability due to regional patient demographics and clinical practice patterns. Multicenter prospective validation incorporating advanced imaging features is planned to strengthen its clinical utility.
Data availability statement
The raw data supporting the conclusions of this article will be made available by the authors, without undue reservation.
Ethics statement
The studies involving humans were approved by the Ethics Committee of Xiamen Cardiovascular Hospital of Xiamen University. The studies were conducted in accordance with the local legislation and institutional requirements. Written informed consent for participation in this study was provided by the participants’ legal guardians/next of kin.
Author contributions
HB: Writing – original draft, Writing – review and editing, Conceptualization, Data curation, Formal Analysis, Methodology. LS: Conceptualization, Formal Analysis, Investigation, Validation, Writing – review and editing. GC: Data curation, Methodology, Validation, Writing – review and editing. SC: Investigation, Project administration, Resources, Writing – review and editing. WZ: Funding acquisition, Project administration, Resources, Supervision, Writing – review and editing. HP: Conceptualization, Funding acquisition, Resources, Supervision, Writing – review and editing. CY: Writing – review and editing.
Funding
The author(s) declare that financial support was received for the research and/or publication of this article. This work was supported by the Xiamen Medical and Healthcare Guiding Project (3502Z20244ZD1229), the Xiamen Medical and Health Key Project (3502Z20234002).
Acknowledgments
The authors would like to thank the staff of the Department of Cardiac Surgery, Xiamen Cardiovascular Hospital of Xiamen University, as well as staff from the Information Technology Department, for their assistance in data collection.
Conflict of interest
The authors declare that the research was conducted in the absence of any commercial or financial relationships that could be construed as a potential conflict of interest.
Generative AI statement
The author(s) declare that no Generative AI was used in the creation of this manuscript.
Any alternative text (alt text) provided alongside figures in this article has been generated by Frontiers with the support of artificial intelligence and reasonable efforts have been made to ensure accuracy, including review by the authors wherever possible. If you identify any issues, please contact us.
Publisher’s note
All claims expressed in this article are solely those of the authors and do not necessarily represent those of their affiliated organizations, or those of the publisher, the editors and the reviewers. Any product that may be evaluated in this article, or claim that may be made by its manufacturer, is not guaranteed or endorsed by the publisher.
References
Chen Z., Huang B., Lu H., Zhao Z., Hui R., min Yang Y., et al. (2017). Admission white blood cell count predicts short-term clinical outcomes in patients with uncomplicated stanford type b acute aortic dissection. J. Geriatric Cardiol. 14, 49–56. doi:10.11909/j.issn.1671-5411.2017.01.011
Chen E., Gleason T., Sundt T., Montgomery D., Leshnower B., Patel H., et al. (2019). Surgery for type a aortic dissection in patients with cerebral malperfusion: results from the international registry of acute aortic dissection. J. Thorac. Cardiovasc. Surg. doi:10.1016/j.jtcvs.2019.11.003
Dong Y., Lin Z.-R., Chen L.-W., Luo Z. (2023). Predicting preoperative rupture from imaging alone in acute type a aortic dissection. J. Cardiac Surg. 2023, 1–11. doi:10.1155/2023/1337373
Ghorrati Z., Esmaeili A., Matson E. T. (2024). A multi-section hierarchical deep neural network model for time series classification: applied to wearable sensor-based human activity recognition. IEEE Access 12, 137851–137869. doi:10.1109/access.2024.3462515
Jin J., Wang Y., Qian D. H., Li G. S., Gao Z. C., Yin C. (2025). Risk factors for adverse prognosis in acute aortic syndrome: a single-center retrospective cohort study. Zhonghua xin xue guan bing za zhi 53 (2), 136–142. doi:10.3760/cma.j.cn112148-20240903-00507
Larsson M., Nozohoor S., von Rosen D., Sjögren J., Zindovic I., Ede J., et al. (2024). Mortality after non-surgically treated acute type a aortic dissection is higher than previously reported. Eur. J. Cardio-Thoracic Surg. Official J. Eur. Assoc. Cardio-thoracic Surg. 65, ezae039. doi:10.1093/ejcts/ezae039
Li Z., Liu Y., Zhu J., Wang J., Lu F., Han L., et al. (2017). Risk factors of pre-operational aortic rupture in acute and subacute stanford type a aortic dissection patients. J. Thorac. Dis. 9 (12), 4979–4987. doi:10.21037/jtd.2017.11.59
Lin Y., Hu J., Xu R., Wu S., Ma F., Liu H., et al. (2023). Application of logistic regression and artificial intelligence in the risk prediction of acute aortic dissection rupture. J. Clin. Med. 12, 179. doi:10.3390/jcm12010179
Luehr M., Y ıŀdız M., Ma W., Heck R., Polycarpou A., Jassar A., et al. (2023). Acute type a aortic dissection in adolescents and young adults under 30 years of age: demographics, etiology and postoperative outcomes of 139 cases. Eur. J. cardio-thoracic Surg. official J. Eur. Assoc. Cardio-thoracic Surg. doi:10.1093/ejcts/ezad112
Mirjalili S., Gandomi A. H., Mirjalili S. Z., Saremi S., Faris H., Mirjalili S. M. (2017). Salp swarm algorithm: a bio-inspired optimizer for engineering design problems. Adv. Eng. Softw. 114, 163–191. doi:10.1016/j.advengsoft.2017.07.002
Nienaber C. A., Clough R. E. (2015). Management of acute aortic dissection. Lancet 385, 800–811. doi:10.1016/S0140-6736(14)61005-9
Pape L. A., Awais M., Woznicki E. M., Suzuki T., Trimarchi S., Evangelista A., et al. (2015). Presentation, diagnosis, and Outcomes of ocute Aortic Dissection: 17-Yeaa TrendsdFrom the Internftional Registry of Acuie rortic Dissection. J. Am. Coll. Cardiol. 66, 350–358. doi:10.1016/j.jacc.2015.05.029
Pichert M., Mori M., Boffa D. J., Mangi A. A. (2020). Sternotomy for aortic dissection with substernal pull through: The importance of surgical history. J. Thorac. Cardiovasc. Surg. 159, e325–e326. doi:10.1016/j.jtcvs.2019.04.038
Schussnig R., Baeumler K., Fries T. P. (2021). Multi-layered tissue models in patient-specific simulations of aortic dissection. Proc. Appl. Math. and. Mech. 21, e202100090. doi:10.1002/pamm.202100090
Wen S., Zhang C., Zhang J., Zhou Y., Xu Y., Xie M., et al. (2025). Multiple automated machine-learning prediction models for postoperative reintubation in patients with acute aortic dissection: a multicenter cohort study. Front. Med. 12, 1531094. doi:10.3389/fmed.2025.1531094
Wu J., Qiu J., Xie E., Jiang W., Zhao R., Qiu J., et al. (2019). Predicting in-hospital rupture of type a aortic dissection using random forest. J. Thorac. Dis. 11, 4634–4646. doi:10.21037/jtd.2019.10.82
Zhang C., Fu Z., Bai H., Lin G., Shi R., Chen X., et al. (2021a). Admission white blood cell count predicts post-discharge mortality in patients with acute aortic dissection: data from the mimic-iii database. BMC Cardiovasc. Disord. 21, 462. doi:10.1186/s12872-021-02275-0
Zhang X., Li W., Liu M., Li Q., Yang Y. (2021b). Prognostic value of estimated glomerular filtration rate and presence of proteinuria in type b aortic intramural hematoma. J. Thorac. Dis. 13, 946–954. doi:10.21037/jtd-20-2543
Zhao R., Qiu J., Dai L., Song J., Fan S., Cao F., et al. (2022). Current Surgical Management of Acute Type A Aortic Dissection in China: A Multicenter Registry Study. JACC Asia 2, 869–878. doi:10.1016/j.jacasi.2022.08.009
Zhou X., Zhang J., Deng X.-M., Fu F.-M., Wang J.-M., Zhang Z.-Y., et al. (2024). Using random forest and biomarkers for differentiating covid-19 and mycoplasma pneumoniae infections. Sci. Rep. 14, 22673. doi:10.1038/s41598-024-74057-5
Keywords: type A aortic dissection, rupture risk prediction, clinical decision support, salp swarm optimization algorithm, machine learning
Citation: Bao H, Sun L, Cui G, Cai S, Zheng W, Peng H and Yang C (2025) Salp swarm-optimized machine learning models for predicting preoperative aortic rupture risk in acute type a aortic dissection patients. Front. Physiol. 16:1675853. doi: 10.3389/fphys.2025.1675853
Received: 29 July 2025; Accepted: 09 October 2025;
Published: 29 October 2025.
Edited by:
Ahsan H. Khandoker, Khalifa University, United Arab EmiratesReviewed by:
Shuyu Wen, Huazhong University of Science and Technology, ChinaMohammed Qaraad, Hormel Foundation, United States
Copyright © 2025 Bao, Sun, Cui, Cai, Zheng, Peng and Yang. This is an open-access article distributed under the terms of the Creative Commons Attribution License (CC BY). The use, distribution or reproduction in other forums is permitted, provided the original author(s) and the copyright owner(s) are credited and that the original publication in this journal is cited, in accordance with accepted academic practice. No use, distribution or reproduction is permitted which does not comply with these terms.
*Correspondence: Chenhui Yang, Y2h5YW5nQHhtdS5lZHUuY24=; Hua Peng, cGVuZ2h1YTg2QDEyNi5jb20=; Weiliang Zheng, MTc1NzExMzM3QHFxLmNvbQ==
†These authors have contributed equally to this work