 Qiaoyi Chen1Yukun Huang1Zhiya Yu1Wenjie He1Xueqin Hu1Jinhui Wu2Tianguang Cai3Yuhua Cui3
 Along Gao1*Hu Shu1*
- 1South China Biodiversity Research Center, College of Life Sciences, Guangzhou University, Guangzhou, Guangdong, China
- 2Agro-Tech Extension Center of Guangdong Province, Guangzhou, Guangdong, China
- 3Shenzhen Haijuyuan Aquacture Technology Co., Ltd., Shenzhen, Guangdong, China
Dissolved oxygen (DO) in aquatic ecosystems plays a pivotal role in fish farming, serving as a critical determinant for the sustainable development of aquaculture practices. When fish suffer hypoxic stress, they undergo a cascade of physiological adaptations. In this study, healthy E. cyanopodus were subjected to experimental treatments under normoxic (6.0 ± 0.05 mg/L) and hypoxic (1.6 ± 0.05 mg/L) conditions for 1 (H1), 3 (H3), 6 (H6), and 9 (H9) h to evaluate physiological responses. Liver RNA-seq analysis identified 6152 differentially expressed genes (DEGs) between the control group (H0) and the four hypoxia-treated groups (H1, H3, H6, H9). RNA-seq results indicated that hypoxia for 3–6 h was the key duration when significant physiological changes occurred in E. cyanopodus. KEGG enrichment analysis revealed significant involvement of these DEGs in key hypoxia-responsive pathways, including HIF-1 signaling, Glutathione metabolism, p53 signaling, PPAR signaling, and PI3K-Akt signaling pathways. These DEGs primarily played function in biological processes, including glycolysis/gluconeogenesis (aldob, hk, ldh-a, pparα, eno1, gpt), pyruvate metabolism (aldocb, ldh-a, fabp1), immune response (pnp, cxcl5, tnf-α, il1-β, il12-β), and apoptosis regulation (bax, bcl2, casp3). Their coordinated expression played a crucial role in mediating hypoxic adaptation of the liver and brain in E. cyanopodus. Three immune-related enzymes (AKP, ALT, AST), and two metabolic-related enzymes (GLU, LDH) were significantly expressed at 3 and 6 h. These results exactly proved that 3–6 h of hypoxic stress was the key period when E. cyanopodus experienced significant physiological changes. This study elucidated key physiological response changes underlying hypoxic stress in E. cyanopodus, which provided both theoretical framework for understanding hypoxic adaptation and practical insights for developing hypoxia-resistant breeding strategies.
1 Introduction
In aquaculture, the aquatic environment constitutes a complex system influenced by numerous factors (Wu et al., 2024). While many variables influence aquatic systems, dissolved oxygen (DO) is especially critical. The concentration of DO in aquatic ecosystems is subject to dynamic variations, which are influenced by natural factors such as seasonal shifts, photosynthesis, wind, salinity, temperature changes, and diurnal cycles (Chandel et al., 1997; Ma et al., 2013). Moreover, in intensive aquaculture systems, high-density farming practices result in the accumulation of unconsumed feed and fertilizers (Mader et al., 2017; Saetan et al., 2020). Besides, the natural environment continues to deteriorate, particularly due to agricultural run-off caused by excessive use of fertilizer and pesticide. These consequences promote excessive phytoplankton proliferation, triggering harmful algal blooms such as red tides. It accelerates water eutrophication which further deplete DO and exacerbate hypoxic conditions (Lefevre et al., 2014; Li et al., 2018). This phenomenon poses a significant threat to the health and sustainability of aquaculture (Mu et al., 2020; Sagasti et al., 2001). Consequently, fish have evolved complex physiological mechanisms to maintain oxygen homeostasis under hypoxic stress (Gong et al., 2024). These adaptive responses including metabolic modulation, immune system adjustments, and a suite of regulatory adaptations, such as a metabolic shift from aerobic glycolysis to anaerobic glycolysis/gluconeogenesis and pyruvate metabolism, elevating respiratory rate, enhancing angiogenesis, increasing erythrocyte production, alongside an activated immune response to enhance hypoxic tolerance (Zhao et al., 2022). Existing research has demonstrated that the molecular mechanisms underlying hypoxic adaptation in fish primarily involve energy utilization, oxygen transport efficiency, glucose metabolism regulation, and hypoxic resistance pathways (Aragonés et al., 2009; Chen et al., 2017; Gong et al., 2020; Hammarlund et al., 2020). These findings collectively provide crucial insights into the regulatory frameworks governing hypoxic stress responses in aquatic species.
Epinephelus cyanopodus, also known as the Speckled blue grouper, is a marine species of the Western Pacific, is classified within the Osteichthyes class, order Perciformes, family Serranidae, and genus Epinephelus. It is highly valued as a commercial species, which represents an important economic resource in Chinese fisheries sector (Cao et al., 2022). It is also prized for its high-quality muscle tissue, which contains abundant unsaturated fatty acids, particularly including eicosapentaenoic acid (EPA) and docosahexaenoic acid (DHA), while maintaining low fat (Cai et al., 2025). In recent years, E. cyanopodus farming has experienced rapid expansion. However, research on premium species such as E. cyanopodus remains relatively underdeveloped, with numerous challenges persisting. A key issue in intensive farming systems is the high-density cultivation environment. Although this approach offers greater economic returns for E. cyanopodus production, it also generates more pronounced adverse effects, particularly the reduction and fluctuation of DO levels in rearing waters (Sun et al., 2011). Acute severe hypoxia (DO < 1.0 mg/L) poses significant risks to most fish, including surfacing behavior (floating head), cessation of feeding, severely damaged the immune system, and even caused mortality (Domenici et al., 2007; Richards, 2011). These challenges pose significant constraints on the sustainable development of the E. cyanopodus aquaculture farming. To ensure the long-term viability of this industry, it is urgent to investigate the physiological adaptations to hypoxia and elucidate the underlying molecular regulatory mechanisms.
Transcriptome sequencing (RNA-seq) is a comprehensive study of gene expression at the RNA level and provides information on differentially expressed genes (DEGs) and gene functions. Nowadays, RNA-seq is now widely used in aquaculture as a standard method for analyzing DEGs (Xu et al., 2015; Zhang et al., 2022). Moreover, this approach is able to distinguish diverse gene expression patterns, facilitate the development of novel selective markers, and contribute to the discovery of previously uncharacterized genes (Herkenhoff et al., 2018; Jin et al., 2013). RNA-seq of liver has served as a valuable tool for elucidating hypoxic tolerance mechanisms in Osteichthyes, such as Epinephelus coioides (Wu et al., 2023), Pearl gentian grouper (Epinephelus lanceolatus ♂ × Epinephelus fuscoguttatus ♀) (Liang et al., 2024; Wang et al., 2024), Micropterus salmoides (He et al., 2022), Ctenopharyngodon idella (Zhang et al., 2025), Oreochromis niloticus (Ma et al., 2021). However, the molecular mechanisms underlying hypoxic adaptation in E. cyanopodus remain poorly explored, particularly through transcriptomic approaches.
This study aimed to elucidate the molecular response of E. cyanopodus to acute hypoxic stress through RNA-seq analysis. We conducted RNA-seq on liver tissues across multiple hypoxic exposure timepoints to identify critical hypoxia-responsive genes and pathways. Quantitative real-time PCR (qRT-PCR) was employed to validate hypoxia-responsive candidate genes and the expression patterns of key hypoxic genes in liver and brain. This study elucidated how energy metabolism, immune response, and cellular apoptosis influenced hypoxic tolerance by detecting gene expressions and enzyme activities in E. cyanopodus, providing not only a theoretical framework for breeding hypoxia-resistant varieties, but also insights applicable to understand hypoxic regulation mechanisms in other marine fish species under intensive aquaculture conditions.
2 Materials and methods
2.1 Ethical statement
The handling procedures and experimental protocols of all animals in this experiment were in accordance with the Experimental Animal Ethics Committee of Guangzhou University of China [(2025) 009].
2.2 Experimental fish and acute hypoxic exposure
The experiment was accomplished in Guangdong Marine Fishery Experiment Center. Healthy E. cyanopodus (average standard weight: 5.6 ± 0.3 g; average standard length: 6.1 ± 0.2 cm) were acclimated in cylindrical tanks (diameter: 1 m, height: 1.2 m) with constant ventilation for 2 weeks before prescription. The salinity of water was 20–30 ppt, the temperature was 28 °C ± 1 °C and the DO was 6.0 ± 0.05 mg/L. During the acclimatization period, fish were fed with commercial pellet feeds twice a day, the circulating seawater was used to maintain normal physiological activities of E. cyanopodus.
In order to determine the semi-lethal concentration of DO, 150 E. cyanopodus were collected in 5 preliminary experiment buckets with 30 fish in each bucket. We reduced the volume of water to one-third of the buckets to make oxygen consumption faster. In addition, the supply of oxygen was cut off by stopping aeration, reducing the supply of circulating water and covering the buckets with plastic films (Lai Xing-xing et al., 2022). The DO of water was respectively reduced to 0.9, 1.2, 1.5, 1.8, and 2.1 mg/L within 1 h, and the change of DO was monitored by a dissolved oxygen detector (Leici, Shanghai, China). Under the hypoxic stress, E. cyanopodus moved slowly, their bodies darkened, showed visible spots, floated unsteadily and lost balance. The numbers of dead E. cyanopodus were recorded at 1, 3, 6, and 9 h under each DO concentration treatment (Liang et al., 2022). Within 9 h, the cumulative mortality of E. cyanopodus was calculated under each treatment. Finally, the semi-lethal concentration of DO in 9 h was found to be 1.59 mg/L by linear interpolation (Song et al., 2022). In the subsequent hypoxic stress experiment, a concentration of 1.6 ± 0.05 mg/L of DO was used as the semi-lethal concentration for E. cyanopodus.
In total, 120 healthy individuals were divided into 3 buckets as 3 parallel buckets with 40 fish in each bucket, and all the experimental fish had been fasted for 24 h before the experiment. At the beginning of the experiment, we randomly took 3 fish from each bucket under normoxic condition, which was named as H0. Then the DO of the water in each bucket was reduced from 6.0 ± 0.05 mg/L to 1.6 ± 0.05 mg/L within 1 h. Throughout the hypoxic stress experiment, the concentration of DO was maintained at 1. 6 ± 0.05 mg/L by adjusting the input of oxygen and water. Under this condition of maintaining the DO level, 3 fish were randomly taken from each bucket at 1, 3, 6, and 9 h, respectively, and recorded as hypoxic stress groups H1, H3, H6 and H9 (Liang et al., 2024). All the experimental fish were anesthetized and then dissected. 45 liver and 45 brain tissues were obtained and collected into a centrifuge tube equipped with RNA Keeper Tissue Stabilizer (Vazyme, Nanjing, China). The liver tissues which were used for enzyme activity detection were cleaned by PBS and placed directly into an empty centrifuge tube and immediately stored in liquid nitrogen.
2.3 RNA extraction, cDNA library construction and sequencing
Total RNA was isolated from samples using Trizol reagent (thermofisher, 15596018) according to the manufacturer’s protocol. Specifying the thresholds or criteria used for assessing RNA quantity and purity by using Bioanalyzer 2100 and RNA 6000 Nano LabChip Kit (Agilent, CA, United States). Only high-quality RNA samples (RIN number >7.0) were used for sequencing library construction. The cleaved RNA fragments were subsequently reverse-transcribed into cDNA using SuperScript™ II Reverse Transcriptase (Invitrogen, CA, United States). After UDG enzyme (NEB, cat.m0280, USA) treatment of U-labeled second-strand DNA, the ligated products were PCR-amplified under the following conditions: initial denaturation at 95 °C for 3 min; 8 cycles of 98 °C for 15 s, annealing at 60 °C for 15 s, and extension at 72 °C for 30 s; and a final 72 °C for 5 min. The final cDNA libraries had an average insert size of 300 ± 50 bp. Three biological replicate samples were set up in each group. At last, we performed the 2 × 150 bp paired-end sequencing (PE150) on an Illumina NovaseqTM 6000 following the vendor’s recommended protocol.
2.4 Sequence concatenation and functional annotation
Cutadapt (1.9) was used to filter reads containing adapter contamination, low-quality bases, or undetermined bases. Sequence quality was then assessed with FastQC (http://www.bioinformatics.babraham.ac.uk/projects/fastqc/, 0.10.1), including Q20, Q30, and GC-content metrics. All downstream analyses used high-quality clean data. De novo assembly of the transcriptome was performed by Trinity (2.15) without reference genomes. The longest transcript within each cluster was selected as the representative ‘gene’ sequence (designated as Unigene). Gene expression levels were quantified using Salmon (v1.9.0) through TPM calculation (Transcripts Per Kilobase of exon model per Million mapped reads).
2.5 Identification and enrichment analysis of differentially expressed genes
All assembled Unigenes were aligned against the Gene ontology (GO) (http://www.geneontology.org) and Kyoto Encyclopedia of Genes and Genomes (KEGG) (http://www.genome.jp/kegg/) databases using DIAMOND (2.0.15) with a threshold of E-value threshold of <0.00001. Gene differential expression analysis was performed by edgeR (3.40.2) software between two different groups and two different samples. Genes with a false discovery rate (FDR) <0.05 and fold change >2 or <0.5 were considered significantly differentially expressed. NormqPCR (1.44.0) was used to evaluate the housekeeping gene, which was subsequently used as a control for qRT-PCR.
2.6 Quantitative real-time PCR (qRT-PCR) validation
To validate RNA-seq results, 23 genes were selected for qRT-PCR analysis. Specific primers were designed using the mRNA sequences of E. cyanopodus via the NCBI Primer-BLAST tool (https://www.ncbi.nlm.nih.gov/). Primers for qRT-PCR are listed in Table 1, with β-actin and ef1α as the internal reference genes. qRT-PCR was performed on a LightCycler® 480 Instrument II (Roche, Switzerland) by using 384-well plate. The total reaction mixture system was 12.5 μL, containing 6.25 μL SYBR qPCR Master Mixture (Yeasen, Shanghai, China), 4.25 μL RNase-free ddH2O, both the forward and reverse primers were 0.5 μL, 1 μL cDNA (concentration 10 ng/μL). The qPCR reaction condition was as follows: preheating was set at 95 °C for 30 s, followed by 40 cycles of 95 °C for 10 s, 60 °C for 30 s. The melting curve was generated using the instrument default values of 95 °C for 15 s, 60 °C for 60 s, and 95 °C for 15 s to detect non-specific amplification and primer dimer (Lai Xingxing et al., 2022). Each experiment was repeated independently at least three times. In this experiment, the expression levels of the targeted genes were calculated by using the 2−ΔΔCt method (Zhong et al., 2021).
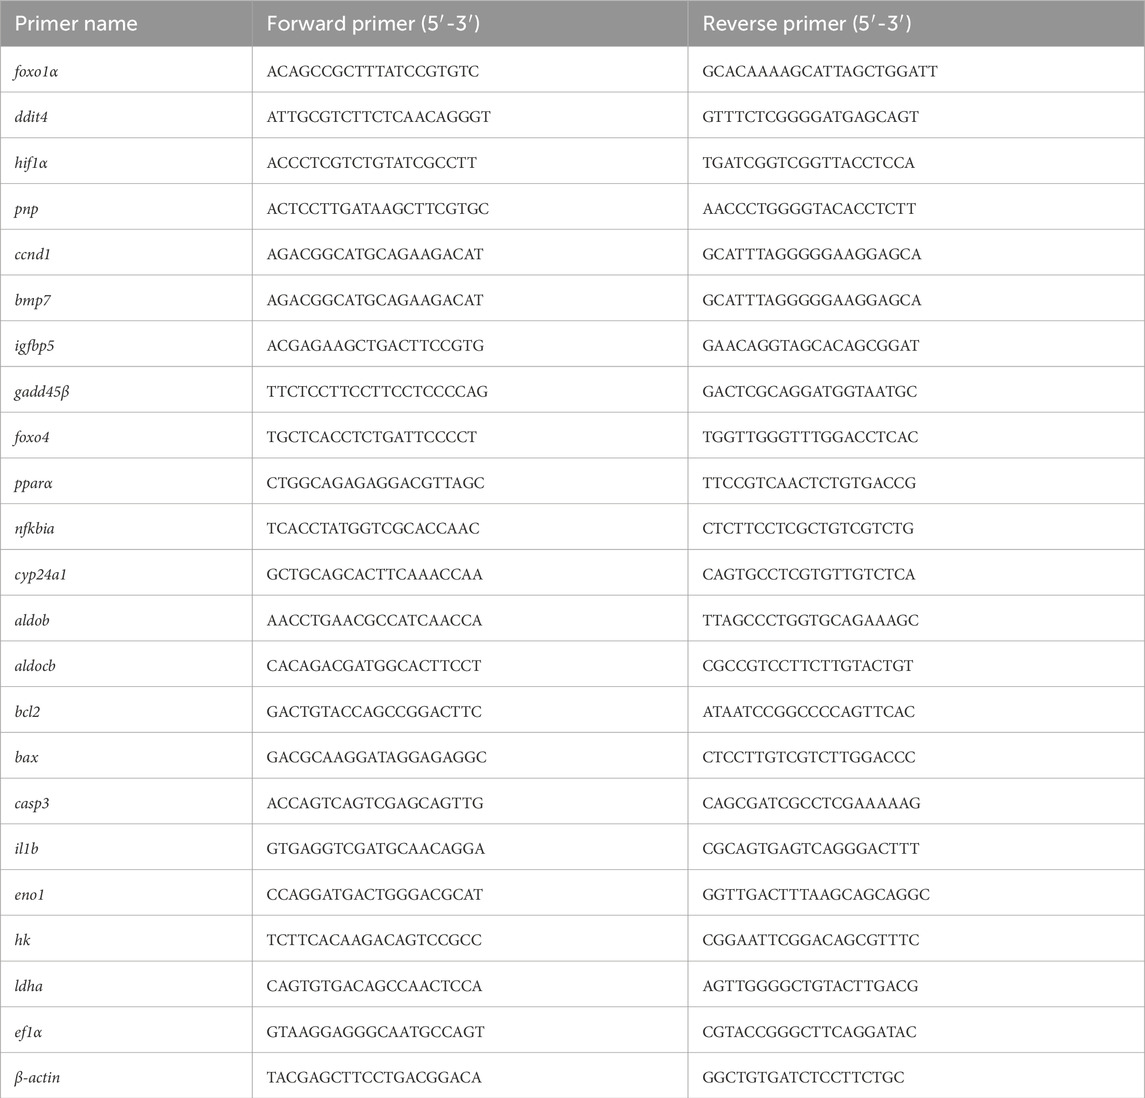
Table 1. Specific primers of 23 genes for qRT-PCR.
2.7 Enzyme activity detection
The liver tissues used for enzyme activity detection were mixed with a certain amount of PBS according to the kit instructions, then centrifuged at 8000 rpm for 10 min at 4 °C. Three techniques were used to detect each enzyme in each sample. The samples were pretreated according to the kit instructions. The 5 indexes including lactate dehydrogenase (LDH: A020-2-2), alkaline phosphatase (AKP: A059-2-2), alanine aminotransferase (ALT: C009-2-1), aspartate aminotransferase (AST: C010-2-1) and glucose (GLU: A154-1-1) were completed on the 96-well cell plate, and 5 indexes were detected by multifunctional enzyme labeling instrument (Infinite® 200PRO, Switzerland). Total protein (TP: A045-2-2) was detected by UV-visible spectrophotometer (Youke; Shanghai, China). All kits were obtained from Nanjing Jiancheng Bioengineering Institute (Nanjing, China).
2.8 Statistical analysis
Statistical analysis was performed using SPSS Statistics v27. One-way ANOVA followed by post hoc tests (Tukey’s) was used to assess differences among groups. The calculation method was selected by t-test, and the difference of p < 0.05 in homogeneous dataset was used for mapping. Significant differences are indicated by an asterisk (*) when plotting with GraphPad Prism v9.5 software.
3 Results
3.1 Semi-lethal concentration of dissolved oxygen in E. cyanopodus
As shown in Table 2, with the continuous decreased in DO concentration (treatment temperature = 28 °C), the survival rate of E. cyanopodus also decreased. Survival curves of E. cyanopodus under different hypoxic concentrations over 9 h were generated according to the survival rate (Figure 1A). The DO levels and survival rate within 9 h were respectively taken as independent and dependent variables, and the regression equation was obtained by linear interpolation method: y = 85.133 x-85.44 (R2 = 0.9557) (Figure 1B). Finally, the semi-lethal dissolved oxygen concentration of E. cyanopodus within 9 h was determined to be 1.59 mg/L, a concentration of 1.6 ± 0.05 mg/L of DO was conducted in the subsequent experiment.

Table 2. Effects of different concentrations of hypoxic stress on the survival rate of E. cyanopodus within 9 h.

Figure 1. Survival curves of E. cyanopodus under different concentrations of hypoxic stress within 9 h (A). Linear interpolation diagram of survival rate of E. cyanopodus under different concentrations of hypoxic stress within 9 h (B) (n = 30).
3.2 Quality of RNA-seq data
By transcriptome sequencing of 15 liver samples of E. cyanopodus, a total of 652,783,748 raw reads (97.93 G) were obtained from the 5 groups, The size range of cleaned reads in each library was 5.22 G to 8.32 G. The Q20 and Q30 values were respectively 97.26%–98.33% and 91.87%–95.03%. The GC content of all samples ranged from 49.99% to 51.70% (Table 3). These results indicated high reproducibility between samples within the group, and the obtained high quality transcriptome data could be used for further analysis.

Table 3. Summary of RNA-seq data of E. cyanopodus.
3.3 Summary of DEGs between groups
In total, 6152 DEGs showed differential expression between the control group (H0) and the four hypoxic stress groups (H1, H3, H6, and H9). The Venn diagram showed a total of 822 DEGs between four comparisons, 914 DEGs between three comparisons and 1521 DEGs between two comparisons (Figure 2A). In H0 vs. H1, H0 vs. H3, H0 vs. H6, and H0 vs. H9 respectively contained 2089 DEGs (806 upregulated and 1283 downregulated) (Figures 2B,C), 4317 DEGs (1672 upregulated and 2645 downregulated) (Figures 2B,D), 3939 DEGs (1678 upregulated and 2261 downregulated) (Figures 2B,E) and 1622 DEGs (542 upregulated and 1080 downregulated) (Figures 2B,F). It was worth mentioning that the H0 vs. H3 comparison had the largest number of DEGs, in which the downregulated genes accounted for 61.27%; The H0 vs. H6 comparison had the second largest number of DEGs, with 57.40% of downregulated genes (Figure 2B). Therefore, it could be considered that acute hypoxia for 3 h and 6 h might be the two key time points of E. cyanopodus.

Figure 2. Venn diagram (A) of DEGs in the four comparisons, and numbers of upregulated and downregulated DEGs in each comparison (B), volcano diagram of H0 vs. H1 (C), volcano diagram of H0 vs. H3 (D), volcano diagram of H0 vs. H6 (E), and volcano diagram of H0 vs. H9 (F).
3.4 GO enrichment analysis of DEGs
Among the three main GO functional enrichment analysis had revealed that, the majority of DEGs in both H0 vs. H3 and H0 vs. H6 were downregulated (Figures 3A,C). Most of the DEGs were clustered into the three main functional categories of biological process (BP), cellular component (CC) and molecular function (MF), with 35 subcategories, including 9 BP terms, 15 CC terms, and 11 MF terms, where the largest subcategories in the BP, CC and MF groups were “biological processes,” “nucleus” and “metal ion binding,” respectively.

Figure 3. GO enrichment analysis of DEGs in H0 vs. H3 (A) and H0 vs. H6 (C). The top 20 pathways in GO enrichment analysis of DEGs in H0 vs. H3 (B) and H0 vs. H6 (D).
In the GO enrichment analysis, there were 4317 DEGs in the H0 vs. H3 comparison. The most enriched terms in the BP functional category were biological processes (GO:0008150) and oxidation-reduction processes (GO:0055114). The most enriched terms in the CC functional category were nucleus (GO: 0005634), cytoplasm (GO: 0005737), and membrane (GO: 0016020). Metal ion binding (GO: 0046872), molecular function (GO: 0003674), and ATP binding (GO: 0005524) were the three main terms in the MF functional category (Figure 3A). The top 20 most-enriched GO terms were mainly enriched in the BP and CC function categories, such as Kinetochore (GO:0000776), DNA replication initiation (GO:0006270), cell cycle (GO:0007049), proteasome complex (GO:0000502), mitochondria (GO:0005739) (Figure 3B).
In the GO enrichment analysis, there were 3939 DEGs in the H0 vs. H6 comparison. The most enriched terms in the BP functional category were biological processes (GO: 0008150) and oxidation-reduction processes (GO:0055114). The most enriched three terms in the CC functional category were nucleus (GO: 0005634), cytoplasm (GO: 0005737), and membrane (GO: 0016020). Metal ion binding (GO: 0046872), molecular function (GO: 0003674), and ATP binding (GO: 0005524) were the three main terms in the MF functional category (Figure 3C). The top 20 most-enriched GO terms were mainly enriched in the BP and CC function categories. Examples including DNA replication initiation (GO:0006270), Kinetochore (GO:0000776), cell cycle (GO:0007049), DNA repair (GO:0006281), and cellular response to DNA damage (GO:0006974) (Figure 3D).
3.5 KEGG enrichment analysis of DEGs
According to KEGG pathway enrichment analysis, 1286 DEGs identified in H0 vs. H3 were significantly enriched in 39 pathways distributed across six functional categories, including cellular processes (325 DEGs in 7 pathways), environmental information processing (235 DEGs in 6 pathways), genetic information processing (150 DEGs in 3 pathways), human diseases (87 DEGs in 5 pathways), metabolism (292 DEGs in 9 pathways), and organismal systems (197 DEGs in 9 pathways) (Figure 4A). Among the top 20 most-enriched KEGG terms, the pathways most associated with hypoxic stress were p53 signaling pathway (ko04115), HIF-1 signaling pathway (ko04066), Glutathione metabolism signaling pathway (ko00480), FoxO signaling pathway (ko04068), and PI3K-Akt signaling pathway (ko04151) (Figure 4B).

Figure 4. KEGG enrichment analysis of DEGs in H0 vs. H3 (A) and H0 vs. H6 (C). The top 20 pathways in KEGG enrichment analysis of DEGs in H0 vs. H3 (B) and H0 vs. H6 (D).
There were 1307 DEGs in H0 vs. H6 were significantly enriched in 41 pathways across six functional categories, including cellular processes (248 DEGs in 5 pathways), environmental information processing (317 DEGs in 9 pathways), genetic information processing (139 DEGs in 3 pathways), human diseases (94 DEGs in 5 pathways), metabolism (312 DEGs in 10 pathways), and organismal systems (197 DEGs in 9 pathways) (Figure 4C). Among the top 20 most-enriched KEGG terms, the pathways most associated with hypoxic stress including p53 signaling pathway (ko04115), HIF-1 signaling pathway (ko04066), cAMP signaling pathway (ko04024), mTOR signaling pathway (ko04150), and Apoptosis signaling pathway (ko04210) (Figure 4D).
3.6 Key DEGs involved in hypoxic response
In order to better determine the changes of DEGs expression in E. cyanopodus under hypoxic conditions, the DEGs in the livers that were associated with hypoxia were identified. Among the enriched DEGs, 39 DEGs were associated with hypoxic reactions, and the expression levels of these DEGs in the H0, H3, and H6 groups were shown in the heat map (Figure 5). Most of these DEGs were enriched in the PI3K-Akt signaling pathway, p53 signaling pathway, mTOR signaling pathway, MAPK signaling pathway. These pathways were mainly involved in angiogenesis, metabolism, cell proliferation and growth, regulation of cell apoptosis.

Figure 5. Heat map of hypoxic responsive DEGs under acute hypoxic stress at 0 h, 3 h, 6 h. Purple indicates gene upregulated expression, green indicates gene downregulated expression.
Compared with H0 group, 14 DEGs in the H3 and H6 groups were significantly downregulated, such as calpastatin (cast), interleukin 12-beta (il12β), tumor necrosis factor-alpha (tnf-α), ras-related protein rab-13 (rab13), poly (RC) binding protein 2 (pcbp2), cyclin D2 (ccnd2), heat shock protein 70 (hsp70), fatty acid binding protein 1 (fabp1), superoxide dismutase 1 (sod1), growth arrest and DNA damage inducible alpha (gadd45α), B-cell lymphoma-10 (bcl10), cyclin D1 (ccnd1), acid phosphatase 1 (acp1), enolase 1 (eno1). In the H3 group, 15 DEGs were significantly upregulated, such as enolase 2 (eno2), aldolase, fructose-bisphosphate A (aldoa), growth arrest and DNA damage inducible beta (gadd45β), B-cell lymphoma-2 (bcl2), aldolase, fructose-bisphosphate B (aldob), purine nucleoside phosphorylase (pnp), forkhead box o4 (foxo4), hypoxia inducible factor 1 subunit alpha (hif1α), von hippel-lindau tumor suppressor (vhl), fms related receptor tyrosine kinase 1 (flt1), bone morphogenetic protein 7 (bmp7), insulin like growth factor binding protein 3 (igfbp3), hexokinase (hk), caspase 3 (casp3), glutamic-pyruvic transaminase 2 (gpt). In the H6 group, 24 DEGs were significantly upregulated, such as aldoa, gadd45β, bcl2, aldob, pnp, foxo4, hif1α, vhl, flt1, bmp7, igfbp3, hk, casp3, gpt, BCL-2 associated X (bax), interleukin 1 Beta (il1b), fibroblast growth factor 23 (fgf23), vascular endothelial growth factor A (vegf-a), hypoxia inducible factor 1 subunit alpha inhibitor (hif1an), aldolase C-fructose-bisphosphate-b (aldocb), lactate dehydrogenase A (ldh-a), peroxisome proliferator activated receptor alpha (pparα), DNA damage inducible transcript 4 (ddit4), C-X-C motif chemokine ligand 5 (cxcl5).
In H3 and H6 groups, metabolism related genes (hk, ldh-a, pparα and foxo4), anaerobic glycolytic related genes (aldocb and ldh-a), apoptosis related gene (gadd45β, bax, bcl2, casp3), repair related genes (bmp7, flt1, vhl and fgf23) and immune-related genes (pnp, ddit4, cxcl5, vegf-a, igfbp3 and tnf-α) were significantly upregulated, while the expression levels of other pathway genes were decreased.
3.7 Validation of DEGs by qRT-PCR
The validation results showed that the expression levels of seven genes (bmp7, foxo4, gadd45β, cyp24a1, hif1α, igfbp5, nfkbia) and one gene (ccnd1) obtained by qRT-PCR and RNA-Seq were respectively upregulated and downregulated. Although trends in ddit4, foxo1α, pnp, pparα expression levels were unclear, qRT-PCR and RNA-Seq revealed consistent changes (Figure 6). The relative expression levels of 12 genes were detected by qRT-PCR and RNA-Seq, and the results were consistent, which supported the validity of the results.

Figure 6. qRT-PCR analysis of 12 genes used to validate RNA-Seq data.
3.8 Expression patterns of 12 key DEGs in liver and brain
The expression levels of 12 key genes (aldob, aldocb, bax, bcl2, casp3, hif1α, pnp, il1b, eno1, pparα, hk, ldh-a) in the liver and brain were detected and analyzed by qRT-PCR. The results (Figure 7) showed that all genes were significantly expressed under hypoxia for 3 h or 6 h, and some genes were also significantly expressed under hypoxia for 9 h. Apoptosis-related genes such as bax, bcl2 and casp3 were all upregulated in the liver, reaching their peaks at 6 h, 6 h, and 3 h, respectively. It also showed varying degrees of upregulation in the brain, reaching the peaks at 6 h, 6 h, and 9 h respectively (Figures 7C–E). Immune-related genes il1b and pnp were significantly expressed in the liver, both reaching their peaks at 6 h pnp was significantly expressed in the brain and reached its peak at 6 h, but il1b showed no significant differential expression in the brain (Figures 7H,J). In the liver, genes involved in glycolysis/gluconeogenesis such as aldob, pparα, hk, and ldh-a, respectively reached their peaks at 3 h, 6 h, 6 h, and 6 h. And in the brain, they reached the peaks at 6 h, 6 h, 9 h, and 6 h, respectively (Figures 7A,G,K,L). aldocb was involved in pyruvate metabolism and significantly expressed in both the liver and the brain, with peaks reaching at 6 h in both tissues (Figure 7B). eno1 showed downregulation under hypoxic stress, with the smallest and most significant expression at 1 h. However, there was no significant differential expression in the brain (Figure 7I). hif1α was a key gene in hypoxic stress and significantly expressed in both the liver and brain, reaching their peaks at 6 h (Figure 7F).

Figure 7. Expression analysis of 12 key DEGs in the liver (blue) and brain (red) of E. cyanopodus after hypoxia stress. (A) aldob; (B) aldocb; (C) bax; (D) bcl2; (E) casp3; (F) hif1α (G) pparα (H) il1b; (I) eno1; (J) pnp; (K) hk; (L) ldha. Asterisks indicate significant differences between the control group and hypoxic stress group at each time point. * represents significant differences (p < 0.05); ** represents significant differences (p < 0.01); *** represents significant differences (p < 0.001).
3.9 Determination of enzyme activities in liver
In order to investigate the effects on glycolysis process and immune-related reaction in E. cyanopodus under hypoxic stress, we detected the activities of 5 enzymes. After determining TP in liver tissues, we detected the activities of key metabolic enzymes, including LDH and GLU. The activities of immune-related enzymes such as AKP, AST, and ALT were also detected. As is shown in Figure 8, AKP, ALT and AST all showed a trend of first increasing and then decreasing, the peaks all appeared at 3 h, and the three indexes were respectively 4.87-fold, 4.66-fold and 3.41-fold higher than the H0. At 6 h, they were respectively 4.03-fold, 4.19-fold and 1.59-fold higher than the H0 (Figures 8A–C). GLU and LDH also showed a trend of first increasing and then decreasing, the peaks all appeared at 3 h, and the two indexes were respectively 2.86-fold and 3.41-fold higher than the H0. At 6 h, they were respectively 2.65-fold and 2.86-fold higher than the H0 (Figures 8D,E).

Figure 8. Expressions of liver indexes in E. cyanopodus after 9 h hypoxia: AKP (A), ALT (B), AST (C), GLU (D) and LDH (E). Asterisks indicate significant differences between the control group and hypoxic stress group at each time point. * represents significant differences (p < 0.05), ** represents significant differences (p < 0.01).
4 Discussion
Studies indicate that oxygen depletion in aquatic environments is a common occurrence in fisheries, which can significantly impair various biological functions in fish, including behavioral responses, growth rates, metabolic processes, and immunological competence (Lee et al., 2004; Wang et al., 2023). This study established 1.6 ± 0.05 mg/L dissolved oxygen as the stress experimental condition, we analyzed the expression level of DEGs selected from the liver transcriptome sequencing by qRT-PCR method, the dynamic molecular regulation of hypoxic adaptation was characterized in E. cyanopodus across multiple exposure durations. RNA-seq coupled with qRT-PCR validation demonstrated significant enrichment of energy metabolism, immune response and cellular apoptosis pathways along with associated DEGs in the 3 h and 6 h hypoxia-exposed groups.
As a hypoxia-sensitive tissue, the liver plays a crucial role in hypoxic adaptation. Under low-oxygen conditions, liver cells show expression of genes which involve in erythropoiesis, angiogenesis, and glucose metabolism (Baze et al., 2010; Gong et al., 2021). As a vital organ in animals, the brain is extremely sensitive to hypoxia due to it is a high-oxygen-consuming organ. Acute hypoxic stress causes the brain to shift from a normoxic to hypoxic state, causing a series of pathophysiological changes in brain, ultimately leading to irreversible brain damage (Wang M et al., 2021; Welker et al., 2013). Hypoxia-inducible factor (HIF) signaling pathway is an important regulatory pathway for maintaining oxygen homeostasis in tissues and cells under hypoxic stress, affecting oxygen transport and utilization as well as the body’s tolerance to hypoxia, hif-1α is a key gene in this pathway (Mandic et al., 2021; Palazon et al., 2014). The hypoxia-inducible gene hif-1α activates a complex signaling pathway that promotes liver angiogenesis, thereby ameliorating tissue ischemia, hypoxia, and facilitating liver repair during injury (Kaur et al., 2005). Under acute hypoxic conditions, hif-1α expression was markedly upregulated in both Pelteobagrus fulvidraco (Wang X et al., 2021) and Schizothorax prenanti (Zhao et al., 2020), demonstrating a conserved hypoxic response across these species. The HIF-1 pathway additionally promotes metabolic adaptation through transcriptional activation of anaerobic glycolysis and gluconeogenesis genes, sustaining energy homeostasis during oxygen deprivation (Kim et al., 2006). Several HIF-relative genes, including aldob, eno1, ldh-a, hk and pparα, participate in the HIF signaling pathway and regulate critical metabolic processes such as glycolysis/gluconeogenesis. There are also some genes involved in pyruvate metabolism, such as aldocb and ldh-a. Our findings demonstrated significant upregulated of ldh-a and aldocb in the liver and brain tissues of E. cyanopodus following 6 h of acute hypoxia. Notably, ldh-a serves as a pivotal enzyme in anaerobic glycolysis, catalyzing the conversion of pyruvate to lactate while generating ATP under hypoxia (Sharma et al., 2022; Valvona et al., 2016). As a key glycolytic enzyme, aldocb catalyzes the aldolase reaction, reversibly cleaving fructose-1,6-bisphosphate into glyceraldehyde-3-phosphate and dihydroxyacetone phosphate, a critical step in carbohydrate metabolism (Kawai et al., 2017). In addition, in this study, aldob and pparα were significantly expressed under acute hypoxic stress, which followed a similar pattern to existing reports (Chen et al., 2019; Shang et al., 2022). These findings indicated that the HIF signaling pathway served as a critical regulatory mechanism governing glucose metabolic adaptation in E. cyanopodus under hypoxic conditions.
When fish encounter stressful environments, such as acute hypoxia, they often exhibit a robust inflammatory response. To counteract this, a key repair mechanism involves activating immune defense pathways, which help mitigate tissue damage and enhance survival (Harper and Wolf, 2009; Zheng et al., 2021). It is reported that hypoxic stress significantly elevated hepatocyte apoptosis in both Carassius gibelio (Wu et al., 2022a) and Pelteobagrus vachelli (Zheng et al., 2021). Through KEGG pathway enrichment analysis (Figures 4B,D) in E. cyanopodus, we found that immune-related genes in the H3 and H6 groups were significantly enriched in key signaling pathways, including p53, cAMP, PPAR, PI3K-Akt, and mTOR. The PI3K-Akt signaling pathway stimulates cell proliferation and tumor invasion while upregulating hif-1α translation, thereby enhancing hif-1α-mediated gene expression. The p53 signaling pathway integrates multiple biological responses, encompassing DNA damage repair, metabolic adaptation, inhibition of angiogenesis, cellular senescence, and programmed cell death (Bieging et al., 2014). hif-1α mitigates inflammatory injury by activating the PI3K-Akt, PPAR, and p53 signaling pathways. Additionally, it modulates immune responses, energy metabolism, cell proliferation, and differentiation, thereby promoting tissue repair and enhancing hypoxic adaptation (Abdel-Rahman Mohamed et al., 2019; Spirina et al., 2017). For example, our findings demonstrated that pnp and il1b participated in immune regulation by maintaining immune cell homeostasis, mitigating inflammatory injury, suppressing apoptosis, and ultimately prolonging survival. Under hypoxic stress, the significant upregulation of pnp and il1b suggested their potential role in mitigating tissue inflammatory damage induced by hypoxia. Furthermore, hif-1α activates the apoptosis-regulating genes bax and bcl2, which function downstream of the p53 signaling pathway to coordinately control apoptotic processes (Wang et al., 2019). Under conditions of acute hypoxia, organisms upregulate bcl2 expression as an adaptive mechanism to inhibit apoptotic pathways (Shroff et al., 2007). bax as a key member of the bcl2 gene family, encodes one of the most critical pro-apoptotic proteins. The BAX protein functions by forming heterodimers with BCL-2, thereby serving as its primary antagonist in apoptotic regulation (Jin et al., 2011). Studies indicate that the BCL-2/BAX protein ratio serves as a critical determinant of apoptotic regulation. A decreased BCL-2/BAX ratio results in bax dominance, facilitating the efficient clearance of damaged cells in fish (Gu et al., 2023). The dynamic balance between BCL-2 and BAX, reflected in their expression ratio, mediates their functional antagonism. This regulatory mechanism promotes appropriate apoptotic responses to environmental stress while preventing excessive cell death, thereby maintaining cellular homeostasis. These findings align with the gene expression patterns observed in our study, demonstrating that coordinated immune responses and apoptotic regulation work synergistically to maintain organismal homeostasis under hypoxic stress.
Fish undergo a series of intricate biochemical reactions to adapt to the physiological changes induced by hypoxic stress (Abdel-Tawwab et al., 2019). Hypoxia promotes oxidative stress, impairs antioxidant defenses, and inflicts substantial harm to cell (Lushchak, 2011; Nitz et al., 2020; Yang et al., 2017). Since ALT and AST exhibit a positive correlation with hepatocyte lysis, increased enzymatic activity suggests mild cellular damage or stress-induced tissue injury. Consequently, these enzymes are well-established biomarkers for assessing liver function impairment (Akbary et al., 2018; Dassarma et al., 2018; Palanivelu et al., 2005). Because of the liver injury, the disruption of hepatocyte integrity leads to a marked increase in ALT and AST activity (Sheikhzadeh et al., 2012). In this study, hypoxic stress induced a significant increase in hepatic AST and ALT activity in E. cyanopodus, which has also been reported in Hyphessobrycon callistus (Pan et al., 2009). AKP contributes to physiological protection and immune defense, while engaging in multiple metabolic pathways such as detoxification, metabolism, and biosynthesis of macromolecules (Chen et al., 2022; Suzuki and Mori, 1990). The activity profile of AKP shows significant variation depending on stressor type, with distinct modulation patterns observed under thermal, acidic, hypoxic, and heavy metal stress conditions (Chen et al., 2007). Therefore, AKP is often used as an indicator to evaluate the immune status of an organism (Yang S et al., 2019). Increased AKP activity serves as a biochemical marker of compromised membrane permeability and structural integrity, ultimately resulting in cellular damage and subsequent hepatobiliary inflammation in the host organism (Lin et al., 2015). In the present study, hypoxic stress induced a significant elevation of hepatic AKP activity in E. cyanopodus, indicative of severe inflammatory liver injury. These findings demonstrated that hypoxic conditions promote hepatic oxidative damage and trigger immune activation (Jia et al., 2023).
Blood glucose concentration is highly sensitive to environmental fluctuations, and hypoxic stress fundamentally shifts the energy metabolism paradigm in fish from oxidative phosphorylation toward enhanced glycolysis/gluconeogenesis and pyruvate metabolic pathways (Ding et al., 2020; Qi et al., 2018; Wu et al., 2022b; Yang C et al., 2019). During anaerobic glycolysis, carbohydrates are initially hydrolyzed to glucose, which is subsequently converted by lactate dehydrogenase (LDH) into pyruvate as the primary metabolic intermediate. Pyruvate is then reduced to lactate while generating ATP (Mizock, 1995), with the accumulated lactic acid serving as a crucial component of energy metabolism through anaerobic respiration under environmental stress conditions (Wang M et al., 2021; Xiaolong et al., 2018). The elevated LDH activity demonstrates its pivotal role in anaerobic metabolism, while also facilitating the gluconeogenic conversion of lactate to pyruvate for glucose synthesis (Mahfouz et al., 2015). These findings revealed that the respiratory and metabolic patterns of E. cyanopodus were changed under hypoxic stress, primarily through upregulation of glycolytic, gluconeogenic, and pyruvate metabolic pathways as an adaptive strategy.
5 Conclusion
In this study, we employed RNA-seq, qRT-PCR, and physiological and biochemical analyses to investigate the response of E. cyanopodus to hypoxic stress. Transcriptomic profiling of liver tissues at different time points (H0, H1, H3, H6, and H9) revealed a total of 6152 DEGs across the five experimental groups. qRT-PCR validation confirmed that several key DEGs were significantly expressed under hypoxic stress, with 3–6 h of hypoxia emerging as the critical period in the stress response. KEGG pathway enrichment analysis revealed that DEGs in the H3 and H6 groups were predominantly enriched in energy metabolism and immune response pathways. Key energy metabolism pathways included glycolysis/gluconeogenesis, pyruvate metabolism, glutathione metabolism, and pyrimidine metabolism. Meanwhile, immune-related pathways such as p53 signaling, PPAR signaling, and PI3K-Akt signaling pathways were primarily associated with innate immunity and the regulation of apoptosis. We selected the significantly expressed DEGs from these pathways and examined their expression patterns in both liver and brain tissues. It could be concluded that these DEGs were significantly expressed in both liver and brain, and most of these DEGs had the highest expression levels at 3 h or 6 h. Furthermore, hypoxic stress altered the activities of glycolytic and immune-related enzymes in the liver, subsequently influencing the expression of genes associated with energy metabolism and inflammatory responses. These findings exactly confirm that 3–6 h of hypoxia is the key duration for E. cyanopodus. It also suggests that E. cyanopodus adapts to hypoxic conditions by enhancing anaerobic glycolysis as a key energy-producing pathway, while simultaneously activating immune defenses and apoptotic mechanisms to maintain metabolic and cellular homeostasis. In conclusion, this study elucidates key molecular mechanisms underlying hypoxia tolerance in E. cyanopodus, providing novel insights that advance our understanding of marine fishes’ physiological responses to acute hypoxic stress.
Data availability statement
The RNA-Seq raw reads data presented in the study are deposited in the NCBI repository, accession number PRJNA1320850.
Ethics statement
The animal study was approved by the handling procedures and experimental protocols of all animals in this experiment were in accordance with the Experimental Animal Ethics Committee of Guangzhou University of China. The study was conducted in accordance with the local legislation and institutional requirements.
Author contributions
QC: Writing – original draft, Data curation, Validation. YH: Software, Formal Analysis, Writing – review and editing. ZY: Formal Analysis, Writing – review and editing, Software. WH: Visualization, Data curation, Writing – review and editing. XH: Data curation, Validation, Writing – review and editing. JW: Writing – review and editing, Investigation, Conceptualization. TC: Writing – review and editing, Visualization. YC: Writing – review and editing, Visualization. AG: Validation, Writing – review and editing, Supervision. HS: Writing – review and editing, Funding acquisition, Project administration.
Funding
The authors declare that financial support was received for the research and/or publication of this article. This study was supported by grants from Science and Technology Program of Guangdong Province (2019B030316022), China Postdoctoral Science Foundation (2025M772603), Research on breeding technology of candidate species for Guangdong modern marine ranching (2024-MRB-00-001), Guangdong Financial Budget (2023) No. 6, and China-ASEAN Fisheries Resources Conservation and Exploitation (CAMC-2018F). The Natural Science Foundation of China (No. 42177262), 2023 National Undergraduate Innovation and Entrepreneurship Training Program (202311078043) and the “2 + 5” platform funding support from Guangzhou University.
Conflict of interest
Authors TC and YC were employed by Shenzhen Haijuyuan Aquacture Technology Co., Ltd.
The remaining authors declare that the research was conducted in the absence of any commercial or financial relationships that could be construed as a potential conflict of interest.
Generative AI statement
The authors declare that no Generative AI was used in the creation of this manuscript.
Any alternative text (alt text) provided alongside figures in this article has been generated by Frontiers with the support of artificial intelligence and reasonable efforts have been made to ensure accuracy, including review by the authors wherever possible. If you identify any issues, please contact us.
Publisher’s note
All claims expressed in this article are solely those of the authors and do not necessarily represent those of their affiliated organizations, or those of the publisher, the editors and the reviewers. Any product that may be evaluated in this article, or claim that may be made by its manufacturer, is not guaranteed or endorsed by the publisher.
References
Abdel-Rahman Mohamed A. M. M., Metwally M., Khalil S. R., Salem G. A., Ali H. A. (2019). Moringa oleifera extract attenuates the CoCl2 induced hypoxia of rat’s brain: expression pattern of HIF-1α, NF-kB, MAO and EPO. Biomed. and Pharmacother. 109, 1688–1697. doi:10.1016/j.biopha.2018.11.019
Abdel-Tawwab M., Monier M. N., Hoseinifar S. H., Faggio C. (2019). Fish response to hypoxia stress: growth, physiological, and immunological biomarkers. Fish. Physiol. Biochem. 45, 997–1013. doi:10.1007/s10695-019-00614-9
Akbary P., Sartipi Yarahmadi S., Jahanbakhshi A. (2018). Hematological, hepatic enzymes’ activity and oxidative stress responses of gray mullet (Mugil cephalus) after sub-acute exposure to copper oxide. Environ. Sci. Pollut. Res. 25, 1800–1808. doi:10.1007/s11356-017-0582-1
Aragonés J., Fraisl P., Baes M., Carmeliet P. (2009). Oxygen sensors at the crossroad of metabolism. Cell. Metab. 9, 11–22. doi:10.1016/j.cmet.2008.10.001
Baze M. M., Schlauch K., Hayes J. P. (2010). Gene expression of the liver in response to chronic hypoxia. Physiol. Genomics 41, 275–288. doi:10.1152/physiolgenomics.00075.2009
Bieging K. T., Mello S. S., Attardi L. D. (2014). Unravelling mechanisms of p53-mediated tumour suppression. Nat. Rev. Cancer 14, 359–370. doi:10.1038/nrc3711
Cai W., Li Z., Huang W., Zhou M., Liu H., Yang Y., et al. (2025). Effects of dietary Lactobacillus pentosus supplementation on growth performance, serumbiochemistry and liver function of hybrid grouper (♀ Epinephelus fuscoguttatus × ♂ Epinephelus lanceolatus) fed with oxidized fish oil diet. Aquac. Rep. 42, 102736. doi:10.1016/j.aqrep.2025.102736
Cao X., Zhang J., Deng S., Ding S. (2022). Chromosome-level genome assembly of the speckled blue grouper (Epinephelus cyanopodus) provides Insight into its adaptive evolution. Biology 11, 1810. doi:10.3390/biology11121810
Chandel N. S., Budinger G. R. S., Choe S. H., Schumacker P. T. (1997). Cellular respiration during hypoxia. J. Biol. Chem. 272, 18808–18816. doi:10.1074/jbc.272.30.18808
Chen J., Mai K., Ma H., Wang X., Deng D., Liu X., et al. (2007). Effects of dissolved oxygen on survival and immune responses of scallop (Chlamys farreri Jones et Preston). Fish and Shellfish Immunol. 22, 272–281. doi:10.1016/j.fsi.2006.06.003
Chen B., Yi S., Wang W., He Y., Huang Y., Gao Z., et al. (2017). Transcriptome comparison reveals insights into muscle response to hypoxia in blunt snout bream (Megalobrama amblycephala). Gene 624, 6–13. doi:10.1016/j.gene.2017.04.023
Chen J., Chen J., Fu H., Li Y., Wang L., Luo S., et al. (2019). Hypoxia exacerbates nonalcoholic fatty liver disease via the HIF-2α/PPARα pathway. Am. J. Physiology-Endocrinology Metabolism 317, E710–E722. doi:10.1152/ajpendo.00052.2019
Chen J., Huang J., Peng J., Yang C., Liao Y., Li J., et al. (2022). Effects of hypoxic stress on the digestion, energy metabolism, oxidative stress regulation, and immune function of the pearl oyster (Pinctada fucata martensii). Aquac. Rep. 25, 101246. doi:10.1016/j.aqrep.2022.101246
Dassarma B., Nandi D. K., Gangopadhyay S., Samanta S. (2018). Hepatoprotective effect of food preservatives (butylated hydroxyanisole, butylated hydroxytoluene) on carbon tetrachloride-induced hepatotoxicity in rat. Toxicol. Rep. 5, 31–37. doi:10.1016/j.toxrep.2017.12.009
Ding J., Liu C., Luo S., Zhang Y., Gao X., Wu X., et al. (2020). Transcriptome and physiology analysis identify key metabolic changes in the liver of the large yellow croaker (Larimichthys crocea) in response to acute hypoxia. Ecotoxicol. Environ. Saf. 189, 109957. doi:10.1016/j.ecoenv.2019.109957
Domenici P., Lefrançois C., Shingles A. (2007). Hypoxia and the antipredator behaviours of fishes. Phil. Trans. R. Soc. B 362, 2105–2121. doi:10.1098/rstb.2007.2103
Gong D., Xu L., Li W., Shang R., Chen J., Hu F., et al. (2020). Comparative analysis of liver transcriptomes associated with hypoxia tolerance in the gynogenetic blunt snout bream. Aquaculture 523, 735163. doi:10.1016/j.aquaculture.2020.735163
Gong D., Xu L., Liu Q., Wang S., Wang Y., Hu F., et al. (2021). A new type of hybrid bream derived from a hybrid lineage of Megalobrama amblycephala (♀) × Culter alburnus (♂). Aquaculture 534, 736194. doi:10.1016/j.aquaculture.2020.736194
Gong D., Wang X., Liu Z., Liang J., Yang J., Hu F., et al. (2024). Comparative analysis of liver transcriptomes associated with hypoxia tolerance in the improve blunt snout bream (Megalobrama amblycephala). Aquaculture 592, 741190. doi:10.1016/j.aquaculture.2024.741190
Gu Y., Sun J. L., Yao F. C., Jiang T., Jin C. X., Shi L. P., et al. (2023). Long-term hypoxia and reoxygenation induced oxidative stress lead to immunosuppression and apoptosis in golden pompano (Trachinotus blochii). Front. Mar. Sci. 10, 1212571. doi:10.3389/fmars.2023.1212571
Hammarlund E. U., Flashman E., Mohlin S., Licausi F. (2020). Oxygen-sensing mechanisms across eukaryotic kingdoms and their roles in complex multicellularity. Science 370, eaba3512. doi:10.1126/science.aba3512
Harper C., Wolf J. C. (2009). Morphologic effects of the stress response in fish. ILAR J. 50, 387–396. doi:10.1093/ilar.50.4.387
He Y., Yu H., Zhang Z., Zhang J., Kang S., Zhang X. (2022). Effects of chronic hypoxia on growth performance, antioxidant capacity and protein turnover of largemouth bass (Micropterus salmoides). Aquaculture 561, 738673. doi:10.1016/j.aquaculture.2022.738673
Herkenhoff M. E., Oliveira A. C., Nachtigall P. G., Costa J. M., Campos V. F., Hilsdorf A. W. S., et al. (2018). Fishing into the MicroRNA transcriptome. Front. Genet. 9, 88. doi:10.3389/fgene.2018.00088
Jia Y., Wang F., Gao Y., Qin H., Guan C. (2023). Hypoxia stress induces hepatic antioxidant activity and apoptosis, but stimulates immune response and immune-related gene expression in black rockfish Sebastes schlegelii. Aquat. Toxicol. 258, 106502. doi:10.1016/j.aquatox.2023.106502
Jin Y., Zheng S., Pu Y., Shu L., Sun L., Liu W., et al. (2011). Cypermethrin has the potential to induce hepatic oxidative stress, DNA damage and apoptosis in adult zebrafish (Danio rerio). Chemosphere 82, 398–404. doi:10.1016/j.chemosphere.2010.09.072
Jin S., Fu H., Zhou Q., Sun S., Jiang S., Xiong Y., et al. (2013). Transcriptome analysis of androgenic gland for discovery of novel genes from the oriental River prawn, Macrobrachium nipponense, using Illumina Hiseq 2000. PLoS ONE 8, e76840. doi:10.1371/journal.pone.0076840
Kaur B., Khwaja F. W., Severson E. A., Matheny S. L., Brat D. J., Van Meir E. G. (2005). Hypoxia and the hypoxia-inducible-factor pathway in glioma growth andangiogenesis. Neuro-Oncology 7, 134–153. doi:10.1215/S1152851704001115
Kawai K., Uemura M., Munakata K., Takahashi H., Haraguchi N., Nishimura J., et al. (2017). Fructose-bisphosphate aldolase A is a key regulator of hypoxic adaptation in colorectal cancer cells and involved in treatment resistance and poor prognosis. Int. J. Oncol. 50, 525–534. doi:10.3892/ijo.2016.3814
Kim J., Tchernyshyov I., Semenza G. L., Dang C. V. (2006). HIF-1-mediated expression of pyruvate dehydrogenase kinase: a metabolic switch required for cellular adaptation to hypoxia. Cell. Metab. 3, 177–185. doi:10.1016/j.cmet.2006.02.002
Lai X., Zhang C., Wu Y., Yang Y., Zhang M., Qin W., et al. (2022a). Comparative transcriptome analysis reveals physiological responses in liver tissues of Epinephelus coioides under acute hypoxia stress. Comp. Biochem. Physiology Part D Genomics Proteomics 43, 101005. doi:10.1016/j.cbd.2022.101005
Lai X., Zhong Z., Lin B., Wu Y., Ma Y., Zhang C., et al. (2022b). RNA-seq and qRT-PCR analyses reveal the physiological response to acute hypoxia and reoxygenation in Epinephelus coioides. Front. Physiol. 13, 1049776. doi:10.3389/fphys.2022.1049776
Lee J.-W., Bae S.-H., Jeong J.-W., Kim S.-H., Kim K.-W. (2004). Hypoxia-inducible factor (HIF-1)α: its protein stability and biological functions. Exp. Mol. Med. 36, 1–12. doi:10.1038/emm.2004.1
Lefevre S., Wang T., Jensen A., Cong N. V., Huong D. T. T., Phuong N. T., et al. (2014). Air-breathing fishes in aquaculture. What can we learn from physiology? J. Fish Biol. 84, 705–731. doi:10.1111/jfb.12302
Li M., Wang X., Qi C., Li E., Du Z., Qin J. G., et al. (2018). Metabolic response of Nile tilapia (Oreochromis niloticus) to acute and chronic hypoxia stress. Aquaculture 495, 187–195. doi:10.1016/j.aquaculture.2018.05.031
Liang Y.-S., Wu R.-X., Niu S.-F., Miao B.-B., Liang Z.-B., Zhai Y. (2022). Liver transcriptome analysis reveals changes in energy metabolism, oxidative stress, and apoptosis in pearl gentian grouper exposed to acute hypoxia. Aquaculture 561, 738635. doi:10.1016/j.aquaculture.2022.738635
Liang Y.-S., Wu R.-X., Miao B.-B., Niu S.-F., Liang Z.-B., Zhai Y. (2024). Integrated mRNA-Seq and miRNA-Seq analysis reveals the microRNAs-transcription factor-mRNA regulatory network of pearl gentian grouper under acute hypoxia. Aquaculture 578, 740120. doi:10.1016/j.aquaculture.2023.740120
Lin H., Tan X., Zhou C., Niu J., Xia D., Huang Z., et al. (2015). Effect of dietary arginine levels on the growth performance, feed utilization, non-specific immune response and disease resistance of juvenile golden pompano Trachinotus ovatus. Aquaculture 437, 382–389. doi:10.1016/j.aquaculture.2014.12.025
Lushchak V. I. (2011). Environmentally induced oxidative stress in aquatic animals. Aquat. Toxicol. 101, 13–30. doi:10.1016/j.aquatox.2010.10.006
Ma Q., Li R., Feng J., Wang L. (2013). Relationships between total dissolved gas and dissolved oxygen in water. Fresenius Environ. Bull. 22, 3243–3250.
Ma J., Qiang J., Tao Y., Bao J., Zhu H., Li L., et al. (2021). Multi-omics analysis reveals the glycolipid metabolism response mechanism in the liver of genetically improved farmed Tilapia (GIFT, Oreochromis niloticus) under hypoxia stress. BMC Genomics 22, 105. doi:10.1186/s12864-021-07410-x
Mader M., Schmidt C., Van Geldern R., Barth J. A. C. (2017). Dissolved oxygen in water and its stable isotope effects: a review. Chem. Geol. 473, 10–21. doi:10.1016/j.chemgeo.2017.10.003
Mahfouz M. E., Hegazi M. M., El-Magd M. A., Kasem E. A. (2015). Metabolic and molecular responses in Nile tilapia, Oreochromis niloticus during short and prolonged hypoxia. Mar. Freshw. Behav. Physiology 48, 319–340. doi:10.1080/10236244.2015.1055915
Mandic M., Joyce W., Perry S. F. (2021). The evolutionary and physiological significance of the Hif pathway in teleost fishes. J. Exp. Biol. 224, jeb231936. doi:10.1242/jeb.231936
Mizock B. A. (1995). Alterations in carbohydrate metabolism during stress: a review of the literature. Am. J. Med. 98, 75–84. doi:10.1016/S0002-9343(99)80083-7
Mu Y., Li W., Wei Z., He L., Zhang W., Chen X. (2020). Transcriptome analysis reveals molecular strategies in gills and heart of large yellow croaker (Larimichthys crocea) under hypoxia stress. Fish and Shellfish Immunol. 104, 304–313. doi:10.1016/j.fsi.2020.06.028
Nitz L. F., Pellegrin L., Maltez L. C., Pinto D., Sampaio L. A., Monserrat J. M., et al. (2020). Temperature and hypoxia on oxidative stress responses in pacu Piaractus mesopotamicus. J. Therm. Biol. 92, 102682. doi:10.1016/j.jtherbio.2020.102682
Palanivelu V., Vijayavel K., Balasubramanian S. E., Balasubramanian M. P. (2005). Influence of insecticidal derivative (cartap hydrochloride) from the marine polycheate on certain enzyme systems of the fresh water fish Oreochromis mossambicus. J. Environ. Biol. 26, 191–195.
Palazon A., Goldrath A. W., Nizet V., Johnson R. S. (2014). HIF transcription factors, inflammation, and immunity. Immunity 41, 518–528. doi:10.1016/j.immuni.2014.09.008
Pan C., Chien Y., Wang Y. (2009). The antioxidant capacity response to hypoxia stress during transportation of characins (Hyphessobrycon callistus Boulenger) fed diets supplemented with carotenoids. Aquac. Res. 41, 973–981. doi:10.1111/j.1365-2109.2009.02380.x
Qi D., Chao Y., Wu R., Xia M., Chen Q., Zheng Z. (2018). Transcriptome analysis provides insights into the adaptive responses to hypoxia of a schizothoracine fish (Gymnocypris eckloni). Front. Physiol. 9, 1326. doi:10.3389/fphys.2018.01326
Richards J. G. (2011). Physiological, behavioral and biochemical adaptations of intertidal fishes to hypoxia. J. Exp. Biol. 214, 191–199. doi:10.1242/jeb.047951
Saetan W., Tian C., Yu J., Lin X., He F., Huang Y., et al. (2020). Comparative transcriptome analysis of gill tissue in response to hypoxia in silver Sillago (Sillago sihama). Animals 10, 628. doi:10.3390/ani10040628
Sagasti A., Schaffner L. C., Duffy J. E. (2001). Effects of periodic hypoxia on mortality, feeding and predation in an estuarine epifaunal community. J. Exp. Mar. Biol. Ecol. 258, 257–283. doi:10.1016/S0022-0981(01)00220-9
Shang F., Lu Y., Li Y., Han B., Wei R., Liu S., et al. (2022). Transcriptome analysis identifies key metabolic changes in the brain of Takifugu rubripes in response to chronic hypoxia. Genes. 13, 1347. doi:10.3390/genes13081347
Sharma D., Singh M., Rani R. (2022). Role of LDH in tumor glycolysis: regulation of LDHA by small molecules for cancer therapeutics. Seminars Cancer Biol. 87, 184–195. doi:10.1016/j.semcancer.2022.11.007
Sheikhzadeh N., Tayefi-Nasrabadi H., Khani Oushani A., Najafi Enferadi M. H. (2012). Effects of Haematococcus pluvialis supplementation on antioxidant system and metabolism in rainbow trout (Oncorhynchus mykiss). Fish. Physiol. Biochem. 38, 413–419. doi:10.1007/s10695-011-9519-7
Shroff E. H., Snyder C., Chandel N. S. (2007). Bcl-2 family members regulate anoxia-induced cell death. Antioxidants and Redox Signal. 9, 1405–1409. doi:10.1089/ars.2007.1731
Song Z., Ye W., Tao Y., Zheng T., Qiang J., Li Y., et al. (2022). Transcriptome and 16S rRNA analyses reveal that hypoxic stress affects the antioxidant capacity of largemouth bass (Micropterus salmoides), resulting in intestinal tissue damage and structural changes in microflora. Antioxidants 12, 1. doi:10.3390/antiox12010001
Spirina L. V., Usynin Y. A., Yurmazov Z. A., Slonimskaya E. M., Kolegova E. S., Kondakova I. V. (2017). Transcription factors NF-kB, HIF-1, HIF-2, growth factor VEGF, VEGFR2 and carboanhydrase IX mRNA and protein level in the development of kidney cancer metastasis. Mol. Biol. 51, 328–332. doi:10.1134/S0026893317020194
Sun Y.-Z., Yang H.-L., Ma R.-L., Zhang C.-X., Lin W.-Y. (2011). Effect of dietary administration of Psychrobacter sp. on the growth, feed utilization, digestive enzymes and immune responses of grouper Epinephelus coioides. Aquac. Nutr. 17, e733–e740. doi:10.1111/j.1365-2095.2010.00837.x
Suzuki T., Mori K. (1990). Hemolymph lectin of the pearl oyster, Pinctada fucata martensii: a possible non-self recognition system. Dev. and Comp. Immunol. 14, 161–173. doi:10.1016/0145-305X(90)90088-V
Valvona C. J., Fillmore H. L., Nunn P. B., Pilkington G. J. (2016). The regulation and function of lactate dehydrogenase A: therapeutic potential in brain tumor. Brain Pathol. 26, 3–17. doi:10.1111/bpa.12299
Wang P., Guan D., Zhang X., Liu F., Wang W. (2019). Modeling the regulation of p53 activation by HIF-1 upon hypoxia. FEBS Lett. 593, 2596–2611. doi:10.1002/1873-3468.13525
Wang Z., Pu D., Zheng J., Li P., Lü H., Wei X., et al. (2023). Hypoxia-induced physiological responses in fish: from organism to tissue to molecular levels. Ecotoxicol. Environ. Saf. 267, 115609. doi:10.1016/j.ecoenv.2023.115609
Wang T., Zeng L., Wei Q., Yang Y., Tao Y., Chang L., et al. (2024). Acute hypoxia and reoxygenation alters glucose and lipid metabolic patterns in Hulong hybrid grouper (Epinephelus fuscoguttatus♀ × E. lanceolatus♂). Aquaculture 586, 740827. doi:10.1016/j.aquaculture.2024.740827
Wang M., Wu F., Xie S., Zhang L. (2021). Acute hypoxia and reoxygenation: effect on oxidative stress and hypoxia signal transduction in the juvenile yellow catfish (Pelteobagrus fulvidraco). Aquaculture 531, 735903. doi:10.1016/j.aquaculture.2020.735903
Wang X., Xiao S., Zhang R., Zhu H., Liu L. (2021). Physiological changes and transcriptional modulation of HIF-αs in Siberian sturgeon in response to hypoxia. Aquaculture 545, 737219. doi:10.1016/j.aquaculture.2021.737219
Welker A. F., Moreira D. C., Campos É. G., Hermes-Lima M. (2013). Role of redox metabolism for adaptation of aquatic animals to drastic changes in oxygen availability. Comp. Biochem. Physiology Part A Mol. and Integr. Physiology 165, 384–404. doi:10.1016/j.cbpa.2013.04.003
Wu L., Li H., Xu W., Dong B., Geng H., Jin J., et al. (2022a). Emodin alleviates acute hypoxia-induced apoptosis in gibel carp (Carassius gibelio) by upregulating autophagy through modulation of the AMPK/mTOR pathway. Aquaculture 548, 737689. doi:10.1016/j.aquaculture.2021.737689
Wu L., Xu W., Li H., Dong B., Geng H., Jin J., et al. (2022b). Vitamin C attenuates oxidative stress, inflammation, and apoptosis induced by acute hypoxia through the Nrf2/Keap1 signaling pathway in gibel carp (Carassius gibelio). Antioxidants 11, 935. doi:10.3390/antiox11050935
Wu Y., Lai X., Lin B., Lin Y., Yang Y., Zhang M., et al. (2023). Transcriptome and hypoxia-responsive gene expression analyses reveal the physiological reaction to acute hypoxia and reoxygenation in Epinephelus coioides. Aquac. Rep. 31, 101655. doi:10.1016/j.aqrep.2023.101655
Wu Y., Lin Y., Lin B., Huang Y., Yu Z., Ma Y., et al. (2024). Effects of hypoxia and reoxygenation on energy metabolism, immune response, and apoptosis in orange-spotted grouper (Epinephelus coioides). Front. Mar. Sci. 11, 1495068. doi:10.3389/fmars.2024.1495068
Xiaolong G., Xian L., Ce S., Fucun W., Changbin S., Ying L. (2018). Effects of stocking density on growth, metabolism, and energy budget of Haliotis discus hannai ino. Aquaculture 483, 84–95. doi:10.1016/j.aquaculture.2017.09.045
Xu K., Wen M., Duan W., Ren L., Hu F., Xiao J., et al. (2015). Comparative analysis of testis transcriptomes from triploid and fertile diploid cyprinid fish. Biol. Reproduction 92, 95. doi:10.1095/biolreprod.114.125609
Yang C., Du X., Hao R., Wang Q., Deng Y., Sun R. (2019). Effect of vitamin D3 on immunity and antioxidant capacity of pearl oyster Pinctada fucata martensii after transplantation: insights from LC–MS-based metabolomics analysis. Fish and Shellfish Immunol. 94, 271–279. doi:10.1016/j.fsi.2019.09.017
Yang S., Yan T., Wu H., Xiao Q., Fu H. M., Luo J., et al. (2017). Acute hypoxic stress: effect on blood parameters, antioxidant enzymes, and expression of HIF-1alpha and GLUT-1 genes in largemouth bass (Micropterus salmoides). Fish and Shellfish Immunol. 67, 449–458. doi:10.1016/j.fsi.2017.06.035
Yang S., Wu H., He K., Yan T., Zhou J., Zhao L. L., et al. (2019). Response of AMP-activated protein kinase and lactate metabolism of largemouth bass (Micropterus salmoides) under acute hypoxic stress. Sci. Total Environ. 666, 1071–1079. doi:10.1016/j.scitotenv.2019.02.236
Zhang Y., Shen W., Ding J., Gao X., Wu X., Zhu J. (2022). Comparative transcriptome analysis of head kidney of Aeromonas hydrophila-infected hypoxia-tolerant and normal large yellow croaker. Mar. Biotechnol. 24, 1039–1054. doi:10.1007/s10126-022-10158-4
Zhang H., Yang Z., Fu J., Yuan Z., Chen J., Shen R., et al. (2025). Knockout of the fih gene by CRISPR/Cas9 enhances the hypoxia tolerance in grass carp (Ctenopharyngodon idella). Aquaculture 604, 742452. doi:10.1016/j.aquaculture.2025.742452
Zhao L. L., Sun J. L., Liang J., Liu Q., Luo J., Li Z. Q., et al. (2020). Enhancing lipid metabolism and inducing antioxidant and immune responses to adapt to acute hypoxic stress in Schizothorax prenanti. Aquaculture 519, 734933. doi:10.1016/j.aquaculture.2020.734933
Zhao S.-S., Su X.-L., Pan R.-J., Lu L.-Q., Zheng G.-D., Zou S.-M. (2022). The transcriptomic responses of blunt snout bream (Megalobrama amblycephala) to acute hypoxia stress alone, and in combination with bortezomib. BMC Genomics 23, 162. doi:10.1186/s12864-022-08399-7
Zheng X., Fu D., Cheng J., Tang R., Chu M., Chu P., et al. (2021). Effects of hypoxic stress and recovery on oxidative stress, apoptosis, and intestinal microorganisms in Pelteobagrus vachelli. Aquaculture 543, 736945. doi:10.1016/j.aquaculture.2021.736945
Keywords: Epinephelus cyanopodus, hypoxic stress, RNA-Seq, metabolism, immune response
Citation: Chen Q, Huang Y, Yu Z, He W, Hu X, Wu J, Cai T, Cui Y, Gao A and Shu H (2025) Transcriptome analysis reveals physiological responses in liver tissues of Epinephelus cyanopodus under acute hypoxic stress. Front. Physiol. 16:1697398. doi: 10.3389/fphys.2025.1697398
Received: 02 September 2025; Accepted: 18 November 2025;
Published: 09 December 2025.
Edited by:
Pung Pung Hwang, Academia Sinica, TaiwanReviewed by:
Yinnan Mu, Fujian Agriculture and Forestry University, ChinaDingbin Gong, Anqing Normal University, China
Copyright © 2025 Chen, Huang, Yu, He, Hu, Wu, Cai, Cui, Gao and Shu. This is an open-access article distributed under the terms of the Creative Commons Attribution License (CC BY). The use, distribution or reproduction in other forums is permitted, provided the original author(s) and the copyright owner(s) are credited and that the original publication in this journal is cited, in accordance with accepted academic practice. No use, distribution or reproduction is permitted which does not comply with these terms.
*Correspondence: Along Gao, YWxnYW9AZ3podS5lZHUuY24=; Hu Shu, c2h1aHUwMDFAMTI2LmNvbQ==