 Marton Horvath1
 Erik P. Andersson1*
 Adam Kölnas2Adam Spreitz2Hjalmar Boström2Arvid Sörfeldt2Dan Kuylenstierna3
- 1Swedish Winter Sports Research Centre, Department of Health Sciences, Mid Sweden University, Östersund, Sweden
- 2Chalmers University of Technology, Gothenburg, Sweden
- 3Microwave Electronics Laboratory, Department of Microtechnology and Nanoscience, Chalmers University of Technology, Gothenburg, Sweden
Introduction: This study aimed to develop a methodology for establishing the power–duration relationship in cross-country skiers and to investigate the influence of incline on critical power (
Methods: Twelve trained male cross-country skiers performed four constant work-rate predictive trials on a motor-driven treadmill, using the double poling sub-technique, to determine their power–duration relationships at 2° and 8° inclines in a randomized order. The testing protocol also included maximum speed tests performed at both inclines. Power-duration relationships were modeled using a modified expression of the three-parameter critical power model.
Results: The derived power-duration relationships were significantly different between the two inclines. At an 8° incline, the estimated work capacity above
Discussion: The findings demonstrate that in cross-country skiing, both
1 Introduction
Although methods for estimating mechanical power output using positional data in cross-country skiing are well-established (for details, see, for example, Gløersen et al. (2018b); Swarén and Eriksson (2019)) and ski pole-integrated propulsive power output measurement is emerging (Johansson et al., 2019; Kuylenstierna et al., 2020), power output data inclusion into training and performance analysis remains limited in the sport. In contrast, cycling has widely adopted power output profiling over the past two decades, aided by commercial power meters, which have enabled accurate external training load assessment, power-based training prescription, and the continuous monitoring of changes in the athletes’ performance across racing seasons (Quod et al., 2010; Leo et al., 2022; Pinot and Grappe, 2010; Leo et al., 2021). Contrarily, training load monitoring in cross-country skiing is primarily based on the assessment of physiological and perceptual responses to exercise, such as heart rate, blood lactate accumulation, and the rate of perceived exertion (Seiler and Kjerland, 2006; Yu et al., 2023). Nevertheless, these measures have been shown to underestimate fatigue from short-duration anaerobic and neuromuscular efforts due to their time lag (e.g., sprints over short climbs, or position changes in a sprint race), as well as to struggle accurately capturing both the instantaneous magnitude of effort and fatigue accumulation during intermittent exercise (Bolger et al., 2015; Sitko et al., 2020).
Under competitive conditions, cross-country skiers frequently generate power outputs exceeding those associated with their maximal oxygen uptake, particularly during uphill sections, followed by flat or downhill segments that typically permit partial recovery (Gløersen et al., 2020; Andersson et al., 2017; Andersson et al., 2019). In addition to advancements in the available technology, this intermittent nature of cross-country ski races, characterized by both repetitive high-intensity bouts of effort taxing the anaerobic energy systems on climbs, and a continuously high demand for aerobic energy turnover along the race course (Losnegard, 2019), suggests that if accurate power output assessment were feasible, the critical power concept could be introduced into cross-country skiing as an alternative approach for investigating the energetic demands of the sport (Gløersen et al., 2020; Jones and Vanhatalo, 2017). However, given the concept’s physiological basis, the influence of external factors, such as incline and speed, on the ratio between external work rate and metabolic energy turnover (i.e., gross efficiency) must be considered when implementing it in cross-country skiing (Sidossis et al., 1992).
The relationship between sustainable power output and exercise duration is commonly characterized using critical power models, originally formulated by Monod and Scherrer (1965) to describe the hyperbolic dependence of work capacity on time to exhaustion. The two-parameter critical power model describes power output (
where
The standard establishment of the power-duration relationship typically involves multiple constant work rate tests or time-based time trials, performed within the severe-intensity domain, which methodology results in the typical restriction of the accurately modeled exercise duration range to the 2–15 min domain (Bergstrom et al., 2014; Ferguson et al., 2010; Poole et al., 2016). Nevertheless, recent studies have demonstrated that using the three-parameter critical power model can extend the exercise duration range applicable to the model towards durations as short as 20 s (Vinetti et al., 2023; 2019). Furthermore, single-visit protocols have been developed and implemented for assessing
The present study aimed to develop a methodological framework for establishing the power–duration relationship in cross-country skiers using a treadmill roller-skiing protocol. Furthermore, the study sought to examine how incline influences the derived parameter estimates of the used critical power model.
2 Materials and methods
2.1 Subjects
Twelve trained male cross-country skiers (mean
2.2 Equipment and testing procedure
The participants visited the laboratory on one occasion, during which they completed two incremental maximum speed tests and eight constant work rate predictive trials to exhaustion (a total of ten tests with target durations ranging from 5-320 s), using the double poling (DP) sub-technique. All tests were performed on a motorized treadmill (dimensions: 3.5 m
Each participant completed all tests at both 2° and 8° inclines in a randomized order. The protocol began with a 10-min standardized warm-up. After a 2-min recovery, a maximum speed test was initiated following the methodology described by Stöggl et al. (2007). At a 2° incline, the maximum speed test started at 16 km
The relatively slow treadmill acceleration (i.e., 0.5 km
Body mass-normalized mean power output (
where
2.3 The modified three-parameter critical model
Morton introduced an abstract negative time-asymptote into the two-parameter critical power model to create a y-intercept for the power curve, thereby estimating maximal instantenous power output. If
where
When introducing Equation 5 into Equation 4, it can be reformulated as:
standardizing the dimensions of the critical power model parameters. This reparametrization dismisses the negative time constant from the model, enhancing its physiological interpretability. Equation 6 can be further reformulated by defining the ratio
The sigmoid shape of the log-transformed power-duration curve is governed by the specific model parameters in distinct ways (Figures 1a–d). A change in
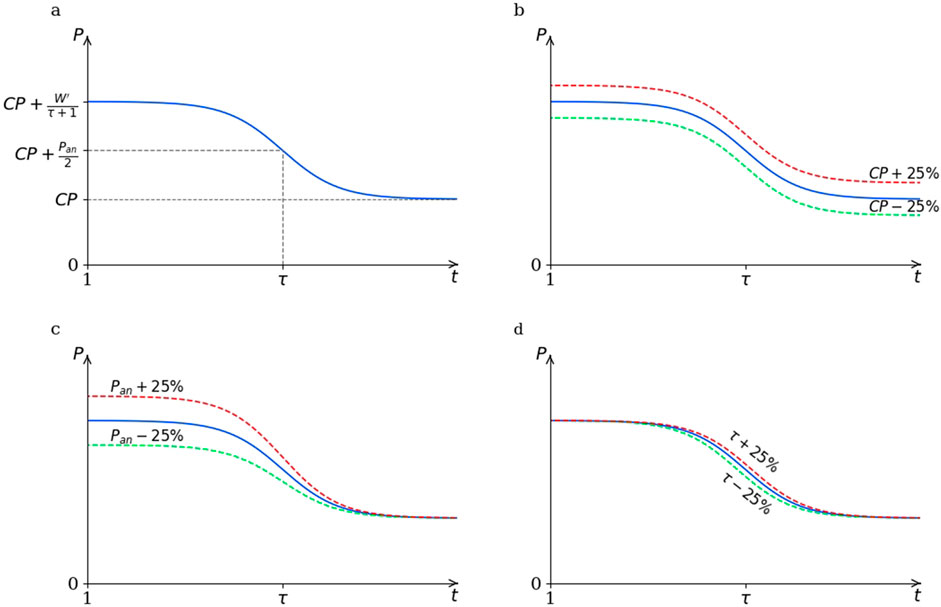
Figure 1. Panel (a) Representation of model parameters, including the components of
2.4 Predictive trials
The constant work rate predictive trials for assessing individual power-duration relationships aimed to induce complete exhaustion around specified target durations of 5, 20, 80 and 320 s, aligning with the characteristics of the used three-parameter critical power model (see Section 2.3). Due to the instrumental constraints posed to treadmill roller-skiing, the power output for each predictive trial had to be estimated in advance of testing. This estimation was based on the power output attained during the final stage of the maximum speed tests, calculated using Equation 3. Based on Equation 7, assuming that power output at level
where
2.5 Gross efficiency adjustment concerning speed and incline
Gross efficiency
for describing the influence of treadmill speed, and
for describing the influence of treadmill incline on
2.6 Statistical analysis
Due to the relatively small sample size (
3 Results
In the final stage of the maximum speed tests, the participants reached 27.4
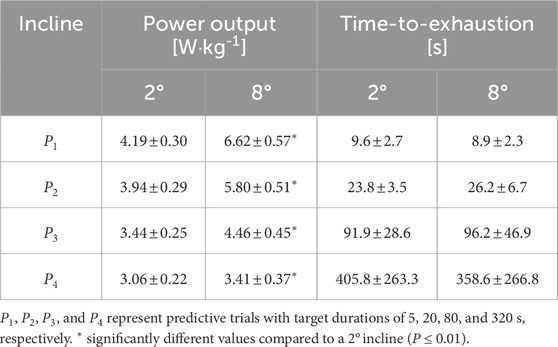
Table 1. Power output and time-to-exhaustion during predictive trials (
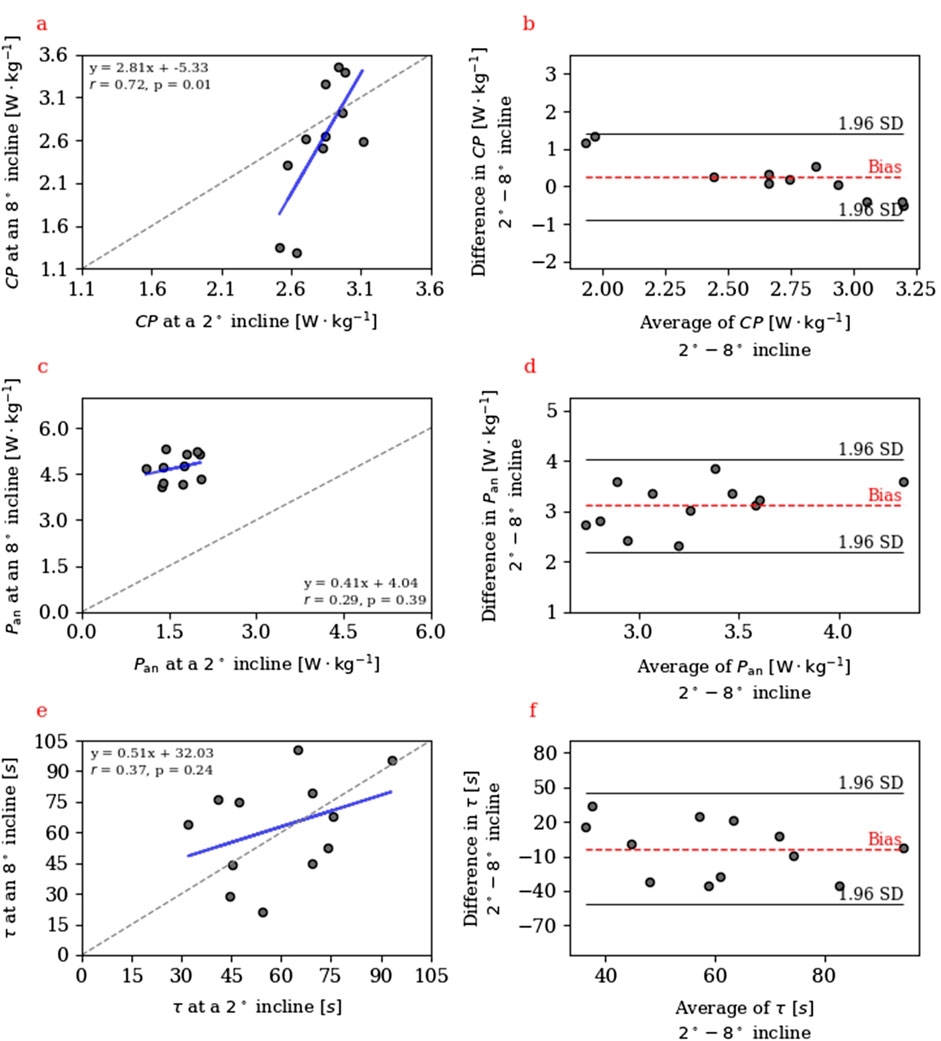
Figure 2. Panel (a,c,e) Linear regressions between critical power (
The expansion of
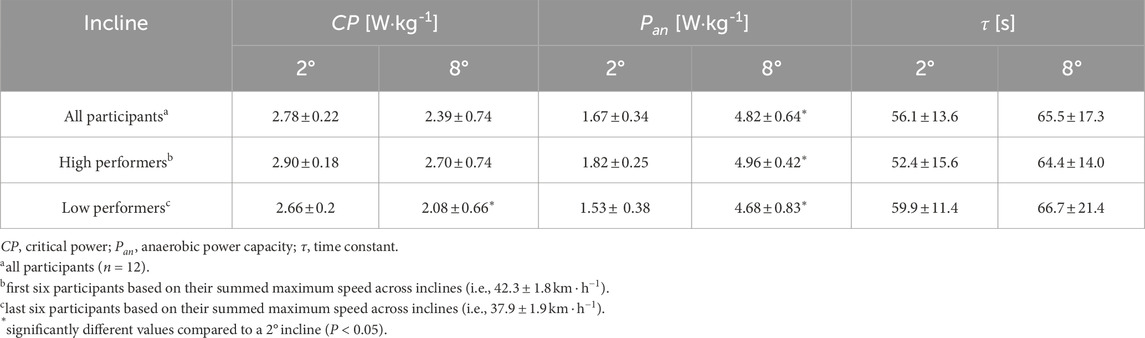
Table 2. Model parameters extracted from power-duration relationships at 2° and 8° incline.
Predicted
Concerning the accuracy and precision of the derived power-duration relationships, the extracted model parameters resulted in an excellent fit (
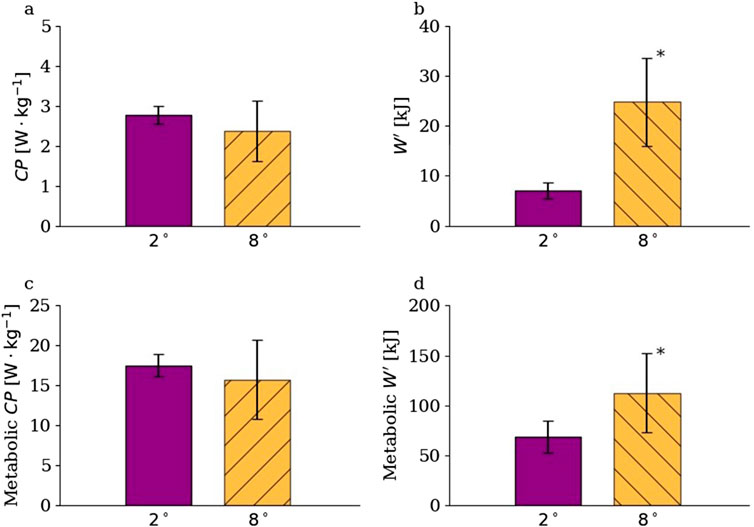
Figure 3. Critical power (
4 Discussion
This study is the first to apply the critical power concept to performance assessment and prediction in cross-country skiing. The study introduced a novel testing approach based on the three-parameter critical power model, and aimed to investigate the effect of incline on critical power model parameters during double poling on a motorized treadmill. Its main findings were that: 1)
In the current study, the participants demonstrated a considerably higher (i.e.,
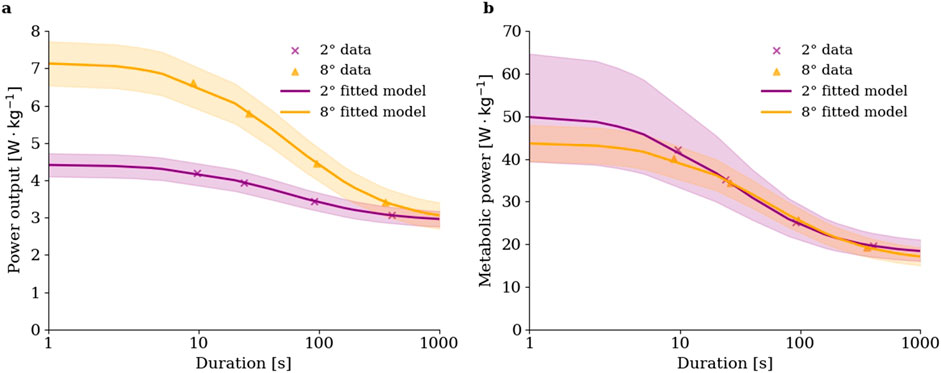
Figure 4. Power-duration [panel (a)] and estimated metabolic power-duration [panel (b)] relationships at 2° and 8° inclines. Metabolic power was estimated using power output-gross efficiency relationships derived from data published by Andersson et al. (2017). Shaded areas represent power-duration relationships fitted against mean power output values
The conversion of power output into metabolic power closed the distance between data points representing predictive trials in the power-duration plane by accounting for the estimated effect of changing
It is important to highlight that our findings showed greater variability in
Altogether, the power–duration relationship carries implications that are more relevant to cross-country skiing than cycling, namely, the incline dependence of critical power model parameters, especially
5 Methodological considerations
The present study has exclusively focused on the DP sub-technique. The selected testing gradients were 2° and 8°. Although skiers typically employ the diagonal stride sub-technique at the steeper incline due to its higher
Unlike conventional approaches prescribing predictive trial intensities relative to power output corresponding to maximal oxygen uptake (Bergstrom et al., 2014; Ferguson et al., 2010; Vanhatalo et al., 2007), predictive trial intensities in the present study were derived using the average power output attained during the final stage of the maximum speed tests and the modified three-parameter critical power model (see Section 2.3). Furthermore, the longest predictive trial was designed to remain well within the severe-intensity domain. This approach reduced total testing time to minimize fatigue accumulation, though it led to the inclusion of predictive trial durations representing the extreme-intensity domain. Concerning the chosen mathematical model, the findings of Vinetti et al. (2019) suggested that the three-parameter critical power model provides a valid approach for modeling power output across the chosen target durations, which has been applied previously to fit power data in the extreme-intensity domain (Vinetti et al., 2023). Nonetheless, based on previous findings, the formulation and implementation of a ‘multi-domain’ critical power model may offer improved predictions across the exercise intensity spectrum (Alexander et al., 2019; Hill et al., 2002; Puchowicz et al., 2020; Puchowicz and Skiba, 2025).
Time-to-exhaustion during the predictive trials was not significantly different between inclines, which suggests the reliability of the developed method for assessing the power-duration relationship across inclines during treadmill roller skiing. However, the mean deviation from the target durations remained substantial (
Derived model parameter estimates, especially
6 Practical applications
The limited availability of power meters for cross-country skiing and the potential inaccuracies related to positional data-based power output estimation limit the practical applicability of the present study, as its findings are primarily relevant to treadmill roller skiing. Nevertheless, the presented methodology has direct applications for performance testing in a laboratory environment. Monitoring changes in cross-country skiers’ power-duration relationship could provide more detailed insights into their individual strengths and weaknesses. Furthermore, exploring the dependence of the power–duration relationship on external factors, such as incline, could enhance performance analysis and provide new approaches for optimizing performance and pacing strategies in the sport.
7 Conclusion
This study demonstrated that incline during treadmill roller skiing has a substantial effect on the estimates of critical power model parameters, particularly
Furthermore, the findings highlight the importance of accounting for external factors, such as incline and speed, when assessing the exercise-induced metabolic demand at a given mechanical power output in the context of establishing the power–duration relationship. These effects were shown to be particularly relevant in cross-country skiing, but may also have implications for cycling. Future studies should investigate how the accumulated
Data availability statement
The raw data supporting the conclusions of this article will be made available by the authors, without undue reservation.
Ethics statement
The studies involving humans were approved by the Swedish Ethical Review Authority (Dnr: 2023-03470-01). The studies were conducted in accordance with the local legislation and institutional requirements. The participants provided their written informed consent to participate in this study.
Author contributions
MH: Conceptualization, Data curation, Methodology, Visualization, Writing – original draft, Writing – review and editing. EA: Conceptualization, Supervision, Writing – review and editing. AK: Data curation, Writing – review and editing. AS: Data curation, Writing – review and editing. HB: Data curation, Writing – review and editing. AS: Data curation, Writing – review and editing. DK: Conceptualization, Data curation, Methodology, Resources, Supervision, Visualization, Writing – original draft, Writing – review and editing.
Funding
The author(s) declare that no financial support was received for the research and/or publication of this article.
Acknowledgements
We would like to sincerely thank all the athletes who volunteered to participate in this study. Furthermore, we would like to express our gratitude toward Maurten AB (Gothenburg, Sweden) for their generous provision of nutrition for our study.
Conflict of interest
The authors declare that the research was conducted in the absence of any commercial or financial relationships that could be construed as a potential conflict of interest.
Generative AI statement
The author(s) declare that no Generative AI was used in the creation of this manuscript.
Any alternative text (alt text) provided alongside figures in this article has been generated by Frontiers with the support of artificial intelligence and reasonable efforts have been made to ensure accuracy, including review by the authors wherever possible. If you identify any issues, please contact us.
Publisher’s note
All claims expressed in this article are solely those of the authors and do not necessarily represent those of their affiliated organizations, or those of the publisher, the editors and the reviewers. Any product that may be evaluated in this article, or claim that may be made by its manufacturer, is not guaranteed or endorsed by the publisher.
Supplementary material
The Supplementary Material for this article can be found online at: https://www.frontiersin.org/articles/10.3389/fphys.2025.1712475/full#supplementary-material
References
Alexander A. M., Didier K. D., Hammer S. M., Dzewaltowski A. C., Kriss K. N., Lovoy G. M., et al. (2019). Exercise tolerance through severe and extreme intensity domains. Physiol. Rep. 7, e14014. doi:10.14814/phy2.14014
Andersson E., Björklund G., Holmberg H.-C., Ørtenblad N. (2017). Energy system contributions and determinants of performance in sprint cross-country skiing. Scand. J. Med. and Sci. sports 27, 385–398. doi:10.1111/sms.12666
Andersson E. P., Govus A., Shannon O. M., McGawley K. (2019). Sex differences in performance and pacing strategies during sprint skiing. Front. physiology 10, 295. doi:10.3389/fphys.2019.00295
Andersson E. P., Hämberg I., Do Nascimento Salvador P. C., McGawley K. (2021). Physiological responses and cycle characteristics during double-poling versus diagonal-stride roller-skiing in junior cross-country skiers. Eur. J. Appl. Physiology 121, 2229–2241. doi:10.1007/s00421-021-04689-2
Ansley L., Cangley P. (2009). Determinants of “optimal” cadence during cycling. Eur. J. Sport Sci. 9, 61–85. doi:10.1080/17461390802684325
Bangsbo J., Michalsik L., Petersen A. (1993). Accumulated o2 deficit during intense exercise and muscle characteristics of elite athletes. Int. J. Sports Med. 14, 207–213. doi:10.1055/s-2007-1021165
Barker T., Poole D. C., Noble M. L., Barstow T. J. (2006). Human critical power–oxygen uptake relationship at different pedalling frequencies. Exp. Physiol. 91, 621–632. doi:10.1113/expphysiol.2005.032789
Barrett-O’Keefe Z., Helgerud J., Wagner P. D., Richardson R. S. (2012). Maximal strength training and increased work efficiency: contribution from the trained muscle bed. J. Appl. physiology 113, 1846–1851. doi:10.1152/japplphysiol.00761.2012
Bergstrom H. C., Housh T. J., Zuniga J. M., Traylor D. A., Lewis J. , R. W., Camic C. L., et al. (2014). Differences among estimates of critical power and anaerobic work capacity derived from five mathematical models and the three-minute all-out test. J. Strength and Cond. Res. 28, 592–600. doi:10.1519/JSC.0b013e31829b576d
Black M. I., Jones A. M., Blackwell J. R., Bailey S. J., Wylie L. J., McDonagh S. T., et al. (2017). Muscle metabolic and neuromuscular determinants of fatigue during cycling in different exercise intensity domains. J. Appl. Physiology 122, 446–459. doi:10.1152/japplphysiol.00942.2016
Blair R. C., Higgins J. J. (1985). Comparison of the power of the paired samples t test to that of wilcoxon’s signed-ranks test under various population shapes. Psychol. Bull. 97, 119–128. doi:10.1037/0033-2909.97.1.119
Bland J. M., Altman D. G. (1999). Measuring agreement in method comparison studies. Stat. methods Med. Res. 8, 135–160. doi:10.1177/096228029900800204
Bolger C. M., Kocbach J., Hegge A. M., Sandbakk Ø. (2015). Speed and heart-rate profiles in skating and classical cross-country-skiing competitions. Int. J. sports physiology Perform. 10, 873–880. doi:10.1123/ijspp.2014-0335
Caen K., Poole D. C., Vanhatalo A., Jones A. M. (2024). Critical power and maximal lactate steady state in cycling:“watts” the difference? Sports Med. 54, 2497–2513. doi:10.1007/s40279-024-02075-4
Chidnok W., Dimenna F. J., Bailey S. J., Vanhatalo A., Morton R. H., Wilkerson D. P., et al. (2012). Exercise tolerance in intermittent cycling: application of the critical power concept. Med. and Sci. Sports and Exerc. 44, 966–976. doi:10.1249/MSS.0b013e31823ea28a
Chorley A., Bott R. P., Marwood S., Lamb K. L. (2020). Physiological and anthropometric determinants of critical power, w and the reconstitution of w in trained and untrained Male cyclists. Eur. J. Appl. Physiology 120, 2349–2359. doi:10.1007/s00421-020-04459-6
Ettema G., Lorås H. W. (2009). Efficiency in cycling: a review. Eur. J. Appl. physiology 106, 1–14. doi:10.1007/s00421-009-1008-7
Ettema G., Øksnes M., Kveli E., Sandbakk Ø. (2018). The effect of exhaustive exercise on the choice of technique and physiological response in classical roller skiing. Eur. J. Appl. Physiology 118, 2385–2392. doi:10.1007/s00421-018-3965-1
Ferguson C., Rossiter H. B., Whipp B. J., Cathcart A. J., Murgatroyd S. R., Ward S. A. (2010). Effect of recovery duration from prior exhaustive exercise on the parameters of the power-duration relationship. J. Appl. physiology 108, 866–874. doi:10.1152/japplphysiol.91425.2008
Gløersen Ø., Losnegard T., Malthe-Sørenssen A., Dysthe D. K., Gilgien M. (2018b). Propulsive power in cross-country skiing: application and limitations of a novel wearable sensor-based method during roller skiing. Front. physiology 9, 1631. doi:10.3389/fphys.2018.01631
Gløersen Ø. N., Gilgien M., Dysthe D. K., Malthe-Sørenssen A., Losnegard T. J. (2020). Oxygen demand, uptake, and deficits in elite cross-country skiers during a 15-km race. Med. and Sci. Sports and Exerc. 52, 983–992. doi:10.1249/MSS.0000000000002209
Haase R., Dunst A. K., Nitzsche N. (2024). The influence of pedaling frequency on blood lactate accumulation in cycling sprints. Int. J. Sports Med. 45, 608–615. doi:10.1055/a-2255-5254
Hill D. W., Poole D. C., Smith J. C. (2002). The relationship between power and the time to achieve vo2max. Med. and Sci. Sports and Exerc. 34, 709–714. doi:10.1097/00005768-200204000-00023
Hovorka M., Leo P., Simon D., Prinz B., Nimmerichter A. (2022). Effects of flat and uphill cycling on the power-duration relationship. Int. J. Sports Med. 43, 701–707. doi:10.1055/a-1749-5884
Johansson M., Korneliusson M., Lawrence N. L. (2019). “Identifying cross country skiing techniques using power meters in ski Poles,” in Nordic artificial intelligence research and development: third symposium of the Norwegian AI society, NAIS 2019, trondheim, Norway, may 27–28, 2019, proceedings 3 (Springer), 52–57.
Jones A. M., Vanhatalo A. (2017). The ‘critical power’concept: applications to sports performance with a focus on intermittent high-intensity exercise. Sports Med. 47, 65–78. doi:10.1007/s40279-017-0688-0
Karlsson Ø., Gilgien M., Gløersen Ø. N., Rud B., Losnegard T. (2018). Exercise intensity during cross-country skiing described by oxygen demands in flat and uphill terrain. Front. physiology 9, 846. doi:10.3389/fphys.2018.00846
Kuylenstierna D., Högstrand J., Lai S., Gingsjö H., Lindinger S. (2020). “Validation, accuracy and practical use of a power measurement system for cross-country skiing analysis - a pilot study,” in Science and skiing VIII. Book of the 8th international congress on science and skiing (Jyväskylä: University of Jyväskylä; Vuokatti Sports Technology Unit of the Faculty of Sport and Health Sciences of the University of Jyväskylä), 153–160.
Leo P., Spragg J., Mujika I., Menz V., Lawley J. S. (2021). Power profiling in u23 professional cyclists during a competitive season. Int. J. sports physiology Perform. 16, 881–889. doi:10.1123/ijspp.2020-0200
Leo P., Spragg J., Podlogar T., Lawley J. S., Mujika I. (2022). Power profiling and the power-duration relationship in cycling: a narrative review. Eur. J. Appl. physiology 122, 301–316. doi:10.1007/s00421-021-04833-y
Løkkeborg J., Ettema G. (2020). The role of incline, speed and work rate on the choice of technique in classical roller skiing. PloS one 15, e0236102. doi:10.1371/journal.pone.0236102
Losnegard T. (2019). Energy system contribution during competitive cross-country skiing. Eur. J. Appl. physiology 119, 1675–1690. doi:10.1007/s00421-019-04158-x
McKay A. K., Stellingwerff T., Smith E. S., Martin D. T., Mujika I., Goosey-Tolfrey V. L., et al. (2021). Defining training and performance caliber: a participant classification framework. Int. J. sports physiology Perform. 17, 317–331. doi:10.1123/ijspp.2021-0451
Millet G. P., Tronche C., Fuster N., Candau R. (2002). Level ground and uphill cycling efficiency in seated and standing positions. Med. and Sci. Sports and Exerc. 34, 1645–1652. doi:10.1097/00005768-200210000-00017
Monod H., Scherrer J. (1965). The work capacity of a synergic muscular group. Ergonomics 8, 329–338. doi:10.1080/00140136508930810
Morton H. (1996). A 3-parameter critical power model. Ergonomics 39, 611–619. doi:10.1080/00140139608964484
Øfsteng S., Sandbakk Ø., Van Beekvelt M., Hammarström D., Kristoffersen R., Hansen J., et al. (2018). Strength training improves double-poling performance after prolonged submaximal exercise in cross-country skiers. Scand. J. Med. and Sci. sports 28, 893–904. doi:10.1111/sms.12990
Olesen H. L. (1992). Accumulated oxygen deficit increases with inclination of uphill running. J. Appl. Physiology 73, 1130–1134. doi:10.1152/jappl.1992.73.3.1130
Østerås S., Welde B., Danielsen J., Van den Tillaar R., Ettema G., Sandbakk Ø. (2016). Contribution of upper-body strength, body composition, and maximal oxygen uptake to predict double poling power and overall performance in female cross-country skiers. J. Strength and Cond. Res. 30, 2557–2564. doi:10.1519/JSC.0000000000001345
Pinot J., Grappe F. (2010). The ‘power profile’for determining the physical capacities of a cyclist. Comput. Methods Biomechanics Biomed. Eng. 13, 103–104. doi:10.1080/10255842.2010.495580
Poole D. C., Burnley M., Vanhatalo A., Rossiter H. B., Jones A. M. (2016). Critical power: an important fatigue threshold in exercise physiology. Med. Sci. sports Exerc. 48, 2320–2334. doi:10.1249/MSS.0000000000000939
Puchowicz M. J., Skiba P. F. (2025). Functional data analysis of the power–duration relationship in cyclists. Int. J. Sports Physiology Perform. 1, 1331–1340. doi:10.1123/ijspp.2024-0548
Puchowicz M. J., Mizelman E., Yogev A., Koehle M. S., Townsend N. E., Clarke D. C. (2018). The critical power model as a potential tool for anti-doping. Front. physiology 9, 643. doi:10.3389/fphys.2018.00643
Puchowicz M. J., Baker J., Clarke D. C. (2020). Development and field validation of an omni-domain power-duration model. J. sports Sci. 38, 801–813. doi:10.1080/02640414.2020.1735609
Quod M., Martin D., Martin J., Laursen P. (2010). The power profile predicts road cycling mmp. Int. J. Sports Med. 31, 397–401doi. doi:10.1055/s-0030-1247528
Rossi P. G. V., Machado F. A., de Almeida E. J., Peserico C. S. (2023). Are peak power output, critical power and lower limb muscle power correlated in recreational endurance cyclists? J. Sci. Cycl. 12, 40–48. doi:10.28985/1223.jsc.11
Sandbakk Ø., Holmberg H.-C., Leirdal S., Ettema G. (2010). Metabolic rate and gross efficiency at high work rates in world class and national level sprint skiers. Eur. J. Appl. physiology 109, 473–481. doi:10.1007/s00421-010-1372-3
Seiler K. S., Kjerland G. Ø. (2006). Quantifying training intensity distribution in elite endurance athletes: is there evidence for an “optimal” distribution? Scand. J. Med. and Sci. sports 16, 49–56. doi:10.1111/j.1600-0838.2004.00418.x
Sidossis L., Horowitz J., Coyle E. (1992). Load and velocity of contraction influence gross and Delta mechanical efficiency. Int. J. Sports Med. 13, 407–411. doi:10.1055/s-2007-1021289
Simpson L. P., Kordi M. (2017). Comparison of critical power and w derived from 2 or 3 maximal tests. Int. J. Sports Physiology Perform. 12, 825–830. doi:10.1123/ijspp.2016-0371
Sitko S., Cirer-Sastre R., Corbi F., López-Laval I. (2020). Power assessment in road cycling: a narrative review. Sustainability 12, 5216. doi:10.3390/su12125216
Sloniger M. A., Cureton K. J., Prior B. M., Evans E. M. (1997). Anaerobic capacity and muscle activation during horizontal and uphill running. J. Appl. Physiology 83, 262–269. doi:10.1152/jappl.1997.83.1.262
Spragg J., Leo P., Giorgi A., Gonzalez B. M., Swart J. (2024). The intensity rather than the quantity of prior work determines the subsequent downward shift in the power duration relationship in professional cyclists. Eur. J. Sport Sci. 24, 449–457. doi:10.1002/ejsc.12077
Staib J. L., Im J., Caldwell Z., Rundell K. W. (2000). Cross-country ski racing performance predicted by aerobic and anaerobic double poling power. J. Strength and Cond. Res. 14, 282–288. doi:10.1519/00124278-200008000-00007
Stöggl T. L., Holmberg H.-C. (2016). Double-poling biomechanics of elite cross-country skiers: flat versus uphill terrain. Med. and Sci. sports and Exerc. 48, 1580–1589. doi:10.1249/MSS.0000000000000943
Stöggl T., Lindinger S., Müller E. (2007). Analysis of a simulated sprint competition in classical cross country skiing. Scand. J. Med. and Sci. sports 17, 362–372. doi:10.1111/j.1600-0838.2006.00589.x
Stöggl T., Ohtonen O., Takeda M., Miyamoto N., Snyder C., Lemmettylä T., et al. (2018). Comparison of exclusive double poling to classic techniques of cross-country skiing. Med. Sci. sports Exerc. 51, 760–772. doi:10.1249/MSS.0000000000001840
Swarén M., Eriksson A. (2019). Power and pacing calculations based on real-time locating data from a cross-country skiing sprint race. Sports Biomech. 18, 190–201. doi:10.1080/14763141.2017.1391323
Tomczak M., Tomczak E. (2014) “An overview of some recommended measures of effect size,” in The need to report effect size estimates revisited.
Vanhatalo A., Doust J. H., Burnley M. (2007). Determination of critical power using a 3-min all-out cycling test. Med. Sci. sports Exerc. 39, 548–555. doi:10.1249/mss.0b013e31802dd3e6
Vinetti G., Taboni A., Bruseghini P., Camelio S., D’Elia M., Fagoni N., et al. (2019). Experimental validation of the 3-parameter critical power model in cycling. Eur. J. Appl. Physiology 119, 941–949. doi:10.1007/s00421-019-04083-z
Vinetti G., Pollastri L., Lanfranconi F., Bruseghini P., Taboni A., Ferretti G. (2023). Modeling the power-duration relationship in professional cyclists during the giro d’italia. J. Strength and Cond. Res. 37, 866–871. doi:10.1519/JSC.0000000000004350
Wakeling J. M., Uehli K., Rozitis A. I. (2006). Muscle fibre recruitment can respond to the mechanics of the muscle contraction. J. R. Soc. Interface 3, 533–544. doi:10.1098/rsif.2006.0113
Keywords: aerobic capacity, anaerobic capacity, critical power, performance prediction, performance testing, power output, sports performance, three-parameter critical power model
Citation: Horvath M, Andersson EP, Kölnas A, Spreitz A, Boström H, Sörfeldt A and Kuylenstierna D (2025) Incline dependence of the power-duration relationship in cross-country skiing. Front. Physiol. 16:1712475. doi: 10.3389/fphys.2025.1712475
Received: 24 September 2025; Accepted: 28 October 2025;
Published: 13 November 2025.
Edited by:
Nathan E. Townsend, Hamad bin Khalifa University, QatarReviewed by:
Øyvind Gløersen, SINTEF Digital, NorwayMiguel Angel Galán Rioja, International University of La Rioja, Spain
Copyright © 2025 Horvath, Andersson, Kölnas, Spreitz, Boström, Sörfeldt and Kuylenstierna. This is an open-access article distributed under the terms of the Creative Commons Attribution License (CC BY). The use, distribution or reproduction in other forums is permitted, provided the original author(s) and the copyright owner(s) are credited and that the original publication in this journal is cited, in accordance with accepted academic practice. No use, distribution or reproduction is permitted which does not comply with these terms.
*Correspondence: Erik P. Andersson, ZXJpay5hbmRlcnNzb25AbWl1bi5zZQ==