 David E. Frankhouser
 Eric Dietze1
 Victoria L. Seewaldt
- 1Department of Population Sciences, City of Hope National Medical Center, Duarte, CA, United States
- 2Department of Astronomy, Division of Physics, Mathematics, and Astronomy, California Institute of Technology (Caltech), Pasadena, CA, United States
Angiogenesis is a key step in the initiation and progression of an invasive breast cancer. High microvessel density by morphological characterization predicts metastasis and poor survival in women with invasive breast cancers. However, morphologic characterization is subject to variability and only can evaluate a limited portion of an invasive breast cancer. Consequently, breast Magnetic Resonance Imaging (MRI) is currently being evaluated to assess vascularity. Recently, through the new field of radiomics, dynamic contrast enhanced (DCE)-MRI is being used to evaluate vascular density, vascular morphology, and detection of aggressive breast cancer biology. While DCE-MRI is a highly sensitive tool, there are specific features that limit computational evaluation of blood vessels. These include (1) DCE-MRI evaluates gadolinium contrast and does not directly evaluate biology, (2) the resolution of DCE-MRI is insufficient for imaging small blood vessels, and (3) DCE-MRI images are very difficult to co-register. Here we review computational approaches for detection and analysis of blood vessels in DCE-MRI images and present some of the strategies we have developed for co-registry of DCE-MRI images and early detection of vascularization.
Introduction
Vascularization and Breast Cancer Initiation
Angiogenesis is a dynamic process and an important early step during breast cancer initiation and progression (1, 2). The morphologic quantitation and characterization of blood vessels in a biopsy specimen relies on indirect measures such as microvessel density (number of small and tortuous vessels, immunohistochemistry (factor VIII, CD31, CD34)) (2–6). High microvessel density predicts metastasis and poor survival in women with breast cancer, including women with early-stage breast cancer (Stage 1) (7–16). While morphologic characterization of vascularity has strong prognostic value, there is variability (1) between different pathologists—there is significant inter- and intra-reader variability and (2) within a tumor—frequently a single tissue slice does not adequately capture microvessel density of an entire tumor. The variability of morphological characterization of blood vessels becomes particularly limiting when evaluating (1) response to neo-adjuvant chemotherapy and (2) women who are at high-risk for developing a breast cancer (e.g., germline BRCA mutation). Consequently, imaging strategies are being developed and optimized for early detection of vascularization, and ultimately, neovascularization.
Breast DCE-MRI
Dynamic contrast-enhanced magnetic resonance imaging (DCE-MRI) is routinely used to screen women at high-risk for breast cancer, evaluate the extent of local invasive breast cancer, and assist in planning of neo-adjuvant and adjuvant therapy (17). DCE-MRI utilizes timed pre- and post-contrast imaging; consequently, the semi-quantitative dynamics of contrast uptake and intensity (initial peak enhancements, delayed phase-washout) are routinely used for radiologic evaluation of DCE-MRI (18). DCE-MRI has proven to be highly sensitive and has revolutionized early detection of breast cancers, particularly in women who are at increased risk for breast cancer (19–31). Consequently, breast DCE-MRI has become standard of care and made it possible to obtain a high-resolution image of breast cancers and their associated vasculature. Despite the clinical success of breast DCE-MRI to image the breast with high sensitivity and resolution, the ability of DCE-MRI to image blood vessels with high precision remains a work in progress. Recently, through the new field of radiomics, contrast dynamics are being used to evaluate vascular density, vascular morphology, and detection of aggressive breast cancer biology. In addition to directly detecting and quantifying the vascularity, the indirect effects of altered vascularity such as perfusion and blood oxygen levels can be measured using both DCE-MRI alone and DCE-MRI in combination with other imaging modalities. These indirect approaches detect increased blood flow and hypoxia and have been shown to be diagnostic of breast cancer and predictive of treatment response (32–38). However, this review will focus on efforts to detect vessels in DCE-MRI of the breast.
Importance and Limitations of MRI-Based Vessel Detection in Breast Tissue and Cancer
DCE-MRI is standard-of-care for high-risk cancer screening and surgical staging and is not readily replaced. Furthermore, DCE-MRI time-sequence imaging data provides an opportunity to perform kinetic and pharmacokinetic modeling; this modeling holds promise to better characterize tumors (28, 30, 39, 40), monitor treatment effects (25, 31, 41), and plan radiation and surgical interventions (29, 42–44). Given the importance of DCE-MRI imaging, recent efforts have focused on detecting blood vessels in DCE-MRI images. However, the detection of blood vessels, particularly new blood vessels, in DCE-MRI images presents significant challenges.
First challenge is that DCE-MRI is not able to directly image biology. The presence of vessels is detected, both manually and computationally, based on high contrast enhancement and their linear morphology (shape). The fact that DCE-MRI provides dynamic 3D images of all tissue is simultaneously both the reason why it has so much potential benefit (wide-scale adoption and utility) and the reason why vessel detection is so difficult.
Second challenge is the resolution of MRI. Although MRI equipment with strong magnetic fields (>7.0 Tesla) can achieve a resolution <200 μm, the standard clinical MRI equipment used for breast cancer screening employs significantly weaker magnetic fields (1.5 or 3.0 Tesla) (45). This means that most MRI can only resolve features between 0.5 and 1.0 mm in size (46); small blood vessels range in size between 4 μm to < 1 mm (47). Consequently, DCE-MRI lacks the resolution to detect small or micro-vessels (48, 49).
A third issue is that breast tissue is inherently difficult to image. Unlike other tissue, where blood vessel detection has high accuracy, breast tissue presents many unique challenges (50–54). The human breast is highly heterogeneous both within the breast of individuals women and between women. Human breasts vary in size, the ratio of glandular tissue to adipose tissue, and the amount of collagen/extracellular matrix; furthermore, the human breast is subject to hormonal fluctuations during the menstrual cycle and undergoes complex changes during a woman's lifetime (puberty, pregnancy, lactation, involution, and menopause). The heterogeneity of the human breasts requires that imaging algorithms must be sufficiently flexible to have general applicability. Since breast tissue spans a range of densities and compositions, contrast enhancement changes within the breast and the intensity between background and tissue are not constant (48, 55). The breast also includes both adipose and fibroglandular tissues and both can appear on DCE-MRI images to have linear morphology (49, 55). Since blood vessels are detected based on contrast enhancement and morphology, accurately detecting blood vessels in the breast is very difficult. Additionally, the breast is highly deformable so movement during scans can change both the position and the shape of the breast resulting in imaging artifacts and making blood vessel detection even more difficult (49).
While it is challenging to perform vascular analysis of DCE-MRI (particularly in 3D), DCE-MRI is standard-of-care for breast cancer screening, surgical planning, and evaluation of response to neo-adjuvant chemotherapy. The advantages of DCE-MRI as a sensitive, non-invasive method to monitor for and detect lesions have made it a routine clinical procedure (19–21). Given the importance of DCE-MRI in clinical care, it is unlikely that it will soon or easily be replaced as the clinical standard-of-care by another imaging modality. Therefore, it is important to develop effective strategies to detect blood vessel density and morphology in DCE-MRI images. In this article, we aim to review computational approaches for detection and analysis of blood vessels in DCE-MRI images and present some of the strategies we have developed for co-registry of DCE-MRI images and detection of blood vessels and neovascularization.
Computational Approaches in Breast DCE-MRI
Computational analysis of breast MRI images is an active area of research that involves a wide range of methods and research goals. Here, we will provide a brief review of the non-vessel computational approaches used to analyse breast MRI images. This review will serve to introduce the wide range of computational and mathematical modeling approaches used for different breast cancer research. These non-vessel approaches will be used to inform and contrast with the derth of research in vessel detection. In this section, we will separate our review topics into (1) tumor detection and characterization or (2) radiomic analysis. The goal of radiomic analysis can either be detection or characterization of lesions/tumors, the specific goal of the analysis drives which approach is selected. Tumor Detection and Characterization is performed by applying mathematical and computational analysis to the imaging data. Radiomics first extracts quantitative features from the imaging data, then organizes the features in a database, and finally uses mathematical and computational approaches to perform analysis on the database (56). Here we will briefly survey and compare the computational approaches used for (1) Tumor Detection and Characterization and (2) radiomics.
Tumor Detection and Characterization
Tumor Detection and Characteristics analysis is conducted both for research and to improve clinical decision making. Analysis uses morphologic features, enhancement kinetics, or a combination of both. To support clinical decision making, clinical aided systems work with human experts to improve both (1) early identification of tumors and (2) the sensitivity/specificity of breast imaging (57, 58). Many clinical aided systems have been developed and commercialized for mammography. In contrast, development of clinical aided systems for breast DCE-MRI is in its nascent stage and the systems that have been developed have not been widely tested outside the data set for which they were developed (58, 59). This lag in the development of clinical aided systems for breast MRI is primarily the result of lack of standardization of DCE-MRI across centres and institutions. Key differences in DCE-MRI protocols include the (1) specific gadolinium contrast agent used, (2) amount of contrast given, (3) magnet strength, and (4) image acquisition strategy. Despite these challenges, approaches have been developed and, within their data set, demonstrate excellent sensitivity and specificity.
The first type of Tumor Detection and Classification methods analyse the dynamics of the contrast agent. To identify tissue with malignant potential, the earliest methods of this type used kinetic curves, which show changes in contrast enhancement over time. The kinetic curve was constructed by plotting the signal intensity over time and classifying the curve based on the rate of contrast uptake and then washout. The shape of the washout curve was used to diagnose the tissue; benign or indeterminate tissue has slow uptake or plateauing intensity over time; malignant tissue has both rapid uptake and washout (60–66). The rapid uptake/washout of malignant tissue is attributed to the increased vascularity associated with tumors (66–68). These models, however, are often considered semi-quantitative and, due to inconsistencies between DCE-MRI protocols and machines, need to be tuned and adapted for each new study (59, 69). A more quantitative approach is to use pharmacokinetic models that apply mathematical equations to model the flow of contrast agent through the vasculature into the tissue (70); the most common model is a variant of the Tofts model (70–75). These flow models allow for measurement and comparison of physiologically relevant parameters; parameters measuring volume of contrast transferred (Ktrans) and vascular volume (vp) are able to distinguish between malignant and benign tumors (48, 69). The parameters Ktrans and vp, similar to kinetic curves measuring contrast uptake/washout, are assumed to correlate with the increased vascularity of malignant tissue. When compared to classifying kinetic curves, pharmacokinetic models have also been shown to out-perform kinetic curves (69, 76) and reduce the variability between DCE-MRI protocol and noisy signal (77). These models, however, also make assumptions about contrast flow and require multiple post-contrast time points; these assumptions limit their general applicability (74, 77, 78).
The second type of Tumor Detection and Classification methods involve machine learning. Machine learning approaches have been employed frequently and span the machine learning spectrum from clustering to deep learning neural networks. A number of reviews about machine learning in breast DCE-MRI focus on either the types of methods (79), the goal of the method (58, 80), or the conclusions of the study (57, 81). Starting with the machine learning approaches, we will provide a concise, non-exhaustive survey of the more popular machine learning methods being used and briefly describe each approach.
Fuzzy C-means clustering is one of the most widely used unsupervised approaches to analyse breast DCE-MRI images. The general strategy of Fuzzy-C means clustering algorithms is to classify input data into groups based on algorithms that minimizes in-group variability. Although many improvements have been made to the algorithm (82–86), Fuzzy C-means analysis of breast DCE-MRI images has been primarily limited to segmenting the boundaries of a lesion (84).
Machine learning algorithms that use a supervised training approach include logistic regression, linear discriminant analysis, random forests, and support vector machines. All these approaches require “training” on a fully classified set of data (i.e., DCE-MRI with all lesions labeled as either malignant or benign). After a training set is analyzed, each of these approaches can then be applied to a second labeled set (independent of the training) to test sensitivity and specificity. Although they share a training approach, these methods have important differences in how they perform classification. Logistic regression (for two classes) and linear discriminant analysis (for more than two classes) are both linear methods. Support vector machines and random forests (for both two and multi-class scenarios) are more robust non-linear methods. All these supervised machine learning methods have been used to classify malignant tissue (87–92).
The third type approaches used in Tumor Detection and Classification include artificial neural networks and deep learning (i.e., neural networks with multiple hidden layers). Neural network architecture contains an input layer, at least one hidden layer, and an output layer. Deep neural networks (i.e, deep learning methods) perform both feature extraction and classification. In the training phase, deep learning methods “learn” what features best classify the input data (81, 93). Because it is well suited for image recognition, the most common neural network architecture for DCE-MRI is convolutional neural networks (CNNs). The convolutional layers of a CNN extract imaging features while maintaining spatial relationships between features. The discovered features are aggregated by pooling layers before the output layers generate a classification. In addition to being applicable to Tumor Detection Classification (94, 95), the flexibility of CNNs address a wide range of breast DCE-MRI related research issues including fibroglandular tissue segmentation (96, 97); breast segmentation (95, 98); and detection of lymph node metastasis (99). The disadvantage to deep learning is that it requires a large, annotated training data set. However, transfer learning, where a network is pretrained on a large imaging database, has shown promise for reducing the required size of training data sets (80, 95–97). In other applications, deep learning has shown to out-perform standard computer vision and experts (94, 100); however, in MRI, deep learning approaches have not yet out-performed experts (58).
Radiomics
Radiomics is a field of research that views medical images as quantitative data; this data represents the phenotypic, genotypic, and molecular characteristics of the tissue. The goal of radiomic studies is to associate the quantitative features extracted from images to both qualitative (e.g., clinical variables and outcomes) and quantitative information (e.g., biomarkers, gene expression, or other relevant -omic measurements). Radiomic approaches have many research applications including diagnostic tools, clinical decision support, and hypothesis testing and generation (56, 101, 102). For comprehensive summary of radiomics in breast cancer, many researchers review radiomics studies based on their research goals (19, 56, 101–106). To achieve these research goals, radiomics has employed wide range of computational approaches. The computational approaches can be categorized based on the three different parts of the radiomic analysis: features extraction, feature selection, and model building (56). The goal of features selection and model building are, respectively, to classify features and then build predictive models so that unlabelled images can be classified. The main difference are the variables that are classified: in addition to detecting benign vs. malignant tissue, radiomic studies classify continuous variables to define cancer subtype, diagnosis, and prognosis. Since features selection and model building primarily use machine learning methods similar to those described in the machine learning section of this section, we will limit our review of computational approaches to those used in feature extraction.
Feature extraction is the process of identifying features from an image. The features can be any quantifiable data produced from either the full image or a segmented region of interest within the image. The main categories include morphology-, histogram-, texture-, and transform-based features (56). This process is not unique to radiomics and can include some already discussed features such as contrast kinetic features (i.e., washout dynamics and pharmacokinetic parameters). However, it is typically distinct from deep learning in that the extracted features are selected manually and not discovered by an algorithm (57).
The types of features extracted fall into two categories: semantic and agnostic (101). Sematic feature extraction attempts to capture prognostically meaningful characteristics such as the BI-RADS defined features of a lesion (e.g., density, spiculation, and vascularity). These features, which are visually identifiable by radiologists, primarily fall into the morphology- and histogram-based categories. Agnostic features are not directly observable and have to be computed or extracted from the image. The features most unique to radiomics are the texture- and transform-based features. The gray-level co-occurrence matrix (GLCM) is a texture-based feature used to represent tumor heterogeneity. GLCM is calculated by determining the frequency of neighboring pixels with specific intensities (106, 107). This texture-based analysis captures the spatial distribution of intensity. GCLMs and their second-order features have had success identifying lesions (87, 90, 108), characterizing molecular and histopathologic subtype (109–113), and predicting prognosis and therapy response (114–118). Transform-based features are features that are extracted after applying a function to the image to generate a new image. Examples of transformations include Fourier, Wavelet, and Laplacian of Gaussian transforms. Instead of the spatial dimension, these transformations convert the image to investigate texture in an alternative dimension such as time or frequency. Although not as widely used as GLCM, transform-based approaches in breast cancer have also identified, characterized, and predicted response (119–123).
The wide-spread adoption of radiomics has been hindered by both the (1) large amount of data needed for training and (2) limitations of DCE-MRI (e.g., contrast type and administration protocols, magnetic strength, etc.) (19, 57, 104). Combining radiomics with deep learning has shown promise for improved accuracy. Transfer learning, in particular, may be a type of deep learning that can reduce the size of data sets and time required for training.
Automated Vessel Detection
Vessel detection represents a small subset of breast MRI research (Table 1). It has so far been used to either: (1) compare the gross characteristics of the vascular network between ipsilateral tumor bearing breast and the contralateral tumor free breast; or (2) improve the detection specificity of tumorous vs. benign lesions. In the context of breast cancer research, vessel detection in breast MRI first used manual detection of vessels by experts. Expert detection was typically performed on two-dimensional (2D) projections of the three-dimensional (3D) volumetric image. These 2D projections were also used for the first fully computational detection algorithms. Methods for full 3D computational detection of vessels in MRI were first reported in the late 1990's. However, 3D vessel detection in research has only recently been reported. The limited number of studies using 3D vessel detection are likely due to the considerable challenges of vessel detection in breast DCE-MRI.
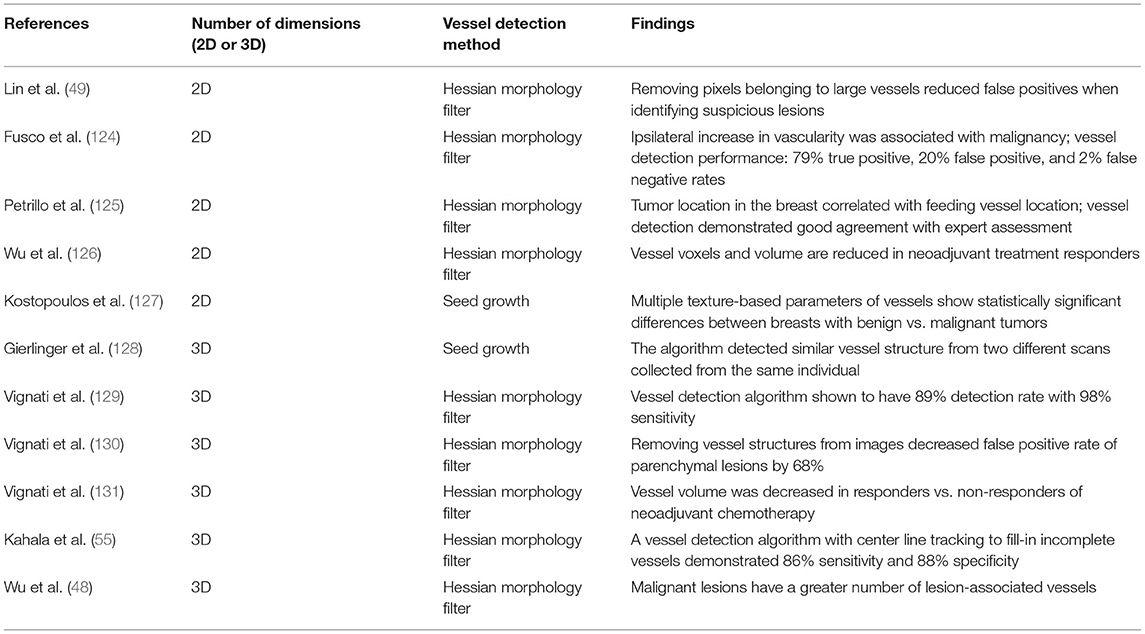
Table 1. Vessel detection studies in breast MRI.
Computational Challenges of Vessel Detection in DCE-MRI
It is difficult to automatically detect blood vessels in a non-specific imaging method such as DCE-MRI. DCE-MRI does not directly measure biology; therefore, the characteristics of the breast tissue increase the computational difficulty of measuring blood vessels. Initial efforts relied on experts who manually identified, measured, and scored blood vessels in DCE-MRI images. Since MRI provides no inherent method to distinguish vessels, detection is performed based on both their high enhancement in MRI due to rapid contrast uptake and their linear, network-like appearance (i.e., morphology) (49, 129, 132). Robust detection of wide range of vessels sizes requires image analysis at multiple scales (or resolutions). Some computational algorithms require reprocessing of an image at different scales, since a linear structure, if magnified sufficiently, no longer will appear linear. The number of and increment between scales depends on the (1) sensitivity of the algorithm and (2) MRI resolution. Finally, all contrast enhancement in DCE-MRI is reported as a numerical intensity; therefore, vessels can escape detection if: (1) nearby tissues exhibit rapid contrast uptake which occludes vessels; or (2) sufficiently small vessels do not contain enough contrast agent to achieve sufficient enhancement (49, 55, 133). Both these scenarios result in gaps appearing in the vascular network. These missing data require computational strategies to both detect and fill gaps when constructing a complete and accurate vascular network.
A robust computational algorithm must detect blood vessels with (1) similar accuracy between patients and (2) ideally, be independent of the MRI machine and protocol used. Differences in MRI machines can include different resolution (resulting from different magnetic field strengths), ranges of enhancement intensity, and software versions. Differences between breast DCE-MRI contrast administration protocols can result in contrast enhancement characteristics that cannot be directly compared. These include differences in the type of contrast agent, changes in contrast agent dose or administration rate, and different acquisition protocols or number of scans. Some of these factors can be minimized or corrected through analysis methods and image processing. For example, pharmacokinetic modeling avoids comparing intensities directly by instead comparing the model parameters after fitting. Intensity functions can be applied to the image before analysis to normalize the range of intensity within a DCE-MRI image (48). The intensity transfer function will enhance the low intensity tissue while suppressing the image background. Intensity thresholds can also be applied to remove background noise but generally require calibration within each image so that low intensity features are not lost (134).
Finally, a computational challenge that is specific to the breast is image co-registration. Although co-registration is not required for detecting vascularity in a single DCE-MRI image, co-registration is required to detect changes in vascularity (or other imaging feature) over time. Breast registration is difficult because the breast is highly deformable which results in a complex combination of both affine and non-rigid transformations (135–138). Additionally, many times the breast itself has changed over time either because of either natural biological cycles or malignant transformation. Together these make registration of serial breast MRI images exceptionally challenging.
Computational Blood Vessel Detection in Breast MRI to Date
2-Dimensional Algorithms
There are relatively few computational methods used to detect blood vessels. The majority of computational methods to detect blood vessels in breast MRI have been conducted in 2-dimensional (2D) projections of MRI images (Table 1). The most useful type of projection for detecting blood vessels is called the maximum intensity projection (MIP). This is an image that takes only the pixel with maximum intensity along one dimension of the 3D volume to create a 2D projection (111, 139). The resulting image highlights the features that exhibit the highest contrast enhancement. Since the contrast agent is transported through vessels to the tissue, the difference in enhancement between the pre-contrast scan and the first post-contrast scan (subtraction image) is typically used as the starting point to identify the vessels. In addition to highlighting the high intensity blood vessels in the image, the MIP image also reduces background noise which makes vessel detection easier.
Vessel detection strategies in MIP images primarily involve the use of a morphology-based filter (Hessian-filter) that selects linear or filamentary structures within the image (for a full discussion of Hessian-filter method see the 3D detection section). A number of studies have used MIP-based detection to analyze blood vessel characteristics and proximity to malignant breast tumors (49, 124–126).
A second computational method for blood vessel detection uses a technique called regional seed growth. A seed growth algorithm starts with seeded locations around an image and expands the seeds to contingent pixels (140). The seed eventually grows to include all similar adjacent pixels in the image. Although not specific to vessel detection, this method would appear well-suited to detecting the high intensity vascular network in breast DCE-MRI. However, in breast DCE-MRI images, the breast fibroglandular and adipose tissue (non-vascular tissue) can be similar in appearance to blood vessels. This similarity may explain why the regional seed growth is not frequently used to analyze breast MRI images. Kostopoulus et al. reported vessel detection for MIP images that used seed growing algorithm (127). This study (1) calculated quantitative metrics of both the vascular network and the non-vascular portion of the breast and (2) compared these characteristics in breast MRI images with malignant lesions vs. benign lesions vs. no lesions. Although this study compared a number of metrics calculated for the detected vessels, only the standard deviation of intensity in pixels identified as vessels showed a significant difference between malignant, benign, and normal breasts. They suggested this was due to variation in pixel intensity near the malignant tumors.
Although 2D vessel detection is less difficult conduct than in 3D, 2D detection has drawbacks. First, the 2D projection loses spatial information in the direction of the projection. Therefore, it is not possible to measure either the (1) distance between vessels and other imaging features (e.g., tumor) and (2) 3D characteristics of the vessels (i.e., curvature, torsion, tortuosity, and volume). Second, enhancing tissue can completely occlude or obscure vessels. Despite these limitations, MIPs remain a useful visualization tool and have been used as a guide to improve machine learning detection of malignant lesions (141).
3-Dimensional Algorithms
To date, there have only been a few studies that have reported computational detection of vessels in 3D breast MRI (48, 55, 130). One modification of a seed growth algorithm has recently been reported and applied to a single test case (128), but all other 3D vessel detection algorithms are based around calculating the Hessian to construct a morphologic filter (Table 1).
The Hessian was first applied to imaging data to detect vessels by Frangi et al. in 1998 (132). The Hessian approach uses a simple series of steps that ultimately select for different morphological structures present in the image (Figure 1A). First, the MRI is converted to a matrix of intensity values. Second, the Hessian is calculated on the intensity at each pixel or voxel in the image. The Hessian is a matrix of second derivatives which determines the change in the rate of change (acceleration) of the intensity in all directions. Third, eigenvalues are used to determine the directions in which the second derivatives of intensity are the largest. Finally, a morphologic filter is applied which allows selection of either sphere-, sheet-, or filament-like structures in the image. Conceptually, this filter identifies intensity features where the rate of change in intensity is small in one dimension and large and negative in all others (Figure 1B). Most methods additionally apply both preprocessing to normalize or filter intensities and postprocessing to remove small unconnected lines (noise) and fill in gaps in the vascular network.
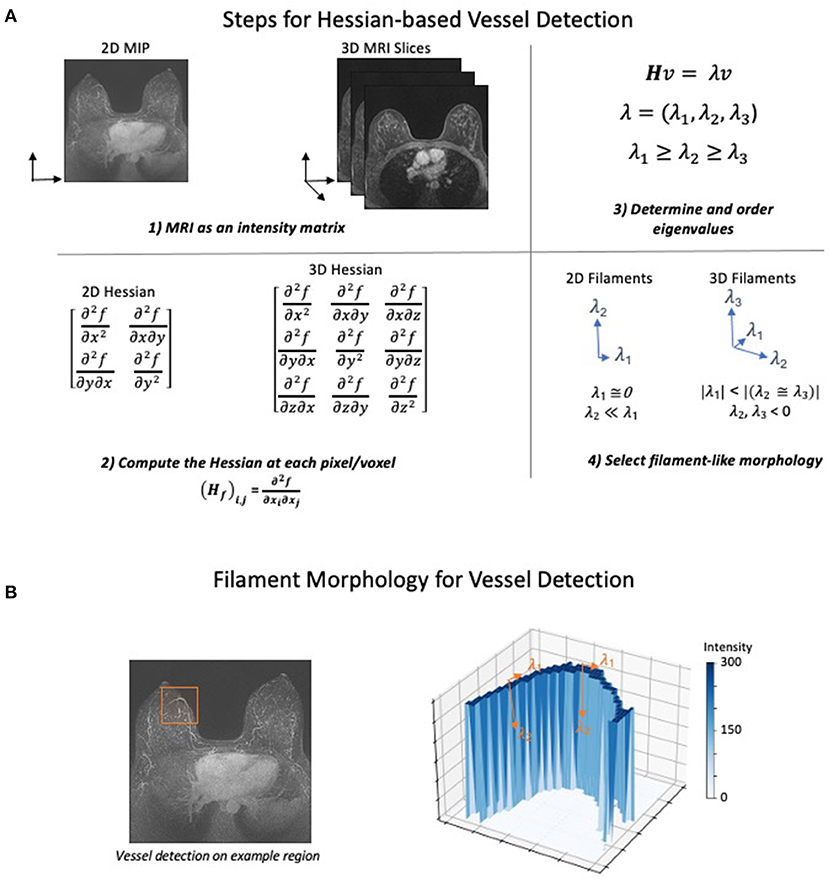
Figure 1. Hessian-based Algorithm for Vessel Detection. The general steps for detecting filaments using a Hessian matrix-based approach. (A) (1) The MRI is converted to either a 2- or 3-dimensional matrix where the intensity of each pixel is recorded as a numerical value. (2) Next, using the number of dimensions in the image, the Hessian matrix is computed at each point of the intensity matrix. The Hessian matrix contains the second derivative of intensity with respect to each spatial dimension. (3) Eigenvalues of the Hessian are computed and ordered based on their value to prepare for morphology selection. (4) Ordered eigenvalues can be filtered to determine whether a pixel has filament-like morphology. The selection for filaments in both 2D and 3D attempt to identify pixels where the second derivative of intensity is low, and the second derivative of all other dimensions is large and negative. Other morphologies such as spheres and sheets can also be identified using different selection criteria. (B) To demonstrate how the eigenvalue criteria identify filament-like structure, a vessel containing subregion of a MIP image was selected (left). The intensity in the selected 2D region was plotted as a surface after background normalization and an intensity transform function was applied (right). Forming a sharp ridge, the high values of intensity correspond to a vessel. The eigenvalues of two points are annotated to describe how the filament selection criteria identify vessel-like structures. Low rates of intensity change occur in the direction of the vessel (λ1) while large decreased in the rate of intensity change occur in the orthogonal direction (λ2).
The Hessian approach has been applied to breast DCE-MRI to detect vessels with some success. Vignati et al. detected the vascularity so that the vasculature could be removed thereby improving tumor detection (130). In a later study, Vignati et al. showed a difference in vessel count and vessel volume in responders vs. non-responders after neoadjuvant chemotherapy (131). Kahala et al. developed a vessel detection algorithm with a sensitivity and specificity of 86 and 88%, respectively (vs. vascular networks detected by radiologists) (55). The most comprehensive study was reported by Wu et al. (48). This study used detected vascular networks to compare vessel characteristics and pharmacokinetic parameters between benign and malignant tumors. The vessel count and two blood flow parameters (volume transfer coefficient and plasma volume fraction) from their models showed a significant increase in malignant tumors (relative to benign lesions). The observed differences were used to develop a multivariate logistic regression model to improve malignant tumor detection.
Although the application of the Hessian-based morphologic filter is straight-forward, the difficulties in this method arise when tuning the preprocessing, postprocessing, and morphology selection parameters. These parameters require careful tuning so that the algorithm is robust within a particular data set. Additionally, an algorithm developed and successful detecting vessels on one data set is not necessarily transferable to another data set with a different MRI machine or protocol. However, the advantages of 3D vessel detection outweigh the reduced difficulty of 2D. One of the primary disadvantages of 2D detection is the loss of spatial relationship in the direction of the projected dimension. For an example of how the projection of 3D structure on to 2-dimensions can cause unconnected fibroglandular tissue to appear more like vessels, see Figure 2.
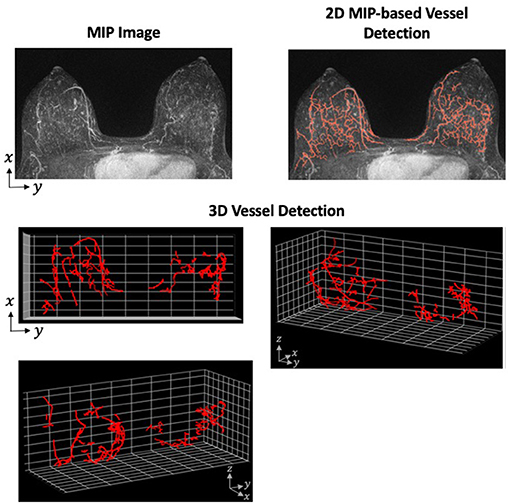
Figure 2. Vessel Detection Performed in 2- and 3-Dimensions. A Hessian-based approach was applied to both 2D MIP and full 3D MRI using a single sample from our data set. The vessel detection algorithm was based on a combination of methods described by Vignati et al. (130) and Wu et al. (48) with parameters determined using our data set. The MIP images shows many filamentary-like enhancing structures at the base of the breast. These structures were consequently detected as vessels in the 2D approach. However, the distance between these structures on the z-axis are not preserved when projected to 2-dimensions. When detecting vessels using the full 3D image, these enhancing structures prove to be unconnected and are, therefore, not detected as vessels.
Discussion
The promise of MRI is as a non-invasive, quantitative assessment of an individual's tumor. The goal is to be able to make personalized clinical decisions based on the information obtained from MRI. This is demonstrated by the large field of existing research which uses breast MRI to characterize breast cancer, identify cancer subtype, and predict both prognosis and treatment response. However, detection and assessment of the vessels is seldom performed in this large body of research. Despite increased vascularity causing the contrast dynamics that allow tumor detection, detection of the vascularity and subsequent analysis remains sparse (66–68). In comparison with MRI research in general, the scope of research involving vessel detection from breast MRI is less broad: it shows increased vascularity to be associated with tumors and invasion (142–146). Given the important role vessels play in nearly all aspects of breast tumors, the lack of research attention to detect vessels in MRI is likely due to the challenges presented and not a lack of interest.
Breast MRI presents significant challenges for any quantitative assessment. Although these challenges are not unique to vessel detection, many of these challenges (e.g., fibroglandular tissue, small size of vessels, etc.) make vessel detection particularly challenging. However, MRI is data-rich and has proved to contain information that can be translated into clinical diagnosis, prognosis, and therapeutic assessment. We think the information encoded in the vessels will further improve the clinical impact of breast MRI in the future.
Future Directions
Currently, blood vessel detection in DCE-MRI lags far behind other research and clinical application of other computational analysis. This is not only because of the challenges presented by MRI-based detection and breast tissue but also because the utility of vessel detection has largely been limited to aid lesion detection and characterization. In the short term, research involving vessel detection in MRI can progress on two fronts: improved reproducibility and more clinically relevant tumor characterization and prognosis. Longer term, more advanced vessel detection methods from computer science can both advance the field and lower the barrier for applying vessel detection algorithms to clinical research.
Although current vessel detection algorithms have shown relatively high sensitivity and specificity within a single data set, no vessel detection algorithm has been compared between data sets. To become more widely adopted for research and, eventually, clinical purposes, vessel detection algorithms must be shown to be robust and reproducible. This will require developed algorithms to be performed in and compared between studies that use different MRI machines and different MRI protocols. While challenging, a robust and reproducible blood vessel detection algorithm would provide important clinical and scientific information. The solution to many of these technical challenges fall within the domain of computer science and computer vision research which can be either developed or adopted to MRI-based research. The development of deep learning algorithms could also reduce the difficulty of implementing vessel detection in the research setting. Currently, vessel detection algorithms are both custom built for the dataset and time intensive. Previously reported vessel detection studies can provide a framework for developing new algorithms, but because of differences in imaging parameters and machines, parameter tuning and optimizing the algorithm are still required. These steps are challenging and must be repeated when applying any developed algorithm to new datasets. Designing vessel detection algorithms that are more transferable between datasets would reduce the barriers to research applications. Transfer learning paired with an optimization procedure that uses a small subset of images from a new dataset could be one solution to algorithms that are more widely and easily applicable.
Toward the application of vessel detection for research purposes in breast MRI, we are currently developing a vessel detection algorithm to associate vascular characteristics with aggressive tumor growth. Using a breast screening database that contains examples of both aggressive and slow-growing tumors, we plan to assess both global and tumor-associated vessel characteristics. To determine whether changes in the vasculature can be associated with aggressive tumors, we plan to compare those characteristics between the aggressive and slow-growing tumors. The characteristics will be derived from both hypothesis-driven quantitative metrics and machine-learning approaches to extract features from the vessel-segmented images. We view this as a radiomic-like approach to vessel analysis which has not previously been attempted. To build this capability, we have developed both 2D MIP-based and 3D vessel detection algorithms by adapting previous approaches to our data set (Figure 2). Using radiomic and deep learning approaches, our goal is to identify texture-based features of the vessels to help identify biologically aggressive from slow-growing tumors.
Author Contributions
DF wrote much of the manuscript. ED edited the manuscript. AM contributed ideas and edited the manuscript. VS contributed ideas and edited and revised the manuscript. All authors contributed to the article and approved the submitted version.
Funding
Funding sources include National Institutes of Health/National Cancer Institute (NIH/NCI) grants R01CA170851, P20CA24619, R01CA192914, and U01CA189283 (all to VS) and P30CA033572 and Welcome Leap. The funders had no role in study design, data collection and analysis, decision to publish, or preparation of the manuscript.
Conflict of Interest
The authors declare that the research was conducted in the absence of any commercial or financial relationships that could be construed as a potential conflict of interest.
Publisher's Note
All claims expressed in this article are solely those of the authors and do not necessarily represent those of their affiliated organizations, or those of the publisher, the editors and the reviewers. Any product that may be evaluated in this article, or claim that may be made by its manufacturer, is not guaranteed or endorsed by the publisher.
References
1. Tower H, Ruppert M, Britt K. The immune microenvironment of breast cancer progression. Cancers. (2019) 11:1375 doi: 10.3390/cancers11091375
2. Xiao Y, Cong M, Li J, He D, Wu Q, Tian P, et al. 1Cathepsin C promotes breast cancer lung metastasis by modulating neutrophil infiltration and neutrophil extracellular trap formation. Cancer Cell. (2021) 39:423–37.e7. doi: 10.1016/j.ccell.2020.12.012
3. Hanahan D, Weinberg RA. Hallmarks of cancer: the next generation. Cell. (2011) 144:646–74. doi: 10.1016/j.cell.2011.02.013
4. De Palma M, Biziato D, Petrova TV. Microenvironmental regulation of tumour angiogenesis. Nat Rev Cancer. (2017) 17:457–74. doi: 10.1038/nrc.2017.51
5. Sullivan CAW, Ghosh S, Ocal IT, Camp RL, Rimm DL, Chung GG. Microvessel area using automated image analysis is reproducible and is associated with prognosis in breast cancer. Hum Pathol. (2009) 40:156–65. doi: 10.1016/j.humpath.2008.07.005
6. Kraby MR, Opdahl S, Akslen LA, Bofin AM. Quantifying tumour vascularity in non-luminal breast cancers. J Clin Pathol. (2017) 70:766–74. doi: 10.1136/jclinpath-2016-204208
7. Toi M, Inada K, Suzuki H, Tominaga T. Tumor angiogenesis in breast cancer: its importance as a prognostic indicator and the association with vascular endothelial growth factor expression. Breast Cancer Res Treat. (1995) 36:193–204. doi: 10.1007/BF00666040
8. Uzzan B, Nicolas P, Cucherat M, Perret GY. Microvessel density as a prognostic factor in women with breast cancer: a systematic review of the literature and meta-analysis. Cancer Res. (2004) 64:2941–55. doi: 10.1158/0008-5472.CAN-03-1957
9. Kim SW, Park SS, Ahn SJ, Chung KW, Moon WK, Im JG, et al. Identification of angiogenesis in primary breast carcinoma according to the image analysis. Breast Cancer Res Treat. (2002) 69:253. doi: 10.1023/A:1016150213253
10. Horak ER, Klenk N, Leek R, LeJeune S, Smith K, Stuart N, et al. Angiogenesis, assessed by platelet/endothelial cell adhesion molecule antibodies, as indicator of node metastases and survival in breast cancer. Lancet. (1992) 340:1120–4. doi: 10.1016/0140-6736(92)93150-L
11. Weidner N, Semple JP, Welch WR, Folkman J. Tumor angiogenesis and metastasis — correlation in invasive breast carcinoma. N Engl J Med. (1991) 324:1–8. doi: 10.1056/NEJM199101033240101
12. Sener E, Sipal S, Gündogdu C. Comparison of microvessel density with prognostic factors in invasive ductal carcinomas of the breast. Turk Patoloji Derg. (2016) 32:164–70. doi: 10.5146/tjpath.2016.01366
13. Bujor IS, Cioca A, Ceau?u RA, Veaceslav F, Nica C, Cîmpean AM, et al. Evaluation of vascular proliferation in molecular subtypes of breast cancer. In Vivo. (2018) 32:79–83. doi: 10.21873/invivo.11207
14. Arnes JB, Stefansson IM, Straume O, Baak JP, Lønning PE, Foulkes WD, et al. Vascular proliferation is a prognostic factor in breast cancer. Breast Cancer Res Treat. (2012) 133:501–10. doi: 10.1007/s10549-011-1785-7
15. Sun C, Li J, Wang B, Shangguan J, Figini M, Shang N, et al. Tumor angiogenesis and bone metastasis - correlation in invasive breast carcinoma. J Immunol Methods. (2018) 452:46–52. doi: 10.1016/j.jim.2017.10.006
16. Krishnapriya S, Malipatil B, Surekha S, Sundersingh S, Sridevi V, Ananthi B, et al. Microvessel density (MVD) in locally advanced breast cancer. Asian Pac J Cancer Prev. (2019) 20:1537–45. doi: 10.31557/APJCP.2019.20.5.1537
17. Saltz J, Almeida J, Gao Y, Sharma A, Bremer E, DiPrima T, et al. Towards generation, management, and exploration of combined radiomics and pathomics datasets for cancer research. AMIA Jt Summits Transl Sci. (2017) 2017:85–94.
18. Mori N, Pineda FD, Tsuchiya K, Mugikura S, Takahashi S, Karczmar GS, et al. Fast temporal resolution dynamic contrast-enhanced MRI: histogram analysis versus visual analysis for differentiating benign and malignant breast lesions. Am J Roentgenol. (2018) 211:933–9. doi: 10.2214/AJR.17.19225
19. Conti A, Duggento A, Indovina I, Guerrisi M, Toschi N. Radiomics in breast cancer classification and prediction. Semin Cancer Biol. (2021) 72:238–50. doi: 10.1016/j.semcancer.2020.04.002
20. Leithner D, Wengert GJ, Helbich TH, Thakur S, Ochoa-Albiztegui RE, Morris EA, et al. Clinical role of breast MRI now and going forward. Clin Radiol. (2018) 73:700–14. doi: 10.1016/j.crad.2017.10.021
21. Mann RM, Kuhl CK, Moy L. Contrast-enhanced MRI for breast cancer screening. J Magn Reson Imag. (2019) 50:377. doi: 10.1002/jmri.26654
22. Woitek R, Spick C, Schernthaner M, Rudas M, Kapetas P, Bernathova M, et al. A simple classification system (the Tree flowchart) for breast MRI can reduce the number of unnecessary biopsies in MRI-only lesions. Eur Radiol 2017. (2017) 27:3799–809. doi: 10.1007/s00330-017-4755-6
23. Huang W, Fisher PR, Dulaimy K, Tudorica LA, O'Hea B, Button TM. Detection of breast malignancy: diagnostic MR protocol for improved specificity. Radiology. (2004) 232:585–91. doi: 10.1148/radiol.2322030547
24. Peters NH, Borel Rinkes IH, Zuithoff NP, Mali WP, Moons KG, Peeters PH. Meta-analysis of MR imaging in the diagnosis of breast lesions. Radiology. (2008) 246:116–24. doi: 10.1148/radiol.2461061298
25. Georgiou L, Sharma N, Broadbent DA, Wilson DJ, Dall BJ, Gangi A, et al. Estimating breast tumor blood flow during neoadjuvant chemotherapy using interleaved high temporal and high spatial resolution MRI. Magn Reson Med. (2018) 79:317–26. doi: 10.1002/mrm.26684
26. Chen W, Giger ML, Newstead GM, Bick U, Jansen SA, Li H, et al. Computerized assessment of breast lesion malignancy using DCE-MRI. Robustness study on two independent clinical datasets from two manufacturers. Acad Radiol. (2010) 17:822–9. doi: 10.1016/j.acra.2010.03.007
27. Onishi N, Kataoka M, Kanao S, Sagawa H, Iima M, Nickel MD, et al. Ultrafast dynamic contrast-enhanced mri of the breast using compressed sensing: breast cancer diagnosis based on separate visualization of breast arteries and veins. J Magn Reson Imaging. (2018) 47:97–104. doi: 10.1002/jmri.25747
28. Sorace AG, Partridge SC, Li X, Virostko J, Barnes SL, Hippe DS. Distinguishing benign and malignant breast tumors: preliminary comparison of kinetic modeling approaches using multi-institutional dynamic contrast-enhanced MRI data from the international Breast MR Consortium 6883 trial. J Med Imag. (2018) 5:011019. doi: 10.1117/1.JMI.5.1.011019
29. El Khouli RH, Macura KJ, Kamel IR, Jacobs MA, Bluemke DA. 3-T dynamic contrast-enhanced MRI of the breast: pharmacokinetic parameters versus conventional kinetic curve analysis. Am J Roentgenol. (2011) 197:1498–505. doi: 10.2214/AJR.10.4665
30. Xiao J, Rahbar H, Hippe DS, Rendi MH, Parker EU, Shekar N, et al. Dynamic contrast-enhanced breast MRI features correlate with invasive breast cancer angiogenesis. npj Breast Cancer. (2021) 7:42. doi: 10.1038/s41523-021-00247-3
31. Yankeelov TE, Lepage M, Chakravarthy A, Broome EE, Niermann KJ, Kelley MC, et al. Integration of quantitative DCE-MRI and ADC mapping to monitor treatment response in human breast cancer: initial results. Magn Reson Imag. (2007) 25:1–13. doi: 10.1016/j.mri.2006.09.006
32. An YS, Kang DK, Jung YS, Han S, Kim TH. Tumor metabolism and perfusion ratio assessed by 18F-FDG PET/CT and DCE-MRI in breast cancer patients: correlation with tumor subtype and histologic prognostic factors. Eur J Radiol. (2015) 84:1365–70. doi: 10.1016/j.ejrad.2015.03.026
33. Carmona-Bozo JC, Manavaki R, Woitek R, Torheim T, Baxter GC, Caracò C, et al. Hypoxia and perfusion in breast cancer: simultaneous assessment using PET/MR imaging. Eur Radiol. (2021) 31:333–44. doi: 10.1007/s00330-020-07067-2
34. Ryu JK, Rhee SJ, Song JY, Cho SH, Jahng GH. Characteristics of quantitative perfusion parameters on dynamic contrast-enhanced MRI in mammographically occult breast cancer. J Appl Clin Med Phys. (2016) 17:377–90. doi: 10.1120/jacmp.v17i5.6091
35. Jiang L, Weatherall PT, McColl RW, Tripathy D, Mason RP. Blood oxygenation level-dependent (BOLD) contrast magnetic resonance imaging (MRI) for prediction of breast cancer chemotherapy response: a pilot study. J Magn Reson Imag. (2013) 37:1083–92. doi: 10.1002/jmri.23891
36. Li SP, Padhani AR, Taylor NJ, Ah-See MW, Beresford MJ, Stirling JJ, et al. Imaging tumor hypoxia with BOLD MRI in primary breast cancer. J Clin Oncol. (2010) 28:e13526. doi: 10.1200/jco.2010.28.15_suppl.e13526
37. Inglese M, Cavaliere C, Monti S, Forte E, Incoronato M, Nicolai E, et al. A multi-parametric PET/MRI study of breast cancer: evaluation of DCE-MRI pharmacokinetic models and correlation with diffusion and functional parameters. NMR Biomed. (2019) 32:e4026. doi: 10.1002/nbm.4026
38. Kang SR, Kim HW, Kim HS. Evaluating the relationship between dynamic contrast-enhanced MRI (DCE-MRI) parameters and pathological characteristics in breast cancer. J Magn Reson Imag. (2020) 52:1360–73. doi: 10.1002/jmri.27241
39. Jansen SA, Fan X, Medved M, Abe H, Shimauchi A, Yang C, et al. Characterizing early contrast uptake of ductal carcinoma in situ with high temporal resolution dynamic contrast-enhanced MRI of the breast: a pilot study. Phys Med Biol. (2010) 55:N473. doi: 10.1088/0031-9155/55/19/N02
40. Li L, Wang K, Sun X, Wang K, Sun Y, Zhang G, et al. Parameters of dynamic contrast-enhanced mri as imaging markers for angiogenesis and proliferation in human breast cancer. Med Sci Monit. (2015) 21:376–82. doi: 10.12659/MSM.892534
41. Yee LD, Young DC, Rosol TJ, VanBuskirk AM, Clinton SK. Dietary (n-3) polyunsaturated fatty acids inhibit HER-2/neu-induced breast cancer in mice independently of the PPARγ ligand rosiglitazone. J Nutr. (2005) 135:983–8. doi: 10.1093/jn/135.5.983
42. Leach MO. Application of magnetic resonance imaging to angiogenesis in breast cancer. Breast Cancer Res. (2001) 3:22–7. doi: 10.1186/bcr266
43. Liu M, Mao N, Ma H, Dong J, Zhang K, Che K, et al. Pharmacokinetic parameters and radiomics model based on dynamic contrast enhanced MRI for the preoperative prediction of sentinel lymph node metastasis in breast cancer. Cancer Imag. (2020) 20:1–8. doi: 10.1186/s40644-020-00342-x
44. Karimian A, Ji NT, Song H, Sgouros G. Mathematical modeling of preclinical alpha-emitter radiopharmaceutical therapy. Cancer Res. (2020) 80:868–76. doi: 10.1158/0008-5472.CAN-19-2553
45. Ladd ME, Bachert P, Meyerspeer M, Moser E, Nagel AM, Norris DG, et al. Pros and cons of ultra-high-field MRI/MRS for human application. Prog Nucl Magn Reson Spectrosc. (2018) 109:1–50. doi: 10.1016/j.pnmrs.2018.06.001
46. Rahbar H, Partridge SC, Demartini WB, Thursten B, Lehman CD. Clinical and technical considerations for high quality breast MRI at 3 Tesla. J Magn Reson Imag. (2013) 37:778–90. doi: 10.1002/jmri.23834
47. Rayner SG, Zheng Y. Engineered microvessels for the study of human disease. J Biomech Eng. (2016) 138:1108011. doi: 10.1115/1.4034428
48. Wu C, Pineda F, Hormuth DA, Karczmar GS, Yankeelov TE. Quantitative analysis of vascular properties derived from ultrafast DCE-MRI to discriminate malignant and benign breast tumors. Magn Reson Med. (2019) 81:2147–60. doi: 10.1002/mrm.27529
49. Lin M, Chen JH, Nie K, Chang D, Nalcioglu O, Su MY. Algorithm-based method for detection of blood vessels in breast MRI for development of computer-aided diagnosis. J Magn Reson Imag. (2009) 30:817–24. doi: 10.1002/jmri.21915
50. Sohn B, Lim J seok, Kim H, Myoung S, Choi J, Kim NK, et al. MRI-detected extramural vascular invasion is an independent prognostic factor for synchronous metastasis in patients with rectal cancer. Eur Radiol. (2015) 25:1347–55. doi: 10.1007/s00330-014-3527-9
51. Huang X, Zaheer S, Abdalbari A, Looi T, Ren J, Drake J. Extraction of liver vessel centerlines under guidance of patient-specific models. In: Proceedings of the Annual International Conference of the IEEE Engineering in Medicine and Biology Society, EMBS. San Diego, CA. p. 2347–50.
52. Shang Q, Clements L, Galloway RL, Chapman WC, Dawant BM. Adaptive directional region growing segmentation of the hepatic vasculature. Med Imag. (2008) 6914:69141F. doi: 10.1117/12.769565
53. Qian X, Brennan MP, Dione DP, Dobrucki WL, Jackowski MP, Breuer CK, et al. A non-parametric vessel detection method for complex vascular structures. Med Image Anal. (2009) 13:49–61. doi: 10.1016/j.media.2008.05.005
54. Mossa-Basha M, Watase H, Sun J, Shibata DK, Hippe DS, Balu N, et al. Inter-rater and scan-rescan reproducibility of the detection of intracranial atherosclerosis on contrast-enhanced 3D vessel wall MRI. Br J Radiol. (2019) 92:20180973. doi: 10.1259/bjr.20180973
55. Kahala G, Sklair M, Spitzer H. Multi-scale blood vessel detection and segmentation in breast MRIs. J Med Biol Eng. (2019) 39:424–30. doi: 10.1007/s40846-018-0418-6
56. Lee SH, Park H, Ko ES. Radiomics in breast imaging from techniques to clinical applications: a review. Korean J Radiol. (2020) 21:779–92. doi: 10.3348/kjr.2019.0855
57. Meyer-Base A, Morra L, Tahmassebi A, Lobbes M, Meyer-Base U, Pinker K. AI-enhanced diagnosis of challenging lesions in breast mri: a methodology and application primer. J Magn Reson Imag. (2020) 54:686–702. doi: 10.1002/jmri.27332
58. Martel AL. CAD and Machine Learning for Breast MRI. In Breast MRI for High-Risk Screening. Springer International Publishing. p. 97–111. doi: 10.1007/978-3-030-41207-4_7
59. Jayender J, Vosburgh KG, Gombos E, Ashraf A, Kontos D, Gavenonis SC, et al. Automatic segmentation of breast carcinomas from DCE-MRI using a statistical learning algorithm. In: Proceedings - International Symposium on Biomedical Imaging (NIH Public Access). p. 122–5. doi: 10.1109/ISBI.2012.6235499
60. Kuhl CK, Mielcareck P, Klaschik S, Leutner C, Wardelmann E, Gieseke J, et al. Dynamic breast MR imaging: are signal intensity time course data useful for differential diagnosis of enhancing lesions? Radiology. (1999) 211:101–10. doi: 10.1148/radiology.211.1.r99ap38101
61. Chen W, Giger ML, Bick U, Newstead GM. Automatic identification and classification of characteristic kinetic curves of breast lesions on DCE-MRI. Med Phys. (2006) 33:2878–87. doi: 10.1118/1.2210568
62. El Khouli RH, Macura KJ, Jacobs MA, Khalil TH, Kamel IR, Dwyer A, et al. Dynamic contrast-enhanced MRI of the breast: quantitative method for kinetic curve type assessment women's imaging original research women's imaging assessment of kinetic curve type on breast DCE-MRI. Am J Roentgenol. (2009) 193:W295. doi: 10.2214/AJR.09.2483
63. Bluemke DA, Gatsonis CA, Chen MH, DeAngelis GA, DeBruhl N, Harms S, et al. Magnetic resonance imaging of the breast prior to biopsy. J Am Med Assoc. (2004) 292:2735–42. doi: 10.1001/jama.292.22.2735
64. Kinkel K, Helbich TH, Esserman LJ, Barclay J, Schwerin EH, Sickles EA, et al. Dynamic high-spatial-resolution MR imaging of suspicious breast lesions: diagnostic criteria and interobserver variability. Am J Roentgenol. (2000) 175:35–43. doi: 10.2214/ajr.175.1.1750035
65. Orel SG. Differentiating benign from malignant enhancing lesions identified at MR imaging of the breast: are time-signal intensity curves an accurate predictor? Radiology. (1999) 211:5–7. doi: 10.1148/radiology.211.1.r99ap395
66. Huang J, Hahn T, Hoisington L, Schafer S, Zong X, Berger K. Improving suspicious breast lesion characterization using semi-automatic lesion fractional volume washout kinetic analysis. Med Phys. (2011) 38:5998–6009. doi: 10.1118/1.3651635
67. Su MY, Cheung YC, Fruehauf JP, Yu H, Nalcioglu O, Mechetner E, et al. Correlation of dynamic contrast enhancement MRI parameters with microvessel density and VEGF for assessment of angiogenesis in breast cancer. J Magn Reson Imag. (2003) 18:467–77. doi: 10.1002/jmri.10380
68. Frouge C, Guinebretiere JM, Contesso G, Paola R Di, Bléry M. Correlation between contrast enhancement in dynamic magnetic resonance imaging of the breast and tumor angiogenesis. Invest Radiol. (1994) 29:1043–9. doi: 10.1097/00004424-199412000-00006
69. Wang C-H. Review of treatment assessment using DCE-MRI in breast cancer radiation therapy. World J Methodol. (2014) 4:46. doi: 10.5662/wjm.v4.i2.46
70. Tofts PS. Modeling tracer kinetics in dynamic Gd-DTPA MR imaging. J Magn Reson Imag. (1997) 7:91–101. doi: 10.1002/jmri.1880070113
71. Chikui T, Obara M, Simonetti AW, Ohga M, Koga S, Kawano S, et al. The principal of dynamic contrast enhanced MRI, the method of pharmacokinetic analysis, and its application in the head and neck region. Int J Dent. (2012) 2012:480659. doi: 10.1155/2012/480659
72. Tofts PS, Brix G, Buckley DL, Evelhoch JL, Henderson E, Knopp M V, et al. Estimating kinetic parameters from dynamic contrast-enhanced T 1-weighted MRI of a diffusable tracer: standardized quantities and symbols. J Magn Reson. Imaging. (1999) 10:223–32. doi: 10.1002/(SICI)1522-2586(199909)10:3<223::AID-JMRI2>3.0.CO;2-S
73. Litjens GJS, Heisen M, Buurman J, Ter HaarRomeny BM. Pharmacokinetic models in clinical practice: What model to use for DCE-MRI of the breast? In: 2010 7th IEEE International Symposium on Biomedical Imaging: From Nano to Macro, ISBI 2010 – Proceedings. Rotterdam, p. 185–8.
74. Sourbron SP, Buckley DL. On the scope and interpretation of the Tofts models for DCE-MRI. Magn Reson Med. (2011) 66:735–45. doi: 10.1002/mrm.22861
75. Tofts PS, Parker GJM. DCE-MRI: Acquisition and analysis techniques. In: Clinical Perfusion MRI: Techniques and Applications. Cambridge University Press. p. 58–74. doi: 10.1017/CBO9781139004053.006
76. Chang YC, Huang YH, Huang CS, Chang PK, Chen JH, Chang RF. Classification of breast mass lesions using model-based analysis of the characteristic kinetic curve derived from fuzzy c-means clustering. Magn Reson Imaging. (2012) 30:312–22. doi: 10.1016/j.mri.2011.12.002
77. Jansen SA, Shimauchi A, Zak L, Fan X, Wood AM, Karczmar GS, et al. Kinetic curves of malignant lesions are not consistent across MRI systems: need for improved standardization of breast dynamic contrast-enhanced MRI acquisition. Am J Roentgenol. (2009) 193:832–9. doi: 10.2214/AJR.08.2025
78. Jayender J, Chikarmane S, Jolesz FA, Gombos E. Automatic segmentation of invasive breast carcinomas from dynamic contrast-enhanced MRI using time series analysis. J Magn Reson Imaging. (2014) 40:467–75. doi: 10.1002/jmri.24394
79. Codari M, Schiaffino S, Sardanelli F, Trimboli RM. Artificial intelligence for breast MRI in 2008-2018: A systematic mapping review. Am J Roentgenol. (2019) 212:280–92. doi: 10.2214/AJR.18.20389
80. Chan HP, Samala RK, Hadjiiski LM. CAD and AI for breast cancer-recent development and challenges. Br J Radiol. (2020) 93:20190580. doi: 10.1259/bjr.20190580
81. Sheth D, Giger ML. Artificial intelligence in the interpretation of breast cancer on MRI. J Magn Reson Imag. (2020) 51:1310–24. doi: 10.1002/jmri.26878
82. Adhikari SK, Sing JK, Basu DK, Nasipuri M. A spatial fuzzy C-means algorithm with application to MRI image segmentation. In: ICAPR 2015 - 2015 8th International Conference on Advances in Pattern Recognition. Kolkata: Institute of Electrical and Electronics Engineers Inc.
83. Sathya A, Senthil S, Samuel A. Segmentation of breast MRI using effective Fuzzy C-Means method based on support vector machine. In Proceedings of the 2012 World Congress on Information and Communication Technologies, WICT. Trivandrum (2012). p. 67–72.
84. Chen W, Giger ML, Bick U. A fuzzy c-means (FCM)-based approach for computerized segmentation of breast lesions in dynamic contrast-enhanced MR images. Acad Radiol. (2006) 13:63–72. doi: 10.1016/j.acra.2005.08.035
85. Wu S, Weinstein SP, Conant EF, Kontos D. Automated fibroglandular tissue segmentation and volumetric density estimation in breast MRI using an atlas-aided fuzzy C-means method. Med Phys. (2013) 40:122302. doi: 10.1118/1.4829496
86. Kannan SR, Sathya A, Ramathilagam S. Effective fuzzy clustering techniques for segmentation of breast MRI. Soft Comput. (2011) 15:483–91. doi: 10.1007/s00500-009-0528-8
87. Gibbs P, Turnbull LW. Textural analysis of contrast-enhanced MR images of the breast. Magn Reson Med. (2003) 50:92–8. doi: 10.1002/mrm.10496
88. Huang YH, Chang YC, Huang CS, Chen JH, Chang RF. Computerized breast mass detection using multi-scale hessian-based analysis for dynamic contrast-enhanced MRI. J Digit Imag. (2014) 27:649–60. doi: 10.1007/s10278-014-9681-4
89. Levman J, Leung T, Causer P, Plewes D, Martel AL. Classification of dynamic contrast-enhanced magnetic resonance breast lesions by support vector machines. IEEE Trans Med Imag. (2008) 27:688–96. doi: 10.1109/TMI.2008.916959
90. Nagarajan MB, Huber MB, Schlossbauer T, Leinsinger G, Krol A, Wismüller A. Classification of small lesions in breast MRI: evaluating the role of dynamically extracted texture features through feature selection. J Med Biol Eng. (2013) 33:59–68. doi: 10.5405/jmbe.1183
91. Lee SH, Kim JH, Cho N, Park JS, Yang Z, Jung YS, et al. Multilevel analysis of spatiotemporal association features for differentiation of tumor enhancement patterns in breast DCE-MRI. Med Phys. (2010) 37:3940–56. doi: 10.1118/1.3446799
92. McLaren CE, Chen WP, Nie K, Su MY. Prediction of malignant breast lesions from MRI features. A comparison of artificial neural network and logistic regression techniques. Acad Radiol. (2009) 16:842–51. doi: 10.1016/j.acra.2009.01.029
93. Chartrand G, Cheng PM, Vorontsov E, Drozdzal M, Turcotte S, Pal CJ, et al. Deep learning: a primer for radiologists. Radiographics. (2017) 37:2113–31. doi: 10.1148/rg.2017170077
94. Herent P, Schmauch B, Jehanno P, Dehaene O, Saillard C, Balleyguier C, et al. Detection and characterization of MRI breast lesions using deep learning. Diagn Interv Imag. (2019) 100:219–25. doi: 10.1016/j.diii.2019.02.008
95. Jiao H, Jiang X, Pang Z, Lin X, Huang Y, Li L. Deep convolutional neural networks-based automatic breast segmentation and mass detection in DCE-MRI. Comput Math Methods Med. (2020) 2020:2413706. doi: 10.1155/2020/2413706
96. Dalmiş MU, Litjens G, Holland K, Setio A, Mann R, Karssemeijer N, et al. Using deep learning to segment breast and fibroglandular tissue in MRI volumes: Med Phys. (2017) 44:533–46. doi: 10.1002/mp.12079
97. Ha R, Chang P, Mema E, Mutasa S, Karcich J, Wynn RT, et al. Fully automated convolutional neural network method for quantification of breast MRI fibroglandular tissue and background parenchymal enhancement. J Digit Imag. (2019) 32:141–7. doi: 10.1007/s10278-018-0114-7
98. Piantadosi G, Sansone M, Fusco R, Sansone C. Multi-planar 3D breast segmentation in MRI via deep convolutional neural networks. Artif Intell Med. (2020) 103:101781. doi: 10.1016/j.artmed.2019.101781
99. Ren T, Cattell R, Duanmu H, Huang P, Li H, Vanguri R, et al. Convolutional neural network detection of axillary lymph node metastasis using standard clinical breast MRI. Clin Breast Cancer. (2020) 20:e301–8. doi: 10.1016/j.clbc.2019.11.009
100. Russakovsky O, Deng J, Su H, Krause J, Satheesh S, Ma S, et al. Image net large scale visual recognition challenge. Int J Comput Vis. (2015) 115:211–52. doi: 10.1007/s11263-015-0816-y
101. Gillies RJ, Kinahan PE, Hricak H. Radiomics: images are more than pictures, they are data. Radiology. (2016) 278:563–77. doi: 10.1148/radiol.2015151169
102. Crivelli P, Ledda RE, Parascandolo N, Fara A, Soro D, Conti M. A new challenge for radiologists: radiomics in breast cancer. Biomed Res Int. (2018) 2018:6120703. doi: 10.1155/2018/6120703
103. Valdora F, Houssami N, Rossi F, Calabrese M, Tagliafico AS. Rapid review: radiomics and breast cancer. Breast Cancer Res Treat. (2018) 169:217–29. doi: 10.1007/s10549-018-4675-4
104. Ibrahim A, Primakov S, Beuque M, Woodruff HC, Halilaj I, Wu G, et al. Radiomics for precision medicine: current challenges, future prospects, and the proposal of a new framework. Methods. (2021) 188:20–9. doi: 10.1016/j.ymeth.2020.05.022
105. Tagliafico AS, Piana M, Schenone D, Lai R, Massone AM, Houssami N. Overview of radiomics in breast cancer diagnosis and prognostication. Breast. (2020) 49:74–80. doi: 10.1016/j.breast.2019.10.018
106. Chitalia RD, Kontos D. Role of texture analysis in breast MRI as a cancer biomarker: a review. J Magn Reson Imaging. (2019) 49:927–38. doi: 10.1002/jmri.26556
107. Haralick RM, Dinstein I, Shanmugam K. Textural Features for Image Classification. IEEE Trans Syst Man Cybern. (1973). SMC-3:610–21. doi: 10.1109/TSMC.1973.4309314
108. Nie K, Chen JH, Yu HJ, Chu Y, Nalcioglu O, Su MY. Quantitative analysis of lesion morphology and texture features for diagnostic prediction in breast MRI. Acad Radiol. (2008) 15:1513–25. doi: 10.1016/j.acra.2008.06.005
109. Holli K, Lääperi AL, Harrison L, Luukkaala T, Toivonen T, Ryymin P, et al. Characterization of breast cancer types by texture analysis of magnetic resonance images. Acad Radiol. (2010) 17:135–41. doi: 10.1016/j.acra.2009.08.012
110. Wang J, Kato F, Oyama-Manabe N, Li R, Cui Y, Tha KK, et al. Identifying triple-negative breast cancer using background parenchymal enhancement heterogeneity on dynamic contrast-enhanced MRI: a pilot radiomics study. PLoS One. (2015) 10:e0143308. doi: 10.1371/journal.pone.0143308
111. Waugh SA, Purdie CA, Jordan LB, Vinnicombe S, Lerski RA, Martin P, et al. Magnetic resonance imaging texture analysis classification of primary breast cancer. Eur Radiol. (2016) 26:322–30. doi: 10.1007/s00330-015-3845-6
112. Holli-Helenius K, Salminen A, Rinta-Kiikka I, Koskivuo I, Brück N, Boström P, et al. MRI texture analysis in differentiating luminal A and luminal B breast cancer molecular subtypes - a feasibility study. BMC Med Imag. (2017) 17:1–9. doi: 10.1186/s12880-017-0239-z
113. Wu J, Sun X, Wang J, Cui Y, Kato F, Shirato H, et al. Identifying relations between imaging phenotypes and molecular subtypes of breast cancer: model discovery and external validation. J Magn Reson Imag. (2017) 46:1017–27. doi: 10.1002/jmri.25661
114. Park H, Lim Y, Ko ES, Cho HH, Lee JE, Han BK, et al. Radiomics signature on magnetic resonance imaging: association with disease-free survival in patients with invasive breast cancer. Clin Cancer Res. (2018) 24:4705–14. doi: 10.1158/1078-0432.CCR-17-3783
115. Teruel JR, Heldahl MG, Goa PE, Pickles M, Lundgren S, Bathen TF, et al. Dynamic contrast-enhanced MRI texture analysis for pretreatment prediction of clinical and pathological response to neoadjuvant chemotherapy in patients with locally advanced breast cancer. NMR Biomed. (2014) 27:887–96. doi: 10.1002/nbm.3132
116. Golden DI, Lipson JA, Telli ML, Ford JM, Rubin DL. Dynamic contrast-enhanced MRI-based biomarkers of therapeutic response in triple-negative breast cancer. J Am Med Informatics Assoc. (2013) 20:1059–66. doi: 10.1136/amiajnl-2012-001460
117. Thibault G, Tudorica A, Afzal A, Chui SYC, Naik A, Troxell ML, et al. DCE-MRI texture features for early prediction of breast cancer therapy response. Tomogr. (2017) 3:23–32. doi: 10.18383/j.tom.2016.00241
118. Michoux N, Van den Broeck S, Lacoste L, Fellah L, Galant C, Berlière M, et al. Texture analysis on MR images helps predicting non-response to NAC in breast cancer. BMC Cancer. (2015) 15:1–3. doi: 10.1186/s12885-015-1563-8
119. Zhou J, Lu J, Gao C, Zeng J, Zhou C, Lai X, et al. Predicting the response to neoadjuvant chemotherapy for breast cancer: wavelet transforming radiomics in MRI. BMC Cancer. (2020) 20:1–10. doi: 10.1186/s12885-020-6523-2
120. Ayatollahi F, Shokouhi SB, Teuwen J. Differentiating benign and malignant mass and non-mass lesions in breast DCE-MRI using normalized frequency-based features. Int J Comput Assist Radiol Surg. (2020) 15:297–307. doi: 10.1007/s11548-019-02103-z
121. Yuan G, Liu Y, Huang W, Hu B. Differentiating grade in breast invasive ductal carcinoma using texture analysis of MRI. Comput Math Methods Med. (2020) 2020:6913418. doi: 10.1155/2020/6913418
122. Akhbardeh A, Jacobs MA. Comparative analysis of nonlinear dimensionality reduction techniques for breast MRI segmentation. Med Physics. 39:2275–89. doi: 10.1118/1.3682173
123. Zheng Y, Baloch S, Englander S, Schnall MD, Shen D. Segmentation and classification of breast tumor using dynamic contrast-enhanced MR images. Lecture Notes Comp Sci. (2007) 4792:393–401. doi: 10.1007/978-3-540-75759-7_48
124. Fusco R, Sansone M, Filice S, Petrillo A. Breast contrast-enhanced MR imaging: semiautomatic detection of vascular map. Breast Cancer. (2016) 23:266–72. doi: 10.1007/s12282-014-0565-8
125. Petrillo A, Fusco R, Filice S, Granata V, Catalano O, Vallone P, et al. Breast contrast enhanced MR imaging: Semi-automatic detection of vascular map and predominant feeding vessel. PLoS ONE. (2016) 11:161691. doi: 10.1371/journal.pone.0161691
126. Wu LA, Chang RF, Huang CS, Lu YS, Chen HH, Chen JY, et al. Evaluation of the treatment response to neoadjuvant chemotherapy in locally advanced breast cancer using combined magnetic resonance vascular maps and apparent diffusion coefficient. J Magn Reson Imag. (2015) 42:1407–20. doi: 10.1002/jmri.24915
127. Kostopoulos SA, Vassiou KG, Lavdas EN, Cavouras DA, Kalatzis IK, Asvestas PA, et al., Glotsos DT. Computer-based automated estimation of breast vascularity and correlation with breast cancer in DCE-MRI images. Magn Reson Imag. (2017) 35:39–45. doi: 10.1016/j.mri.2016.08.007
128. Gierlinger M, Brandner D, Zagar BG. Vessel extraction from breast MRI. Optical Characteriz Mat. (2021) 17:119. doi: 10.5445/KSP/1000128686]
129. Vignati A, Giannini V, De Luca M, Morra L, Persano D, Carbonaro LA, et al. Performance of a fully automatic lesion detection system for breast DCE-MRI. J Magn Reson Imaging. (2011) 34:1341–51. doi: 10.1002/jmri.22680
130. Vignati A, Giannini V, Bert A, Borrelli P, De Luca M, Martincich L, et al. A fully automatic multiscale 3-dimensional hessian-based algorithm for vessel detection in breast DCE-MRI. Invest Radiol. (2012) 47:705–10. doi: 10.1097/RLI.0b013e31826dc3a4
131. Vignati A, Giannini V, Carbonaro LA, Bertotto I, Martincich L, Sardanelli F, et al. A new algorithm for automatic vascular mapping of DCE-MRI of the breast: clinical application of a potential new biomarker. Comput Methods Prog Biomed. (2014) 117:482–8. doi: 10.1016/j.cmpb.2014.09.003
132. Frangi AF, Niessen WJ, Vincken KL, Viergever MA. Multiscale vessel enhancement filtering. Lecture Notes Comp Sci. (2006) 1496:130–7. doi: 10.1007/BFb0056195
133. Deschamps F, Solomon SB, Thornton RH, Rao P, Hakime A, Kuoch V, et al. Computed analysis of three-dimensional cone-beam computed tomography angiography for determination of tumor-feeding vessels during chemoembolization of liver tumor: a pilot study. Cardiovasc Intervent Radiol. (2010) 33:1235–42. doi: 10.1007/s00270-010-9846-6
134. Doran SJ, Hipwell JH, Denholm R, Eiben B, Busana M, Hawkes DJ, et al. Breast MRI segmentation for density estimation: Do different methods give the same results and how much do differences matter? Med Phys. (2017) 44:4573–92. doi: 10.1002/mp.12320
135. Rueckert D. Nonrigid registration using free-form deformations: application to breast mr images. IEEE Trans Med Imag. (1999) 18:712–21. doi: 10.1109/42.796284
136. Mehrabian H, Richmond L, Lu Y, Martel AL. Deformable registration for longitudinal breast MRI screening. J Digit Imag. (2018) 31:718–26. doi: 10.1007/s10278-018-0063-1
137. Jahani N, Cohen E, Hsieh MK, Weinstein SP, Pantalone L, Hylton N, et al. Prediction of treatment response to neoadjuvant chemotherapy for breast cancer via early changes in tumor heterogeneity captured by DCE-MRI registration. Sci Rep. (2019) 9:1–12. doi: 10.1038/s41598-019-48465-x
138. Lin M, Chen JH, Mehta RS, Bahri S, Chan S, Nalcioglu O, et al. Spatial shrinkage/expansion patterns between breast density measured in two MRI scans evaluated by non-rigid registration. Phys Med Biol. (2011) 56:5865–75. doi: 10.1088/0031-9155/56/18/006
139. Wallis JW, Miller TR, Lerner CA, Kleerup EC. Three-Dimensional display in nuclear medicine. IEEE Trans Med Imag. (1989) 8:297–303. doi: 10.1109/42.41482
140. Adams R, Bischof L. Seeded region growing. IEEE Trans Pattern Anal Mach Intell. (1994) 16:641–7. doi: 10.1109/34.295913
141. Hu Q, Whitney HM, Li H, Ji Y, Liu P, Giger ML. Improved classification of benign and malignant breast lesions using deep feature maximum intensity projection MRI in breast cancer diagnosis using dynamic contrast-enhanced MRI. Radiol Artif Intell. (2021) 3:e200159. doi: 10.1148/ryai.2021200159
142. Mahfouz AE, Sherif H, Saad A, Taupitz M, Filimonow S, Kivelitz D, et al. Gadolinium-enhanced MR angiography of the breast: Is breast cancer associated with ipsilateral higher vascularity? Eur Radiol. (2001) 11:965–9. doi: 10.1007/s003300000668
143. Wright H, Listinsky J, Quinn C, Rim A, Crowe J, Kim J. Increased ipsilateral whole breast vascularity as measured by contrast-enhanced magnetic resonance imaging in patients with breast cancer. Am J Surg. (2005) 190:576–9. doi: 10.1016/j.amjsurg.2005.06.015
144. Kul S, Cansu A, Alhan E, Dinc H, Reis A, Çan G. Contrast-Enhanced MR angiography of the breast: evaluation of ipsilateral increased vascularity and adjacent vessel sign in the characterization of breast lesions. Am J Roentgenol. (2010) 195:1250–4. doi: 10.2214/AJR.10.4368
145. Fischer DR, Malich A, Wurdinger S, Boettcher J, Dietzel M, Kaiser WA. The adjacent vessel on dynamic contrast-enhanced breast MRI. AJR Am J Roentgenol. (2006) 187:147–51. doi: 10.2214/AJR.05.0377
Keywords: breast cancer, blood vessel, early detection, MRI, radiomics, artificial intelligence, vascularization
Citation: Frankhouser DE, Dietze E, Mahabal A and Seewaldt VL (2021) Vascularity and Dynamic Contrast-Enhanced Breast Magnetic Resonance Imaging. Front. Radiol. 1:735567. doi: 10.3389/fradi.2021.735567
Received: 11 July 2021; Accepted: 11 November 2021;
Published: 09 December 2021.
Edited by:
Yixuan Yuan, City University of Hong Kong, Hong Kong SAR, ChinaReviewed by:
Meilu Zhu, City University of Hong Kong, Hong Kong SAR, ChinaTao AI, Huazhong University of Science and Technology, China
Copyright © 2021 Frankhouser, Dietze, Mahabal and Seewaldt. This is an open-access article distributed under the terms of the Creative Commons Attribution License (CC BY). The use, distribution or reproduction in other forums is permitted, provided the original author(s) and the copyright owner(s) are credited and that the original publication in this journal is cited, in accordance with accepted academic practice. No use, distribution or reproduction is permitted which does not comply with these terms.
*Correspondence: Ashish Mahabal, YWFtQGFzdHJvLmNhbHRlY2guZWR1; Victoria L. Seewaldt, dmljdG9yaWEuc2Vld2FsZHRAbWUuY29t