 Magnus Falkenberg†
 Mathias Ibsen
 Christian Rathgeb
- da/sec—Biometrics and Security Research Group, Hochschule Darmstadt, Darmstadt, Germany
We address the need for a large-scale database of children’s faces by using generative adversarial networks (GANs) and face-age progression (FAP) models to synthesize a realistic dataset referred to as “HDA-SynChildFaces”. Hence, we proposed a processing pipeline that initially utilizes StyleGAN3 to sample adult subjects, which is subsequently progressed to children of varying ages using InterFaceGAN. Intra-subject variations, such as facial expression and pose, are created by further manipulating the subjects in their latent space. Additionally, this pipeline allows the even distribution of the races of subjects, allowing the generation of a balanced and fair dataset with respect to race distribution. The resulting HDA-SynChildFaces consists of 1,652 subjects and 188,328 images, each subject being present at various ages and with many different intra-subject variations. We then evaluated the performance of various facial recognition systems on the generated database and compared the results of adults and children at different ages. The study reveals that children consistently perform worse than adults on all tested systems and that the degradation in performance is proportional to age. Additionally, our study uncovers some biases in the recognition systems, with Asian and black subjects and females performing worse than white and Latino-Hispanic subjects and males.
1 Introduction
The use of facial recognition systems in differing domains such as surveillance, airports, and personal devices is well-established. These systems have proven to be highly effective and accurate in verifying the identity of subjects (Razzaq et al., 2021; Wang and Deng, 2021). However, as facial recognition becomes increasingly integrated into our daily lives, it is crucial to consider the potential for biases and discrimination against certain demographic groups. Previous research has investigated this issue (Drozdowski et al., 2020), but less attention has been given to the effect of age on the recognition of children’s faces. This area is important, as there are numerous potential applications for facial recognition systems for children. For instance, police can use face recognition to find kidnapped or lost children. Another use is an automated process for analyzing seized child sexual abuse material (CSAM) to recognize victims. In 2019, more than 70 million CSAM videos and images were obtained1. This issue is an increasing problem, with 17 million reports of CSAM in 2019 rising dramatically to 29.3 million in 20212. Due to this immense amount of data, it is necessary to have automated systems which can identify the children in such material, necessitating effective face recognition systems.
The recent emergence of deep learning has been shown to be extremely useful in face recognition (Wang and Deng, 2021). A caveat of these models is that they need a vast amount of training data to achieve state-of-the-art performance. The quantity of data needed has become a growing concern due to increased legal and political scrutiny surrounding the privacy issues associated with large datasets of individual faces (Harvey and LaPlace, 2021; Luccioni et al., 2022; The Rise and Fall, 2022). The current databases used for research in this area are often limited in size, are constrained, and are focused on specific ages or races; they are frequently retracted due to privacy concerns. This issue is further exacerbated in the case of children due to a heightened focus on protecting their rights.
To address these issues, this research makes the following contributions:
• We present a novel pipeline for creating a synthetic face database containing the same subjects both at adult age and also different child ages (Figure 1). To achieve this, state-of-the-art generative adversarial networks (GANs) and face age progression (FAP) models were combined, enabling the generation of the first large-scale synthetic child face image database: HDA-SynChildFaces. To the best of our knowledge, this database represents the first synthetic child face database for face recognition.
• In a comprehensive experimental evaluation, two open-source and one commercial face recognition system were evaluated on this database using standardized metrics, showing that the recognition performance of all tested systems decreases by age groups. Evaluations of further demographic subgroups—gender and race—additionally reveal certain biases in the face recognition systems that were tested.
• To facilitate reproducible research, the HDA-SynChildFaces dataset will be made available to researchers [see (Ibsen, 2023)]. This dataset can be further used to train face recognition systems for children, although this is beyond the scope of this study.
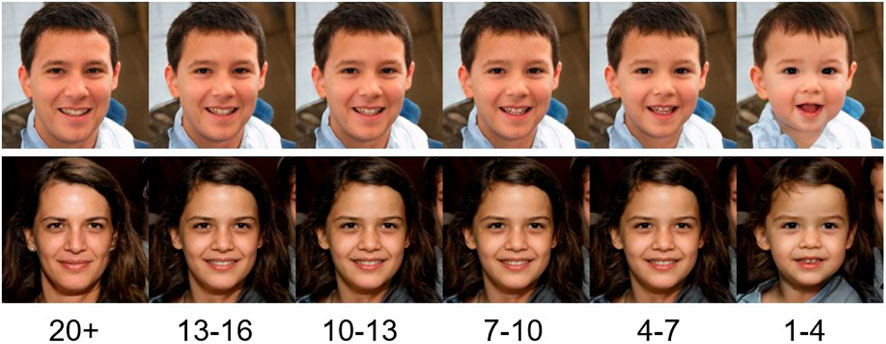
Figure 1. Examples of face images generated by StyleGAN3 (Karras et al., 2021) (leftmost) with progressed child faces of varying ages using InterFaceGAN (Shen et al., 2022).
The novelty of this research lies in the proposed processing pipeline, which enables a controlled unbiased generation of child face images. While this pipeline is mainly based on existing components, it enables the analysis of child face recognition at scale as showcased in our experiments. Moreover, the publication of the synthetically generated HDA-SynChildFaces database solves privacy issues associated with the distribution of child face imagery. For researchers in the field of child face recognition, this database is expected to provide a good basis for algorithm evaluation and training.
The rest of this work is organized as follows. Section 2 briefly discusses related research on face recognition for children and face-age progression. The database generation process is described in detail in Section 3. Experiments are presented in Section 4 and discussed in Section 5. Conclusions are drawn in Section 6.
2 Related work
2.1 Child face recognition
Multiple efforts have been made to create datasets of children at different ages to evaluate or train facial recognition systems. However, many datasets used in research are not publicly available due to ethical and privacy concerns. Acquired datasets can broadly be divided into two categories: controlled datasets obtained through controlled settings (e.g., Best-Rowden et al., 2016; Deb et al., 2018; Bahmani and Schuckers, 2022; Chandaliya and Nain, 2022) or web-scraped datasets (e.g., Ricanek et al., 2015; Medvedev et al., 2023). An overview of the relevant datasets and their statistics is presented in Table 1.
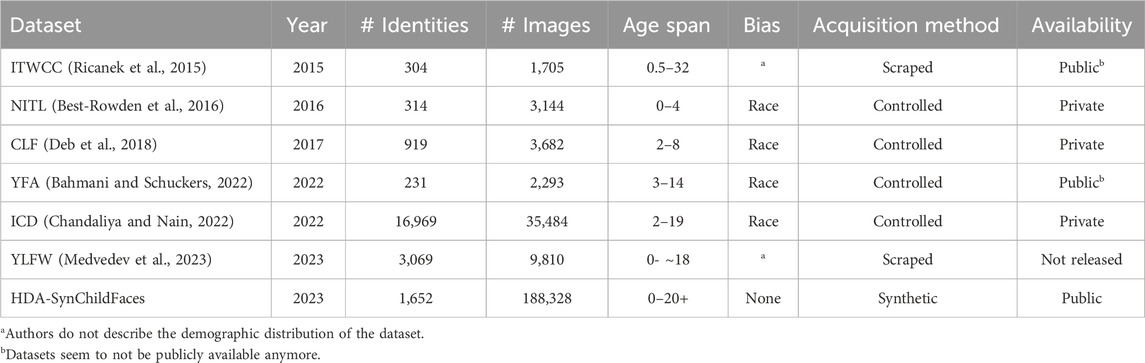
Table 1. Different child face datasets for facial recognition systems. The bias column indicates the presence of any potential biases within the respective dataset.
In general, the controlled datasets are obtained in environments where the researchers control factors such as pose, facial expression, illumination, and the age gap between sessions. This makes it easier to isolate the dataset to only focus on age differences. However, one limitation of these datasets is the potential for race and demographic bias in the sample population. The web-scraped datasets are often less constrained and have more variation in the images. This makes it more difficult to distinguish between the effects of age and other factors on the performance of facial recognition systems. Most of the datasets are used for longitudinal studies of the performance of facial recognition systems. The NITL (Best-Rowden et al., 2016) is a longitudinal dataset that focuses on children aged 0–4. The data were collected at a free pediatrics clinic in Dayalbagh, India. The images were collected over four sessions between March 2015 and March 2016. Their experiment compares the accuracy of facial recognition systems on images from the same sessions with images from different sessions. They found that the verification accuracy for children aged 6 months decreased 50% compared to the verification of images taken in the same session. The difference was even more significant when only looking at children aged 1–2 in the first session. Here, the accuracy decreased by 82%.
In the three longitudinal studies (Deb et al., 2018; Bahmani and Schuckers, 2022; Chandaliya and Nain, 2022), the datasets were collected in cooperation with schools. These datasets are not publicly available due to privacy concerns regarding the subjects. In Deb et al. (2018), the CLF dataset consists of facial images of children aged 2–18 with constrained images taken of the same subject over time (avg. 4.2 years). The YFA (Bahmani and Schuckers, 2022) dataset contains images captured over time at a local elementary and middle school of voluntary children. In the dataset, the target was to investigate how changes in age influence facial recognition systems, and thus the images captured are limited regarding change in pose, illumination, and expression. The images were taken over multiple session with a maximum total age gap of 3 years. The ICD dataset, used in ChildGAN (Chandaliya and Nain, 2022), contains subjects with multiple images taken over time as well as subjects with only a single image. The facial images are divided into five different sets based on the following age groups: 2–5, 6–8, 9–11, 12–14, and 15–19. All images were collected in India. The In-the-Wild Child Celebrity (ITWCC) (Ricanek et al., 2015) dataset is a recent longitudinal children database scraped from the internet. The dataset consists of different celebrities. As the images are scraped from the internet, they are unconstrained; this makes it difficult to isolate age as a parameter when testing facial recognition systems. They present results showing that facial recognition systems have issues verifying the identities of non-adult aging subjects. Another, and very recent, dataset scraped from the internet is the YLFW dataset (Medvedev et al., 2023), which was compiled by scraping identities on the web using a specific set of keywords. A set of images is downloaded for each of these keyword sets and is then filtered using hierarchical clustering. The dataset was then balanced regarding four races: Caucasian, Asian, African, and Indian. A manual procedure followed this process to verify the match pairs. In evaluating the performance of facial recognition systems for children, they found that the systems are significantly worse for children, as previous studies also have shown. However, they also showed that training facial recognition systems on their dataset can reduce this difference.
In Srinivas et al. (2019), subsets of the ITWCC (Ricanek et al., 2015) and LFW (Huang et al., 2008) datasets were used to compare the performance of facial recognition systems on adults and children. The authors compared eight different facial recognition systems and found that all eight were biased, performing significantly worse on children.
In summary, we identify the following shortcomings with existing real-child face datasets:
• Availability: the majority of collected datasets are not available, particularly those captured under controlled circumstances, allowing only an isolated analysis of the impact of age on face recognition.
• Bias: the geographical locations for the controlled acquisition of child face databases, such as in India in Best-Rowden et al. (2016), introduces a bias that prevents a detailed evaluation of demographic differentials in face recognition performance.
• Size: while the child datasets captured in controlled environments contain only a small number of subjects, which hampers an evaluation of child face recognition at scale, the uncontrolled child datasets contain only a small amount of samples per subject, thus limiting the number of within-subject comparisons.
In response to these issues, we introduce the HDA-SynChildFaces dataset. In comparison to existing databases, HDA-SynChildFaces contains only synthetic data and can thus be shared publicly without any restrictions. It is balanced in terms of race, gender, and age groups, which allows for an unbiased evaluation or training of face recognition systems. While other child face databases, such as ICD of YLFW, may contain face images of a larger number of subjects (albeit of rather lower quality), the HDA-SynChildFaces database proposed in this work comprises a significantly larger number of images per subject (by orders of magnitude), enabling more comprehensive intra-subject analyses.
2.2 Face-age progression
GAN-based architectures have not only proven their worth in generating synthetic images but also in performing face-age progression (FAP). Grimmer et al. (2021) have recently provided a comprehensive survey of deep face age progression, noting that GANs indeed produce remarkable face ageing results (cf. Figure 1). Many of the FAP models covered in this section are based in some way on GANs.
In InterFaceGAN, Shen et al. (2022) do not directly train a new GAN to do FAP but instead investigate the latent space learned by the original StyleGAN trained on the FFHQ dataset. The researchers train a linear model in which a boundary is learned to, for example, change the age or gender of a generated image directly in the latent space. Alaluf et al. (2023) retrained InterFaceGAN on the StyleGAN3 latent space, thus taking advantage of the improved architecture for generating faces.
Or-El et al. (2020) handle FAP by proposing a new GAN architecture trained with labeled age groups (e.g., 0–2 or 50–69), enabling FAP by giving an input image and specifying the desired age group. He et al. (2021) note that many of the GAN-based FAP approaches end up with an entangled latent space in which they then manipulate the age. They instead propose a model where they disentangle key characteristics while modifying the age in different age groups. Chandaliya and Nain (2022) also take a GAN-based approach to FAP learned with different age groups. AgeGAN, an architecture proposed in Song et al. (2022), uses a dual condition GAN architecture where one generator converts input faces to other ages based on an age group condition, and the dual conditional GAN learns to invert the task.
Alaluf et al. (2021) propose an architecture where age is approached as a regression task rather than as discrete age groups. Their model learns a non-linear path to disentangle the age progression from other attributes. Li et al. (2021) also focus on continuous ageing and use an age estimator as part of a GAN-generator in a novel architecture.
Authors from Disney Research in Zoss et al. (2022) propose a FAP model that does not use a GAN but instead uses a U-Net, translating in an image-to-image manner together with a specified age. They observed promising results, although a caveat of their model is that it is only possible to progress down to the age of 20 due to the training data used.
Many of the models proposed in the scientific literature (e.g., Or-El et al., 2020; Alaluf et al., 2021; He et al., 2021; Zoss et al., 2022) are all end-to-end solutions, meaning that they take an image and a specified age (or age-group) as input and then output an image. In Shen et al. (2022) and Alaluf et al. (2023), an image is directly manipulated in the latent space of the StyleGAN variant, which then skips the part of inverting or translating an image into latent space, which otherwise may come at a loss.
3 Materials and methods
The proposed pipeline for creating the desired biometric dataset consists of the following steps that are described in detail in the subsequent subsections:
Sampling: This step handles the generation of synthetic faces, thus creating the initial database.
Filtering: This step handles the filtering of the initial database, removing poor quality and unwanted images.
Race Balancing: As the generation of the initial faces is random, the distribution of the subjects’ races may be skewed. This step evenly distributes races in the database.
Age Transformation: Progressing an adult into a child is a key concept in this paper. This step progresses an adult into a child in different age groups.
Intra-Subject Transformation: To biometrically benchmark a database, reference images need corresponding probe images with realistic intra-subject variations, which this step creates.
Post-Processing: This step will perform some automatic cleaning. It ensures that the same seeds are present in all different age groups and tries to remove poorly transformed images.
3.1 Sampling and filtering
In this study, StyleGAN3 is used to sample an initial set of face images. A subset of these initially sampled images is then chosen by filtering, first discarding images based on age and then based on sample quality.
The age filtering step is implemented by using the C3AE age estimator (Zhang et al., 2019). It simply works by estimating the age of the generated subjects and, if they are below a pre-defined age, they are rejected.
The quality filtering step is implemented by using the SER-FIQ (Terhörst et al., 2020) quality score algorithm, which represents a state-of-the-art algorithm. The quality score extracted is between 0 and 1, where 1 is an image of perfect quality. Figure 2 shows examples of accepted and rejected images based on the SER-FIQ score. Figure 3 shows the distribution of the quality scores for 10,000 generated subjects without any previous age filtering. The distribution looks Gaussian-like but with a heavy tail that may be caused by artifacts or very young-looking subjects which usually get a low quality score.
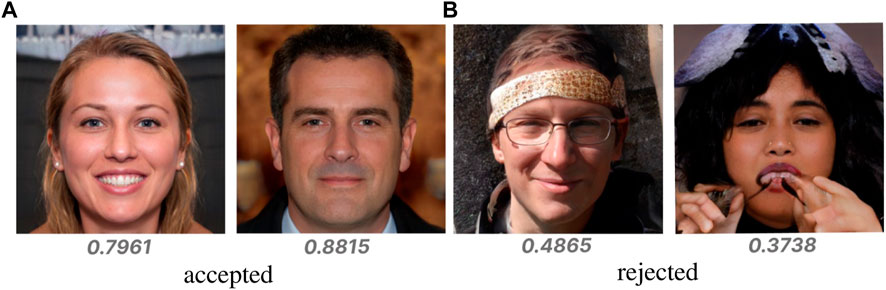
Figure 2. Example of accepted and rejected images using SER-FIQ (Terhörst et al., 2020) quality assessment with a 0.75 threshold.
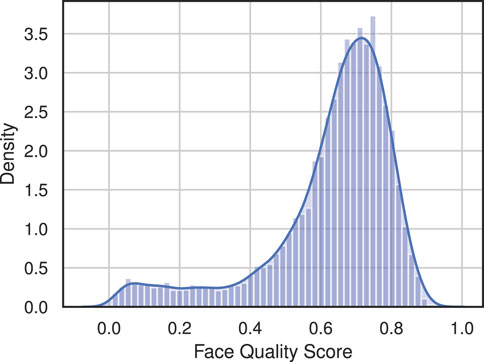
Figure 3. Distribution of SER-FIQ (Terhörst et al., 2020) quality scores for 10,000 generated face images.
3.2 Latent transformation
Hyperplane boundaries for certain attributes are estimated as explained in the original InterFaceGAN paper (Shen et al., 2022) but by using the latent space of StyleGAN3 instead of StyleGAN. The separation boundary between different categories of an attribute is found by using a linear support vector machine (SVM) to identify a hyperplane that separates the two categories. For example, in the case of the gender attribute, the SVM could be trained to distinguish between male and female (Figure 4).
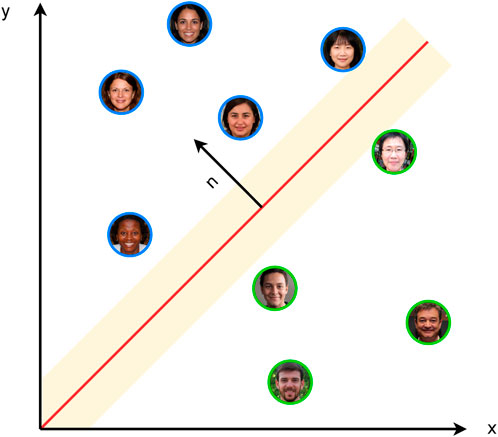
Figure 4. Hyperplane between two categories in a simplified 2D space. The red line is the hyperplane as found by a linear SVM. The images with a blue border are categorized as women and those with a green border as men. n is the normal vector to the hyperplane.
This normal vector n can then be used to modify the latent code of an image by adding it to the latent code. This can be described as:
Here, wedit denotes the resulting latent code after the manipulation, w is the original latent code of the image, and α is a parameter choosing the degree of the edit. Figure 5 shows how this boundary modifies a subject. In this example, the same subject is manipulated with different α values.

Figure 5. Example of a subject manipulated with a gender boundary, moving the subject in both a positive and negative direction.
The SVM are trained on a large number of images (500,000) generated with StyleGAN3. Each image must be classified using a pre-trained classifier for the specific attribute. To filter out bad classifications, only the top 10% and bottom 10% were used for the training. This was done for all of the attributes in Table 2 marked with This work.
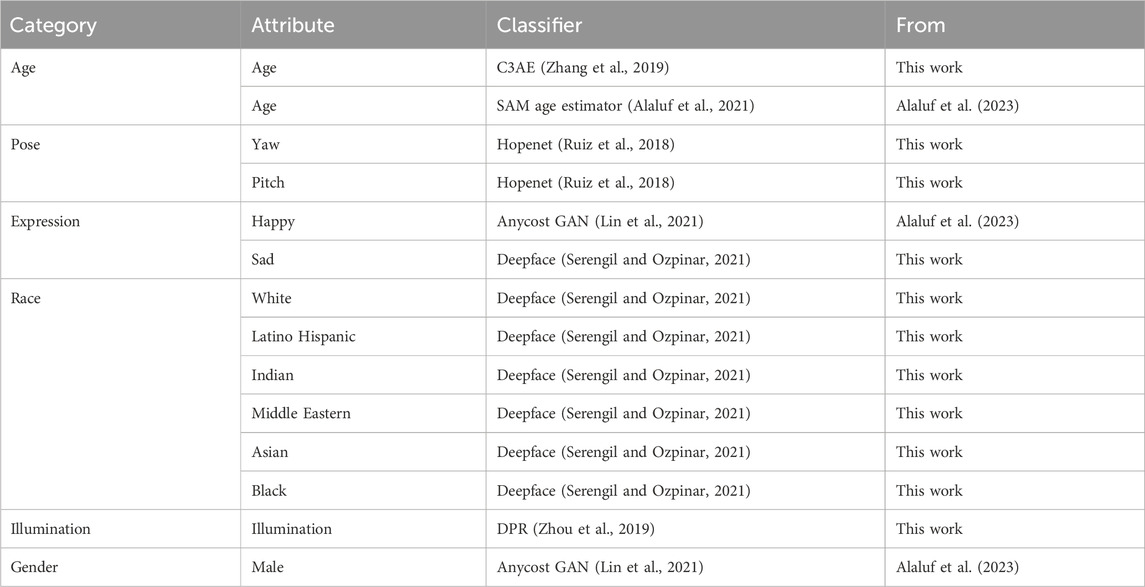
Table 2. Boundaries used in the implementation of the proposed pipeline.
As mentioned in Shen et al. (2022), the manipulation of a specific attribute can result in unintended changes to other attributes. This is due to the entanglement in the latent space and the correlation of the attributes in the images used for training the SVM. To minimize these unwanted side effects, a new conditional boundary can be calculated by projecting the boundary of the desired attribute onto the boundary of another attribute. This process can be formalized mathematically as follows:
where n1 is the boundary of the desired attribute (e.g., smile), n2 is the boundary of the unintended attribute (e.g., glasses), and ncond is the conditional boundary. This new conditional boundary can then be used to edit the desired attribute. Furthermore, the pipeline uses the w latent vector, which is a single dimension of the w + latent. This is due to less entanglement than when using the z latent, as mentioned in the original InterFaceGAN paper (Shen et al., 2022).
The need to neutralize images with respect to certain attributes, such as a pose, arises during image sampling in order to ensure the quality of the generated images. Here, we follow the process proposed in Colbois et al. (2021). Neutralizing an image with respect to yaw using a trained boundary denoted as nyaw can be described mathematically as
where w is the initial latent code for the image and wneutral is the latent vector for the neutralized image. wneutral could then be used to generate the neutralized image. This concept of neutralization is used several times throughout the pipeline, and it can be done with any of the boundaries seen in Table 2.
3.3 Balancing races
In contrast to real existing child face databases, we aim to create a database that is equally distributed with respect to race. To do so, the trained race boundaries seen in Table 2 can be used to change the race of individual subjects. Figure 6 shows examples of using the individual race boundaries on the same subject.
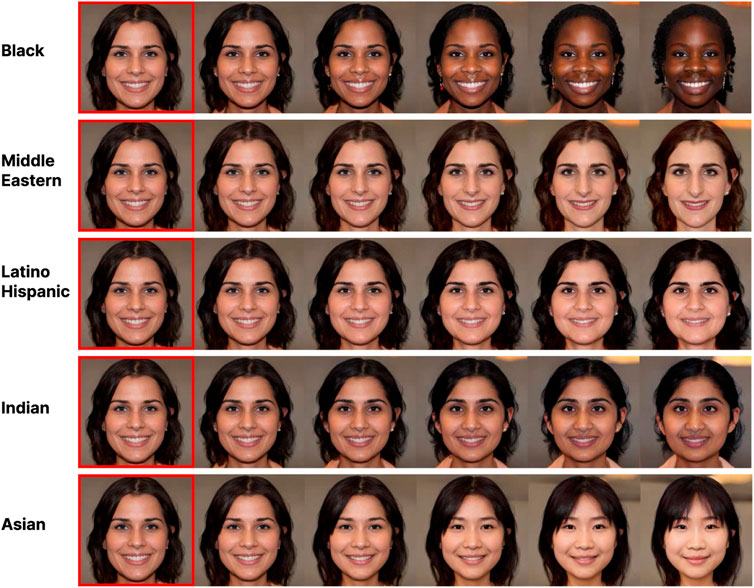
Figure 6. Example of moving a subject (leftmost) along each of the five race boundaries.
Firstly, a database of images and latent vectors is sampled, where the race of each subject is initially classified. Subsequently, a random subject of the most represented race is changed into the least represented race. This step is repeated until the races are uniformly distributed.
An example of the distribution of the races before and after their balancing can be seen in Figure 7. Initially, 70% of the subjects sampled are classified as white, while only 0.5% are classified as black. It should be noted that a caveat of this approach is that it is largely dependent on the race classifier. That is, human inspection of the subjects’ races may not always agree with the classifier and algorithm outputs.

Figure 7. Effect of race balancing on a dataset of 3,510 subjects of non-uniformly distributed races. A: Asian, B: Black, I: Indians, LH: Latino-Hispanic, ME: Middle Eastern, W:White.
3.4 Age transformation
The latent transformations previously described were also used to transform the age of a subject. However, one problem with latent transformations is that sometimes a subject is poorly transformed because the subject is moved too far in a direction in the latent space. This can happen, for instance, if the age classifier inaccurately predicts a subject's age. An example of a subject being moved too far can be seen in Figure 8. The first three images, surrounded by green boxes, look realistic and like the same person in progressively younger versions. In the last three images, surrounded by red boxes, it can be seen that, by moving too far in the age direction, the subject begins to look less human and more unrealistic—it has been poorly transformed.

Figure 8. Example of a subject moved too far in the age direction (green boxed images still look natural, while red boxed images look progressively more unnatural).
A way to automatically detect such undesired effects is to perform a principal component analysis (PCA) and use it for outlier detection. We generated a large amount of latent vectors (300,000) to fit the PCA and find the principle components. The idea is that the two most important principal components form a distribution and that a transformed image is anomalous if it is too far from the center. If the image is categorized as an anomaly, then it should be removed as it is likely to be a poor transformation. A visualization of this concept can be seen in Figure 9.
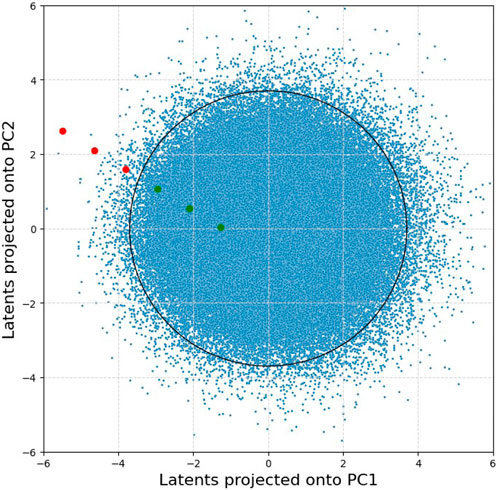
Figure 9. 300 k StyleGAN3 latent vectors projected onto their first and second principal components, where each blue dot corresponds to a subject. The red and green dots showcase the effect of transforming a single subject along the age direction, corresponding to the progression seen in Figure 8, where the red dots are leaving the distribution.
This approach can automatically detect the majority of poorly transformed subjects. Figure 10 shows more examples of removed subjects from the database where the images are categorized as anomalies.
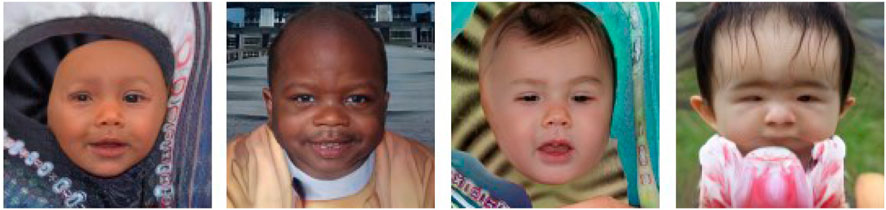
Figure 10. Examples of rejected images in the automatic post-processing step of the pipeline.
3.5 Intra-subject transformations
The following subject- and environment-related properties are further modified to simulate intra-class variations: pose, expression, and illumination. These are implemented by manipulating the latent vectors using the linear boundaries trained (Table 2). Figure 11 depicts a subset of all variations across different age groups for an example subject.
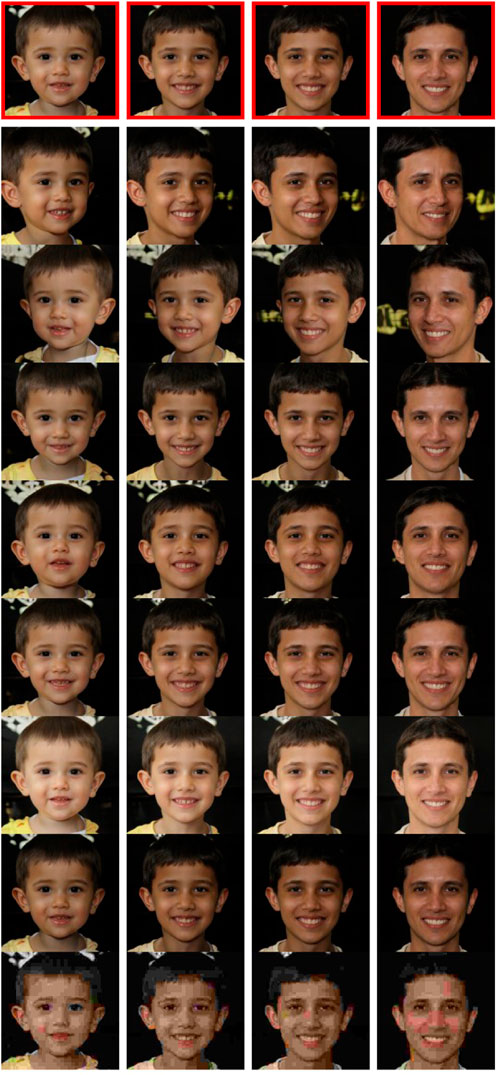
Figure 11. Example of a subject in the different age groups. Ages from left to right: 1–4, 7–10, 13–16, and 20+. Variations from top and downward, where the reference is the red boxed ones: left yaw, right yaw, pitch down, pitch up, smile, high illumination, low illumination, and compression.
For changing the pose of the subject, two boundaries were trained for yaw and pitch using the Hopenet pose estimator (Ruiz et al., 2018). By default, the pipeline will generate four variations for each axis of the subjects. The amount of illumination in an image is also a boundary trained by using the light classifier from the DPR model of Zhou et al. (2019). Two boundaries were used to change the facial expression of a subject: one for making a subject smile and one for making them look sad. To compress a facial image, lossy compressed versions of each subject were generated by saving the image in JPEG format with different qualities; the original reference image was saved in the lossless PNG format.
3.6 HDA-SynChildFaces
The HDA-SynChildFaces database consists of 1,652 different subjects which have been processed in the whole pipeline as previously explained. A short overview of the parameters used can be seen in Table 3.Here, the original 1,652 subjects correspond to being age 20 and above. Each of these subjects has been progressed down into the five different age groups seen above, resulting in six datasets (one of adults and five of children). Each of these images across the six datasets have 18 corresponding intra-class variations. This sums up to a total of 1,652 × 6 × (18 + 1) = 188,328 images.
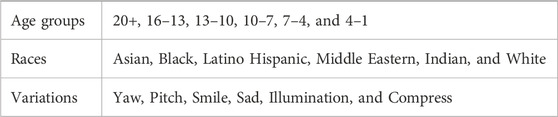
Table 3. Age groups, races, and intra-subject variations provided as input to the pipeline to produce the dataset.
3.6.1 Gender subset
As a part of the pipeline, each synthetic subject has also been classified as either being male (M) or female (F). This split tests the performance of the face recognition systems between gender and, if it varies, across different age groups. The number of images in each group can be seen in Table 4. There, 40.3% of the subjects are women and 59.7% are men, which is a bit skewed. This skewness occurs as part of the filtering process where the quality filter is slightly biased against women.
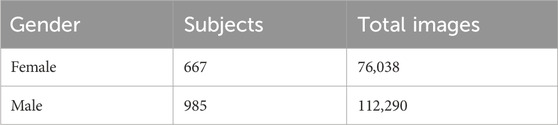
Table 4. Female (F) and male (M) subjects and total images in the database.
3.6.2 Race subset
The race of the different subjects is also saved after equally distributing them. This allows for division of the dataset into race-specific subsets to see if face recognition systems are biased against some races and if changes appear across age groups. The number of images and different subjects for each subset can be seen in Table 5. Although the races are equally distributed after the race distribution step, this may become a bit unbalanced due to the post-processing step. As can be seen, there are fewer Asians left at the end of the pipeline than of other races.
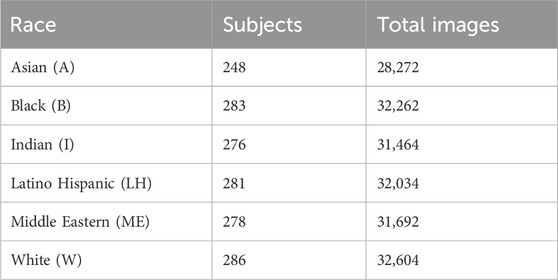
Table 5. Number of subjects of different races in database.
4 Experiments
In experiments, the HDA-SynChildFaces database was used for face recognition performance analysis. As mentioned earlier, evaluations of other child face databases were not conducted since existing datasets containing child face images of high quality were not publicly available. In addition, due to the previously mentioned shortcomings of available real child face datasets, a comparison with them is not meaningful and is, therefore, not considered in this work. We evaluated multiple state-of-the-art facial recognition systems, both open-source and commercial. First, the performance of facial recognition systems across different age groups was determined (children vs. adults). The impact of race and gender was also evaluated (demographic differentials) in order to investigate whether age may also impact these factors. In the next subsection, the face recognition models employed are listed along with a detailed description of applied evaluation metrics. The results obtained are then presented.
4.1 Experimental setup
The facial recognition systems under investigation are ArcFace (Deng et al., 2019)3, MagFace (Meng et al., 2021)4, and a commercial off-the-shelf (COTS) solution. Before facial recognition with both state-of-the-art open-source systems, face detection and alignment was done with RetinaFace (Deng et al., 2020), a state-of-the-art face detection system.
To evaluate the different recognition systems, biometric measures and metrics from the ISO/IEC 19795-1 (ISO, 2021) standard were used. For the open-source systems, the mated (genuine) scores and non-mated (impostor) scores were calculated for each of the datasets by using the cosine similarity measure seen in Eq. 4:
Here, Ai and Bi refers to specific feature vectors extracted by a face recognition system. The COTS system uses its own proprietary similarity score. The mated comparisons are made by calculating the similarity score between each of the images with each of its corresponding variations. The non-mated comparisons are made by calculating the similarity score between an image and a random image from all other individuals. The results were evaluated by using the following metrics:
FMR/FNMR: Following ISO/IEC 19795-1 (ISO, 2021), false match rate (FMR) and false non-match rate (FNMR) are technical terms used to describe the performance of biometric systems. FMR represents the percentage of non-mated comparisons that are incorrectly confirmed as matches at a specific threshold, while FNMR represents the percentage of mated comparisons that are incorrectly rejected as non-mated. In this experiment, the focus will be on evaluating the FNMR values under three distinct conditions, corresponding to FMR values of 0.01%, 0.1%, and 1%.
DET-curves: The detection error trade-off (DET) curve is a plot for visualizing the trade-off between the FNMR and the FMR.
EER: The equal error rate (EER) is the rate where the value of FMR and FNMR are equal.
Distribution statistics: The following common distribution statistics were calculated to characterize the distribution of the mated and non-mated comparisons: mean μ and standard deviation σ.
Decidability index: Denoted as d′, the decidability index can be interpreted as a value that describes the amount of separation between two distributions. It will be calculated for the distributions of the mated and non-mated comparisons, where a larger value indicates a better separation between the two. It is calculated using the following formula (Daugman, 2000):
where μm and σm are the mean and standard deviation for the mated comparisons and μnm and σnm are the mean and standard deviation for the non-mated comparisons.
4.2 Results
4.2.1 Children vs. adults
Experimental results across all age groups for the tested face recognition systems are summarized in Table 6. The corresponding DET curves are plotted in Figure 12. When focusing on one system at a time, it can be seen how the mated part of the statistics is very similar across the age groups. The mean and standard deviation are all extremely close. It can be noted how the mated mean and standard deviation are quite similar for MagFace and ArcFace while COTS has a significantly larger mean and smaller standard deviation. When looking at the non-mated part, it can be seen how the mean of the distributions grows steadily for the younger the age group, which happens for all three face recognition systems. The same is true for the standard deviation where there is a considerable increase when comparing the age groups 20+ and 16-13. For ArcFace and MagFace, a significant increase between the groups 7–4 and 4–1 can also be noticed, but not for COTS. Another interesting statistic can be seen when looking at d′, where a higher d′ means that the system can better distinguish between the mated and non-mated distributions. An evident tendency across all systems is that the d′ scores decrease for the younger age groups.
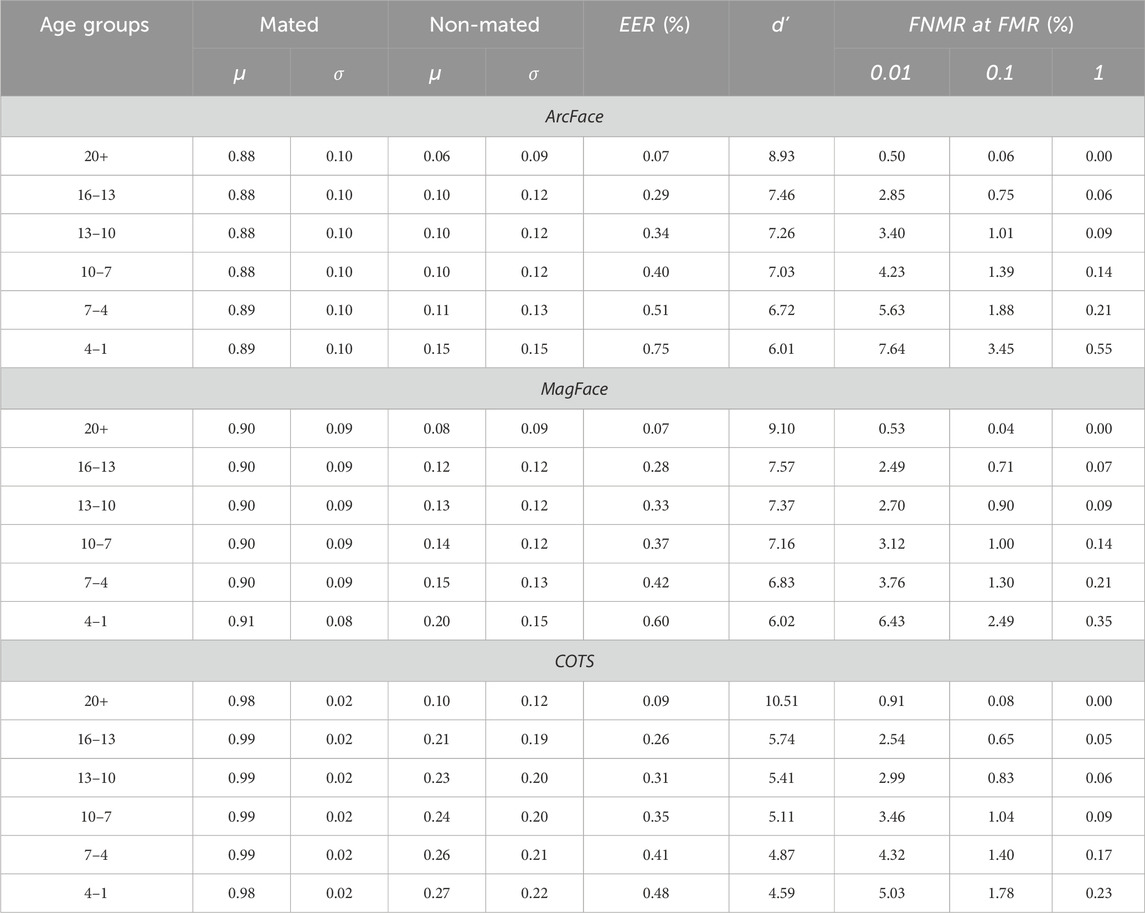
Table 6. Different biometric performance metrics with ArcFace, MagFace, and COTS as face recognition systems from the full dataset.
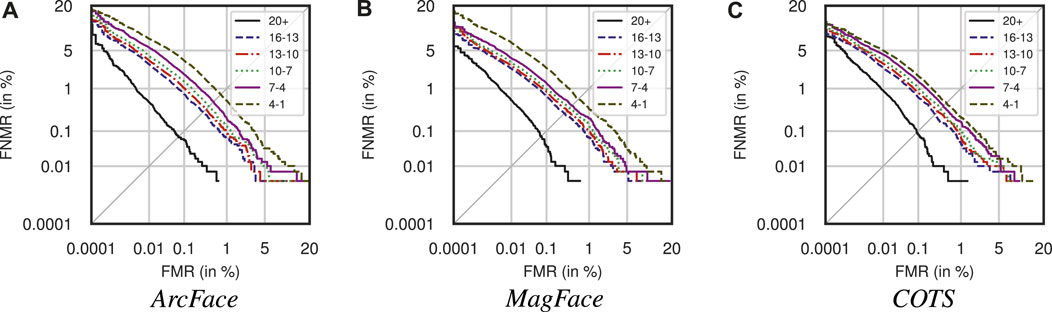
Figure 12. DET-curves of full dataset when using ArcFace, MagFace, and COTS.
4.2.2 Demographic differentials
For the analysis of demographics—gender and race—only results for MagFace are shown. This is because all three different systems show similar patterns, albeit that the actual numbers may differ slightly.
In Table 7, the results obtained for the gender subset are summarized. It is apparent that the d′ values are larger for men than women when looking at the age groups 20+, 16–13 and 13–10; the systems are thus better at distinguishing mated and non-mated samples. The value of the younger age groups is slightly larger for women. The non-mated mean values are generally larger for men across all age groups, but for mated values, the values are very similar for both males and females. The DET-curves for the three age groups 20+, 10–13, and 1–4 divided into gender are depicted in Figure 13. For the first five age groups, the EER is lower for males than females, but for the last age group, ages 4–1, the opposite can be observed. This is the same phenomenon observed from the DET curves in Figure 13, where the male subset performed better than the female subset in all but the youngest age group.
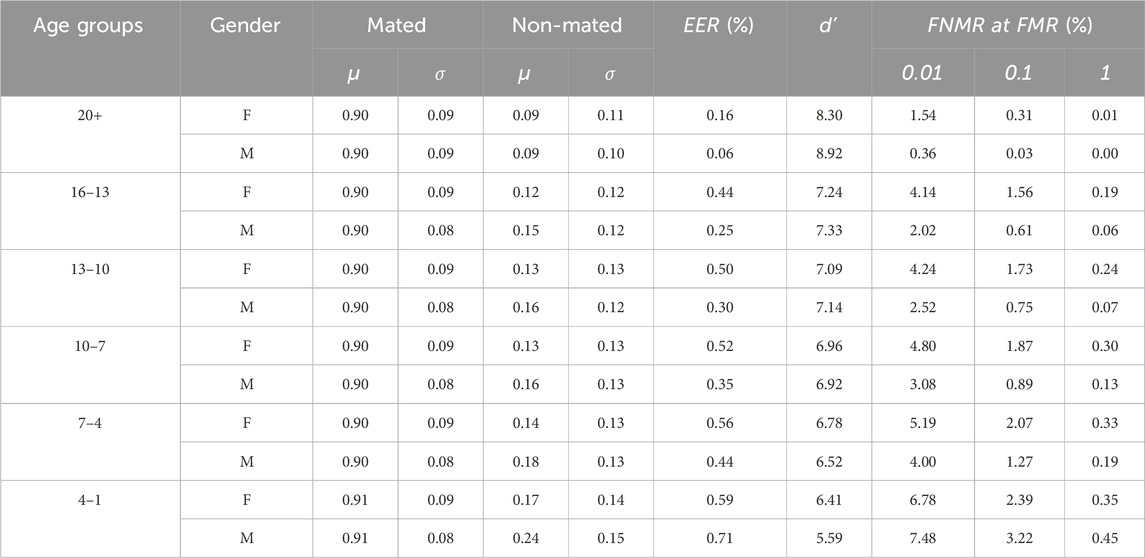
Table 7. Different biometric performance metrics with MagFace from the gender-divided dataset.
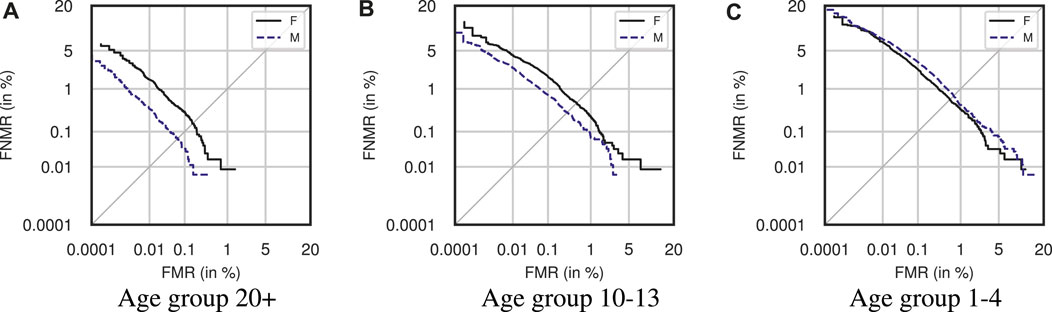
Figure 13. DET-curves for Gender datasets for 1–4, 10–13, and 20+ age groups using MagFace.
The results for race are summarized in Table 8. It should be noted that only the non-mated distribution statistics are shown here, as the mated statistics are very similar. There are several interesting observations, such as the d′ score being largest for subjects of white race in all age groups except for adults, where Latino-Hispanic is slightly larger. Black race subjects always have the smallest d′ score, closely followed by Indians. Changes to mean, standard deviation, and median significantly depend on race and age. It can be observed that those of Asian race have the most significant standard deviation for all but the oldest age group. The corresponding DET-curves can be seen in Figure 14. Performance worsens for all races in the youngest age groups but still with a hierarchy similar to the worst to best performing races.
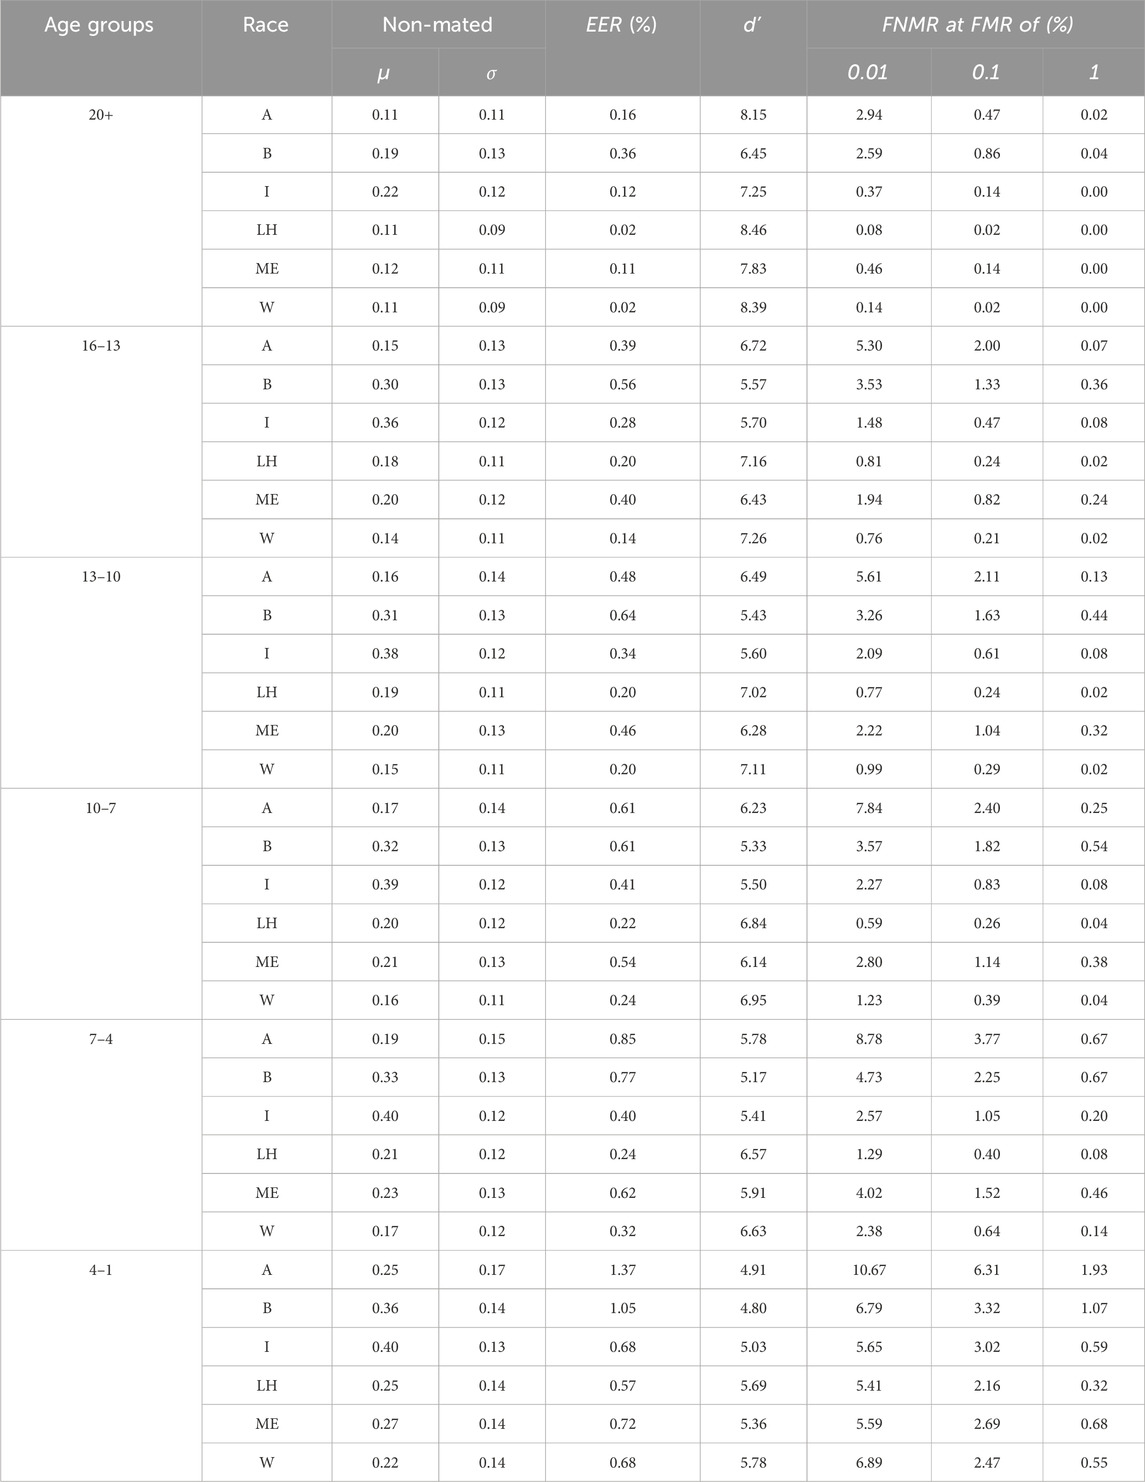
Table 8. Different biometric measures from using MagFace on the race-divided dataset.
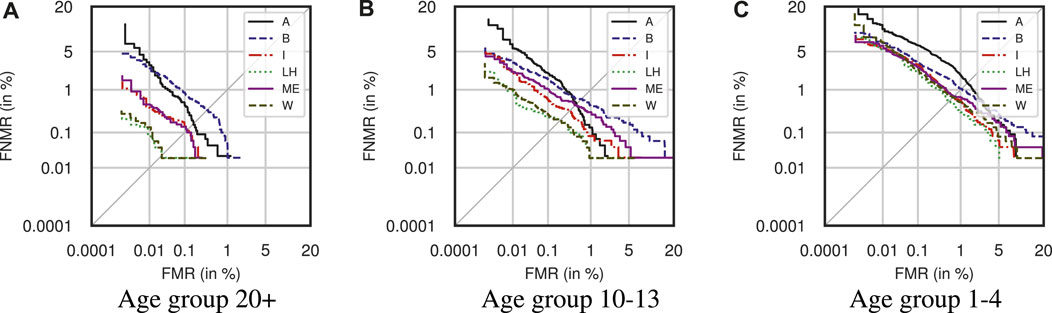
Figure 14. DET-curves for Race datasets for 1–4, 10–13, and 20+ age groups using MagFace.
5 Discussion
From the results observed for the full dataset, the mated scores are stable across the different age groups and generally have quite a high mean. The progression has a big impact on the non-mated scores across age groups, which causes a decrease in performance as the subjects get younger when verification metrics are measured. This drop in performance was a common pattern across all three face recognition systems tested. Performance significantly decreased as the subjects got younger, with a notable increase in EER. A common threshold in biometric verification is having a FMR of 0.1% (Research and Development Unit, 2015) and looking at MagFace in Table 6, which results in a practical FNMR of 0.04% for adults. However, by progressing these same adults down to an age group of the youngest children of age 1–4, it rose to 2.49%. This change in score demonstrates how large a performance decrease can be observed when the same identities are younger. For the youngest children, the COTS system showed the best performance, according to EER values, although, when looking at the adults, COTS performed the worst. It is unknown what kind of data is used in training this system, but it could indicate that the system has seen images of young children before. As this analysis of the performance across ages is based on synthetic data, the question arises as to whether these same observed results would occur if it was tested on facial images of persons at different ages. As mentioned in Section 2, several studies on child face recognition were described in which a performance drop was also observed in the real data of children compared to the performance of adults. Notably, Medvedev et al. (2023) saw a performance decrease in younger children compared to adults. They also noted that children are harder to discriminate for the different facial recognition systems that they test. They do see a performance increase by fine-tuning a system on their child database. These results are comparable with the results observed in this work, but this dataset has the benefit of being synthetic.
It was also observed how black and Asian race subjects generally performed worse than white and Latino-Hispanic subjects. Furthermore, all races had a performance decrease as they got younger. Grother et al. (2019) performed a vendor test with a specific focus on the performance and bias of commercial face recognition systems concerning demographics. They noted several of the same observations regarding race and age. Similar findings were made by Wang et al. (2019). Overall, the results indicate that facial recognition systems are not robust for younger subjects and that racial and gender bias is a general problem across age groups.
Figure 15 shows pairs of subjects aged 7–10 with a high non-mated score. There, the pairs of subjects have the same gender and race. Similarly, pairs of subjects from the youngest age group (ages 1–4) with a high non-mated score can be seen in Figure 16. In this particular age group, false matches across gender and race have also been observed.
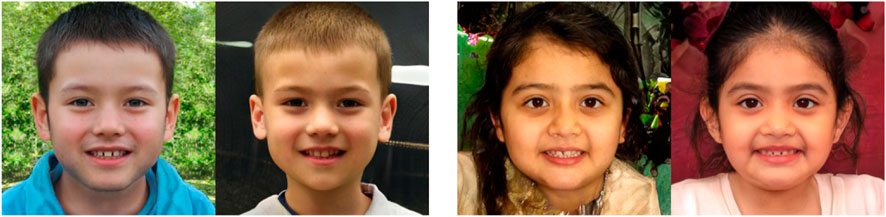
Figure 15. Example pairs of synthetic child subjects (ages 7–10) with high non-mated score according to MagFace.
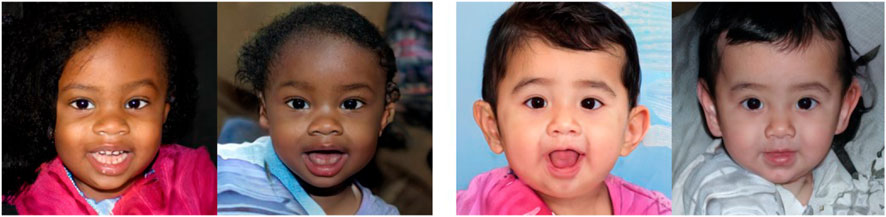
Figure 16. Example pairs of synthetic child subjects (ages 1–4) with high non-mated score according to MagFace.
An example where the same two subjects have a high non-mated score in all the different age groups can be seen in Figure 17. Here, the top-left image is from the adult age group while the bottom-right is from the youngest child group. To investigate this phenomenon further, the scatter matrix in Figure 18 was constructed.
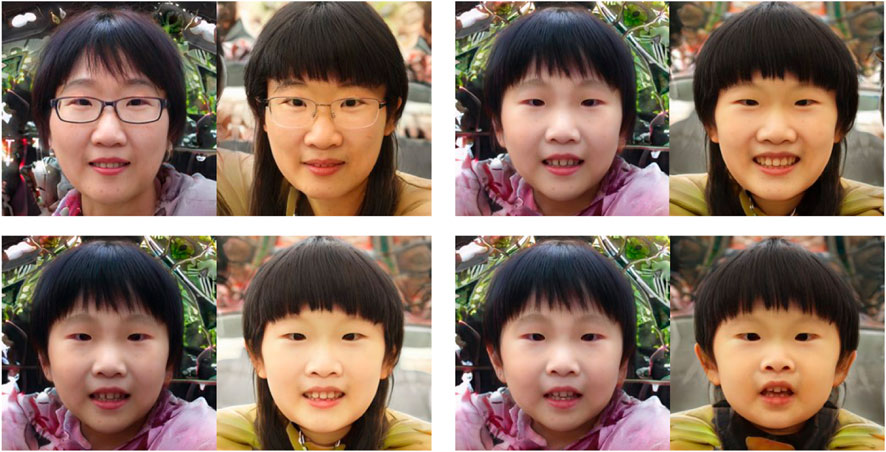
Figure 17. Example of two subjects with high non-mated score throughout all age groups, according to MagFace.

Figure 18. Pairwise scatter plots between different age groups showing the relationship of the non-mated comparison score with MagFace.
Each of the non-mated scores of one age group was plotted against the same non-mated comparison of all other age groups. Thus, if Subject s1 is compared with Subject s2 in age group 20+ and produces some score, then these two subjects have comparison scores in all the other age groups. All scores can then be plotted pairwise to see if there is a correlation between scores of the same subjects across age groups. An example can be seen by looking at the x-axis at ages 20+ and the y-axis at ages 16–13, where there is a positive correlation. An even stronger correlation can be observed at x-axis 16–13 and y-axis 13–10 which may be because the age groups are much closer in age than those of 20+ and 16–13. This positive correlation continues down the whole diagonal, which indeed tells us that there is a tendency for the same pairs of non-mated comparison scores being correlated across age groups.
A limitation of this work is that any bias in the GAN-based generation method is likely to affect the variance of the generated face images. In particular, unbalanced training data of a GAN with respect to age and race is expected to limit the variance with specific demographic groups, such as young Asians (Figure 17). Even though demographic attributes can be controlled in the proposed approach, low inter-class variations of certain demographic groups arise due to their under-representation in the training data. Such biases may lead to incorrect conclusions and represent a major challenge that is outside the scope of this work.
Another limitation of this work is the realism of the intra-class variations. In order to obtain more realistic variations, approaches beyond GANs would be necessary, such as based on a combination of GANs and diffusion models (Melzi et al., 2023a). Thereby, more realistic intra-class variation could be achieved which, in turn, would make the synthetically generated face images more suitable for training face recognition systems. For instance, fine-tuning of neural network-based face recognition models could be performed to improve the recognition accuracy for specific demographic groups (Melzi et al., 2023b) such as children.
6 Conclusion
This study introduced the HDA-SynChildFaces database, a synthetic database of demographically balanced face images of children across various age groups, including common intra-class variations.
From experiments conducted on HDA-SynChildFaces, the following key findings were obtained:
• The mated scores are, on average, not much impacted by face age progression in all tested face recognition systems.
• The non-mated scores, on average, become significantly higher proportional to the age in all tested systems.
• The EER and different FNMR rates at relevant FMR rates increase proportional to the age in all tested systems.
• Subjects classified as female have higher EER as well as FNMR rates than males at all age groups, with some exceptions in the youngest group (ages 1–4).
• The race of the subjects has an impact on the systems, and performance across all races worsens as the age of the subjects decreases. Black and Asian subjects have especially high EER and FNMR rates compared to White and Latino-Hispanic subjects and children.
Future research will focus on improving child face recognition performance and reducing its demographic differentials by utilizing the proposed HDA-SynChildFaces database for algorithm training.
Data availability statement
The raw data supporting the conclusion of this article will be made available by the authors, without undue reservation.
Author contributions
MF: investigation, methodology, software, visualization, and writing–original draft. AB: investigation, methodology, software, visualization, and writing–original draft. MI: methodology, project administration, supervision, and writing–review and editing. CR: conceptualization, methodology, project administration, supervision, and writing–review and editing.
Funding
The author(s) declare financial support was received for the research, authorship, and/or publication of this article. This research is based upon work supported by the H2020 TReSPAsS-ETN Marie Skłodowska-Curie early training network (grant agreement 860813), by the Hessian Ministry of the Interior and Sport in the course of the Bio4ensics project, and by the German Federal Ministry of Education and Research and the Hessian Ministry of Higher Education, Research, Science, and the Arts within their joint support of the National Research Center for Applied Cybersecurity, ATHENE.
Conflict of interest
The authors declare that the research was conducted in the absence of any commercial or financial relationships that could be construed as a potential conflict of interest.
Publisher’s note
All claims expressed in this article are solely those of the authors and do not necessarily represent those of their affiliated organizations, or those of the publisher, the editors, and the reviewers. Any product that may be evaluated in this article, or claim that may be made by its manufacturer, is not guaranteed or endorsed by the publisher.
Footnotes
1https://www.europarl.europa.eu/RegData/etudes/BRIE/2020/659360/EPRS_BRI(2020)659360_EN.pdf
2https://www.europarl.europa.eu/RegData/etudes/BRIE/2022/738224/EPRS_BRI(2022)738224_EN.pdf
3https://github.com/deepinsight/insightface
4https://github.com/IrvingMeng/MagFace
References
Alaluf, Y., Patashnik, O., and Cohen-Or, D. (2021). Only a matter of style: age transformation using a style-based regression model. ACM Trans. Graph. 40, 1–12. doi:10.1145/3450626.3459805
Alaluf, Y., Patashnik, O., Wu, Z., Zamir, A., et al. (2023). “Third time’s the charm? image and video editing with StyleGAN3,” in Computer Vision – ECCV 2022 Workshops (Berlin, Germany: Springer), 204–220.
Bahmani, K., and Schuckers, S. (2022). “Face recognition in children: a longitudinal study,” in Intl. Workshop on Biometrics and Forensics (IWBF), Salzburg, Austria, 20-21 April 2022 (IEEE), 1–6.
Best-Rowden, L., Hoole, Y., and Jain, A. (2016). “Automatic face recognition of newborns, infants, and toddlers: a longitudinal evaluation,” in Intl. Conf. of the Biometrics Special Interest Group (BIOSIG), Darmstadt, Germany, 21-23 September 2016 (IEEE), 1–8.
Chandaliya, P. K., and Nain, N. (2022). ChildGAN: face aging and rejuvenation to find missing children. Pattern Recognit. 129, 108761. doi:10.1016/j.patcog.2022.108761
Colbois, L., de Freitas Pereira, T., and Marcel, S. (2021). “On the use of automatically generated synthetic image datasets for benchmarking face recognition,” in IEEE Intl. Joint Conf. on Biometrics (IJCB), Shenzhen, China, 04-07 August 2021 (IEEE), 1–8.
Daugman, J. (2000). Biometric decision landscapes. Tech. Report. England: University of Cambridge Computer Laboratory.
Deb, D., Nain, N., and Jain, A. K. (2018). “Longitudinal study of child face recognition,” in Intl. Conf. on Biometrics (ICB), Gold Coast, QLD, Australia, 20-23 February 2018 (IEEE), 225–232.
Deng, J., Guo, J., Ververas, E., Kotsia, I., and Zafeiriou, S. (2020). “RetinaFace: single-shot multi-level face localisation in the wild,” in IEEE/CVF Conference on Computer Vision and Pattern Recognition (CVPR), Seattle, WA, USA, 13-19 June 2020 (IEEE).
Deng, J., Guo, J., Xue, N., and Zafeiriou, S. (2019). “ArcFace: additive angular margin loss for deep face recognition,” in IEEE/CVF Conf. on Computer Vision and Pattern Recognition (CVPR), Long Beach, CA, USA, 15-20 June 2019 (IEEE), 4685–4694.
Drozdowski, P., Rathgeb, C., Dantcheva, A., Damer, N., and Busch, C. (2020). Demographic bias in biometrics: a survey on an emerging challenge. Trans. Technol. Soc. (TTS) 1, 89–103. doi:10.1109/tts.2020.2992344
Grimmer, M., Raghavendra, R., and Busch, C. (2021). Deep face age progression: a survey. IEEE Access 9, 83376–83393. doi:10.1109/access.2021.3085835
Grother, P., Ngan, M., and Hanaoka, K. (2019). Face recognition vendor test part 3: demographic effects. Gaithersburg, MD: NIST. doi:10.6028/NIST.IR.8280
Harvey, A., and LaPlace, J. (2021). Exposing.ai. Available at: https://exposing.ai (Accessed April 23, 2023).
He, S., Liao, W., Yang, M. Y., and Song, Y. Z. (2021). “Disentangled lifespan face synthesis,” in IEEE/CVF Intl. Conf. on Computer Vision (ICCV), Montreal, QC, Canada, 10-17 October 2021 (IEEE), 3857–3866.
Huang, G. B., Mattar, M., Berg, T., and Learned-Miller, E. (2008). “Labeled faces in the wild: a database for studying face recognition in unconstrained environments,” in Workshop on faces in’Real-Life’Images: detection, alignment, and recognition, Marseille, France, 16 September 2008.
Ibsen, M. (2023). HDA synthetic children face database. Available at: https://dasec.h-da.de/hda-synthetic-children-face-database/ (Accessed April 17, 2023).
ISO (2021). ISO/IEC 19795-1:2021. Information technology – biometric performance testing and reporting – Part 1: principles and framework (Geneva, Switzerland: International Organization for Standardization).
Karras, T., Aittala, M., Laine, S., and Härkönen, E. (2021). Alias-free generative adversarial networks. Adv. Neural Inf. Process. Syst. 34, 852–863.
Li, Z., Jiang, R., and Aarabi, P. (2021). “Continuous face aging via self-estimated residual age embedding,” in IEEE/CVF Conf. on Computer Vision and Pattern Recognition (CVPR), 20-25 June 2021 (IEEE), 15003–15012.
Lin, J., Zhang, R., Ganz, F., Han, S., and Zhu, J. Y. (2021). “Anycost GANs for interactive image synthesis and editing,” in IEEE Conf. on Computer Vision and Pattern Recognition (CVPR), Nashville, TN, USA, 20-25 June 2021 (IEEE).
Luccioni, A. S., Corry, F., Sridharan, H., Ananny, M., Schultz, J., and Crawford, K. (2022). “A framework for deprecating datasets: standardizing documentation, identification, and communication,” in ACM Conf. on Fairness, Accountability, and Transparency (Association for Computing Machinery), 20 June 2022 (New York, NY, United States: ACM), 199–212.
Medvedev, I., Shadmand, F., and Gonçalves, N. (2023). Young labeled faces in the wild (YLFW): a dataset for children faces recognition. Available at: https://arxiv.org/abs/2301.05776 (Accessed April 23, 2023).
Melzi, P., Rathgeb, C., Tolosana, R., Vera-Rodriguez, R., Lawatsch, D., Domin, F., et al. (2023a). “Gandiffface: controllable generation of synthetic datasets for face recognition with realistic variations,” in International Conference on Computer Vision Workshops (ICCVW) (IEEE), 3078–3087.
Melzi, P., Rathgeb, C., Tolosana, R., Vera-Rodriguez, R., Morales, A., Lawatsch, D., et al. (2023b). “Synthetic data for the mitigation of demographic biases in face recognition,” in International Joint Conference on Biometrics (IJCB), Ljubljana, Slovenia, 25-28 September 2023 (IEEE), 1–9.
Meng, Q., Zhao, S., Huang, Z., and Zhou, F. (2021). “Magface: a universal representation for face recognition and quality assessment,” in IEEE/CVF Conf. on Computer Vision and Pattern Recognition (CVPR), Nashville, TN, USA, 20-25 June 2021 (IEEE), 14220–14229.
Or-El, R., Sengupta, S., Fried, O., Shechtman, E., and Kemelmacher-Shlizerman, I. (2020). “Lifespan age transformation synthesis,” in Proceedings of the European Conference on Computer Vision (ECCV) (Berlin, Germany: Springer), 739–755.
Razzaq, A. N., Ghazali, R., and El Abbadi, N. K. (2021). “Face recognition - extensive survey and recommendations,” in 2021 Intl. Congress of Advanced Technology and Engineering (ICOTEN), Taiz, Yemen, 04-05 July 2021 (IEEE), 1–10.
Research and Development Unit (2015). Best practice technical guidelines for automated border control (ABC) systems. Tech. Report. Warsaw, Poland: FRONTEX.
Ricanek, K., Bhardwaj, S., and Sodomsky, M. (2015). “A review of face recognition against longitudinal child faces,” in Intl. Conf. of the Biometrics Special Interest Group (BIOSIG), Darmstadt, Germany, 9-11 September 2015, 15–26.
Ruiz, N., Chong, E., and Rehg, J. M. (2018). “Fine-grained head pose estimation without keypoints,” in IEEE Conf. on Computer Vision and Pattern Recognition (CVPR) Workshops (IEEE), 2155–215509.
Serengil, S. I., and Ozpinar, A. (2021). “HyperExtended LightFace: a facial attribute analysis framework,” in Intl. Conf. on Engineering and Emerging Technologies (ICEET), Istanbul, Turkey, 27-28 October 2021 (IEEE), 1–4.
Shen, Y., Yang, C., Tang, X., and Zhou, B. (2022). InterFaceGAN: interpreting the disentangled face representation learned by GANs. IEEE Trans. Pattern Analysis Mach. Intell. (TPAMI) 44, 2004–2018. doi:10.1109/tpami.2020.3034267
Song, J., Zhang, J., Gao, L., Zhao, Z., and Shen, H. T. (2022). AgeGAN++: face aging and rejuvenation with dual conditional GANs. IEEE Trans. Multimedia 24, 791–804. doi:10.1109/TMM.2021.3059336
Srinivas, N., Ricanek, K., Michalski, D., Bolme, D. S., and King, M. (2019). “Face recognition algorithm bias: performance differences on images of children and adults,” in IEEE/CVF Conf. on Computer Vision and Pattern Recognition Workshops (CVPRW), Long Beach, CA, USA, 16-17 June 2019 (IEEE), 2269–2277.
Terhörst, P., Kolf, J. N., Damer, N., Kirchbuchner, F., and Kuijper, A. (2020). “SER-FIQ: unsupervised estimation of face image quality based on stochastic embedding robustness,” in IEEE/CVF Conf. on Computer Vision and Pattern Recognition (CVPR), Seattle, WA, USA, 13-19 June 2020 (IEEE), 5650–5659.
The Rise and Fall (2022). The rise and fall (and rise) of datasets. Nat. Mach. Intell. 4, 1–2. doi:10.1038/s42256-022-00442-2
Wang, M., and Deng, W. (2021). Deep face recognition: a survey. Neurocomputing 429, 215–244. doi:10.1016/j.neucom.2020.10.081
Wang, M., Deng, W., Hu, J., Tao, X., and Huang, Y. (2019). “Racial faces in the wild: reducing racial bias by information maximization adaptation network,” in IEEE/CVF Intl. Conf. on Computer Vision (ICCV) (IEEE), 692–702.
Zhang, C., Liu, S., Xu, X., and Zhu, C. (2019). “C3AE: exploring the limits of compact model for age estimation,” in IEEE/CVF Conf. on Computer Vision and Pattern Recognition (CVPR), Long Beach, CA, USA, 15-20 June 2019 (IEEE), 12579–12588.
Zhou, H., Hadap, S., Sunkavalli, K., and Jacobs, D. (2019). “Deep single-image portrait relighting,” in IEEE/CVF Intl. Conf. on Computer Vision (ICCV), Seoul, Korea, 27 October 2019 - 02 November (IEEE), 7193–7201.
Keywords: biometrics, face recognition, children, synthetic data, generative adversarial networks
Citation: Falkenberg M, Bensen Ottsen A, Ibsen M and Rathgeb C (2024) Child face recognition at scale: synthetic data generation and performance benchmark. Front. Sig. Proc. 4:1308505. doi: 10.3389/frsip.2024.1308505
Received: 06 October 2023; Accepted: 09 April 2024;
Published: 20 May 2024.
Edited by:
Evlampios Apostolidis, Information Technologies Institute, GreeceReviewed by:
Cecilia Pasquini, Bruno Kessler Foundation (FBK), ItalyMoises Diaz, University of Las Palmas de Gran Canaria, Spain
Copyright © 2024 Falkenberg, Bensen Ottsen, Ibsen and Rathgeb. This is an open-access article distributed under the terms of the Creative Commons Attribution License (CC BY). The use, distribution or reproduction in other forums is permitted, provided the original author(s) and the copyright owner(s) are credited and that the original publication in this journal is cited, in accordance with accepted academic practice. No use, distribution or reproduction is permitted which does not comply with these terms.
*Correspondence: Mathias Ibsen, bWF0aGlhcy5pYnNlbkBoLWRhLmRl
†These authors have contributed equally to this work and share first authorship