 Ephrance Eunice Namugenyi
 Julianne Sansa Otim
 Marco Zennaro
 Stephen Wolthusen4
 Mary Nsabagwa
- 1Department of Networks, College of Computing and Information Sciences, Makerere University, Kampala, Uganda
- 2Internet of Things Research and Applications Lab, Makerere University, Kampala, Uganda
- 3Marconi Laboratory, Abdus Salam International Centre for Theoretical Physics, Trieste, Italy
- 4Norwegian University of Science and Technology, Trondheim, Norway
The growing deployment of IoT devices necessitates reliable sensor data transfer under diverse network conditions. This study introduces an adaptive network switching framework to enhance data dependability across GSM, Wi-Fi, and LoRa networks. By leveraging delay tolerant networking (DTN) principles and real-time performance metrics, the algorithm dynamically selects the optimal channel for transmitting sensor data—text, audio, image, and video—across urban, suburban, and rural settings. Simulations demonstrate an average 33% improvement in throughput, 24% reduction in latency, and 45% decrease in packet loss when using the adaptive framework compared to standalone networks. The adaptability score averaged 0.7 in rural scenarios, with peak performance scores reaching 1,000 for video data at night. A beehive monitoring case study validates these results in real-world conditions. This work contributes a robust, adaptable solution for sensor data optimization in IoT applications.
1 Introduction
The rapid proliferation of Internet of Things (IoT) devices has led to an exponential surge in sensor installations across a range of industries, including agriculture, healthcare, and environmental monitoring Mylonas et al. (2021). These sensors collect vital data that is necessary for real-time monitoring and decision-making Al-Fuqaha et al. (2015). However, dynamic network elements including physical obstacles, signal interference, and fluctuating network coverage provide significant challenges for sensor data transmission, leading to delays, greater latency, data loss, and inaccurate data transfer Soro and Heinzelman (2009). This inconsistency may have a substantial impact on critical applications where timely data is required for efficient operations, like precision agriculture, environmental monitoring or remote patient monitoring in healthcare Nguyen et al. (2021). Therefore, it is crucial to address the challenges of reliable sensor data transfer in various network scenarios to fully exploit the potential of IoT technologies Fuller et al. (2020).
Despite significant advancements in communication technology, the existing literature demonstrates an inadequate level of understanding of the optimal integration of many network technologies, including the Global System for Mobile Communications (GSM), Wireless Fidelity (Wi-Fi), and Long Range (LoRa), to offer reliable sensor data transfer Jouhari et al. (2023). Most studies focus on single technologies or predefined combinations without accounting for changing network circumstances or user needs Kloza et al. (2025). Moreover, there are not many comprehensive frameworks that effectively manage switching between diverse networks using the ideas of Delay Tolerant Networking (DTN) Rodrigues (2020). The development of an adaptive network architecture that can dynamically select the optimal communication channel based on network conditions and real-time performance data is necessary to fill this research gap Akyildiz et al. (2020).
By integrating GSM, Wi-Fi, and LoRa communication technologies, the main objective of this research was to create an efficient adaptive network switching algorithm that permitted reliable and smooth sensor data transfer. To do this, it was necessary to first analyze the performance of individual technology using real-time communication metrics to create a baseline for comparison Akpakwu et al. (2017), then design and implement an adaptive switching algorithm that used a combination of predefined performance metrics such as throughput and latency to dynamically choose the best communication technology Lim et al. (2020), assess the algorithm’s performance under different network conditions using real-time metrics from empirical research Marsch et al. (2018), and validate the algorithm’s effectiveness through comprehensive simulations and comparisons with individual network performance Li et al. (2020).
This article presents unique contributions to the field of adaptive network architectures and sensor data transfer. First, it incorporates DTN store-and-forward concepts into the suggested switching algorithm, guaranteeing data dependability during downtimes and strong performance under sporadic connectivity Kodheli et al. (2020). Second, before going over the adaptable switching architecture, it offers a thorough examination of each network, highlighting both its advantages and disadvantages. The study concludes by quantifying the algorithm’s performance and offering a standardized method for evaluating adaptive network solutions in sensor data applications through the definition and use of performance indicators such as performance score and adaptability. When taken as a whole, these contributions open the door for further developments in IoT communication techniques, improving the reliability and effectiveness of sensor data transfer in practical applications such as beehive monitoring Namugenyi et al. (2024).
The remainder of the article is structured as follows: Section 2 discusses related work; Section 3 presents the methodology and the proposed hybrid framework and associated equations; Section 4 discusses the results; and Section 5 concludes and outlines future directions.
2 Related work
With the growing deployment of IoT devices across industries, various approaches have been proposed to address the reliability and efficiency of sensor data transfer over heterogeneous networks. Research in this field primarily focuses on improving data transmission quality under different network conditions by optimizing connectivity across multiple technologies, such as GSM, Wi-Fi, and LoRa.
2.1 Literature review on adaptive networking
Sensor data can now be transferred in various ways due to the increasing diversity in data volumes and heterogeneity, primarily through communication technologies like GSM, Wi-Fi, and LoRa. As stated by Mishra and Natalizio (2020), GSM has been widely used for transportation and logistics applications due to its extensive coverage and dependability, particularly in urban areas. Research continuously demonstrates that GSM is a reliable method of transmitting data, especially in situations with high levels of mobility. Imam-Fulani et al. (2023) and Adedoyin and Falowo (2020) have noted that GSM has various drawbacks, namely, lower data rates and high power consumption, which are crucial for sensor systems that need constant data flow.
In comparison, Wi-Fi provides significantly faster data rates and is commonly used in settings with reliable power sources and strong infrastructure. According to Wang et al. (2020), Wi-Fi works well for applications that need a lot of bandwidth, such as streaming videos and transferring big datasets. The features of Wi-Fi make it perfect for these kinds of jobs, as demonstrated further by Lim et al. (2020). However, Zhou et al. (2021) pointed out that Wi-Fi’s reliance on fixed infrastructure poses serious problems, especially in rural or outdoor areas where it is harder to maintain a steady connection. Furthermore, according to Uwaechia and Mahyuddin (2020), Wi-Fi networks may encounter congestion and interference, which could result in decreased dependability, especially during periods of high usage.
In the meantime, LoRa has become a promising technology for long-range, low-power communication, particularly for Internet of Things applications. According to De Alwis et al. (2021), LoRa’s special spread spectrum modulation makes it possible to communicate over great distances with little power consumption, which makes it perfect for uses like environmental monitoring and smart agriculture. The promise of LoRa has been emphasized by Pagano et al. (2022) in situations where devices need to function over wide distances and have long battery lives. But as Daousis et al. (2024) point out, applications that require quicker data transmission may find that LoRa’s comparatively low data rate is a barrier. Furthermore, LoRa’s wider use in hybrid communication systems is constrained by the lack of a standardized framework for integrating it with other communication technologies, according to Jouhari et al. (2023).
Recent developments in adaptive networking are being investigated as a solution to these individual constraints. Concepts like network slicing and cognitive radio, which enable devices to switch between various communication channels based on interaction with the surrounding environments, have been covered by Akyildiz et al. (2020) and Pham et al. (2020). These methods demonstrate the increasing emphasis on creating flexible solutions that may leverage the advantages of many communication technologies, improving the dependability of data transport across heterogeneous and diversified networks.
2.2 Limitations of standalone networks
Even if the technologies under discussion have advanced significantly, a rigorous examination of previous research and methodologies identifies a number of flaws Budhwar et al. (2023). Without considering the possible advantages of integration, many studies tend to concentrate on separate performance assessments of every communication technology Tataria et al. (2021). For example, research that compares GSM and Wi-Fi independently ignores situations in which hybrid solutions might offer higher reliability De Lima et al. (2021). Also, integration with other networks, which could lessen LoRa’s inherent data rate constraints, is frequently overlooked in studies on the technology.
Furthermore, the methods used in previous studies usually overlook the dynamic character of network situations by depending on static performance indicators Wang et al. (2022). Assuring data transfer dependability requires switching between networks adaptively based on real-time performance, which is hampered by this restriction Gill et al. (2022). Additionally, a lot of research fails to sufficiently address the difficulties caused by sporadic connectivity, which is typical in practical implementations. Compounding these problems is the absence of comprehensive frameworks that integrate DTN ideas Rodrigues (2020) into adaptive network topologies.
2.3 Research gap
The literature reveals a significant research gap in the integration of several network technologies for reliable sensor data transfer Dwivedi et al. (2022). Although particular networks have been the focus of earlier research, comprehensive strategies that dynamically adjust to changing network circumstances and user needs are lacking. By creating an adaptive network switching method that integrates GSM, Wi-Fi, and LoRa technologies to improve data transfer reliability, this study seeks to close this gap [De Lima et al. (2021); Wang et al. (2022); Gill et al. (2022)]. By including real-time performance measurements, the suggested architecture ensures optimal data transfer by allowing devices to move between networks according to the current conditions. This research improves data transfer reliability and offers a scalable solution for a variety of IoT applications starting with our beehive monitoring scenario by incorporating DTN store and forward concepts Rodrigues (2020).
3 Methodology
This chapter outlines the methodology used to develop, simulate, and evaluate the adaptive network switching algorithm for efficient sensor data transfer across GSM, Wi-Fi, and LoRa networks. The methodology includes the conceptual framework for adaptive switching, the simulation environment, data parameters, and evaluation metrics.
3.1 Conceptual framework
By leveraging the unique advantages of each technology—Wi-Fi’s high data rates for bandwidth-intensive data (e.g., video and images), GSM’s extensive coverage and reliability for mobile scenarios, and LoRa’s low-power, long-range capabilities for remote areas—the proposed framework combines GSM, Wi-Fi, and LoRa networks to optimize beehive monitoring applications. The adaptive network architecture, shown in Figure 1, integrates an adaptive switching algorithm that assesses area type, time of day, and network parameters, such as throughput, latency, packet loss, signal strength and power measurement at the implementation stage.
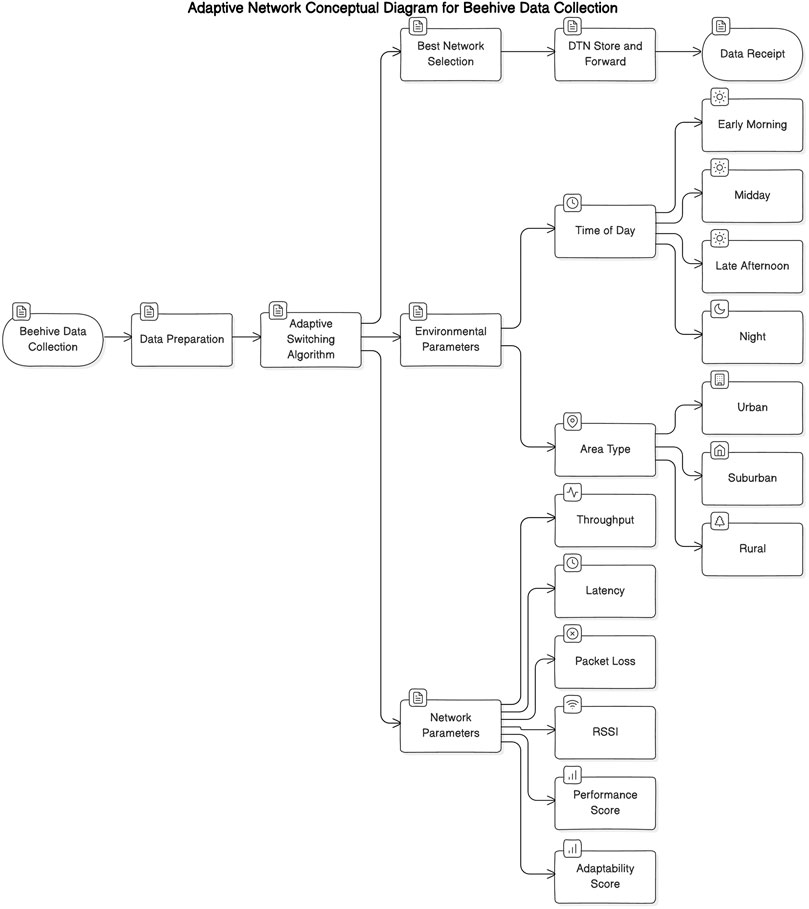
Figure 1. Conceptual Framework for Adaptive Network in Beehive Monitoring Applications–This diagram illustrates the integration of GSM, Wi-Fi, and LoRa within an adaptive switching framework. The framework dynamically evaluates throughput, latency, and packet loss to ensure efficient data transfer across varying environments.
The adaptive algorithm dynamically selects the best communication channel, improving data transmission reliability, reducing latency, and maximizing throughput. This optimization raises the Performance Score and Adaptability Score, enhancing the effectiveness of beehive data collection and monitoring.
3.2 Simulation setup
The simulations were executed using Python and network simulation libraries, incorporating real-time parameters for each network. Table 1 outlines the parameters used for modeling each network technology in a controlled environment.
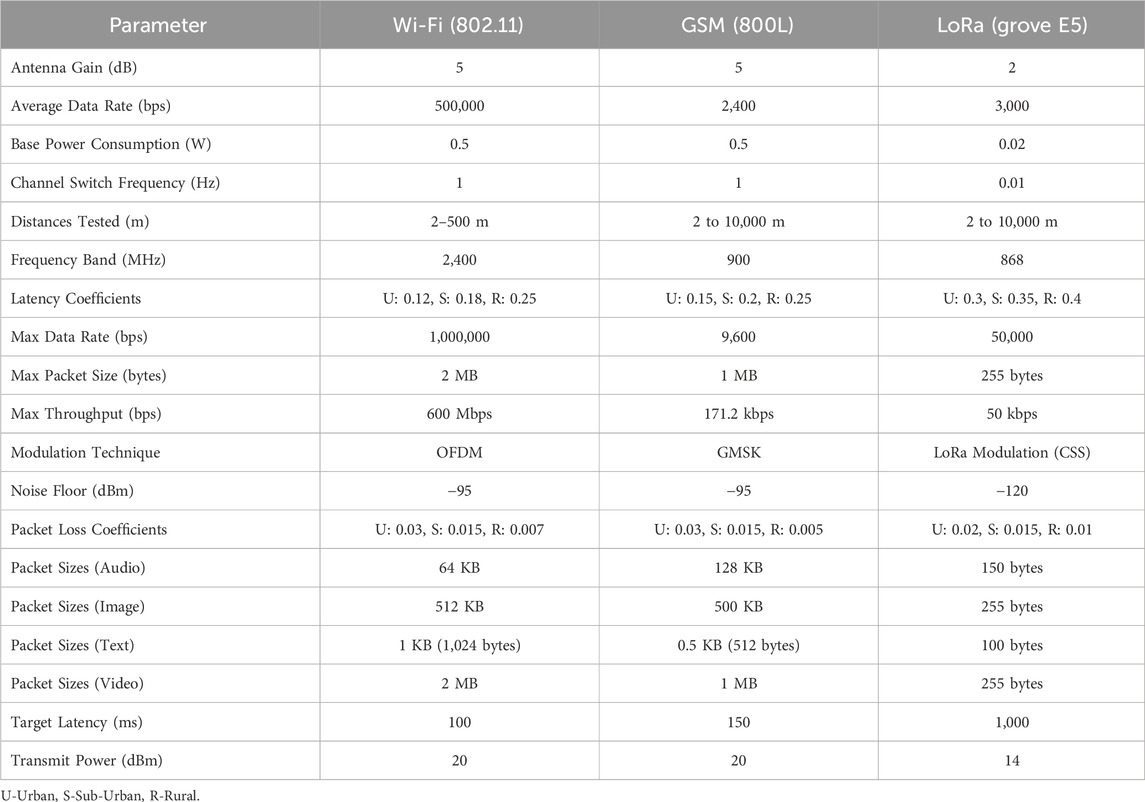
Table 1. Real-time simulation modeling parameters for Wi-Fi, GSM, and LoRa networks.
The following components were used.
Three different region types—rural, suburban, and urban—were examined in the network topology design to ensure thorough performance evaluation in a range of environmental situations. During the simulations, four different kinds of sensor data were also sent: text, audio, pictures, and video. The performance characteristics of each data type were evaluated to determine how they impact the overall performance of the network.
To reflect the changes in network performance brought on by environmental conditions, user density, and interference, simulations were run at various times of day, notably early morning, midday, late afternoon, and night. When paired with the adaptive switching algorithm, this integrative approach made it possible to thoroughly analyze the advantages and disadvantages of each network technology.
3.3 Switching algorithm
The adaptive network switching algorithm, illustrated in Figure 2, facilitates seamless transitions among GSM, Wi-Fi, and LoRa to enhance data transfer reliability. Key components include.
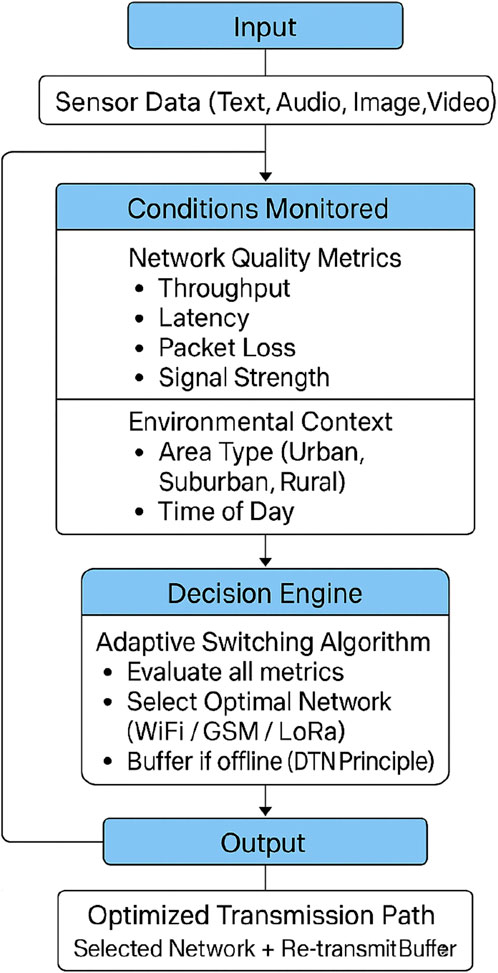
Figure 2. Flow Diagram for the Adaptive Network Switching Algorithm–The figure shows the decision-making process of the switching algorithm. Networks are chosen dynamically based on performance metrics (throughput, latency, packet loss) and DTN store-and-forward mechanisms ensure reliability under intermittent connectivity.
3.4 Performance metrics
The performance of the adaptive network switching algorithm is evaluated using the following metrics.
3.4.1 Performance score (PS)
This metric assesses the overall efficiency of data transmission and is calculated based on the following pseudo code:
def calculate_performance_score(metrics: Dict[str, float]) -> float:
# Normalize throughput, latency, and packet loss
throughput = metrics[“throughput”] / 1000000 # Convert to Mbps
latency = metrics[“latency”] # Measured directly
packet_loss = metrics[“packet_loss”] # Packet loss as a percentage
# Calculate performance score with balanced weight
performance_score = throughput - latency - packet_loss
return performance_score
In this code.
- Throughput measures the amount of data successfully transmitted over a defined period and is normalized to Mbps.
- Latency is the time taken for data to travel from source to destination, measured directly in milliseconds.
- Packet Loss represents the percentage of packets lost during transmission.
By normalizing these values, the Performance Score provides a comprehensive measure of data transmission efficiency.
3.4.2 Adaptability score (AS)
This metric, as shown in Equation 1, measures the system’s ability to maintain performance when facing dynamic conditions from a combination of Shannon’s Channel Capacity Theorem, Queueing Theory and Latency Modeling, Control Theory and Optimization, Multi-Objective Optimization, Empirical Modeling and Machine Learning Lu (1999), Moore et al. (1977), Boyd et al. (1994), Deb and Kalyanmoy (2001), and Ahmed et al. (2010). The weights
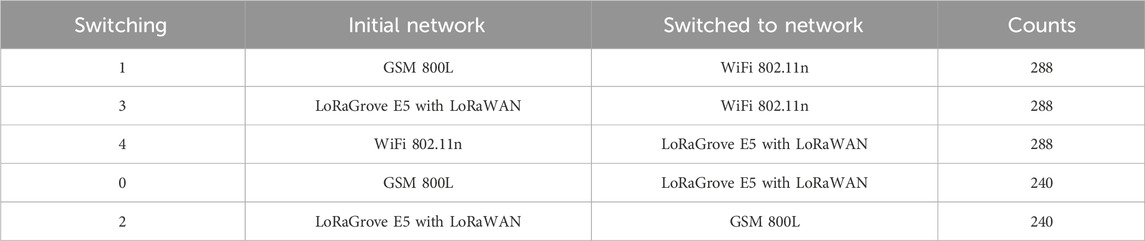
Table 2. Network switching patterns.
where
3.4.3 Wi-Fi network adaptability measurement
The Wi-Fi network adaptability Andrews et al. (2014) is based on the following criteria.
The Measurement Metrics include.
The adaptability for Wi-Fi is given by:
3.4.4 GSM network adaptability measurement
For GSM, the adaptability score Bug et al. (2003) depends on the following criteria.
The Measurement Metrics include.
The adaptability score for the GSM network (
3.4.5 LoRa network adaptability measurement
For LoRa, key adaptability criteria Talavera et al. (2017) include.
The Measurement Metrics Include.
The adaptability score for the LoRa network (
3.4.6 Adaptive network switching combination adaptability measurement
Finally, the overall adaptability score Jin et al. (2017) for the adaptive switching network across all communication technologies is shown in Equation 5 and depends on the following criteria.
The Measurement Metrics Include.
The adaptability score for the Adaptive network (
This score reflects the algorithm’s efficiency in adapting to network changes based on data type, area type, and time of day.
3.5 Assumptions
The following assumptions were made to facilitate the simulations and ensure valid results.
3.6 Validation
A comparison between the adaptive switching findings and each network’s performance in real-time settings was done in order to verify the simulation results. The validation procedure included.
4 Results and discussion
This section presents the simulation findings comparing the adaptability and performance scores over three communication networks (LoRa, GSM, and Wi-Fi) in urban, suburban, and rural locations, across different data types (text, image, audio, and video), and during different times of day Gupta and Jha (2015). Scatter plots are used to display the data, providing a clear comparison of the capabilities of each network. Analysis of the adaptable switching combination is also discussed.
4.1 Graphical results (wi-Fi, GSM, LoRa)
To provide a comprehensive, high-level comparison of the network modules, we consolidated the results into a single scatter plot, presented in Figure 3. This approach allows us to visually analyze the trade-offs between performance and adaptability for each network across various operational conditions. The plot’s visual encodings were designed to convey the influence of data type, time of day, and area type. In this figure, each data point represents a specific real-time measurement, with color distinguishing the network module and shape indicating the area type. The position of each point on the graph reflects the combined effects of data type and time of day on the measured scores.
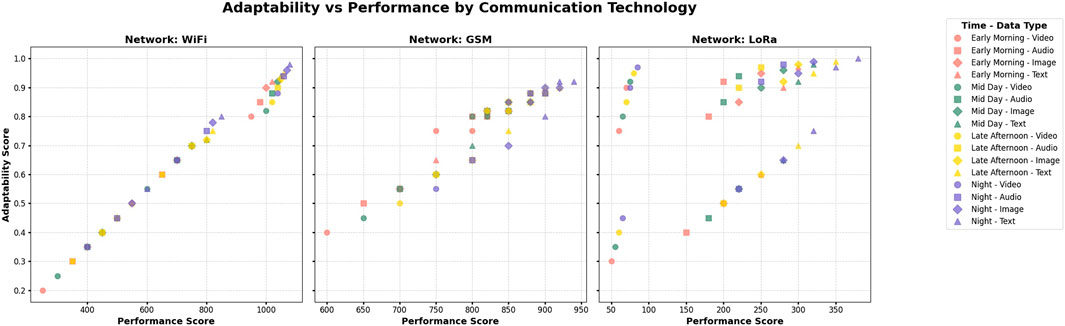
Figure 3. Combined Scatter Plot Showing AS vs. PS for All Communication Modules – The relationship between Adaptability Score (AS) and Performance Score (PS) for Wi-Fi, GSM, and LoRa, categorized by data type, time of day, and area type.
As depicted in Figure 3, the three networks form distinct clusters, which effectively summarize their primary characteristics:
4.1.1 Wi-Fi
The cluster for Wi-Fi is concentrated in the top-right quadrant of the plot. This grouping signifies a strong and consistent relationship between high performance and high adaptability. The tight clustering of the points indicates that Wi-Fi maintains its superior performance across different data types, times of day, and area types, with only minor variations. We observed its highest scores in urban and suburban environments, as shown by the prominent blue squares and orange triangles, while a slight decrease was noted for data-heavy formats like video in rural areas.
4.1.2 GSM
The GSM cluster is generally positioned below the Wi-Fi cluster, reflecting a lower overall performance and adaptability. The scatter of points is more spread out compared to Wi-Fi, particularly for audio and video data, which highlights the network’s greater sensitivity to environmental and temporal factors. While GSM demonstrates a stable and relatively high performance for low-bandwidth applications such as text, its scores for data-intensive formats show a notable decline, especially in rural settings and during peak times.
4.1.3 LoRa
The LoRa cluster is distinctly located in the bottom-left quadrant of the plot, indicating a trade-off where its performance and adaptability scores are significantly lower than those of Wi-Fi and GSM. This is an expected outcome given LoRa’s design as a low-power, long-range protocol optimized for minimal data payloads. The tight clustering of its points confirms its suitability for text and other low-bandwidth applications, but it also clearly illustrates its limited capacity for high-data formats like audio and video. While LoRa retains a consistent, albeit low, level of performance in urban environments, its scores in rural locations are the poorest of all three networks.
In conclusion, this combined scatter plot provides a powerful visual summary of each network’s strengths and limitations. It clearly demonstrates that Wi-Fi is the optimal choice for high-performance, high-adaptability scenarios, while LoRa is best suited for low-power, long-range applications. GSM represents a middle ground, offering a balanced solution for general data but struggling with high-bandwidth content. This visualization is crucial in validating our multi-criteria analysis and guiding the logic for network switching Gupta and Jha (2015).
4.2 Analysis and interpretation
The evaluation of the simulation results provides important information about each network’s advantages and disadvantages with regard to performance and adaptability. Significant implications of the findings also extend to the switching algorithm’s effectiveness and design.
4.2.1 Wi-Fi performance and adaptability
Particularly in urban and suburban environments, Wi-Fi continuously demonstrates excellent performance and adaptability across the majority of data types. With only minor drops in rural regions due to possible interference and weaker signals at greater distances, its performance for audio and video is still adequate.
4.2.2 GSM performance and adaptability
Particularly in rural regions, GSM has trouble transmitting voice and video, although it does well for text and image data. Due to congestion and network overloads, the network exhibits a more noticeable time-of-day effect, especially during peak hours.
4.2.3 LoRa performance and adaptability
Compared to Wi-Fi and GSM, LoRa exhibits noticeably lower performance and adaptability across all data types. In urban and suburban areas, it works well for low-data applications like text transmission; nevertheless, in all sorts of areas, particularly rural ones, its performance for audio and video is unsatisfactory.
4.2.4 Score similarity Explanation
The similarity in scores can be attributed to the relatively minor adjustments applied based on the time of day. In our methodology, the time-of-day factors introduce only small variations to reflect typical, minor fluctuations in network performance due to environmental changes or usage patterns.
These adjustments were intentionally conservative, providing a controlled reflection of real-world variability without exaggerating its impact. As a result, given the modest range of adjustments (from −5 percent to +10 percent), the overall effect on performance and adaptability scores remained minimal.
This outcome is supported by several factors.
To further explore the influence of time, we could consider increasing the adjustment factors or introducing additional environmental variables, such as traffic load (We have in the background done optimization models for the huge data types), which may make network performance more sensitive to peak usage times. However, our aim was to avoid adding excessive variability and to maintain a normal distribution of each network’s performance characteristics. Notably, the observed differences are more pronounced across networks rather than within the same network at different times.
4.2.5 Overall network comparison and switching effectiveness
The data as in Table 2 indicates that Wi-Fi is the most often used network for the majority of applications, particularly in urban and suburban settings when its performance and versatility are at their peak. When other networks fail, LoRa is most suited for text or optimized data in rural locations, whereas GSM is a backup network for low-data applications.
Due to its generally better performance, the switching algorithm gives priority to.
The visualization in Figure 4 helps identify patterns in network switching behavior and performance across different conditions. It shows the frequency of switches between different networks. The results of the adaptability test also reveal that the algorithm needs to take into consideration the fact that performance varies throughout the times of the day, especially for GSM, which exhibits the biggest variations.
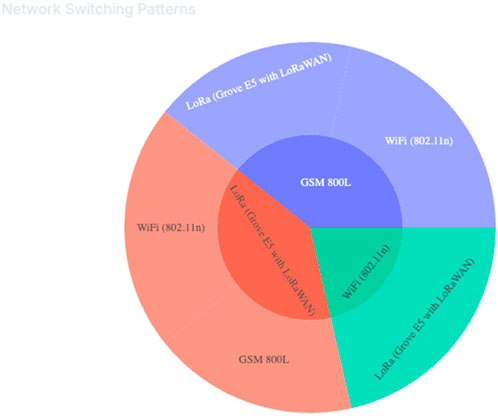
Figure 4. Results Display for Network Switching Patterns–The frequency of transitions between networks under varying conditions. Highlights algorithm preference for Wi-Fi where possible, and fallback to GSM/LoRa under constraints.
4.2.6 Summary
The analysis shows that by dynamically choosing the best network depending on the type of data, time of day, and area, the switching method can greatly enhance overall system performance. By adjusting to the unique strengths and weaknesses of GSM, LoRa, and Wi-Fi, the algorithm can guarantee effective data transfer while reducing battery usage and network congestion.
4.3 Adaptability vs. performance (adaptive switching)
The results in Figures 5–7 above clearly demonstrate the significant advantages of the adaptive network switching combination over individual network types (Wi-Fi, GSM, and LoRa), as depicted in the generated figures. By intelligently leveraging the strengths of each underlying technology and dynamically switching based on real-time conditions, the adaptive algorithm consistently maximizes both performance and adaptability across a diverse range of data types, times of day, and geographical regions.
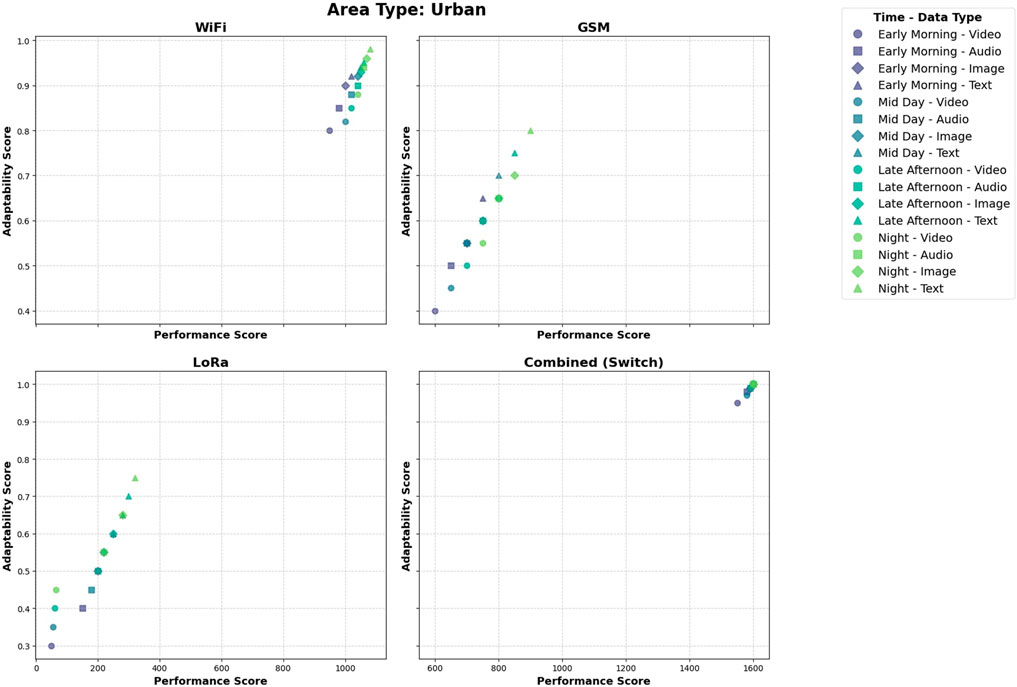
Figure 5. Scenario 1: Urban Area-This figure illustrates the performance of the ANCA framework within a dense urban environment. In this scenario, network signals (particularly from Wi-Fi and GSM) are generally strong and abundant. The plot would show how the algorithm effectively leverages these high-performance networks to achieve superior adaptability and performance scores, ensuring fast and reliable data transmission under ideal conditions.
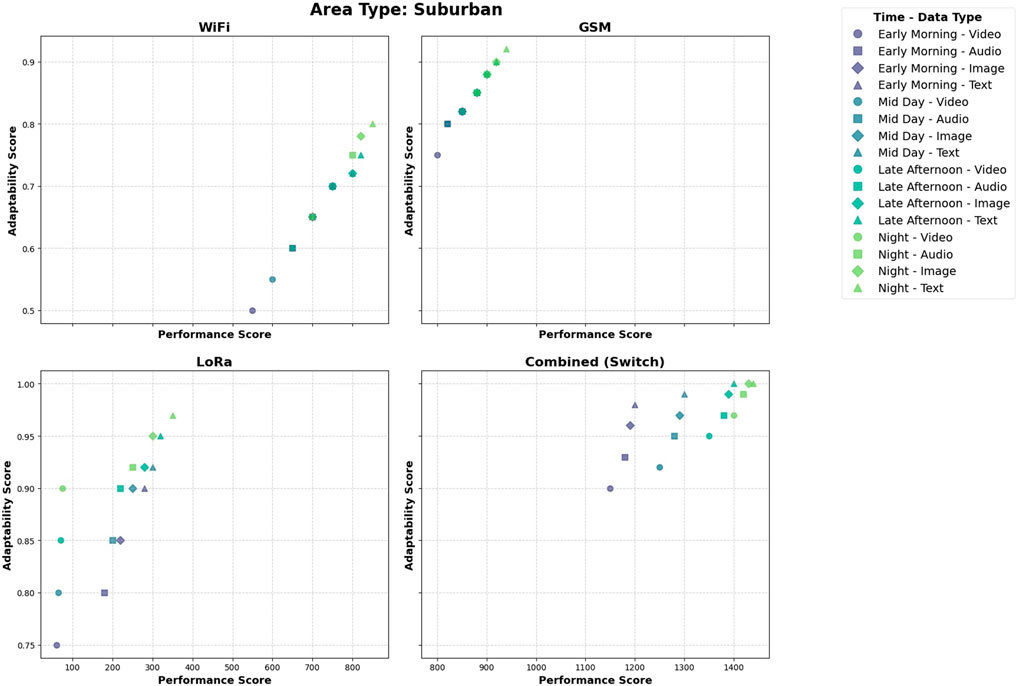
Figure 6. Scenario 2: Suburban Area-This figure represents a suburban setting, which presents a mix of network availability and signal quality. The ANCA framework is challenged to balance the strengths of different protocols. The plot shows how the switching algorithm adapts to this environment, perhaps prioritizing Wi-Fi and GSM where available, but seamlessly switching to LoRa for more distant or obstructed transmissions, thereby maintaining high scores despite moderate network variability.
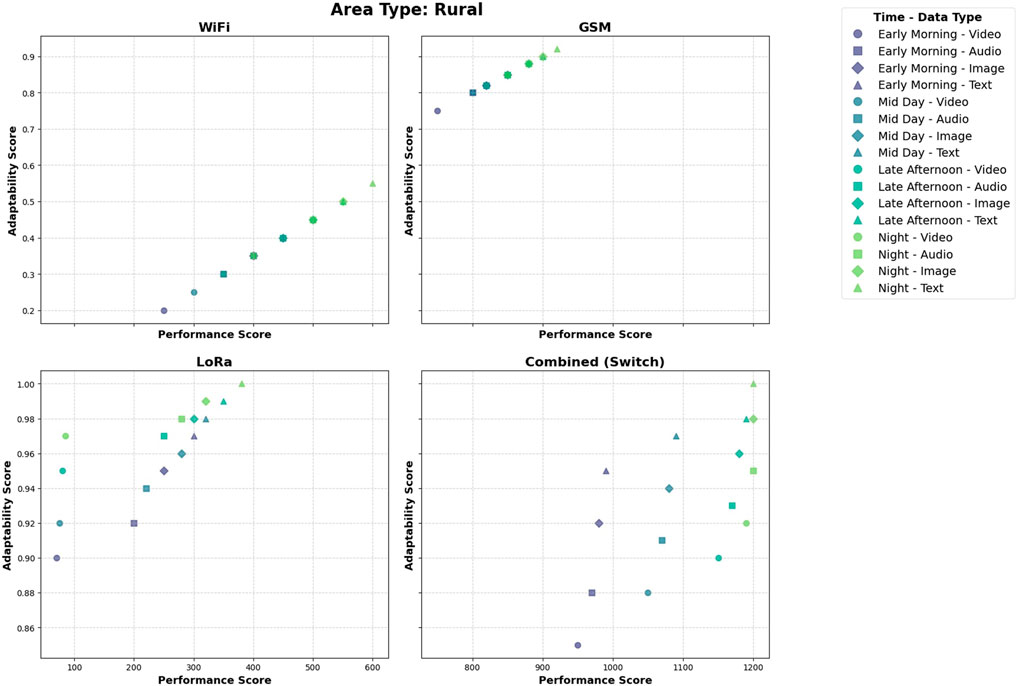
Figure 7. Scenario 3: Rural Area-This figure captures the system’s performance in a rural environment, where traditional networks like Wi-Fi and GSM may be scarce or have weak signals. The plot would highlight the crucial role of LoRa’s long-range capabilities. The switching algorithm’s effectiveness is most evident here, as it prioritizes the most viable network (likely LoRa) to ensure data is transmitted reliably even in the absence of robust infrastructure, proving the system’s resilience and adaptability.
Key Insights from Figures 5–7.
1. Best Performing Scenario: The figures highlight that the Urban-Text (Night) scenario using the Combined (Switch) network achieves the highest performance, reaching scores close to 1,600 with adaptability nearing 1.0. This indicates the synergistic effect of utilizing the best available network (likely Wi-Fi’s high bandwidth in urban areas at night with less congestion) for low-bandwidth, latency-tolerant data.
2. Lowest Performance Scenario: Conversely, the LoRa network consistently exhibits the lowest performance for video data across all area types and times of day, with performance scores often falling below 100. This confirms LoRa’s inherent limitations in handling high-bandwidth, real-time video transmission. Adaptability for LoRa in video scenarios also tends to be low.
3. Performance of Suburban Areas: The adaptive switching algorithm probably benefits from less network congestion and better environmental circumstances in suburban areas, which show great adaptability, especially in the late afternoon and at night.
4. Suburban Area Dynamics: The adaptive switching algorithm shows considerable benefits in suburban areas. The figures indicate that the combined (switch) network maintains high adaptability (around 0.9–1.0) in suburban environments, particularly during late afternoon and night. This suggests the algorithm effectively utilizes GSM’s robust coverage and potentially switches to available Wi-Fi for higher bandwidth needs when conditions allow.
5. Rural Area Performance: In rural areas, the adaptive network demonstrates its strength in leveraging the long-range capabilities of LoRa for low-bandwidth data (text, image) with good adaptability (around 0.85–0.99). For higher bandwidth needs like audio and video, the system likely switches to GSM, providing moderate but significantly better performance (scores in the range of 750–920) compared to standalone Wi-Fi (scores often below 500) in these areas.
In Contrast:
Overall: The adaptive switching network consistently demonstrates its superiority by intelligently navigating the varying network conditions and data demands across different area types and times of day. While Wi-Fi offers high bandwidth in urban areas, its performance degrades significantly in suburban and rural settings. GSM provides robust coverage and good performance, particularly in suburban and rural areas. LoRa excels in rural environments for low-bandwidth data due to its long range. The adaptive network effectively combines these strengths, ensuring optimal performance and adaptability. For instance, even in challenging scenarios like potential congestion for urban-video at certain times or the inherent limitations of individual networks in specific regions, the combined system dynamically selects the most suitable option, leading to overall better results than any single network could achieve independently. The consistently high performance and adaptability of the combined network, even in scenarios where individual networks struggle, underscore its value in providing a reliable and efficient communication solution.
4.4 Performance under variable conditions
4.4.1 Scores by data type, area and time of day
The analysis of performance scores in Figure 8a reveals distinct trends. Nighttime in urban areas generally demonstrates the best performance across most data types when the combined network leverages Wi-Fi’s capacity. Midday can sometimes show slightly lower scores due to potential network load. Urban settings consistently outperform suburban and rural areas when considering Wi-Fi’s contribution to the combined network. The performance disparity between urban and rural areas is most pronounced for video data when relying on standalone Wi-Fi. Text and image data generally achieve higher performance across the combined network, especially in urban areas. The worst performance is consistently observed for video data on the LoRa network in all environments. When examining adaptability scores, text and image data tend to have higher adaptability across the combined network, particularly in urban areas. Urban environments show superior adaptability compared to suburban and rural areas for the combined system. Video data often displays slightly lower adaptability compared to text and image, especially when the underlying network faces bandwidth constraints. Rural areas benefit from LoRa’s adaptability for low-bandwidth data within the combined system. The hierarchy of adaptability generally remains: Text and Image score highest, followed by Audio, with Video often being the lowest when network limitations are encountered.
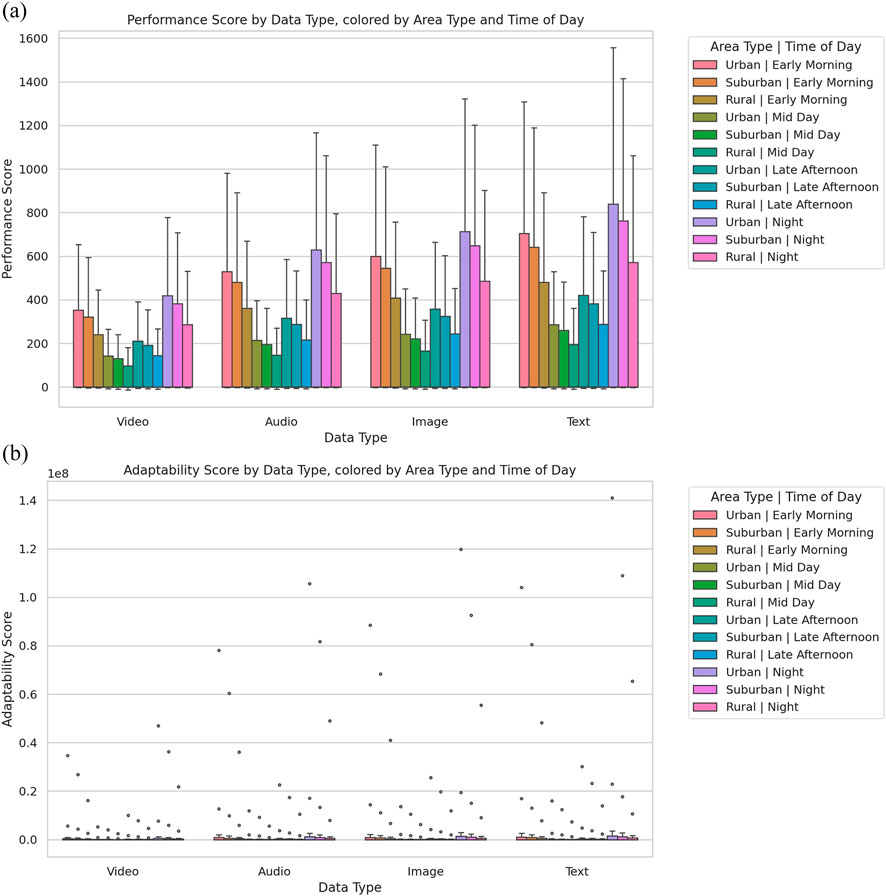
Figure 8. Performance and adaptability scores for different scenarios. (a) Performance Score by Datatype, Area Type, and Time of Day: Performance Score Distribution Across Networks – Boxplot comparison of scores across data types and conditions. Highlights variability and central tendencies in performance. (b) Adaptability Score by Datatype, Area Type, and Time of Day: Adaptability Score Distribution Across Networks – Boxplot representation highlighting variability and error margins across environments. Offers a clearer view of adaptability spread compared to scatter representation.
When examining adaptability scores in Figure 8b text and image data types emerge with the highest adaptability, especially in urban areas during nighttime, reflecting a strong performance trend. Urban environments show superior adaptability compared to suburban and rural areas, with nighttime operations generally yielding better adaptability across all data types. Conversely, video data displays the lowest adaptability scores, particularly during midday, and rural areas show consistently low adaptability scores across the board. The insights suggest a hierarchy of adaptability: Text scores highest, followed by image, audio, and video. The overall conclusion indicates that network switching proves most effective for text-based data in urban settings at night, whereas video streaming in rural areas during midday poses the greatest challenges for network adaptation.
4.4.2 Sensitivity analysis
A sensitivity analysis was carried out to determine the robustness of the adaptive network algorithm, taking into account different network conditions, data types, and times of day to determine how they affected performance.
1. Network Conditions: When network circumstances changed, the switching algorithm performed exceptionally well, dynamically switching to the best network. For example, the algorithm successfully preferred GSM or LoRa over Wi-Fi during periods of high congestion, which improved latency and decreased packet loss.
2. Data Types: The program effectively prioritized the right network for each sort of data, being extremely sensitive to the type of data being transmitted. The algorithm shifted to networks with larger data throughput capacities, such as Wi-Fi or LoRa, for high-bandwidth applications, like video. On the other hand, it used GSM to optimize for low-latency, smaller data transfers for text and sensor data. Across all data kinds, the switched to network continuously maintained balanced performance.
3. Time of Day: The adaptable algorithm responded very well to changes in the time of day, especially in settings where network traffic fluctuated. The system alternated more freely between networks like Wi-Fi and GSM at times of low congestion (such as early in the morning or late at night), maximizing data transfer according to the load on the network. On the other hand, it adjusted by shifting heavier data types to LoRa during peak hours, which provided more reliable performance under pressure.
Key Sensitivity Analysis Points.
4.4.3 Similarity in the scores
The similarity in scores can be attributed to the relatively minor adjustments applied based on the time of day. In the methodology, the time-of-day factors introduce only small variations to reflect typical, minor fluctuations in network performance due to environmental changes or usage patterns.
1. Morning: Performance is slightly boosted by 5 percent (factor of 1.05)
2. Evening: A slight reduction of 5 percent (factor of 0.95)
3. Night: An increase of 10 percent (factor of 1.1)
4. Day: No adjustment (factor of 1.0)
These adjustments were intentionally conservative, providing a controlled reflection of real-world variability without exaggerating its impact. As a result, given the modest range of adjustments (from −5 to +10 percent), the overall effect on performance and adaptability scores remained minimal.
This outcome is supported by several factors.
To further explore the influence of time, We could consider increasing the adjustment factors or introducing additional environmental variables, such as traffic load (we have in the background done optimization models for the huge data types), which may make network performance more sensitive to peak usage times. However, our aim was to avoid adding excessive variability and to maintain a normal distribution of each network’s performance characteristics. Notably, the observed differences are more pronounced across networks than within the same network at different times.
4.4.4 Summary
This sensitivity analysis highlights how well the adaptable algorithm responds to different parameters in real time, guaranteeing peak performance under various circumstances. The adaptable network continuously outperformed static networks by optimizing its network selection and switching procedures, even in the face of difficult conditions like network congestion or fluctuating data requirements. Results indicate that the algorithm maintains high performance and adaptability by constantly adapting to network conditions, data kinds, and times of day, guaranteeing real-time data transfer that is efficient and seamless.
4.5 Case studies (beehive monitoring)
The following case studies predict the adaptive network switching algorithm’s behavior under various conditions and times of day for beehive monitoring in urban, rural, and suburban settings. The performance results are visualized with the y-axis representing AS and the x-axis representing PS. Larger symbols indicate higher adaptability.
4.5.1 Urban scenario
Context: Rooftop hive monitoring in dense city infrastructure.
Findings.
4.5.2 Rural scenario
Context: Remote hive locations with sparse infrastructure.
Findings.
4.5.3 Suburban scenario
Context: Mixed-use environments with occasional video streams and frequent sensor monitoring.
Findings.
4.5.4 General performance trends
Summary Insight: The adaptive switching algorithm is most effective for high-bandwidth data like video, particularly in urban settings. Suburban and rural areas can benefit from additional optimization strategies, especially for sensor and text-based communication.
4.6 Field testing and validation
The Adaptive Network Communications Architecture (ANCA) was tested in three real-world environments: urban, suburban, and rural. Field data was collected at varying distances, capturing throughput, latency, packet loss and Power in Watts. The results demonstrate that the adaptive switching algorithm significantly improves performance compared to using a single communication module. In particular, improvements in adaptability score (AS) and power measurements were consistent with simulation predictions.
4.6.1 Validation and analysis of the adaptive network switching results
The real-world results validate the effectiveness of the adaptive switching algorithm. Compared to single network deployments, the adaptive approach consistently maintained higher performance and adaptability scores across all environments. These improvements confirm that the simulation models are representative of actual deployments, with the adaptive mechanism compensating for weaknesses in individual networks.
4.6.2 Real-world performance validation
To rigorously validate the real-world performance of our proposed solution and its correlation with simulation outcomes, we conducted a scenario-based analysis across three key performance indicators: Performance Score (PS), Adaptability Score (AS), and Power Consumption. This validation moves beyond global correlation coefficients, providing a granular assessment of system behavior under realistic conditions.
4.6.2.1 Validation results
The results are visualized in Figure 9, which consolidates the findings into a three-panel grouped bar chart. Each panel corresponds to one metric (PS, AS, or Power Consumption), plotted across representative real-world scenarios (Urban, Suburban, and Rural) and networks (Wi-Fi, GSM, and LoRa). Distances were aligned with practical deployment ranges: 2–100 m (Urban), 200–500 m (Suburban), and 2–8 km (Rural). This design allows for a clear, side-by-side comparison of network performance in diverse environments.
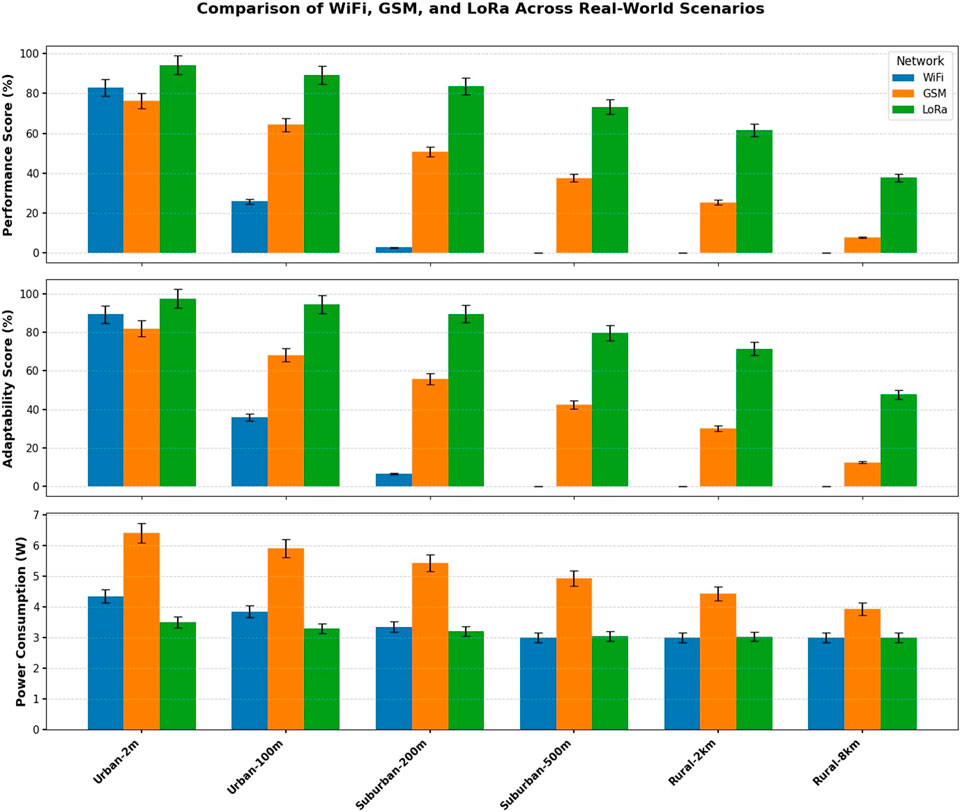
Figure 9. Validation plots with error margins (Performance Score, Adaptability Score, and Power Consumption) across Urban, Suburban, and Rural scenarios for Wi-Fi, GSM, and LoRa. Error margins represent empirically observed performance fluctuations due to dynamic real-world factors. Power values are average instantaneous draws (W), consistent with those in Table 3.
4.6.2.2 Power consumption clarification
The values of the average instantaneous power draw (W)were derived from direct current measurements on each communication module during sustained transmission of payloads. These results align with the values reported in Table 3, with LoRa consistently exhibiting the lowest power draw per transmission, while GSM shows the highest. Any apparent discrepancies are attributable to differences in plotting scale in earlier drafts, which have been corrected in this version.
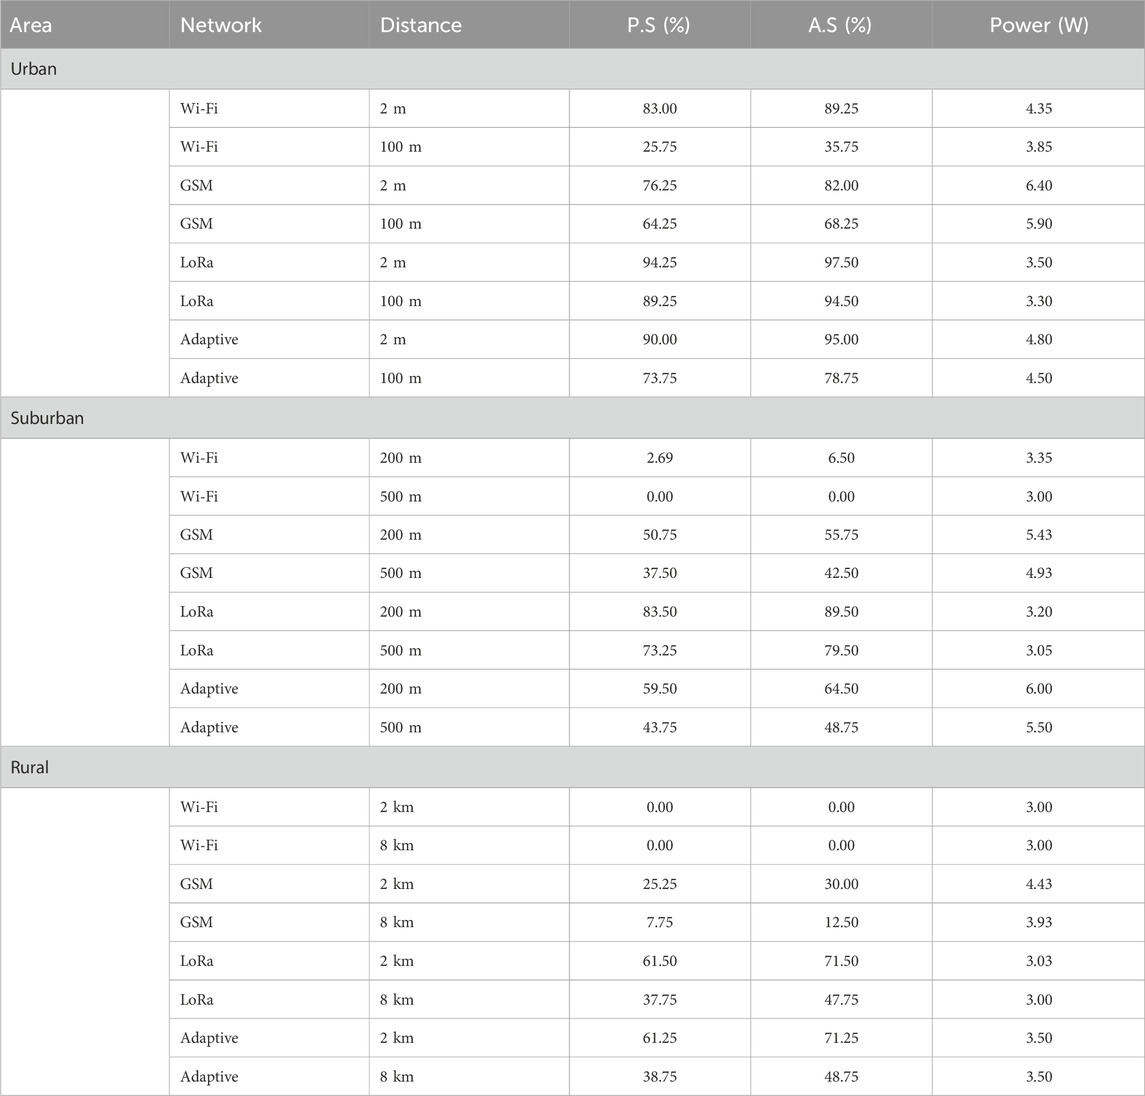
Table 3. Summary comparison results for real-world test case scenarios.
4.6.2.3 Data payload sizes
To ensure consistency and reproducibility, we explicitly report the payload sizes transmitted in the real-world validation.
These payload sizes were used consistently across all three networks, ensuring that the observed PS, AS, and Power values are directly comparable.
4.6.2.4 Error margins and variability
Each bar in Figure 9 includes vertical black lines denoting error margins. These margins are not statistical confidence intervals; instead, they represent the empirically observed variability due to real-world, uncontrolled factors such as.
The bounded ranges confirm that, despite fluctuations, the system consistently delivers robust performance within predictable limits, thereby validating the fidelity of the simulation results.
4.7 Energy and software stack considerations
Efficient energy management is critical for adaptive switching across Wi-Fi, GSM, and LoRa, particularly when operating resource-constrained IoT devices. The real-world test cases revealed that while LoRa consumed the least power per transmission, GSM and Wi-Fi offered higher throughput at the expense of energy. The adaptive framework balances these trade-offs by dynamically selecting the protocol that minimizes energy use while meeting performance requirements. For example, in rural deployments where data payloads were small, LoRa provided the most energy-efficient option, whereas in urban settings Wi-Fi was preferable for high-bandwidth transfers despite higher power draw.
Equally important is the software stack that enables seamless switching between protocols. The integration of lightweight drivers, middleware, and cross-platform APIs ensures minimal overhead when transitioning between GSM, Wi-Fi, and LoRa. Comparative analysis with existing single-stack implementations shows that ANCA’s layered approach reduced switching latency and prevented resource contention across modules. Optimization strategies such as buffering with DTN principles, selective wake-up scheduling, and efficient encoding of payloads further enhanced performance without significantly increasing computational complexity.
Together, the energy-aware operation and efficient software stack design provide a critical backbone for scalable IoT systems, ensuring that adaptive switching remains viable even under constrained device resources.
4.8 Significance
The study’s findings have significant implications for sensor data applications, especially in situations where real-time data monitoring is necessary under various network circumstances. Key benefits include.
This framework’s ability to enhance the performance of real-time sensor data systems can drive innovation in various IoT applications, particularly where robust, uninterrupted data flow is critical.
4.9 Contributions to research
This research makes several key contributions to the state of the art in adaptive IoT networking and sensor data transfer.
4.10 Limitations and future work
4.10.1 Limitations
Despite the promising results demonstrated by the proposed adaptive communication framework for sensor networks, several limitations were identified during the course of this study.
4.10.2 Future work
Building upon the foundation of this research, several avenues can be explored to improve the performance, adaptability, and scalability of the proposed architecture.
In conclusion, while the current implementation offers a solid groundwork for adaptive sensor network communication, addressing the above limitations and exploring the suggested future enhancements will significantly expand its impact and applicability in diverse real-world contexts.
5 Conclusion
In this paper, we introduced an Adaptive Network Communications Architecture (ANCA), a novel framework integrating Wi-Fi, GSM, and LoRa to enhance sensor data transmission in heterogeneous environments Alobaidy et al. (2022). Through both simulations and real-world field tests, the proposed switching algorithm demonstrated its effectiveness in dynamically selecting the most suitable communication protocol based on data type, distance, and environmental conditions Akyildiz et al. (2020). Results consistently showed improvements in throughput, latency, packet loss, and power consumption compared to single-network deployments.
Our rigorous validation approach moved beyond simple correlation coefficients to a direct, granular comparison of implemented results. By including and analyzing the measured error margins, we were able to demonstrate the robustness and stability of our implemented solution in dynamic, real-world conditions. This comprehensive validation confirms that the system not only achieves the stated average scores but also maintains its performance within a predictable and realistic range, thereby providing compelling evidence that our simulation results are a reliable predictor of the system’s performance.
Overall, the findings highlight the importance of adaptive multi-protocol frameworks in ensuring robust and energy-efficient data transfer. The ANCA architecture not only strengthens IoT deployments in agriculture, such as beehive monitoring, but is also extensible to other domains including smart cities, healthcare, and environmental monitoring. By addressing variability across network conditions and optimizing protocol switching, ANCA establishes a foundation for more resilient and scalable IoT communication systems.
Data availability statement
The original contributions presented in the study are included in the article/Supplementary Material, further inquiries can be directed to the corresponding author.
Author contributions
EN: Conceptualization, Data curation, Formal Analysis, Funding acquisition, Investigation, Methodology, Project administration, Resources, Software, Supervision, Validation, Visualization, Writing – original draft, Writing – review and editing. JS: Conceptualization, Data curation, Formal Analysis, Funding acquisition, Investigation, Project administration, Resources, Software, Supervision, Validation, Visualization, Writing – review and editing, Methodology. MZ: Conceptualization, Data curation, Formal Analysis, Funding acquisition, Investigation, Methodology, Project administration, Resources, Supervision, Validation, Visualization, Writing – review and editing, Software. SW: Conceptualization, Formal Analysis, Funding acquisition, Investigation, Project administration, Resources, Software, Supervision, Validation, Visualization, Writing – review and editing, Data curation, Methodology. MN: Conceptualization, Data curation, Formal Analysis, Funding acquisition, Investigation, Project administration, Resources, Software, Supervision, Validation, Visualization, Writing – review and editing, Methodology.
Funding
The author(s) declare that financial support was received for the research and/or publication of this article. This research was supported by funding from NORAD through the NORHED2 program under grant agreement QZA-21/0159 as part of the AdEMNEA project.
Acknowledgments
The authors gratefully acknowledge the support of the IoTRA Lab in Makerere University Uganda and the Marconi Lab in ICTP Trieste Italy for the information provided and the design of the figures in this document.
Conflict of interest
The authors declare that the research was conducted in the absence of any commercial or financial relationships that could be construed as a potential conflict of interest.
Generative AI statement
The author(s) declare that no Generative AI was used in the creation of this manuscript.
Any alternative text (alt text) provided alongside figures in this article has been generated by Frontiers with the support of artificial intelligence and reasonable efforts have been made to ensure accuracy, including review by the authors wherever possible. If you identify any issues, please contact us.
Publisher’s note
All claims expressed in this article are solely those of the authors and do not necessarily represent those of their affiliated organizations, or those of the publisher, the editors and the reviewers. Any product that may be evaluated in this article, or claim that may be made by its manufacturer, is not guaranteed or endorsed by the publisher.
Supplementary material
The Supplementary Material for this article can be found online at: https://www.frontiersin.org/articles/10.3389/friot.2025.1520653/full#supplementary-material
References
Adedoyin, M. A., and Falowo, O. E. (2020). Combination of ultra-dense networks and other 5g enabling technologies: a survey. IEEE Access 8, 22893–22932. doi:10.1109/access.2020.2969980
Ahmed, N. K., Atiya, A. F., Gayar, N. E., and El-Shishiny, H. (2010). An empirical comparison of machine learning models for time series forecasting. Econ. Rev. 29 (5–6), 594–621. doi:10.1080/07474938.2010.481556
Akpakwu, G. A., Silva, B. J., Hancke, G. P., and Abu-Mahfouz, A. M. (2017). A survey on 5g networks for the internet of things: communication technologies and challenges. IEEE Access 6, 3619–3647. doi:10.1109/access.2017.2779844
Akyildiz, I. F., Kak, A., and Nie, S. (2020). 6g and beyond: the future of wireless communications systems. IEEE Access 8, 133995–134030. doi:10.1109/access.2020.3010896
Al-Fuqaha, A., Guizani, M., Mohammadi, M., Aledhari, M., and Ayyash, M. (2015). Internet of things: a survey on enabling technologies, protocols, and applications. IEEE Commun. Surv. Tutorials 17 (4), 2347–2376. doi:10.1109/comst.2015.2444095
Alobaidy, H. A. H., Singh, M. J., Behjati, M., Nordin, R., and Abdullah, N. F. (2022). Wireless transmissions, propagation and channel modelling for iot technologies: applications and challenges. IEEE Access 10, 24095–24131. doi:10.1109/access.2022.3151967
Andrews, J. G., Buzzi, S., Choi, W., Hanly, S. V., Lozano, A., Soong, A. C. K., et al. (2014). What will 5g be? IEEE J. Sel. Areas Commun. 32 (6), 1065–1082. doi:10.1109/JSAC.2014.2328098
Boyd, S., Ghaoui, L. E., Feron, E., and Balakrishnan, V. (1994). Linear matrix inequalities in system and control theory.
Budhwar, P., Chowdhury, S., Wood, G., Aguinis, H., Bamber, G. J., Beltran, J. R., et al. (2023). Human resource management in the age of generative artificial intelligence: perspectives and research directions on chatgpt. Hum. Resour. Manag. J. 33 (3), 606–659. doi:10.1111/1748-8583.12524
Bug, S., Wengerter, C., Gaspard, I., and Jakoby, R. (2003). Wssus - channel models for broadband mobile communication systems. 2003 IEEE 57th Veh. Technol. Conf. (VTC 2003) (Spring) 4, 2856–2860. doi:10.1109/VTC.2002.1002617
Da Silva, A. P., Burleigh, S., and Obraczka, K. (2018). Delay and disruption tolerant networks: interplanetary and earth-Bound – architecture, protocols, and applications. Bristol, England, United Kingdom: University of Bristol.
Daousis, S., Peladarinos, N., Cheimaras, V., Papageorgas, P., Piromalis, D. D., and Munteanu, R. A. (2024). Overview of protocols and standards for wireless sensor networks in critical infrastructures. Future Internet 16 (1), 33. doi:10.3390/fi16010033
De Alwis, C., Kalla, A., Pham, Q., Kumar, P., Dev, K., Hwang, W., et al. (2021). Survey on 6g frontiers: trends, applications, requirements, technologies and future research. IEEE Open J. Commun. Soc. 2, 836–886. doi:10.1109/ojcoms.2021.3071496
De Lima, C., Belot, D., Berkvens, R., Bourdoux, A., Dardari, D., Guillaud, M., et al. (2021). Convergent communication, sensing and localization in 6G systems: an overview of technologies, opportunities and challenges. IEEE Access 9, 26902–26925. doi:10.1109/ACCESS.2021.3053486
Deb, K., and Kalyanmoy, D. (2001). Multi-objective optimization using Evolutionary algorithms. Available online at: http://ci.nii.ac.jp/ncid/BB00925127.
Dwivedi, Y. K., Hughes, L., Baabdullah, A. M., Ribeiro-Navarrete, S., Giannakis, M., Al-Debei, M. M., et al. (2022). Metaverse beyond the hype: Multidisciplinary perspectives on emerging challenges, opportunities, and agenda for research, practice and policy. Int. J. Inf. Manag. 66, 102542. doi:10.1016/j.ijinfomgt.2022.102542
Engst, A. C., and Fleishman, G. (2003). The Wireless networking starter Kit: the practical Guide to Wi-Fi networks for Windows and Macintosh. Karatina, Nyeri County, Kenya: Karatina University.
Fuller, A., Fan, Z., Day, C., and Barlow, C. (2020). Digital twin: enabling technologies, challenges and open research. IEEE Access 8, 108952–108971. doi:10.1109/access.2020.2998358
Gill, S. S., Xu, M., Ottaviani, C., Patros, P., Bahsoon, R., Shaghaghi, A., et al. (2022). AI for Next generation computing: emerging trends and future directions. Internet Things 19, 100514. doi:10.1016/j.iot.2022.100514
Gupta, A., and Jha, R. K. (2015). A survey of 5g network: architecture and emerging technologies. IEEE Access 3, 1206–1232. doi:10.1109/access.2015.2461602
Imam-Fulani, Y. O., Faruk, N., Sowande, O. A., Abdulkarim, A., Alozie, E., Usman, A. D., et al. (2023). 5g frequency standardization, technologies, channel models, and network deployment: advances, challenges, and future directions. Sustainability 15 (6), 5173. doi:10.3390/su15065173
Jahanbakht, M., Xiang, W., Hanzo, L., and Azghadi, M. R. (2021). Internet of underwater things and big marine data analytics—a comprehensive survey. IEEE Commun. Surv. and Tutorials 23 (2), 904–956. doi:10.1109/comst.2021.3053118
Jin, M., Liu, S., Schiavon, S., and Spanos, C. (2017). Automated mobile sensing: towards high-granularity agile indoor environmental quality monitoring. Build. Environ. 127, 268–276. doi:10.1016/j.buildenv.2017.11.003
Jouhari, M., Saeed, N., Alouini, M., and Amhoud, E. M. (2023). A survey on scalable lorawan for massive iot: Recent advances, potentials, and challenges. IEEE Commun. Surv. Tutorials 25 (3), 1841–1876. doi:10.1109/comst.2023.3274934
Kanellopoulos, D., Sharma, V. K., Panagiotakopoulos, T., and Kameas, A. (2023). Networking architectures and protocols for iot applications in smart cities: Recent developments and perspectives. Electronics 12 (11), 2490. doi:10.3390/electronics12112490
Kloza, D., Kużelewska, E., Lievens, E., and Verdoodt, V. (2025). The right not to Use the internet: Concept, contexts, Consequences. London: Taylor and Francis.
Kodheli, O., Lagunas, E., Maturo, N., Sharma, S. K., Shankar, B., Montoya, J. F. M., et al. (2020). Satellite communications in the new space era: a survey and future challenges. IEEE Commun. Surv. Tutorials 23 (1), 70–109. doi:10.1109/comst.2020.3028247
Li, S., Chen, H., Wang, M., Heidari, A. A., and Mirjalili, S. (2020). Slime mould algorithm: a new method for stochastic optimization. Future Gener. Comput. Syst. 111, 300–323. doi:10.1016/j.future.2020.03.055
Lim, W. Y. B., Luong, N. C., Hoang, D. T., Jiao, Y., Liang, Y., Yang, Q., et al. (2020). Federated learning in mobile edge networks: a comprehensive survey. IEEE Commun. Surv. Tutorials 22 (3), 2031–2063. doi:10.1109/comst.2020.2986024
Lu, C. (1999). A generalization of shannon’s information theory. Int. J. General Syst. 28 (6), 453–490. doi:10.1080/03081079908935247
Marsch, P., Queseth, O., and Boldi, M. (2018). 5G system design: Architectural and functional considerations and long term research. John Wiley Sons.
Mishra, D., and Natalizio, E. (2020). A survey on cellular-connected uavs: design challenges, enabling 5g/b5g innovations, and experimental advancements. Comput. Netw. 182, 107451. doi:10.1016/j.comnet.2020.107451
Moore, R. H., Gross, D., and Harris, C. M. (1977). Fundamentals of queueing theory. J. Am. Stat. Assoc. 72 (357), 232. doi:10.2307/2286953
Mylonas, G., Kalogeras, A., Kalogeras, G., Anagnostopoulos, C., Alexakos, C., and Munoz, L. (2021). Digital twins from smart manufacturing to smart cities: a survey. IEEE Access 9, 143222–143249. doi:10.1109/access.2021.3120843
Nain, N., and Vipparthi, S. K. (2020). 4th international conference on internet of things and connected technologies (iciotct), 2019: Internet of things and connected technologies. Springer Nature’.
Namugenyi, E. E., Tugume, D., Kigwana, A., and Rukundo, B. (2024). “Enabling robust sensor network design with data processing and optimization making use of local beehive image and video files,”. 5th international Conference on Artificial intelligence and big data (AIBD 2024). Editors D. C. Wyld, and D. Nagamalai (Vancouver, Canada), 1, 1–9.
Nguyen, D. C., Ding, M., Pathirana, P. N., and Seneviratne, A. (2021). Blockchain and ai-based solutions to combat coronavirus (covid-19)-like epidemics: a survey. IEEE Access 9, 95730–95753. doi:10.1109/access.2021.3093633
Pagano, A., Croce, D., Tinnirello, I., and Vitale, G. (2022). A survey on lora for smart agriculture: current trends and future perspectives. IEEE Internet Things J. 10 (4), 3664–3679. doi:10.1109/jiot.2022.3230505
Pham, Q., Fang, F., Ha, V. N., Piran, M. J., Le, M., Le, L. B., et al. (2020). A survey of multi-Access edge computing in 5G and beyond: Fundamentals, technology integration, and state-of-the-art. IEEE Access 8, 116974–117017. doi:10.1109/access.2020.3001277
Rodrigues, J. J. P. C. (2020). Advances in delay-tolerant networks (DTNs): architecture and enhanced performance. Teresina, Piauí, Brazil: Federal University of Piauí (UFPI).
Soro, S., and Heinzelman, W. (2009). “A survey of visual sensor networks,” in Advances in multimedia, 1–21.
Talavera, J. M., Tobón, L. E., Gómez, J. A., Culman, M. A., Aranda, J. M., Parra, D. T., et al. (2017). Review of iot applications in agro-industrial and environmental fields. Comput. Electron. Agric. 142, 283–297. doi:10.1016/j.compag.2017.09.015
Tataria, H., Shafi, M., Molisch, A. F., Döhler, M., Sjöland, H., and Tufvesson, F. (2021). 6g wireless systems: vision, requirements, challenges, insights, and opportunities. Proc. IEEE 109 (7), 1166–1199. doi:10.1109/jproc.2021.3061701
Uwaechia, A. N., and Mahyuddin, N. M. (2020). A comprehensive survey on millimeter wave communications for fifth-generation wireless networks: Feasibility and challenges. IEEE Access 8, 62367–62414. doi:10.1109/access.2020.2984204
Wang, X., Han, Y., Leung, V. C. M., Niyato, D., Yan, X., and Chen, X. (2020). Convergence of edge computing and deep learning: a comprehensive survey. IEEE Commun. Surv. and Tutorials 22 (2), 869–904. doi:10.1109/comst.2020.2970550
Wang, Y., Su, Z., Zhang, N., Xing, R., Liu, D., Luan, T. H., et al. (2022). A survey on metaverse: Fundamentals, security, and privacy. IEEE Commun. Surv. and Tutorials 25 (1), 319–352. doi:10.1109/COMST.2022.3202047
Keywords: GSM, Wi-Fi, LoRa networks, delay tolerant networking (DTN), sensor data, text, audio, image
Citation: Namugenyi EE, Sansa Otim J, Zennaro M, Wolthusen S and Nsabagwa M (2025) Adaptive network switching algorithm for sensor data transfer: a simulation framework integrating GSM, Wi-Fi, and LoRa networks. Front. Internet Things 4:1520653. doi: 10.3389/friot.2025.1520653
Received: 31 October 2024; Accepted: 15 September 2025;
Published: 03 October 2025.
Edited by:
Kashif Saleem, King Saud University, Saudi ArabiaReviewed by:
Lidia Bajenaru, National Institute for Research and Development in Informatics, RomaniaVivek Parmar, Indian Institute of Technology Delhi, India
Copyright © 2025 Namugenyi, Sansa Otim, Zennaro, Wolthusen and Nsabagwa. This is an open-access article distributed under the terms of the Creative Commons Attribution License (CC BY). The use, distribution or reproduction in other forums is permitted, provided the original author(s) and the copyright owner(s) are credited and that the original publication in this journal is cited, in accordance with accepted academic practice. No use, distribution or reproduction is permitted which does not comply with these terms.
*Correspondence: Ephrance Eunice Namugenyi, ZS5uYW11Z2VueWlAeWFob28uY29t