 John T. O’Brien
 Asha M. George
 Michael B. Bonsall
- 1Mathematical Ecology Research Group, Department of Biology, University of Oxford, Oxford, United Kingdom
- 2Bipartisan Commission on Biodefense, Washington, DC, United States
Introduction: Several hypotheses exist about how viruses first emerged on Earth. Understanding whether viruses escaped from cells, remained from devolved cells, or emerged before cells is key to comprehending the origins of viruses and life in general.
Methods: Here, we analyze the evolutionary dynamics of the escape hypothesis (as proposed by Forterre and Krupovic) for viral origins. We developed theoretical and numerical approaches to investigate the dynamics of the virus escape hypothesis and highlighted which parameters (e.g., maturation rate, infected cell death rate, virus replication rate, infection rate) influence virus evolutionary origins and reinfection dynamics.
Results: Critically, we demonstrate that viral death rate (μV) and infected cell death rate (μI) must exceed a certain threshold for viruses to emerge and persist through the escape hypothesis. Furthermore, we demonstrate that unfaithful or unequal ribocell division is a necessary component of the escape hypothesis. We also examined early virus strategies for proliferation by comparing budding and lysing virus reproduction modes.
Discussion: Our results highlight the importance of certain biological characteristics (e.g., maturation rate, infection rate, lysing rates, budding rates), required for the emergence of viruses via the escape hypothesis. The model we present here provides a sound basis for further work on the evolutionary dynamics of virus origins.
Introduction
Viral origins
Earth’s oceans contain about 1031 viral particles, magnitudes more than the estimated number of stars in the known universe (1). Viruses also outnumber bacteria by a factor of 10 (2). Viruses are the most abundant and diverse biological entities in the biosphere (3) and play a major role in biodiversity, evolution and ecosystem function (4). Although viruses are ubiquitous, the evolutionary origins of viruses remain unresolved.
As sequencing and metagenomic technologies matured, the evolutionary relationships between cells and viruses became clearer, indicating that viruses should have a place in the phylogenetic tree of life (5). Interactions between cells and viruses often involve horizontal gene transfer allowing for greater genetic diversity as they coevolve. Viruses affect the interactions among all of these factors and adopting an ecosystem perspective would enhance understanding of virus evolution and emergence (6). Viruses can also transfer genetic material within ecosystems and by influencing diversity, may affect ecosystem health and resilience (7).
There are three classical hypotheses for the origins of viruses: 1) progressive or escape; 2) regressive or reduction; and 3) virus-first. The progressive or escape hypothesis suggests that viruses originated from genetic material that gained the ability to move between cells and acquire genes through horizontal gene transfer (8). The goal of this paper is to explore the escape hypotheses theoretically, using a set of ordinary differential equations to understand how different life-history parameters and reproductive processes influence virus escape and better explain the evolutionary origins of viruses.
The escape hypothesis
The escape hypothesis (Figure 1), where fragments of cellular genomes became infectious and resulted in viruses, originated following the discovery of proviruses and prophages in the 1960s (9). The protovirus hypothesis, in which RNA viruses evolved from cellular components, followed about a decade later (10).
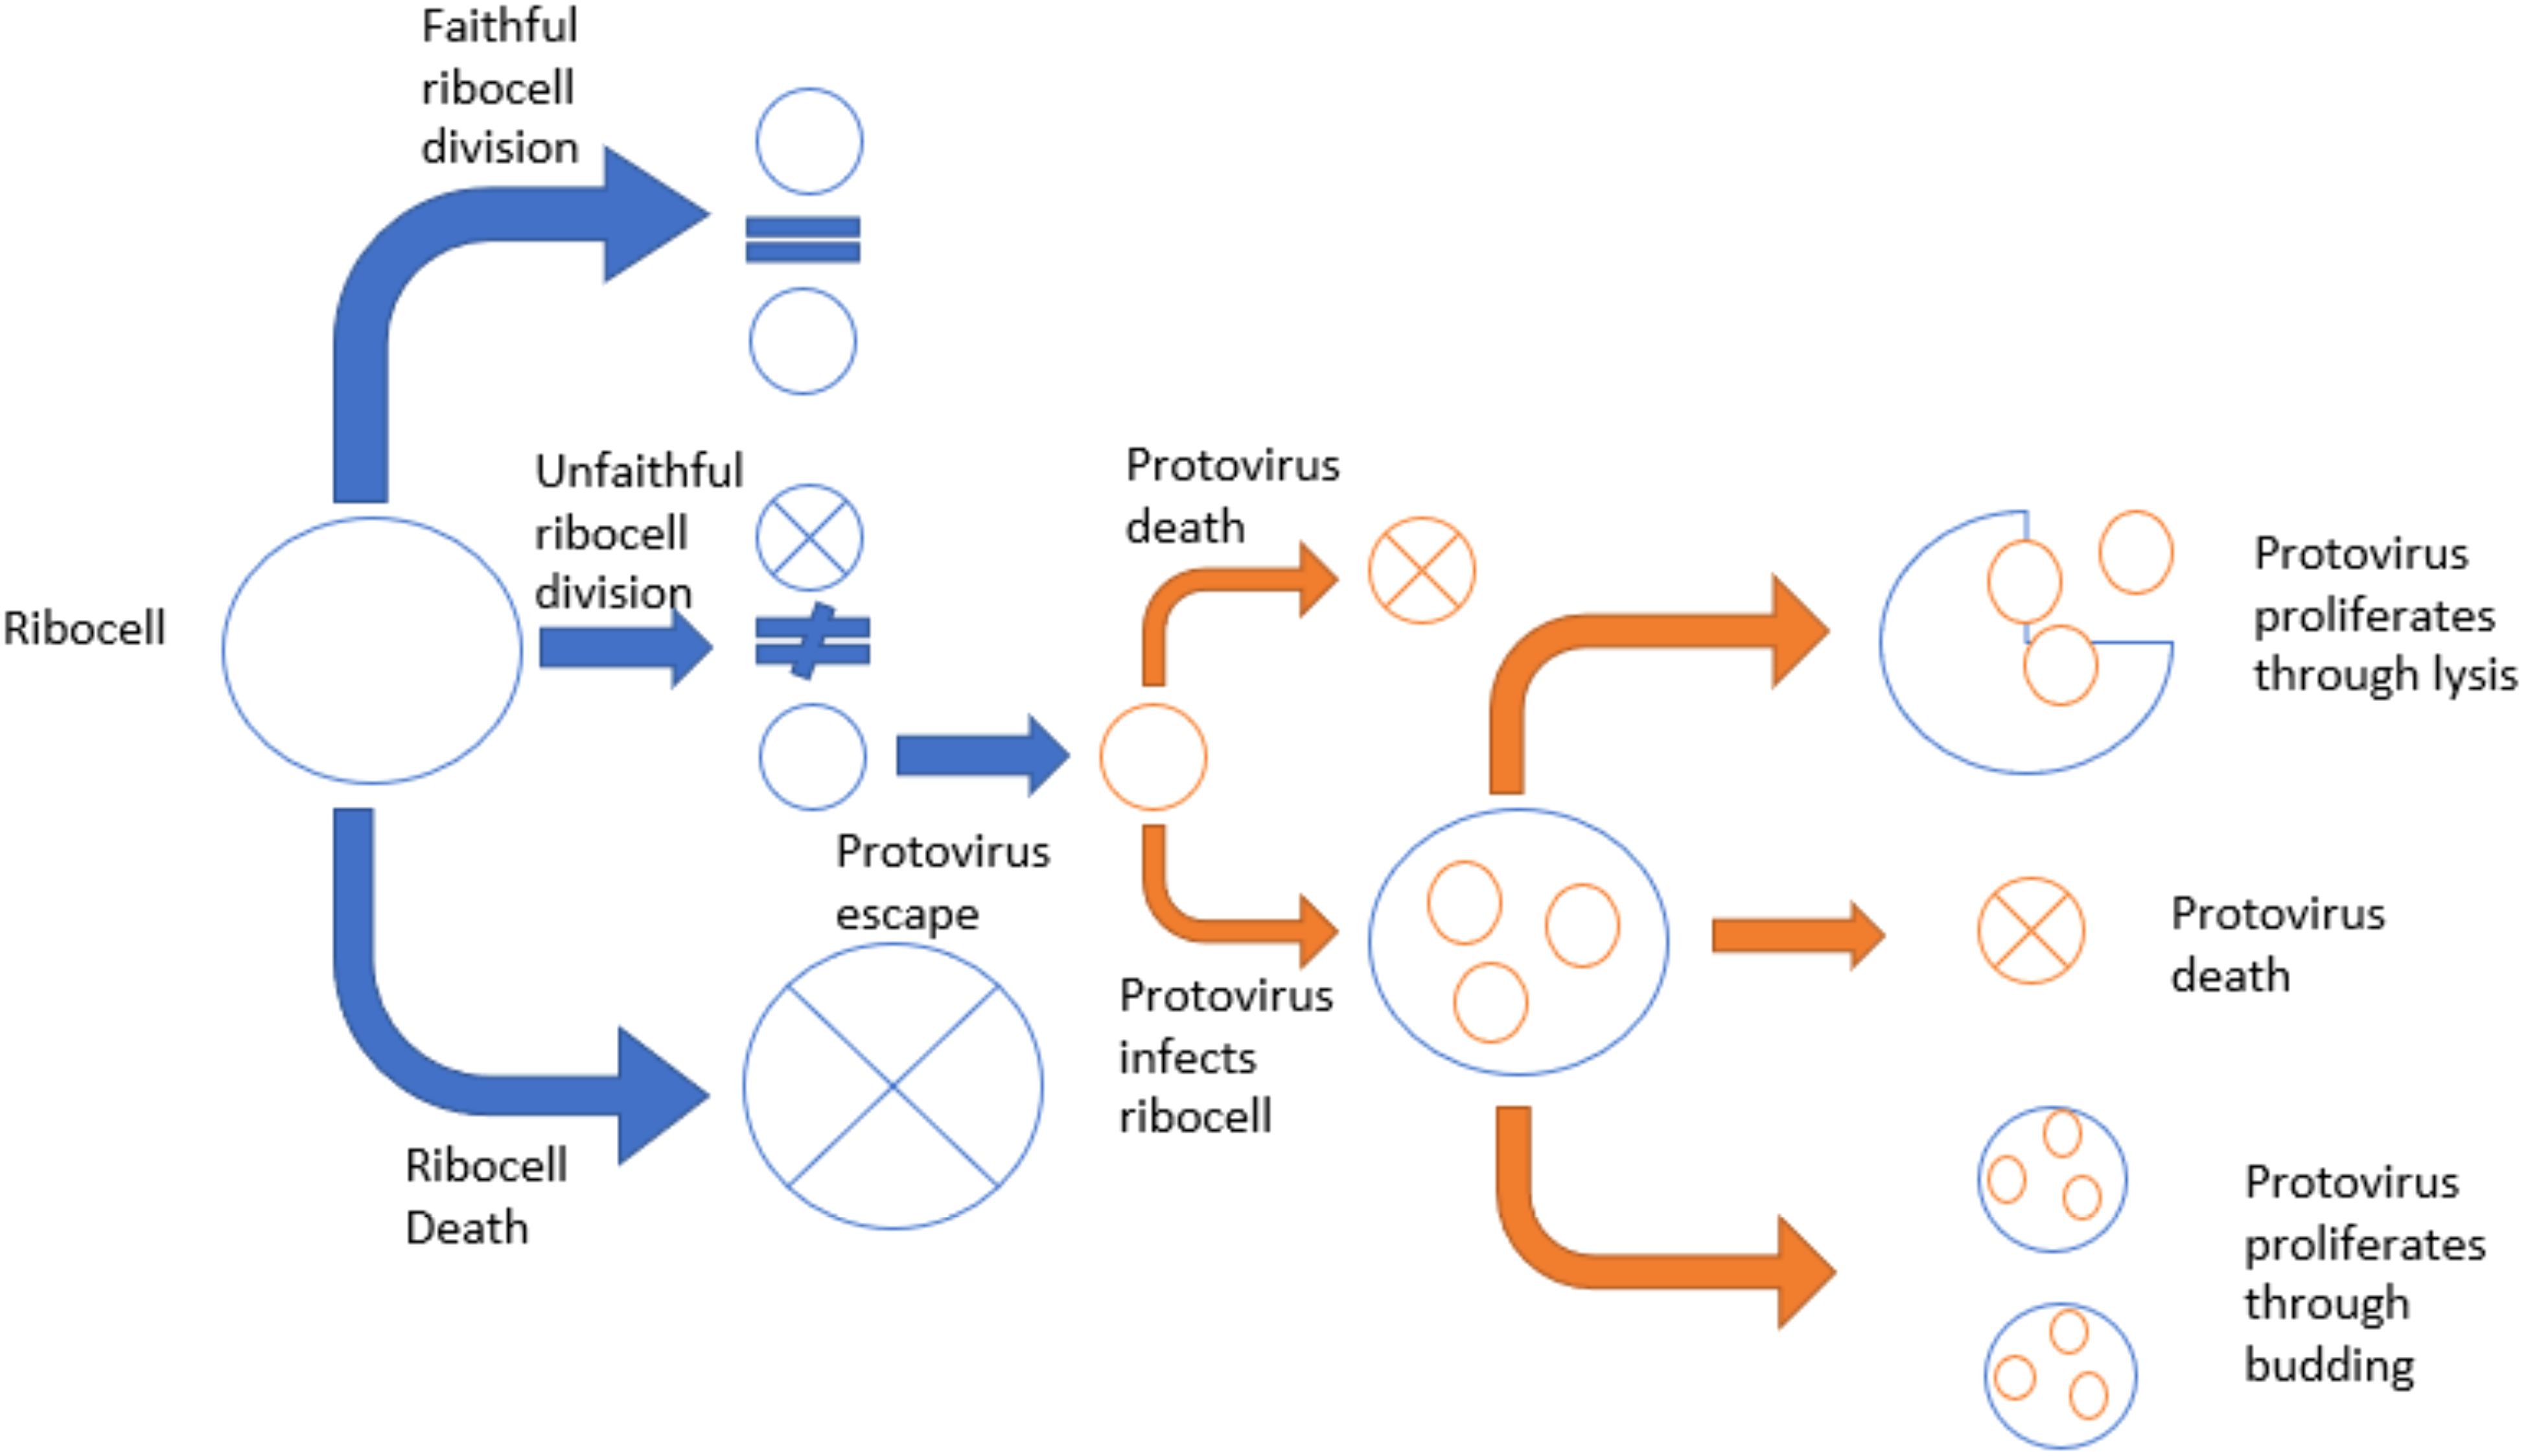
Figure 1. A diagram representing the escape hypothesis for viral origins. First, an ancient ribocell divides faithfully or unfaithfully. If the ribocell divides unfaithfully, it would produce two mini-cells with genetic material but no translation machinery. One of these mini-cells would die off due to the lack of a protein coat, but the other would survive with a functioning protein coat. The mini-cell with a protein coat could then potentially transfer into another cell, together becoming a viroribocell. Then the viroribocell becomes a virus if it successfully replicates and proliferates.
There are two different versions of the escape hypothesis. The first suggests that viruses arose from more modern cells such as eukaryotes and prokaryotes that originated from the last universal common ancestor. The second modifies this idea and suggests that viruses predated modern cells and the last universal common ancestor, and arose from ancient RNA-based ribocells (11).
Taking these hypotheses into consideration, we assumed that ancient RNA-based ribocells existed before the last universal common ancestor. These ribocells possessed selfish genome fragments and translation machinery (i.e., ancestral ribosomes). For a genome fragment to become autonomous in ancient RNA cells was likely easier than in modern cells, since the different molecular mechanisms were probably much simpler and less integrated.
The life of an ancient ribocell could have had three outcomes. The cell could: 1) faithfully divide and continue replicating normally; 2) die; or 3) go through unequal cell division, potentially giving rise to a viroribocell (i.e., a ribocell harboring virions). In the latter case, the ribocell would produce two mini-cells with genetic material but no translation machinery. One of these mini-cells would die due to the lack of a protein coat, but the other would survive with a functioning protein coat. The surviving mini-cell could then transfer into another cell, creating a viroribocell.
The protovirus in this ribocell would not be a successful virus unless it replicated and proliferated, creating some type of genetic lineage. The viroribocell could die and fail to effectively spread its virions. Alternatively, this cell could lyse and release virions that go on to infect other cells (12). Finally, the cell could survive while infected and spread virions through budding. Whether by lysing or budding, the virions must continue the cycle of successful replication and proliferation to be considered a bona fide virus. The viral lineage could also die before it had infected enough cells to proliferate successfully. A threshold likely exists at which a number of successful cycles led to a virus.
Early virus strategies
Early viruses could have formed virions and proliferated through two production strategies: 1) the production and proliferation of virions via lysis of infected ribocells; or 2) the production and proliferation of virions via budding of infected ribocells. The preferred strategy for an early virus is unknown but some studies suggest that different strategies may have emerged in different lineages of ribocells (11). Recent work examined the evolutionary dynamics of modern virus production strategies and whether budding or lysis may provide selective advantage, taking time delays into consideration (12). Results from this work indicated that the length of delay before lysis is an important trait in evolutionary dynamics. For fixed times to lysis, intermediate delays resulted in lower virus fitness than compared to a short time to lysis (resulting in a lysing strategy), and long times to lysis (resulting in a budding strategy). We carried out similar analyses in this study to explore the evolutionary dynamics of the escape hypothesis for viral origins.
Using a theoretical evolutionary dynamic framework, we explored the use of the escape hypothesis as a mechanism for the evolutionary origins of virus. Here, we begin by introducing the mathematical model and details about model analysis. We then contrast results from invasion, deterministic, and stochastic analyses of the escape hypothesis. Subsequently, we discuss the importance of this hypothesis for understanding the ubiquity of viruses, how certain parameters affect virus emergence and persistence, and approaches for empirically verifying predictions based on the hypothesis.
Methods
We used a set of four coupled differential equations to evaluate the dynamics of early virus emergence via the escape hypothesis. Ribocells (R), unfaithfully replicating ribocells (U), infected ribocells (I), and virus (V) dynamics are represented by:
where μR is the ribocell death rate, λ is the ribocell reproduction rate, λ’ is the unfaithfully replicated cell reproduction rate, β is the infection rate, μU is the unfaithfully replicated cell death rate, m is the maturation rate at which unfaithfully replicated cells become virus, μI is the infected ribocell death rate, τ is the lysing delay, τ’ is the budding delay, θ is the lysis rate, γ is the budding rate, and μV is the virus clearance or death rate. We explored virus emergence via the escape hypothesis using analytical (i.e., invasion analysis) and numerical (i.e., sensitivity analysis) techniques, together with investigation of both deterministic and associated stochastic dynamics. Tables 1 and 2 contain model definitions, parameter values, and ranges.
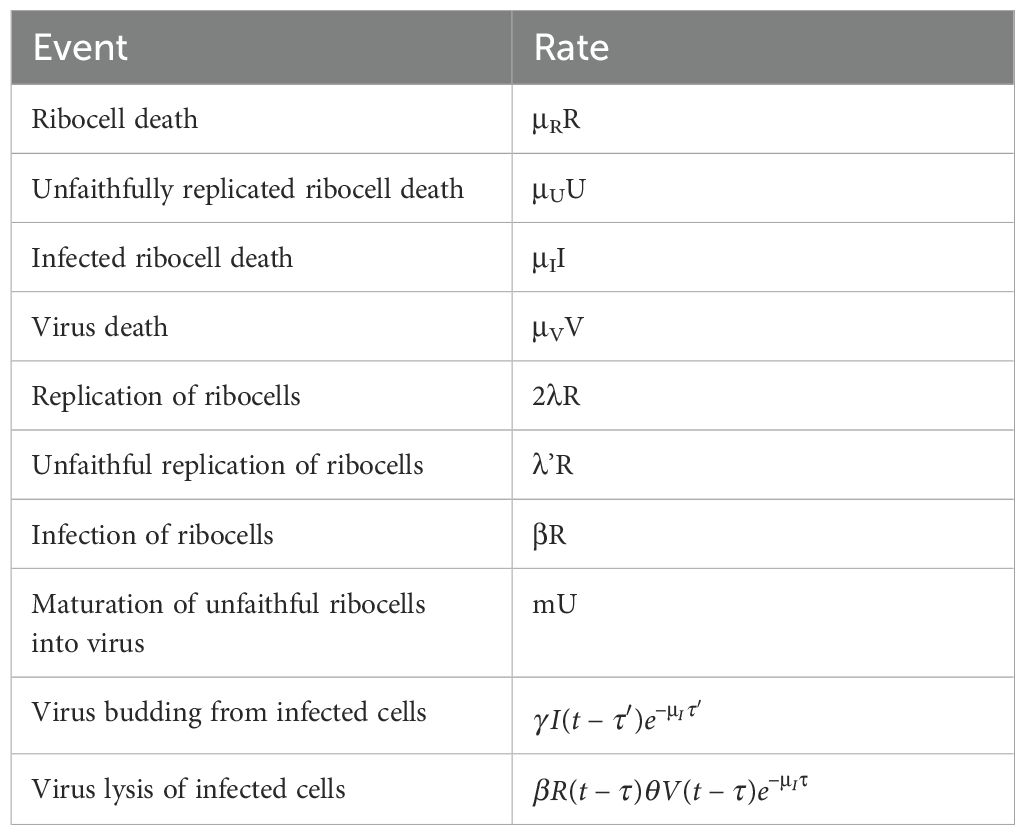
Table 1. The 10 events for the stochastic dynamics of the escape hypothesis and at what rates they occur within the model.
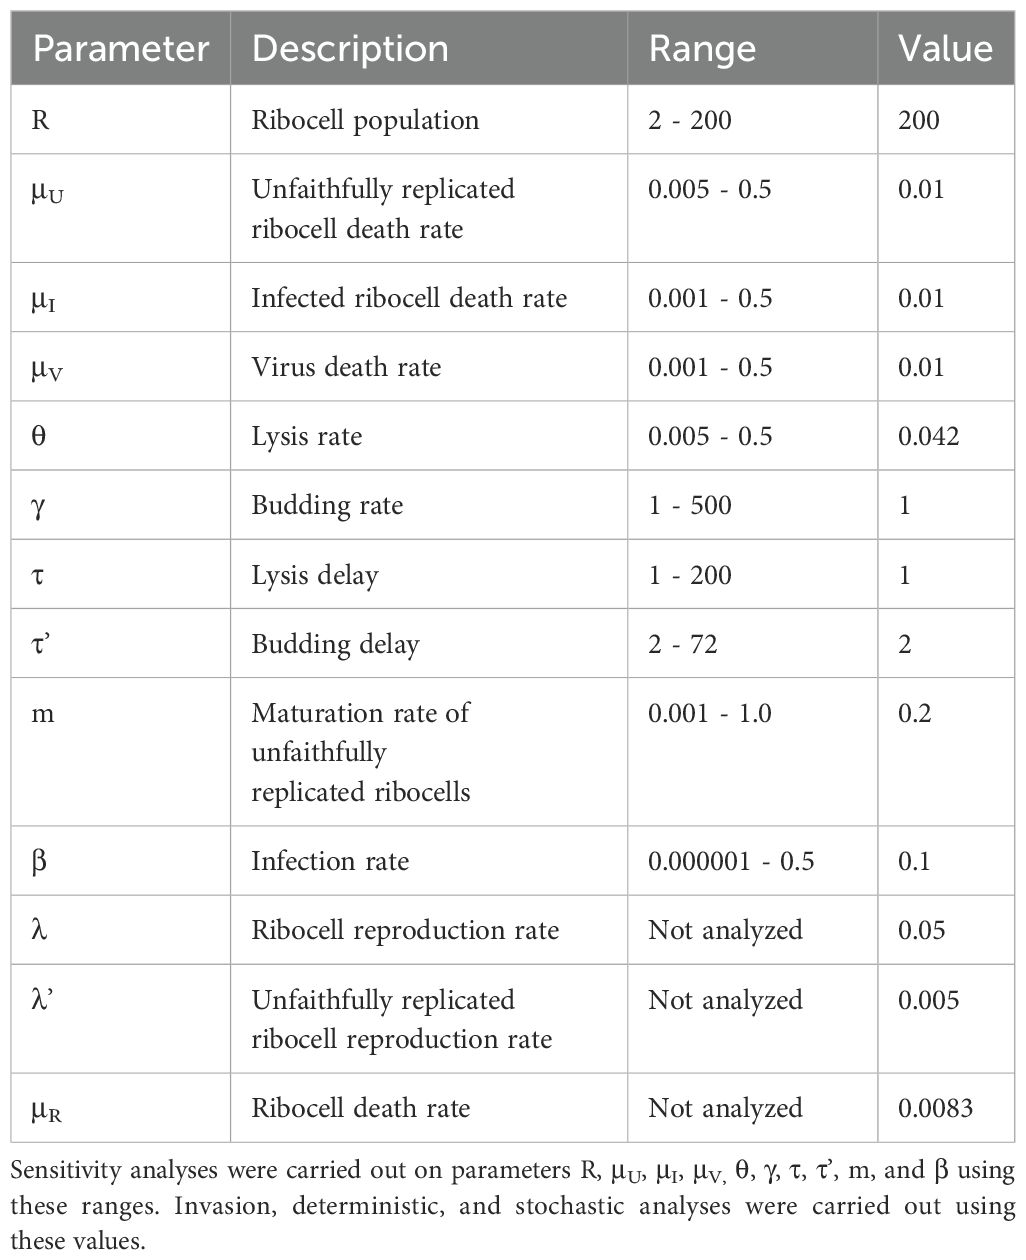
Table 2. Parameter descriptions, ranges, and values used for analyses.
Invasion analysis
We used techniques from invasion analysis (12–14) to explore the emergence of viruses from unfaithfully replicated cells. We evaluated the effectiveness of lysing and budding strategies for early virus by 1) assuming ribocells already exist at a constant density and 2) deriving a fitness function to determine whether viruses can invade from rare. Technically, this involved linearizing the dynamics around the trivial steady state (V=0) and then taking the determinant of the Jacobian matrix of these partial derivatives for unfaithfully replicated cells (U), infected cells (I), and virus (V). This matrix takes the form of:
where is virus strategy fitness (i.e., the dominant eigenvalue from the matrix). Taking the determinant of this matrix, Setting the determinant of this matrix equal to zero and solving for yields the following virus fitness function:
We set terms contributing to budding (γ) at zero, in order to investigate the dynamics of a virus only using a lysis strategy. The matrix then becomes:
The virus fitness function is then:
We set the lysis rate (θ) to zero in order to investigate the dynamics of a virus using a budding strategy only. Then, the matrix becomes:
The virus fitness function is then:
We simplified the matrix, only including equations for virus (V) and infected ribocells (I), and leaving out unfaithfully replicated cells (U), in order to explore reinfection dynamics after viruses had already emerged. Making the system behave as if virus had already emerged allowed us to explore how early virus might replicate and proliferate in the absence of emergence dynamics. This matrix then becomes:
The virus fitness function is then:
This function is the same as that derived for the 3x3 matrix (Equation 6).
We initially set the parameters used in these analyses to the values listed in Table 2.
Sensitivity analysis
We used sensitivity analyses of the fitness functions to determine the effects of changes in model parameter values on virus fitness (. This analysis aimed to evaluate the positive and negative impacts of parameters such as the constant ribocell density (R), unfaithful ribocell replication rate (μU), infected ribocell death rate (μI), virus death rate (μV), lysis rate (θ), budding rate (γ), lysis delay (τ), budding delay (τ’), maturation rate (m), and infection rate (β) on virus fitness. Using Latin hypercube sampling and assuming a uniform distribution for each parameter, we generated 2000 parameter sets with the ranges provided in Table 2. We plotted the distribution of a parameter’s range against virus fitness to identify obvious trends. If there were deviations or significant correlations in these relationships, we assumed that the parameter influenced virus fitness.
Deterministic dynamics
We analyzed deterministic dynamics to evaluate how viruses emerge from unfaithfully replicated cells when either reinfection dynamics are restricted or occur. We also used this analysis to evaluate the effects of different parameter combinations on virus fitness. In order to evaluate the deterministic dynamics of the escape hypothesis, we used numerical integration (with a modified Runge-Kutta fourth order (RK4) method) to solve, deterministically, the set of delayed differential equations for the escape hypothesis dynamics (Equations 1-4). The modified RK4 method included a quadratic interpolation algorithm to account for time lags. The model was initialized with 200 ribocells. The model ran for 1300 iterations, with an integration step of 0.005, a buffer length for past values of 5000, and a start time of 0. We chose buffer length values to ensure we had sufficient past history of deterministic dynamics for the numerical simulations. We initially set parameters used in these analyses to the values listed in Table 2.
Stochastic dynamics
We analyzed stochastic dynamics probabilistically to evaluate how viruses emerge from unfaithfully replicated cells with restricted and recurrent reinfection dynamics. We also used the analysis to evaluate the effects of different parameter combinations on virus fitness. As the stochastic model is probabilistic, this analysis provides more fidelity into the dynamics of the escape hypothesis. We investigated stochastic analyses of escape hypothesis dynamics using a modified Gillespie algorithm (15, 16). This algorithm provides a numerical approach for generating realizations of temporal trajectories of stochastic equations for known reaction rates. In general, this algorithm accounts for two key assumptions in solving these sorts of stochastic processes (17), that the: 1) time-to-the-next-event was exponentially distributed; and 2) probability of the next event is proportional to the rate.
The second assumption implies, however, that the change in the system occurs instantaneously. We adapted the algorithm to account for this by stacking up delayed events (where such an event will effect a change in the system that will not be realized for some time-step equivalent to the length of the lag).
In the escape hypothesis model, there are 10 events (Table 1).
The last two potential events in the escape hypothesis model (budding and lysis) were delayed in time (with potentially different lagged effects). The modified algorithm checks to see if a lagged event is scheduled to occur in the interval . If so, then the time to the next event is set to this lagged event and the algorithm initiates a new sequence to determine the next event and when it occurs. We set the number of observations to 150 and the number of iterations per model run to 100. We set the parameters used in these analyses to the values listed in Table 2.
Source code and scripts for the analyses completed in this study are available from the Open Science Framework (https://osf.io/pdut2/).
Results
The following provides findings from invasion, deterministic, and stochastic analyses about how model parameters affect virus fitness and emergence under the escape hypothesis scenario.
Invasion analysis
Invasion analyses were used to explore the dynamics of virus emerging from unfaithfully replicated cells. The differences between the early infection dynamics of lysing and budding strategies under these early virus conditions were evaluated using the virus fitness functions (Equations 5-12). Virus fitness was higher with lysis, indicating that lysing could be a preferred early virus strategy (Figure 2). However, this could also be due to the budding delay being longer than the lysis delay. See analyses and discussion below for when budding is more likely to be a predominant early virus strategy.
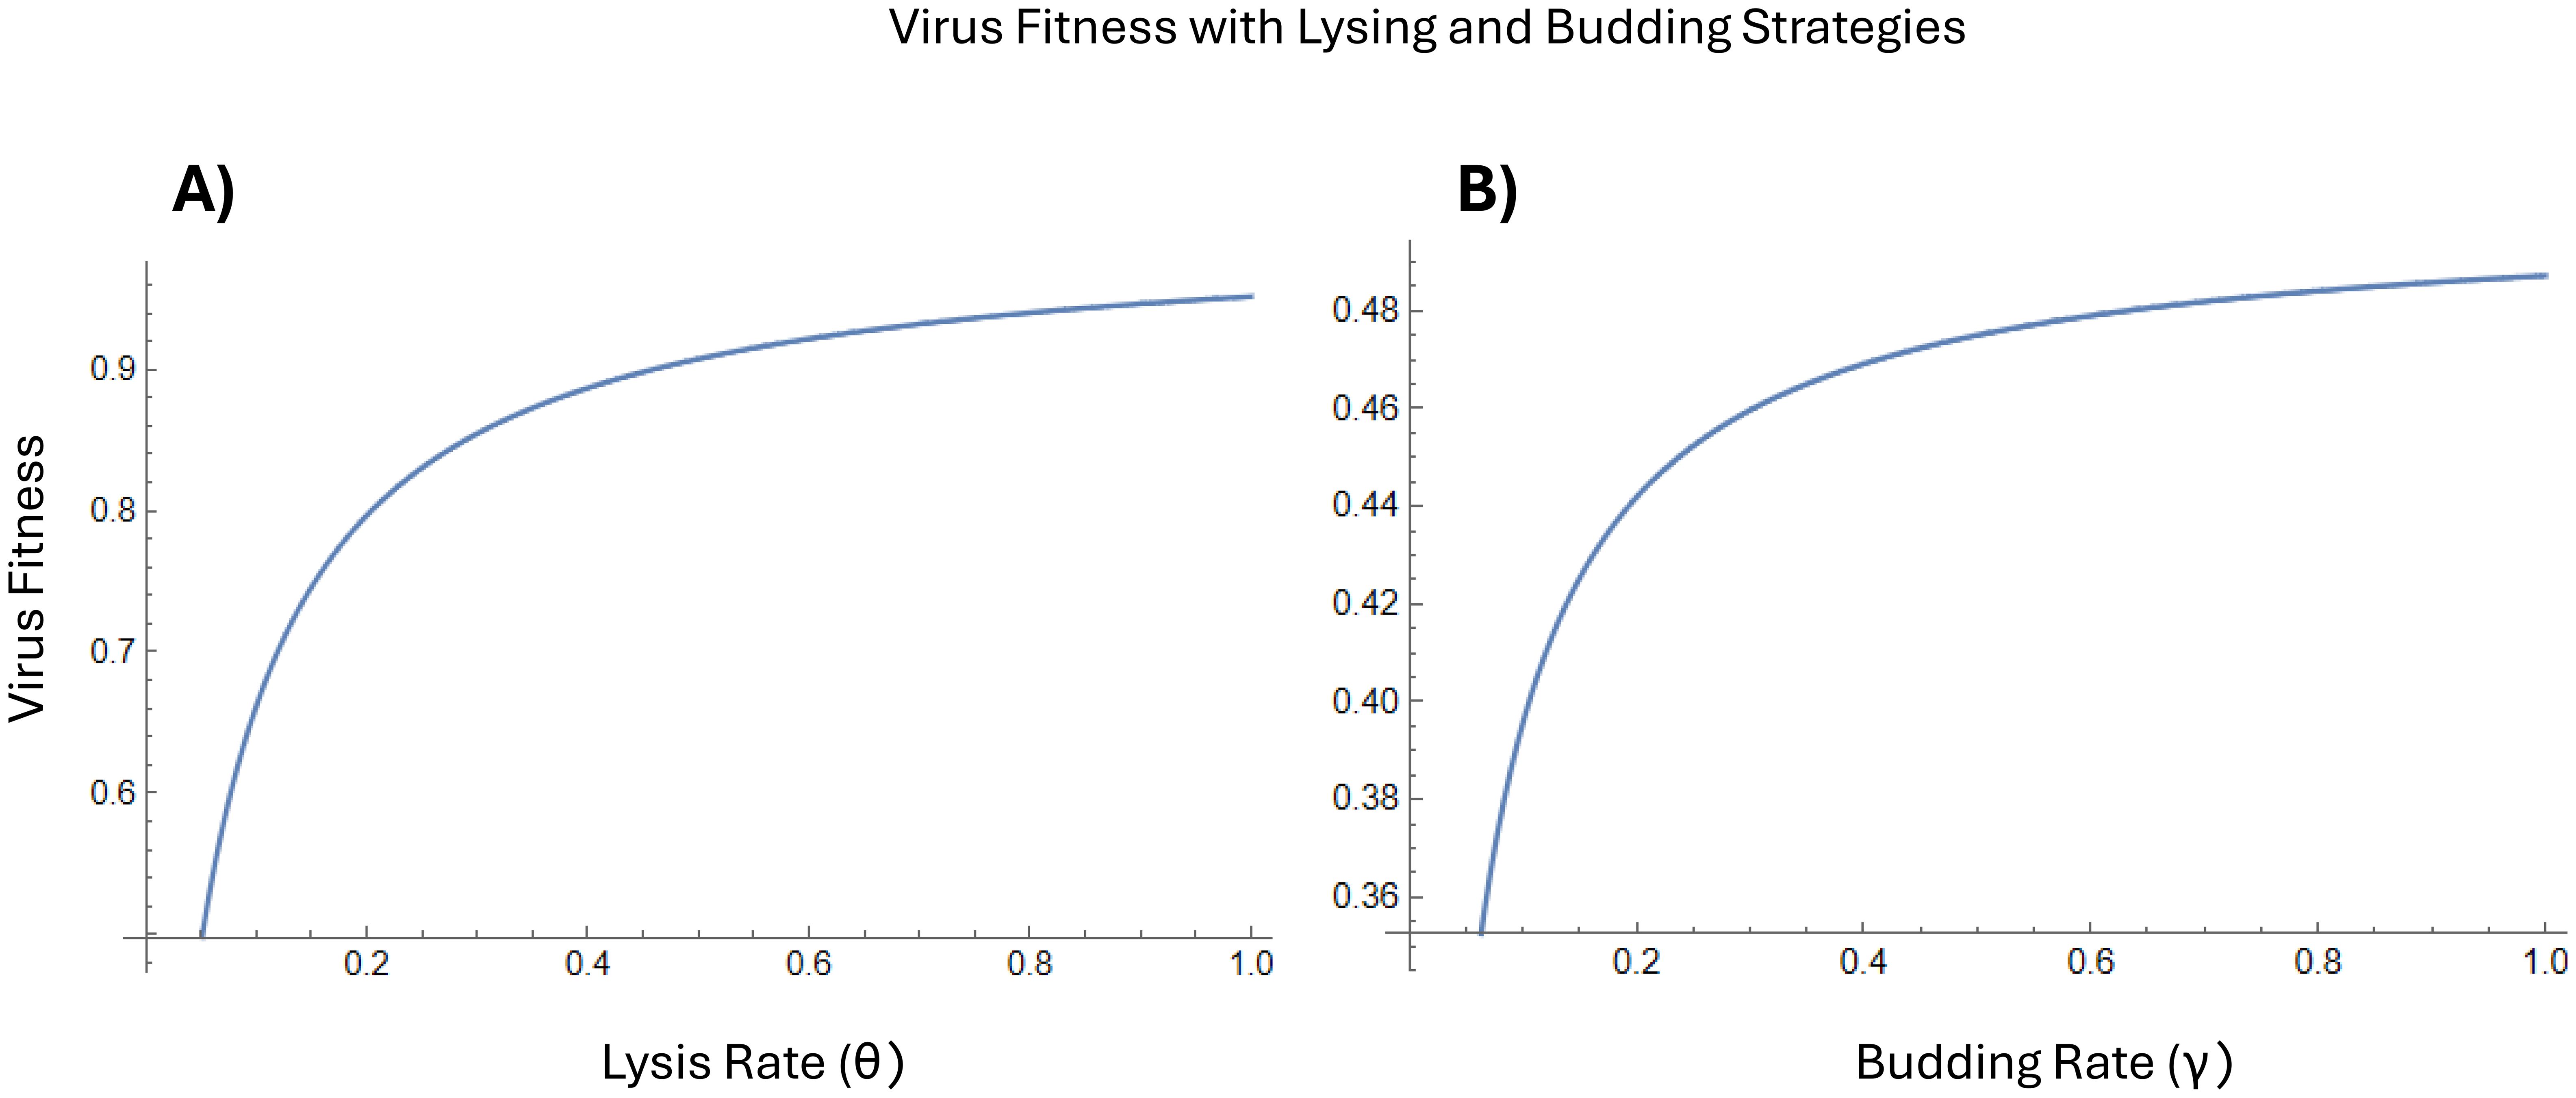
Figure 2. (A) Virus fitness when terms contributing to budding are set to zero and lysis is the only early virus strategy). (B) Virus fitness when terms contributing to lysis are set to zero and budding is the only early virus strategy. In both cases, virus fitness increases as the lysing or budding rate increases. However, there is a higher magnitude of virus fitness when using a lysing strategy.
The effectiveness of the budding and lysing strategies was then evaluated once virus had emerged to determine the fitness of these different strategies when associated with early reinfection dynamics. While one strategy may have been preferred immediately following the emergence of virus, the other may be more preferred when it comes to the virus persisting through the (re)infection of ribocells. The effectiveness of lysing and budding strategies for virus reinfection was evaluated using the virus fitness functions (Equations 5-12). The resulting fitness functions remained unaltered, indicating that lysing could be a preferred reinfection strategy. This analysis also indicated that the maturation rate (m) and the unfaithfully replicated cell death rate (µU) may not have a large impact on the fitness of emerging virus.
Virus fitness
Using Latin hypercube sampling, sensitivity analyses were conducted to determine the effects of certain parameters on virus fitness. See Table 2 for the ranges evaluated for each parameter.
Results from this sensitivity analyses (Figure 3) highlight that virus death rate (μV), budding delay (τ’), and infected cell death rate (μI) – all parameters associated with reinfection – influence virus fitness. The budding delay (τ’) has the most pronounced effect, with virus fitness exponentially decreasing as time delay increases. There are also thresholds where virus fitness is expected to decrease depending on values of μV and μI.
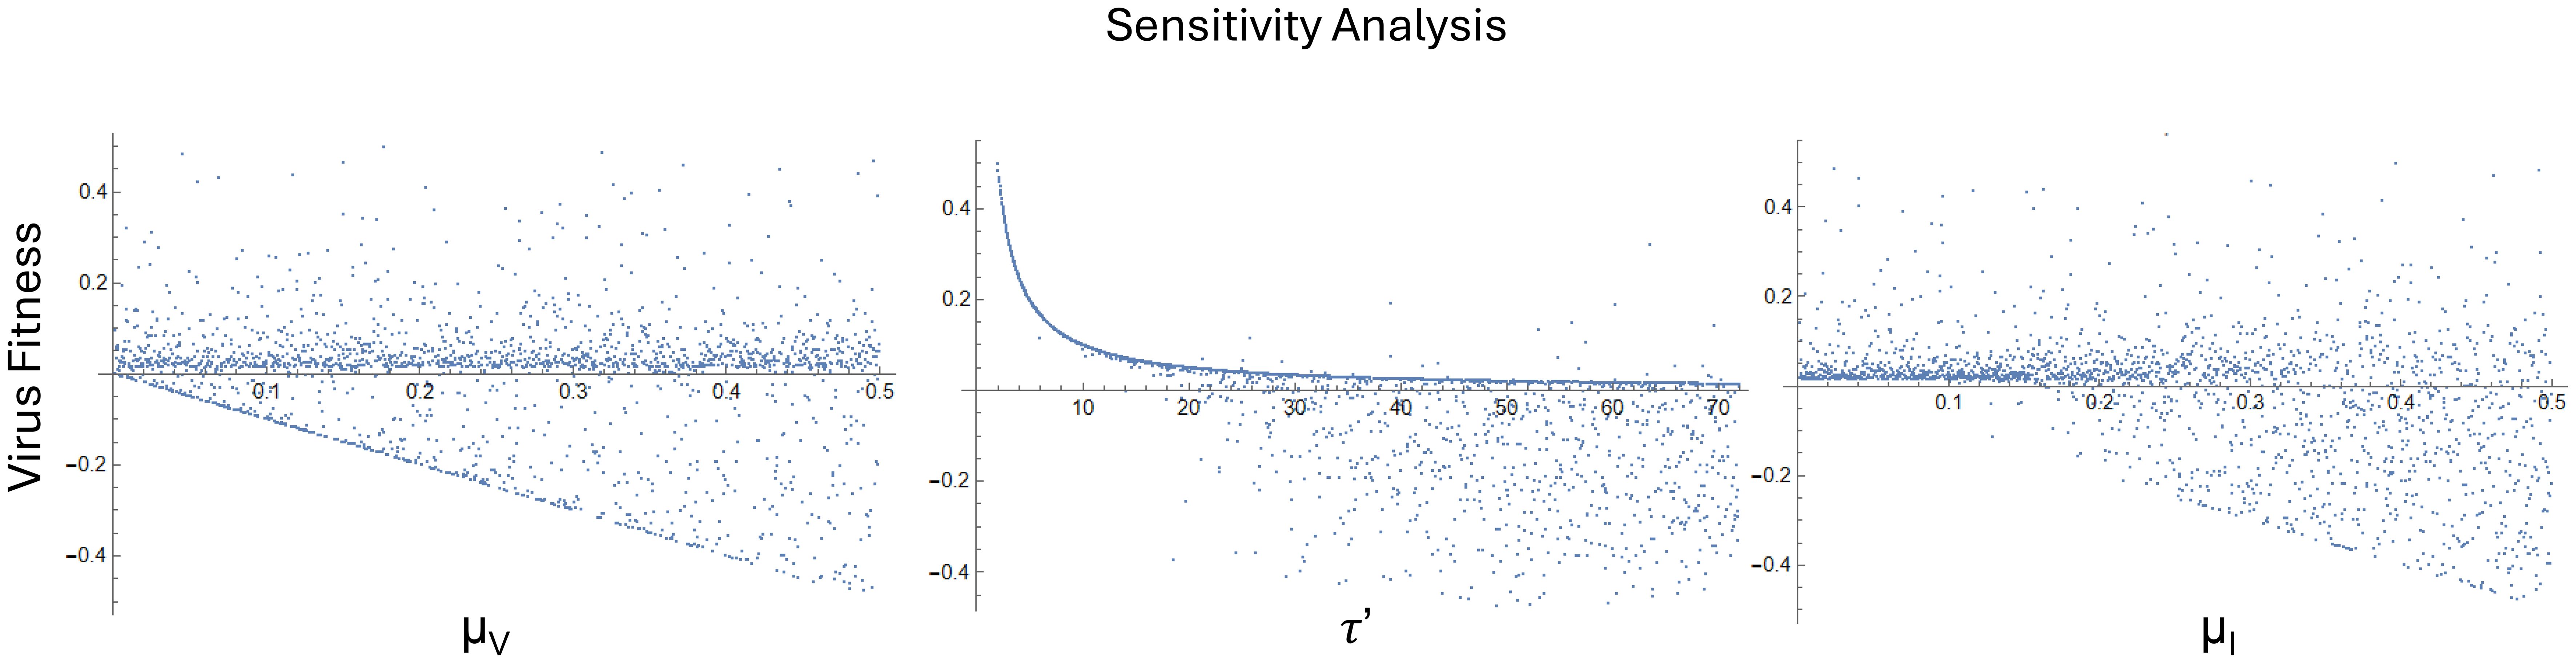
Figure 3. Sensitivity analyses were carried out on parameters relating to ribocell population (R), unfaithfully replicated cell death rate (μU), infected cell death rate (μI), virus death rate (μV), lysis rate (θ), budding rate (γ), lysing time delay (τ), budding time delay (τ’), maturation rate (m), and infection rate (β) using the ranges provided in Table 2. The virus death rate (μV), budding delay (τ’), and infected cell death rate (μI) influence virus fitness more than other parameters.
Deterministic dynamics
Deterministic analyses were used to explore further the parameters identified in the sensitivity analyses. As noted, baseline parameter values are given in Table 2 and the simulated model output are shown in Figure 4. In this analysis, unfaithfully replicated cells (U) remain at a very low level, virus (V) increases exponentially with time, and infected cells (I) follow an epidemic curve over time, with infected cell numbers initially increasing before declining. This figure is used as a comparison for when parameter values are changed in later analyses.
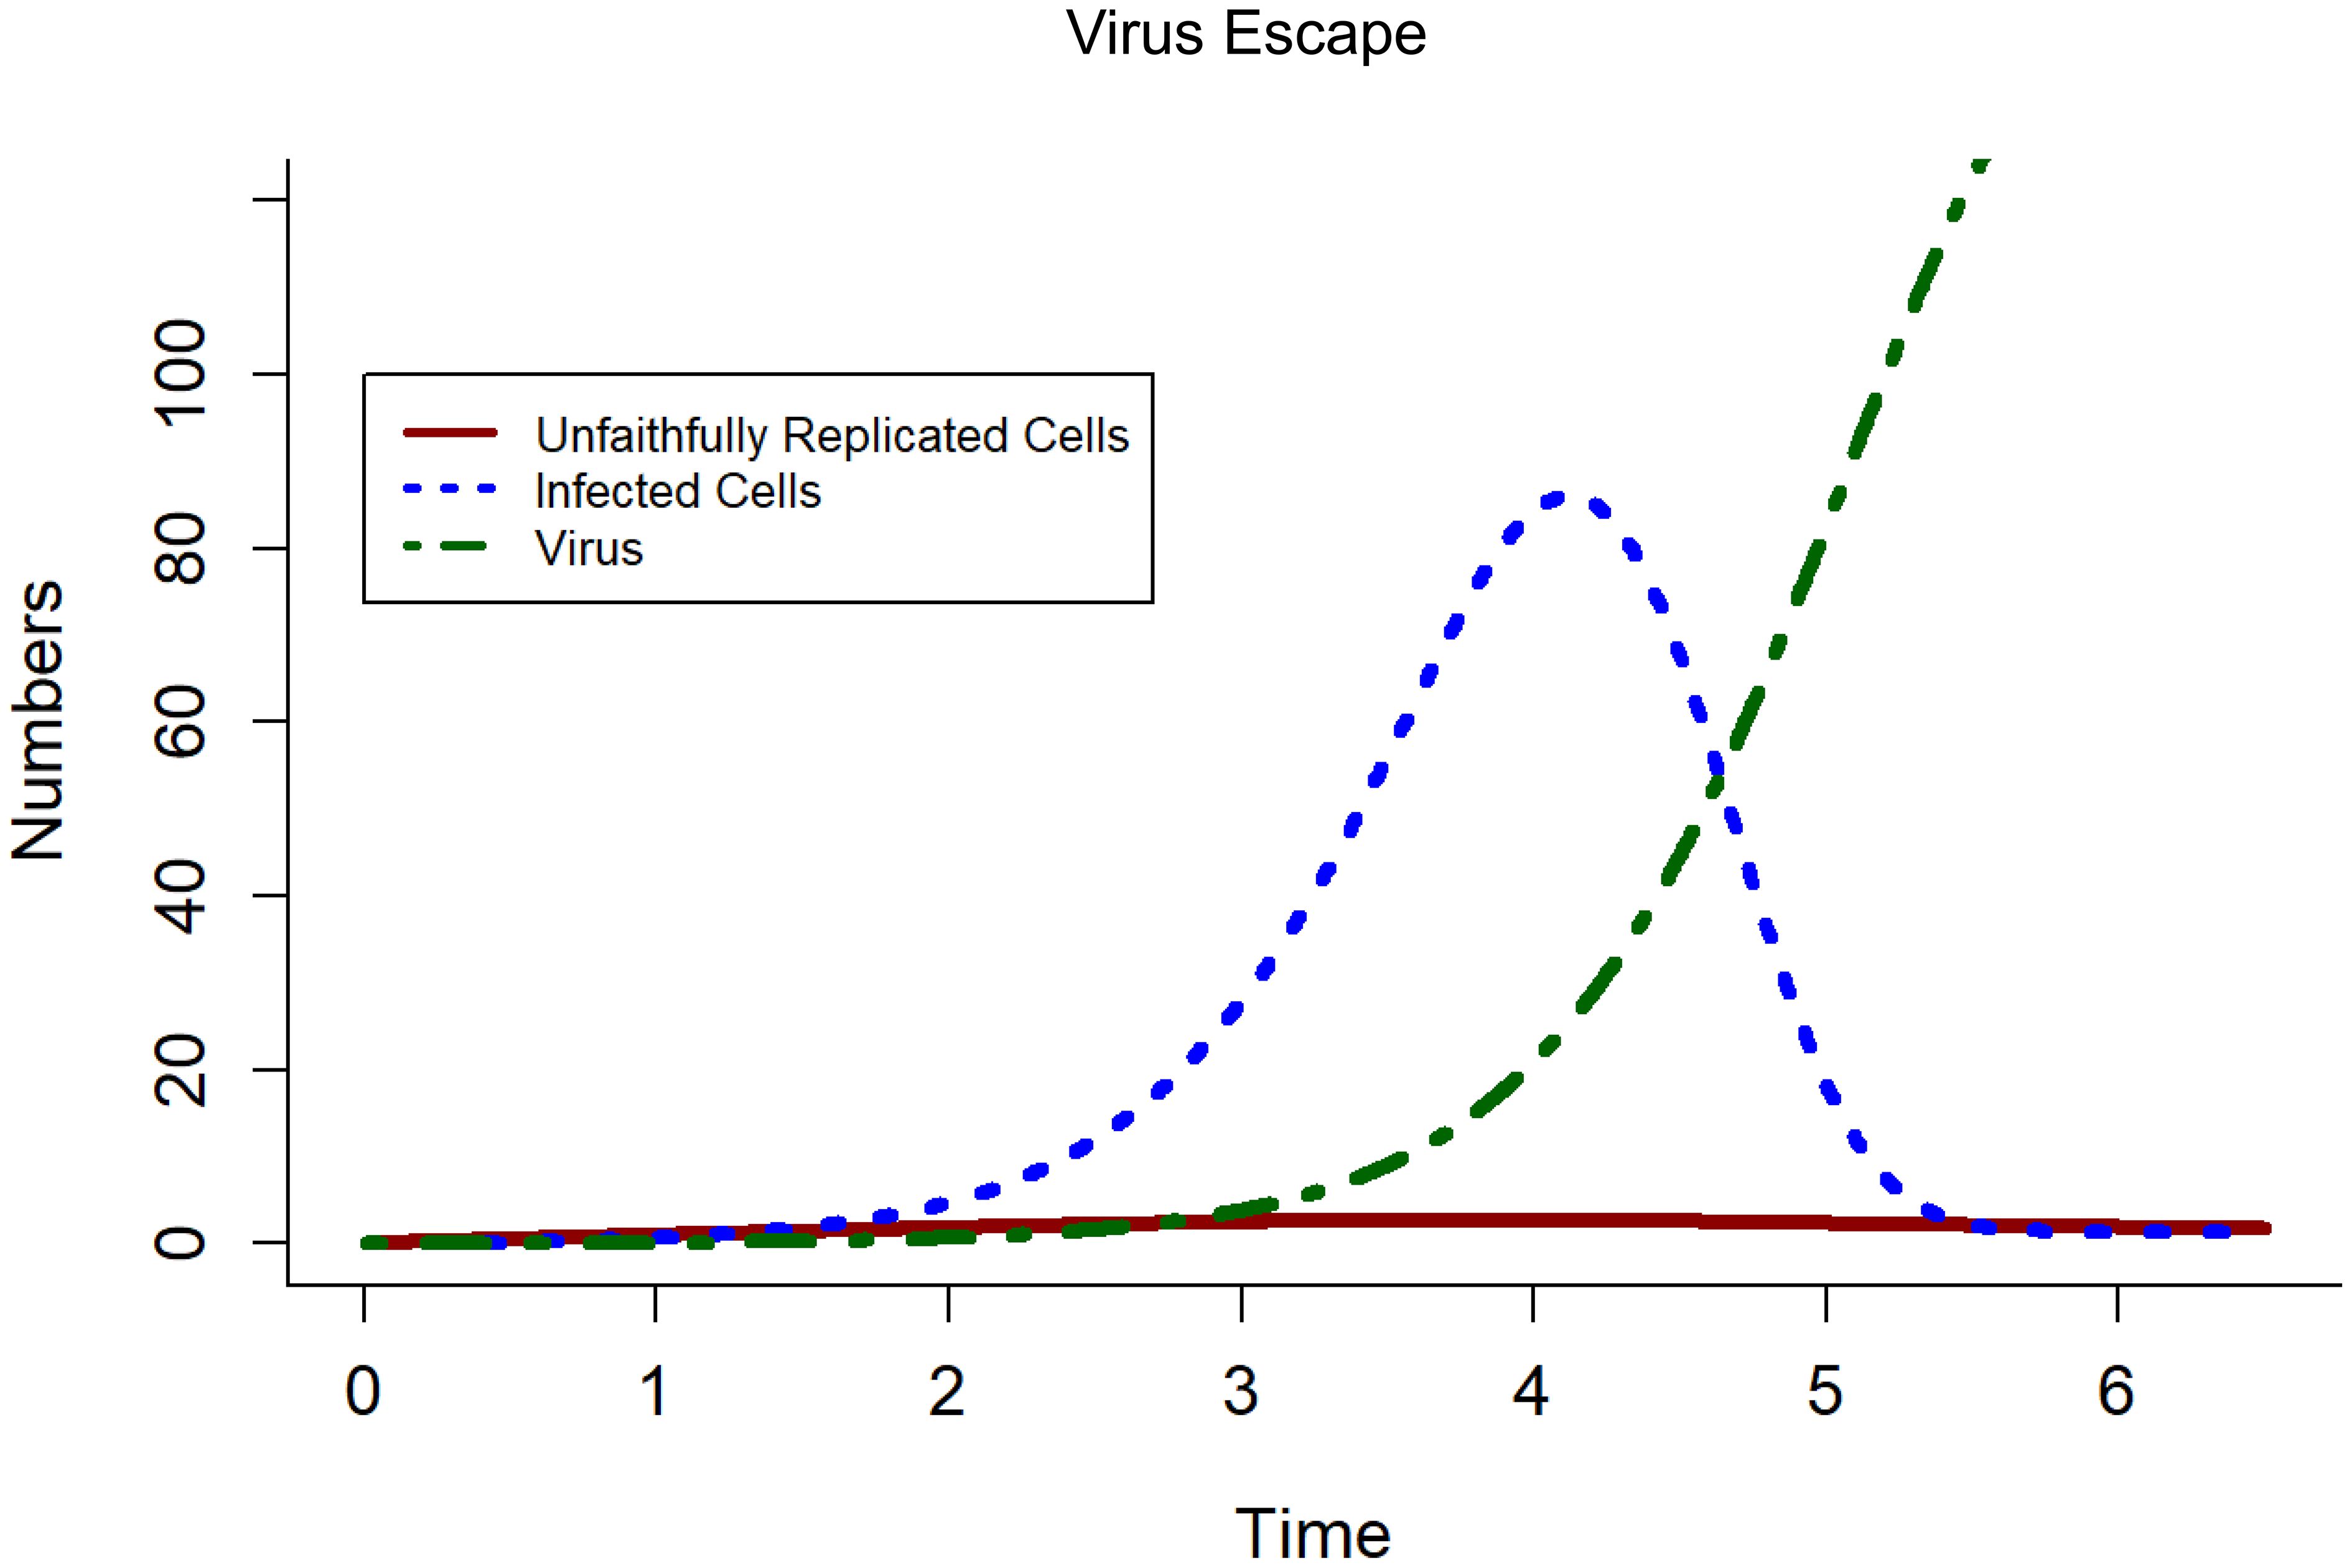
Figure 4. Deterministic model outputs with default parameters values from Table 2. Unfaithfully replicated cells (U) remain at a very low level, virus (V) exponentially increases with time, and infected cells follow a parabolic structure with time increasing initially before decreasing again. This figure is used as a comparison for when parameter values are changed later on.
The potential for reinfection was restricted (i.e., the (re)infection rate (β) was set to 0) to determine how virus emerges via maturation from unfaithfully replicated cells. The maturation rate (m) was then decreased by differing orders of magnitude to explore the lower bounds under which virus emergence occurs. Decreasing the maturation rate (m) by one order of magnitude to 0.02 resulted in nearly no virus being formed while decreasing it further guaranteed no virus emergence. Therefore, in order for virus to emerge from unfaithfully replicated cells alone, the maturation rate must be above a certain critical threshold (essentially when > 0):
Importantly, this threshold in maturation is neither independent of ribocell or unfaithfully replicated cell density, nor independent of life-history parameters of unfaithful cell replication and death rate.
With the infection rate (β) set at zero and the maturation rate (m) fixed at 0.2, values of the cell reproduction rate (λ) and unfaithful cell emergence rate (λ’) were altered to determine how these parameters affect virus emergence. When the cell reproduction rate (λ) is equal to the unfaithful cell emergence rate (λ’), virus emerges at an exponential rate. Similarly, if the cell reproduction rate (λ) is less than the unfaithful cell emergence rate (λ’), again, virus emerges exponentially. When the cell reproduction rate (λ) is two orders of magnitude greater than the unfaithful cell emergence rate (λ’), unfaithfully replicated cells do not emerge, and, therefore, neither does virus. This contrasts with when the cell reproduction rate (λ) is only one order of magnitude greater than the unfaithful cell emergence rate (λ’), in which virus does emerge but at a slower rate than when these rates are equal or when the unfaithful cell emergence rate (λ’) is greater.
With the propensity for reinfection, budding delay (τ’) plays a critical role in virus fitness. This suggests that budding may be an early virus strategy. To investigate this, while fixing all other parameters constant, τ’ was adjusted to evaluate the effect of budding time delays on virus emergence (Figure 5). Initially the budding delay was set to a value of 2.0, and then τ’ was varied from 0.5 and to 1.0 to assess the results when τ’ (budding delay) was less than τ (lysis delay). Next budding delay was increased to a value greater than the lysis delay (τ), such that τ’ = 5.0. These results showed that the shorter the budding delay, the more rapidly virus emerges and the longer the budding delay, the slower infected cells emerge and die out.
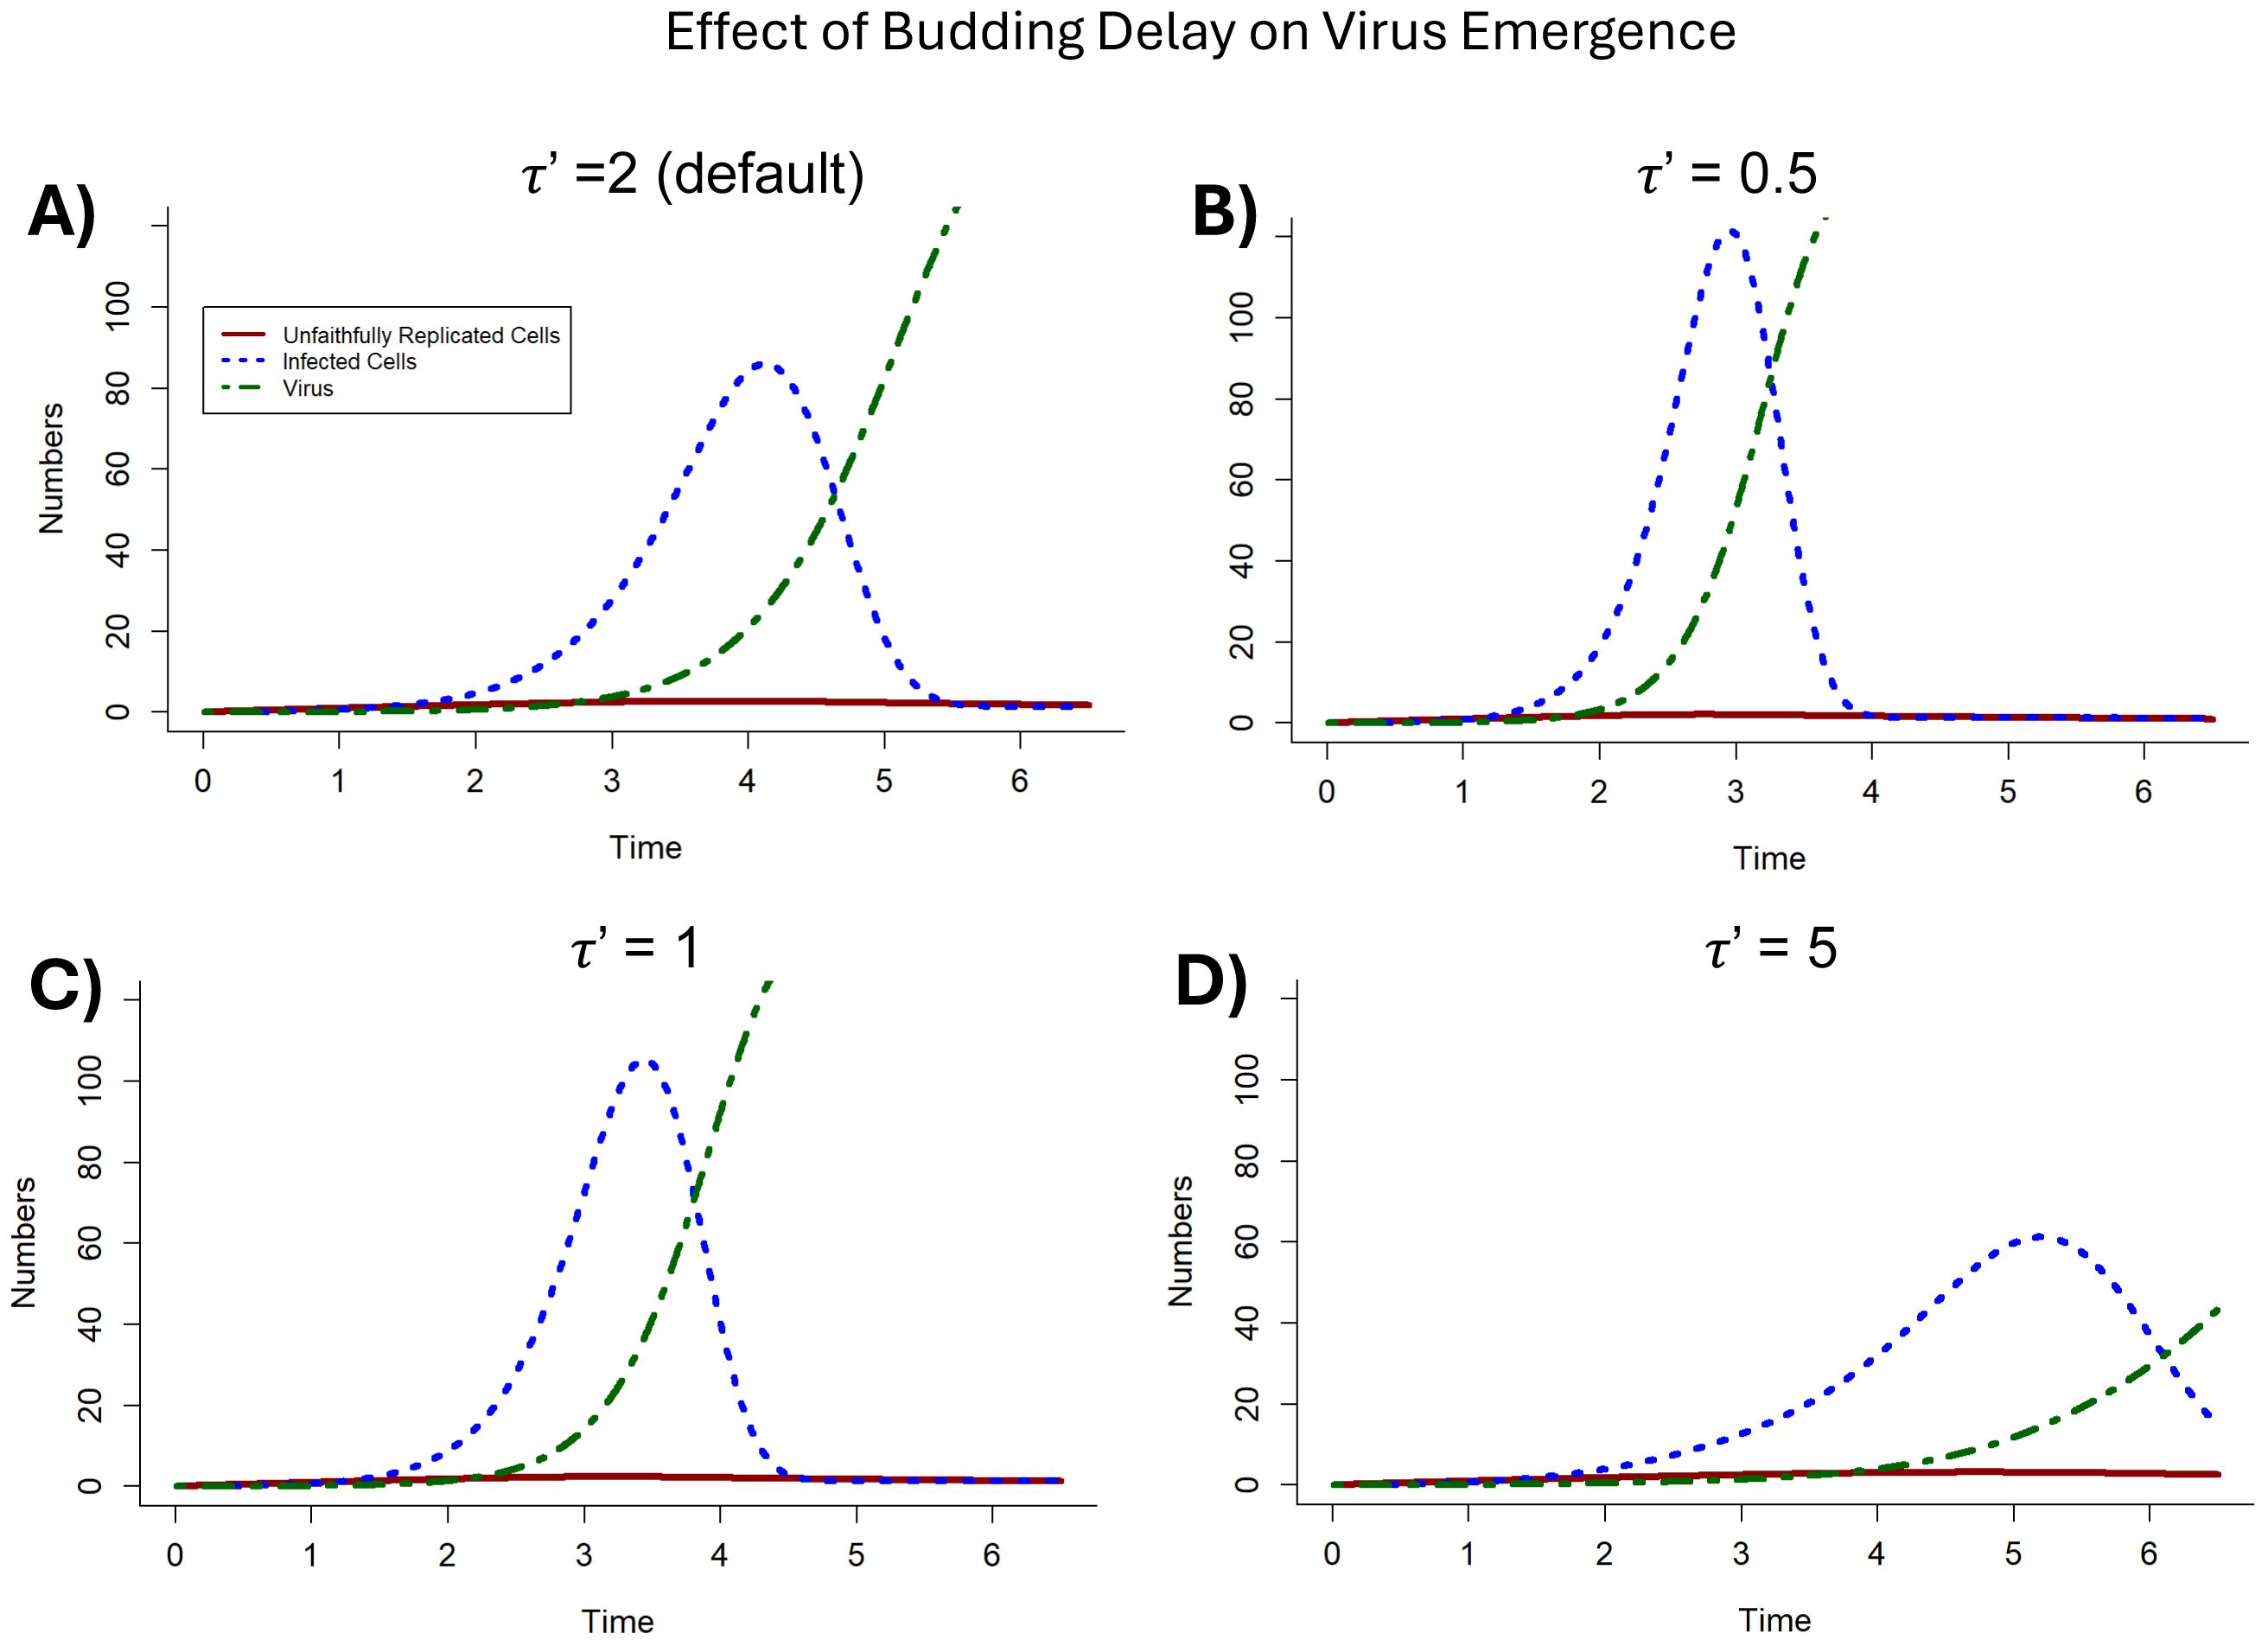
Figure 5. The effect of differing values of the budding delay (τ’) on virus emergence. (A) The impact on virus emergence when τ’ = 2 (as in Figure 4) is included for comparison to other values of τ’. (B) When the budding delay τ’ is ¼ of the default value such that τ’ = 0.5. (C) When the budding delay τ’ is ½ of the default value such that τ’ = 1. (D) When the budding delay τ’ is greater than the default value such that τ’ = 5. .
Subsequently, the effect of virus clearance rate (μV) on virus fitness was evaluated. The value was first increased over an order of magnitude from 0.01 to 0.1, which had little effect on virus fitness. To investigate the effect of virus clearance rate, the effects of a higher bound of μV on virus emergence were explored (μV = 0.9). Under these conditions, virus emerges at a slower rate and reaches a maximum population threshold before declining. Lower bounds of virus clearance rate on virus fitness were investigated by decreasing μV (to a limit of μV = 0.0001) but, again, there was little change to the results and, hence, little effect on virus fitness. With increasing values of μV, there was a negative impact on the propensity of virus to emerge. This change is evident when virus clearance rate is greater than 0.2. These results indicate that there is a critical threshold in the virus clearance rate which can impact the early evolution of virus emergence and persistence.
The infected cell death rate (μI) was also evaluated by varying the parameter values. Increasing infected cell death rate by an order of magnitude from 0.01 to 0.1 had little influence on the emergence of virus. Investigating upper bounds on the infected cell death rate (μI = 0.9) resulted in less virus emerging at a slower rate. Exploring the lower bounds of infected cell death rate (μI = 0.0001) revealed no significant alteration in the emergence of virus. As above, increasing values of μI negatively impacted virus emergence beyond the threshold (μI > 0.2).
The relationship between the maturation rate (m) and infection rate (β) was examined through different parameter combinations (Figure 6A). Initially, the maturation rate was set to half the infection rate (m = 0.1; β = 0.2) rather than double in the default parameter set. Then the maturation rate (m) and infection rate (β) were set to be equal (m = 0.1; β = 0.1). Neither of these alterations significantly effected virus fitness and, thus, virus emergence (Figure 6A).
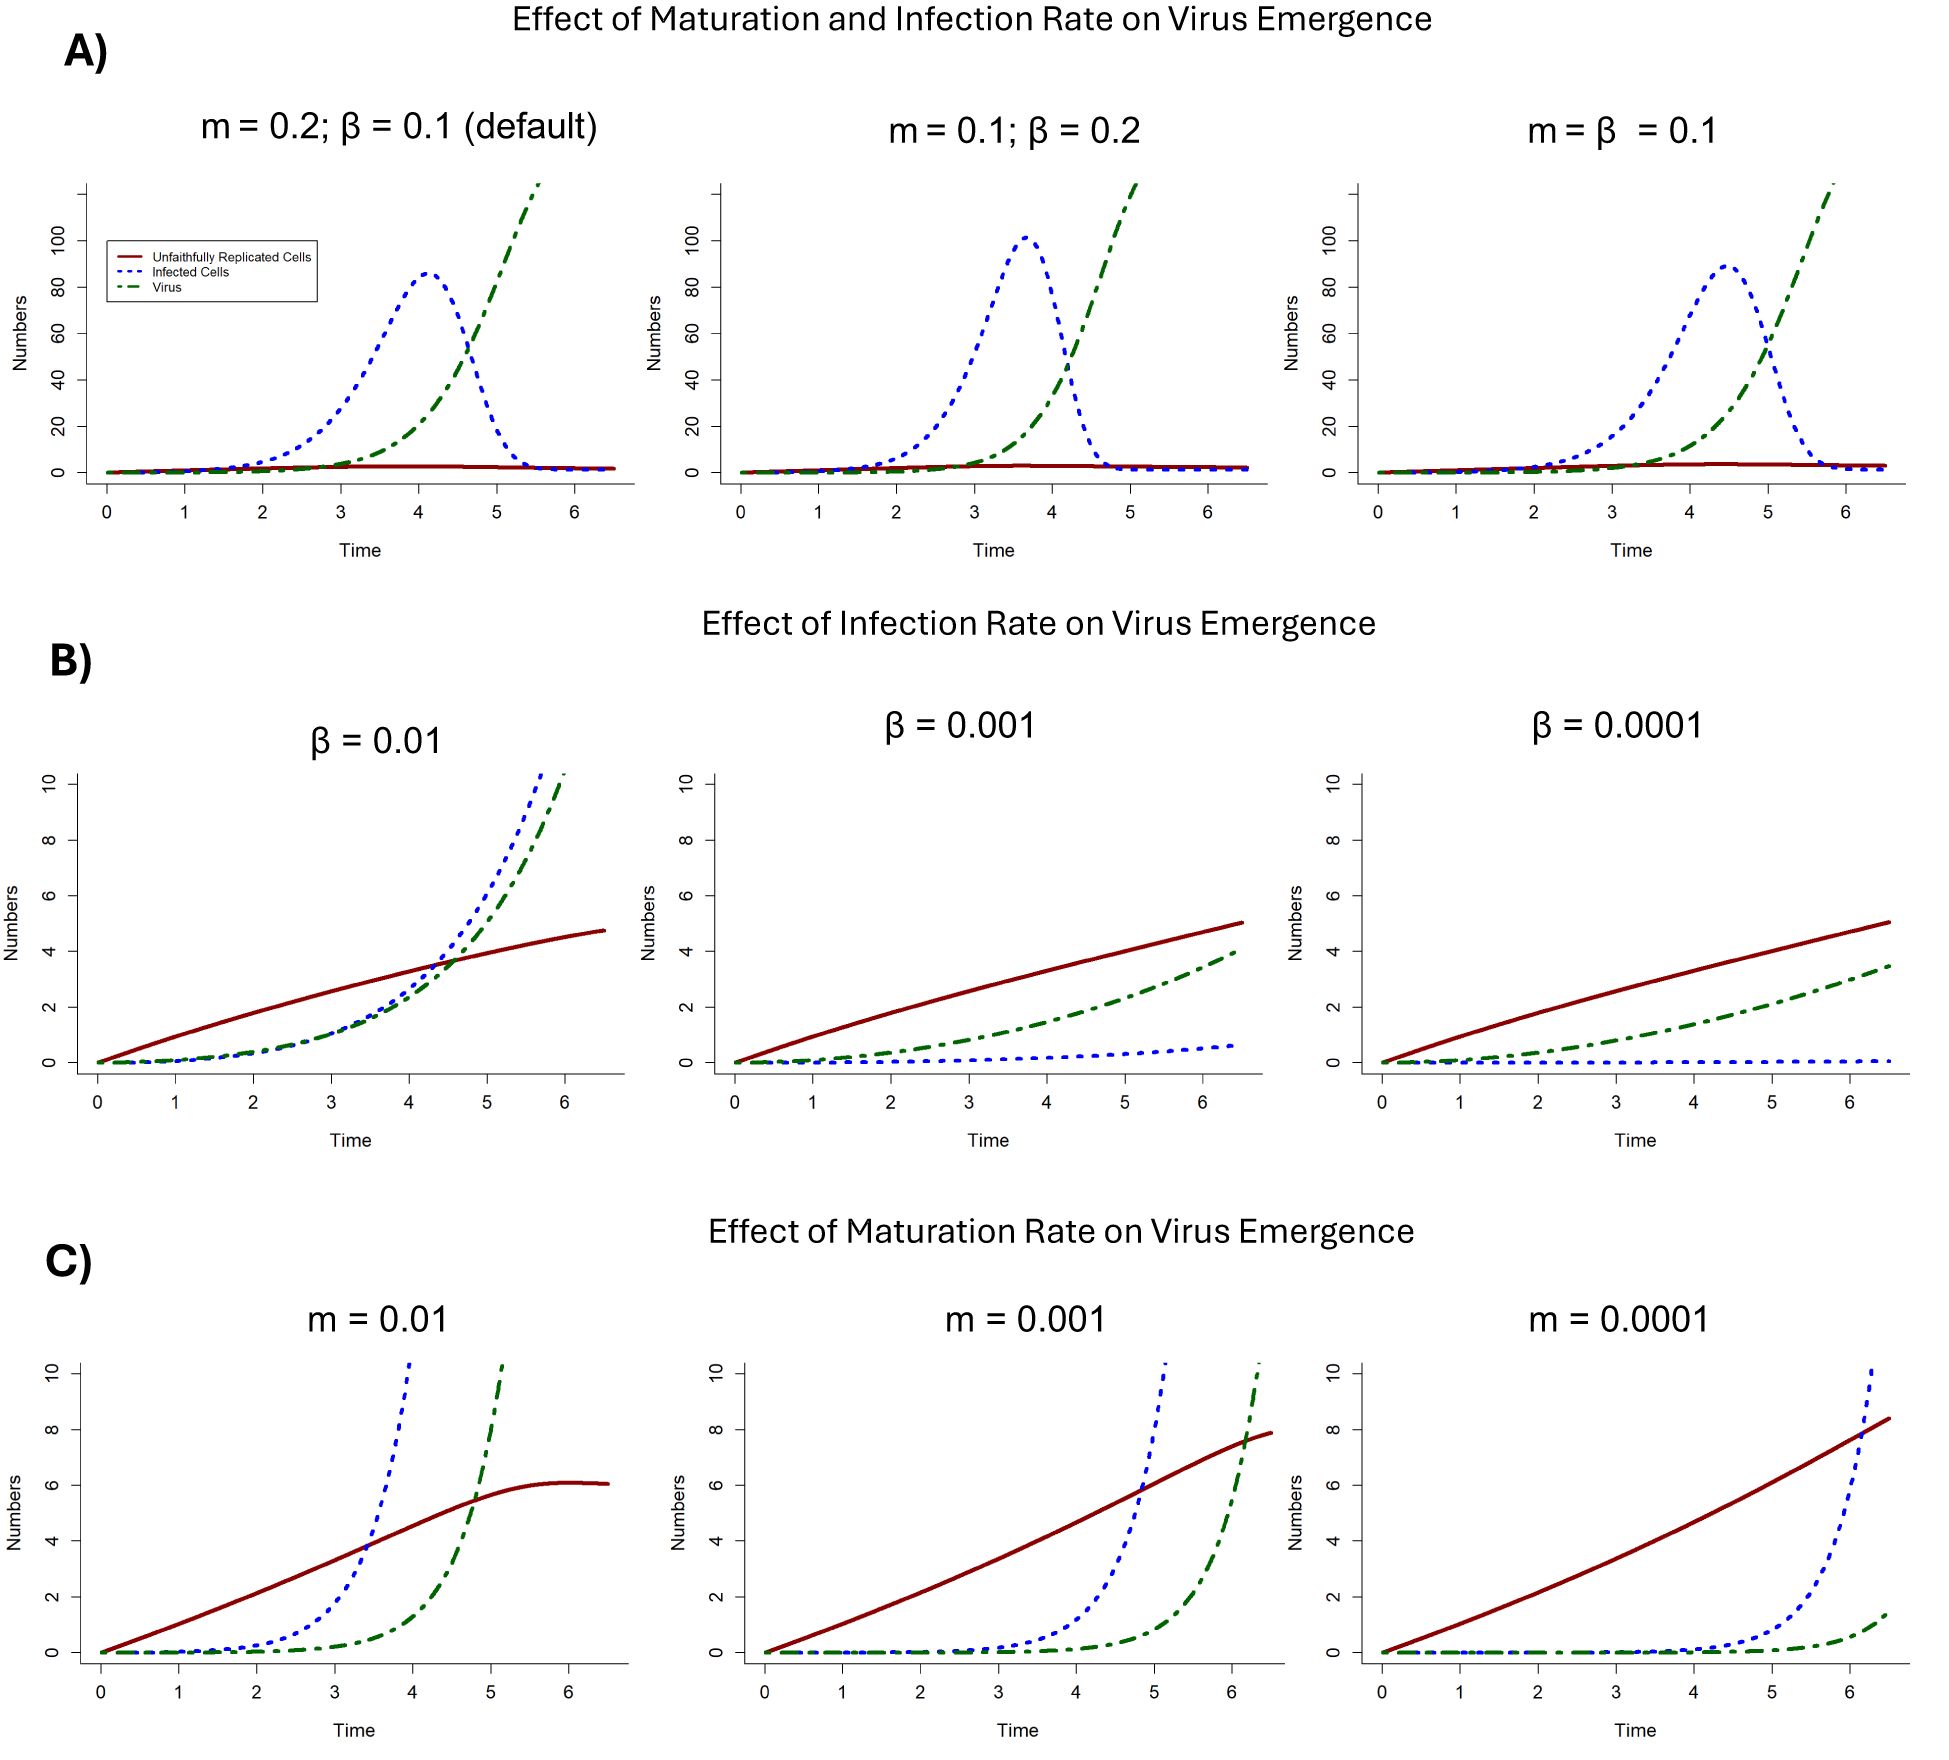
Figure 6. The effects of maturation rate (m) and infection rate (β) on virus emergence. (A) The impact on virus emergence: when maturation rate is greater than infection rate (m > β) with default parameter values (as in Figure 3) for comparison (left); when m < β (middle); and when m = β (right). (B) The impact on virus emergence when maturation rate is constant (m = 0.2) and the infection rate (β) decreases by orders of magnitude such that β = 0.01 (left); β = 0.001 (middle); and β = 0.0001 (right). (C) The impact on virus emergence when the infection rate β is constant (β = 0.1) and the maturation rate (m) decreases by orders of magnitude such that m = 0.01 (left); m = 0.001 (middle); and m = 0.0001 (right).
The interaction between maturation rate and reinfection rate were further examined by changing their values by differing orders of magnitude. By keeping maturation rate constant (m = 0.2), infection rate was evaluated at different values (β = 0.01; 0.001; 0.0001). As the infection rate decreases, virus emergence and infected cell emergence occur at a slower rate. Below a threshold value (β < 0.01), virus emergence is severely restricted with less virus being produced (and only occurring through maturation of unfaithfully replicated cells) and infected cell emergence does not occur (Figure 6B).
By keeping infection rate constant (β = 0.1), the effects of maturation rate on virus emergence were evaluated at different values (m = 0.01; 0.001; 0.0001) (Figure 6C). When the maturation rate was low (m = 0.01), infected cells and virus emerge and grow exponentially, but unfaithfully replicated cells eventually stabilize. As maturation rate decreases (m = 0.001), while infected cells and virus emergence grow exponentially, they take longer to emerge. Finally, further decreasing the rate (m = 0.0001) negatively impacts virus emergence occurring at later time steps. Interestingly, infected cell emergence still grows exponentially with continuing reinfection of ribocells.
Stochastic dynamics
Stochastic models were used to determine the probability of the emergence of unfaithfully replicated cells (U), infected cells (I) and virus (V) using different parameter combinations (Table 2) for the escape hypothesis. These results provided insight into how different combinations of maturation rate (m) and infection rate (β) affected virus emergence probability.
The infection rate (β) was set to 0 to determine how often virus emerges via maturation from unfaithfully replicated cells. We define emergence probability as the number of instances the model successfully produces emerging virus over the runtime of the model. This yielded a 99% probability of the emergence of unfaithfully replicated cells (U), a 91% probability of the emergence of virus (V), and, as expected, no probability of the emergence of infected cells. The maturation rate was then decreased by differing orders of magnitude to explore the lower bounds of virus emergence. When m = 0.02, the probability of emergence of unfaithfully replicated cells (U) remains constant, but the probability that virus emerges decreased to 25%. Supporting this trend, when m = 0.002, the probability of virus emerging further decreases to 5%.
With the infection rate still negligible (β = 0) and the maturation rate (m) set to 0.2, values of the cell reproduction rate (λ) and unfaithful cell emergence rate (λ’) were varied to determine how these processes affect virus emergence. When these values were set to an equal value of 0.05, there was a 100% probability of both unfaithfully replicated cell (U) and virus (V) emergence. When λ = 0.005 and λ’ = 0.05, there was a 100% probability of both unfaithfully replicated cell (U) and virus (V) emergence. These results indicated that when λ’ ≥ λ, viruses will always emerge through maturation of unfaithfully replicated cells. To verify this, λ was set higher than λ’ by three orders of magnitude. With this parameter, there was only a 3% probability of unfaithfully replicated cells (U) and a 1% probability of virus (V) emergence.
When the maturation rate was double the infection rate (m = 0.2; β = 0.1), there was a high likelihood of emergence for U (87%), I (88%), and V (88%). When the maturation rate was half the infection rate (m = 0.1; β = 0.2), there was a higher likelihood of emergence for U (91%) and a lower likelihood of emergence for I (75%), and V (75%). When the maturation rate was equal to the infection rate (m = 0.1; β = 0.1), there was an even higher likelihood of emergence for U (97%) and a slightly lower probability for I (73%), and V (75%). These results indicate that if the maturation rate is greater than the infection rate by at least twofold, there is a higher probability for the emergence of viruses and infected cells.
The maturation rate and infection rate were further examined by adjusting their values by orders of magnitude to define the relationship these parameters have on emergence. First, the maturation rate was held at constant value (m = 0.1) while the infection rate was continually decreased. If the maturation rate is one order of magnitude higher than the infection rate (β = 0.01), there is an almost guaranteed emergence of U (99%), while the probability of emergence of V (67%) and I (63%) remains lower. Decreasing β by another order of magnitude (β = 0.001) leads to a 100% probability of the emergence of unfaithfully replicated cells. Interestingly, these parameters yielded a 78% chance of virus emergence, but only 37% of infected cell emergence. This indicated that while virus emergence was likely with these parameters, it rarely became successful enough to infect cells. Lowering the infection rate (β = 0.0001) more again results in 100% probability of the emergence of unfaithfully replicated cells, while the chance of virus emergence is 75% and the chance of infected cell emergence drops to 6%.
Next, the infection rate was held constant (β = 0.1) while the maturation rate was decreased by different orders of magnitude. When the maturation rate was set to 0.01, interestingly there was a 100% probability of unfaithfully replicated cell emergence, but only a 16% probability for the emergence of both virus and infected cells. When the infection rate was decreased by another order of magnitude (m = 0.001), there was still a 100% probability for unfaithfully replicated cell emergence but only a 1% chance of emergence of virus or infected cells. After decreasing the maturation rate by one more order of magnitude (m = 0.0001), results showed a 100% probability of unfaithfully replicated cell emergence and a 0% probability of virus and infected cell emergence. These results indicated that the maturation rate needs to be sufficiently high to produce viruses capable of infecting cells.
The model parameters were also adjusted to determine if virus emergence was more likely through lysing or budding strategies, using the default parameters above for maturation rate and infection rate (m = 0.2; β = 0.1). When setting the lysis rate (θ) to 0 and keeping the budding rate (γ) at 1, there is an 89% probability of virus emergence, 90% probability of infected cell emergence, and 88% probability of unfaithfully replicated cell emergence (Figure 7). When keeping the lysis rate (θ) at 1 and changing the budding rate (γ) to 0, there is a 91% probability of virus emergence, 91% probability of infected cell emergence, and 93% probability of unfaithfully replicated cell emergence (Figure 8).
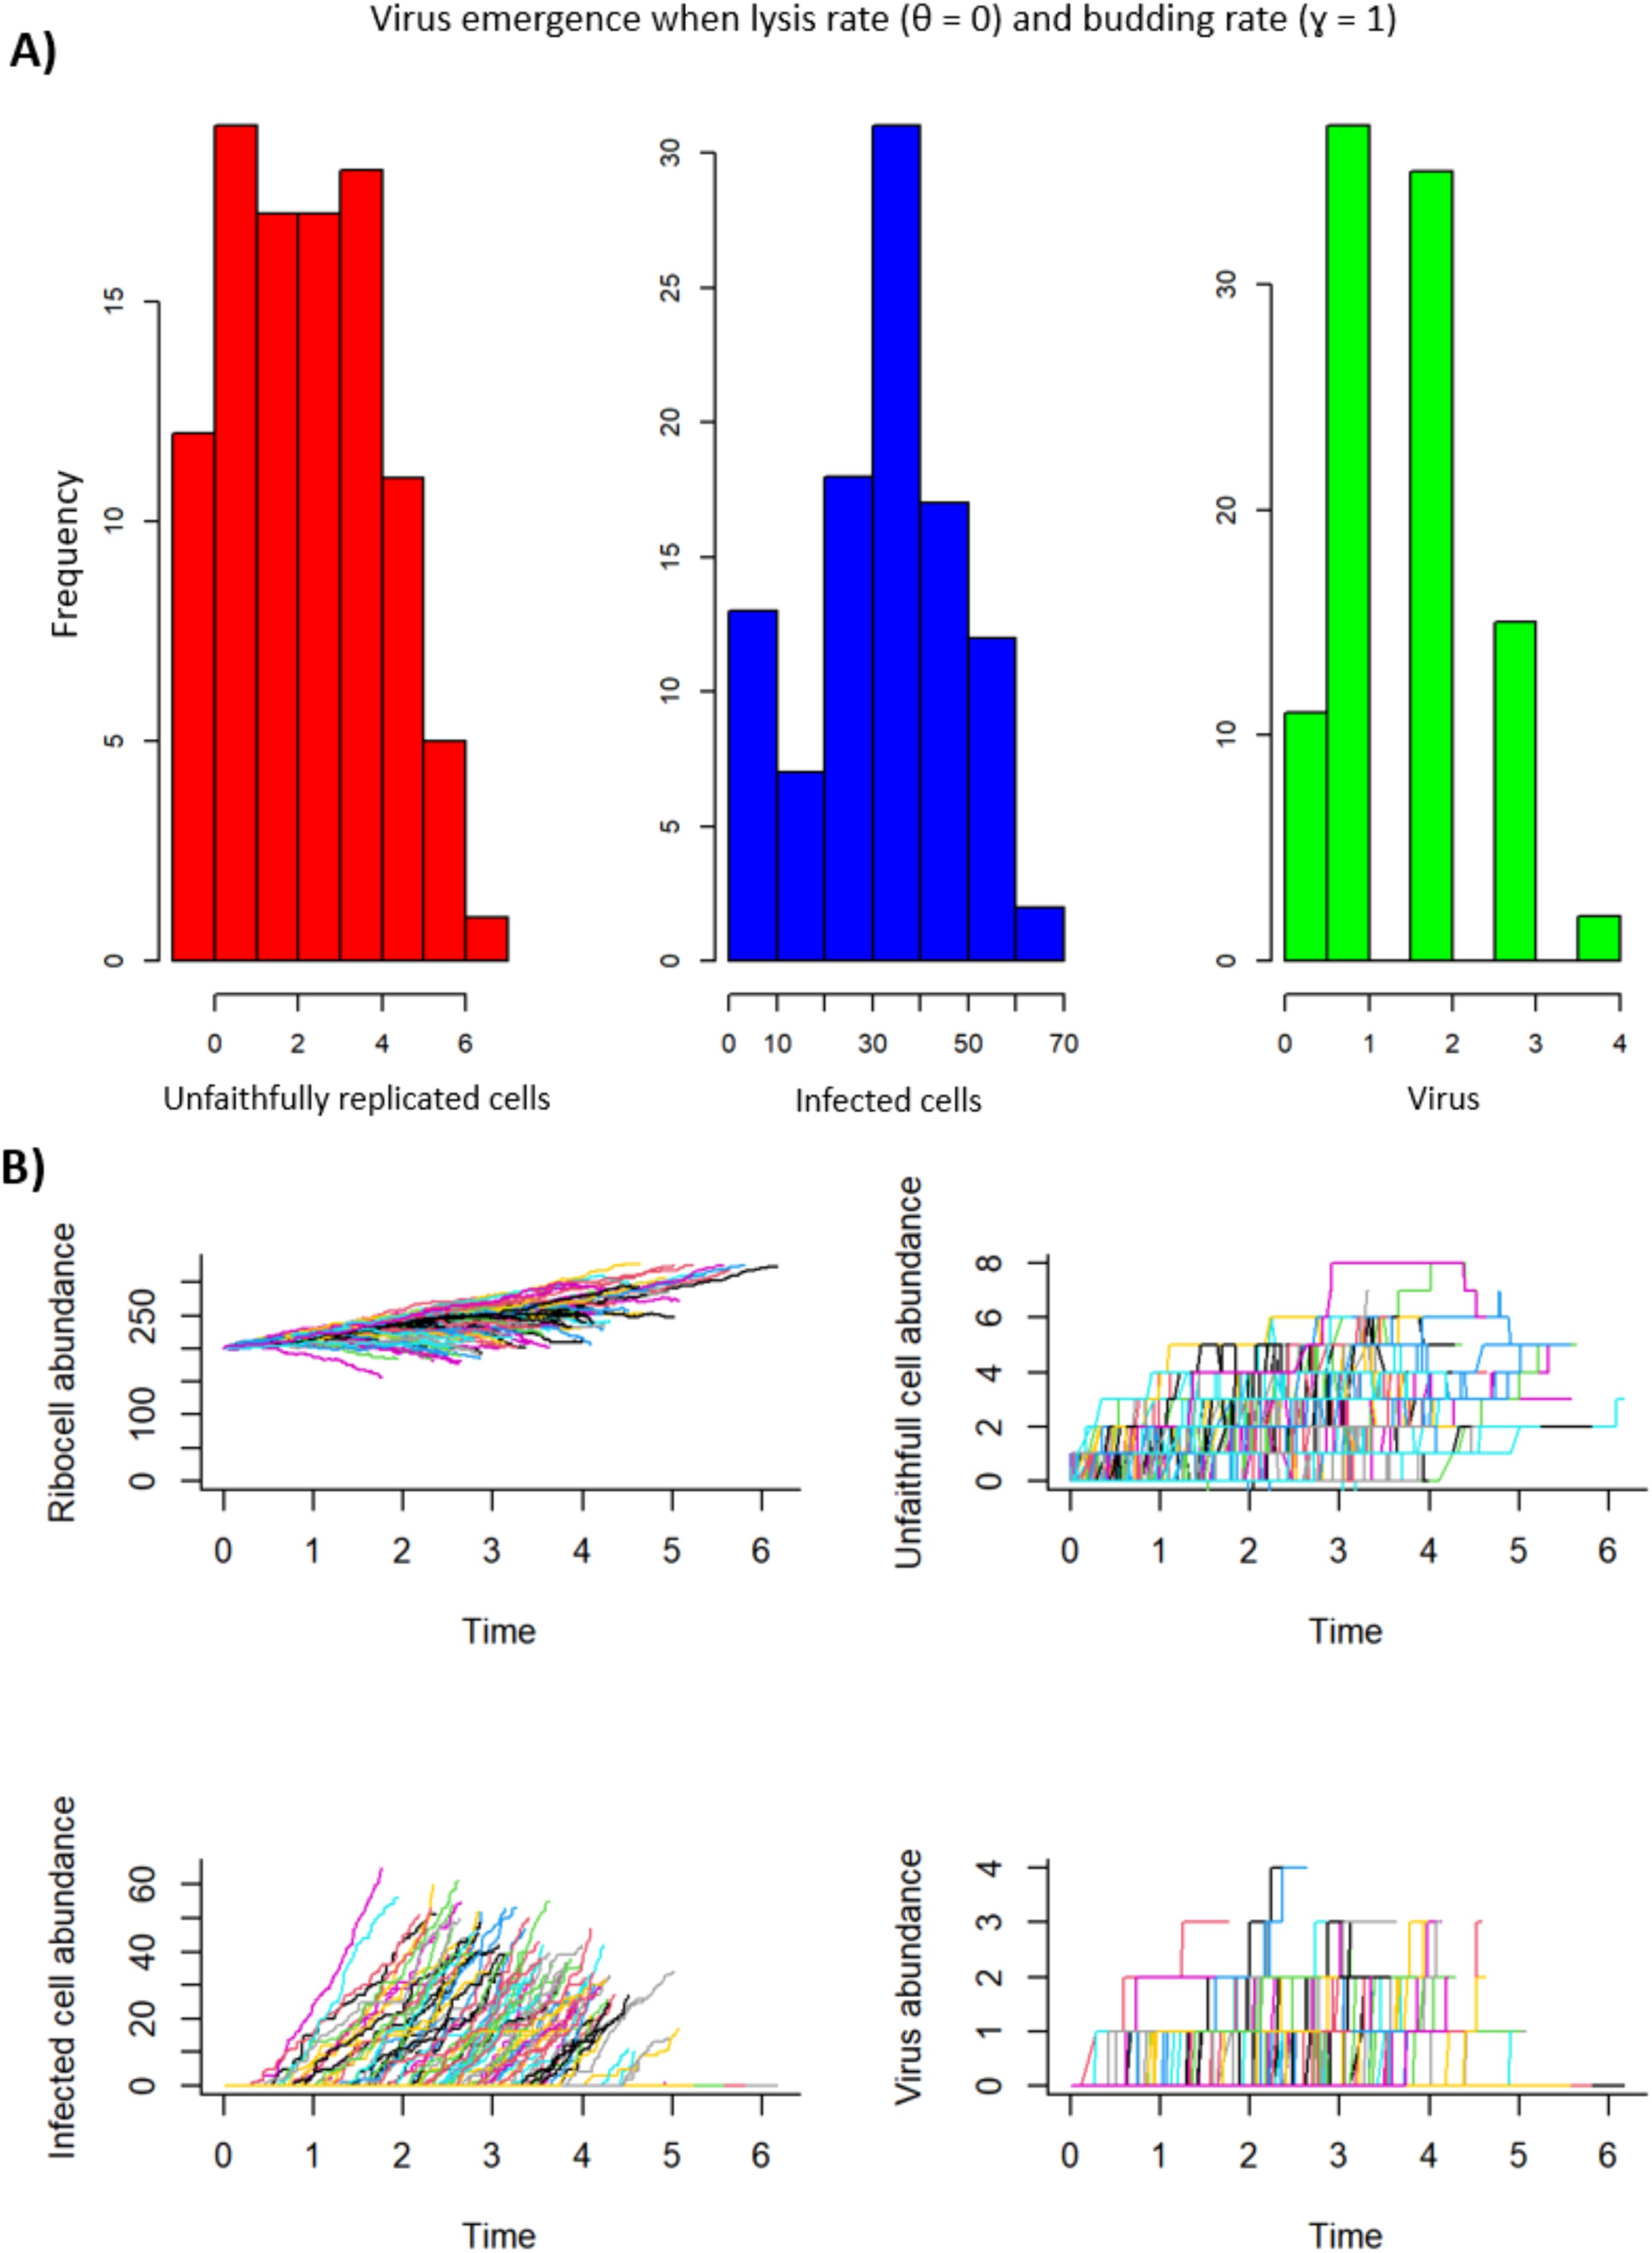
Figure 7. Virus emergence with a budding strategy where the lysis rate (θ = 0) and the budding rate (γ = 1). For unfaithfully replicated cells (U), the mean = 2.64, the variance = 3.42, and the coefficient of variation (CV) = 0.70. For infected cells (I), the mean = 32.47, the variance = 266.29, and the CV = 0.50. For virus (V), the mean = 1.6, the variance = 0.89, and the CV = 0.59. (A) A histogram representation of the frequency per model iteration of the number of unfaithfully replicated cells, infected cells, and virus produced. (B) Ribocell (R), unfaithfully replicated cell (U), infected cell (I), and virus abundance (V) over time. Each positive line represents emergence and dynamics of R, U, I and V for an iteration of the model run.
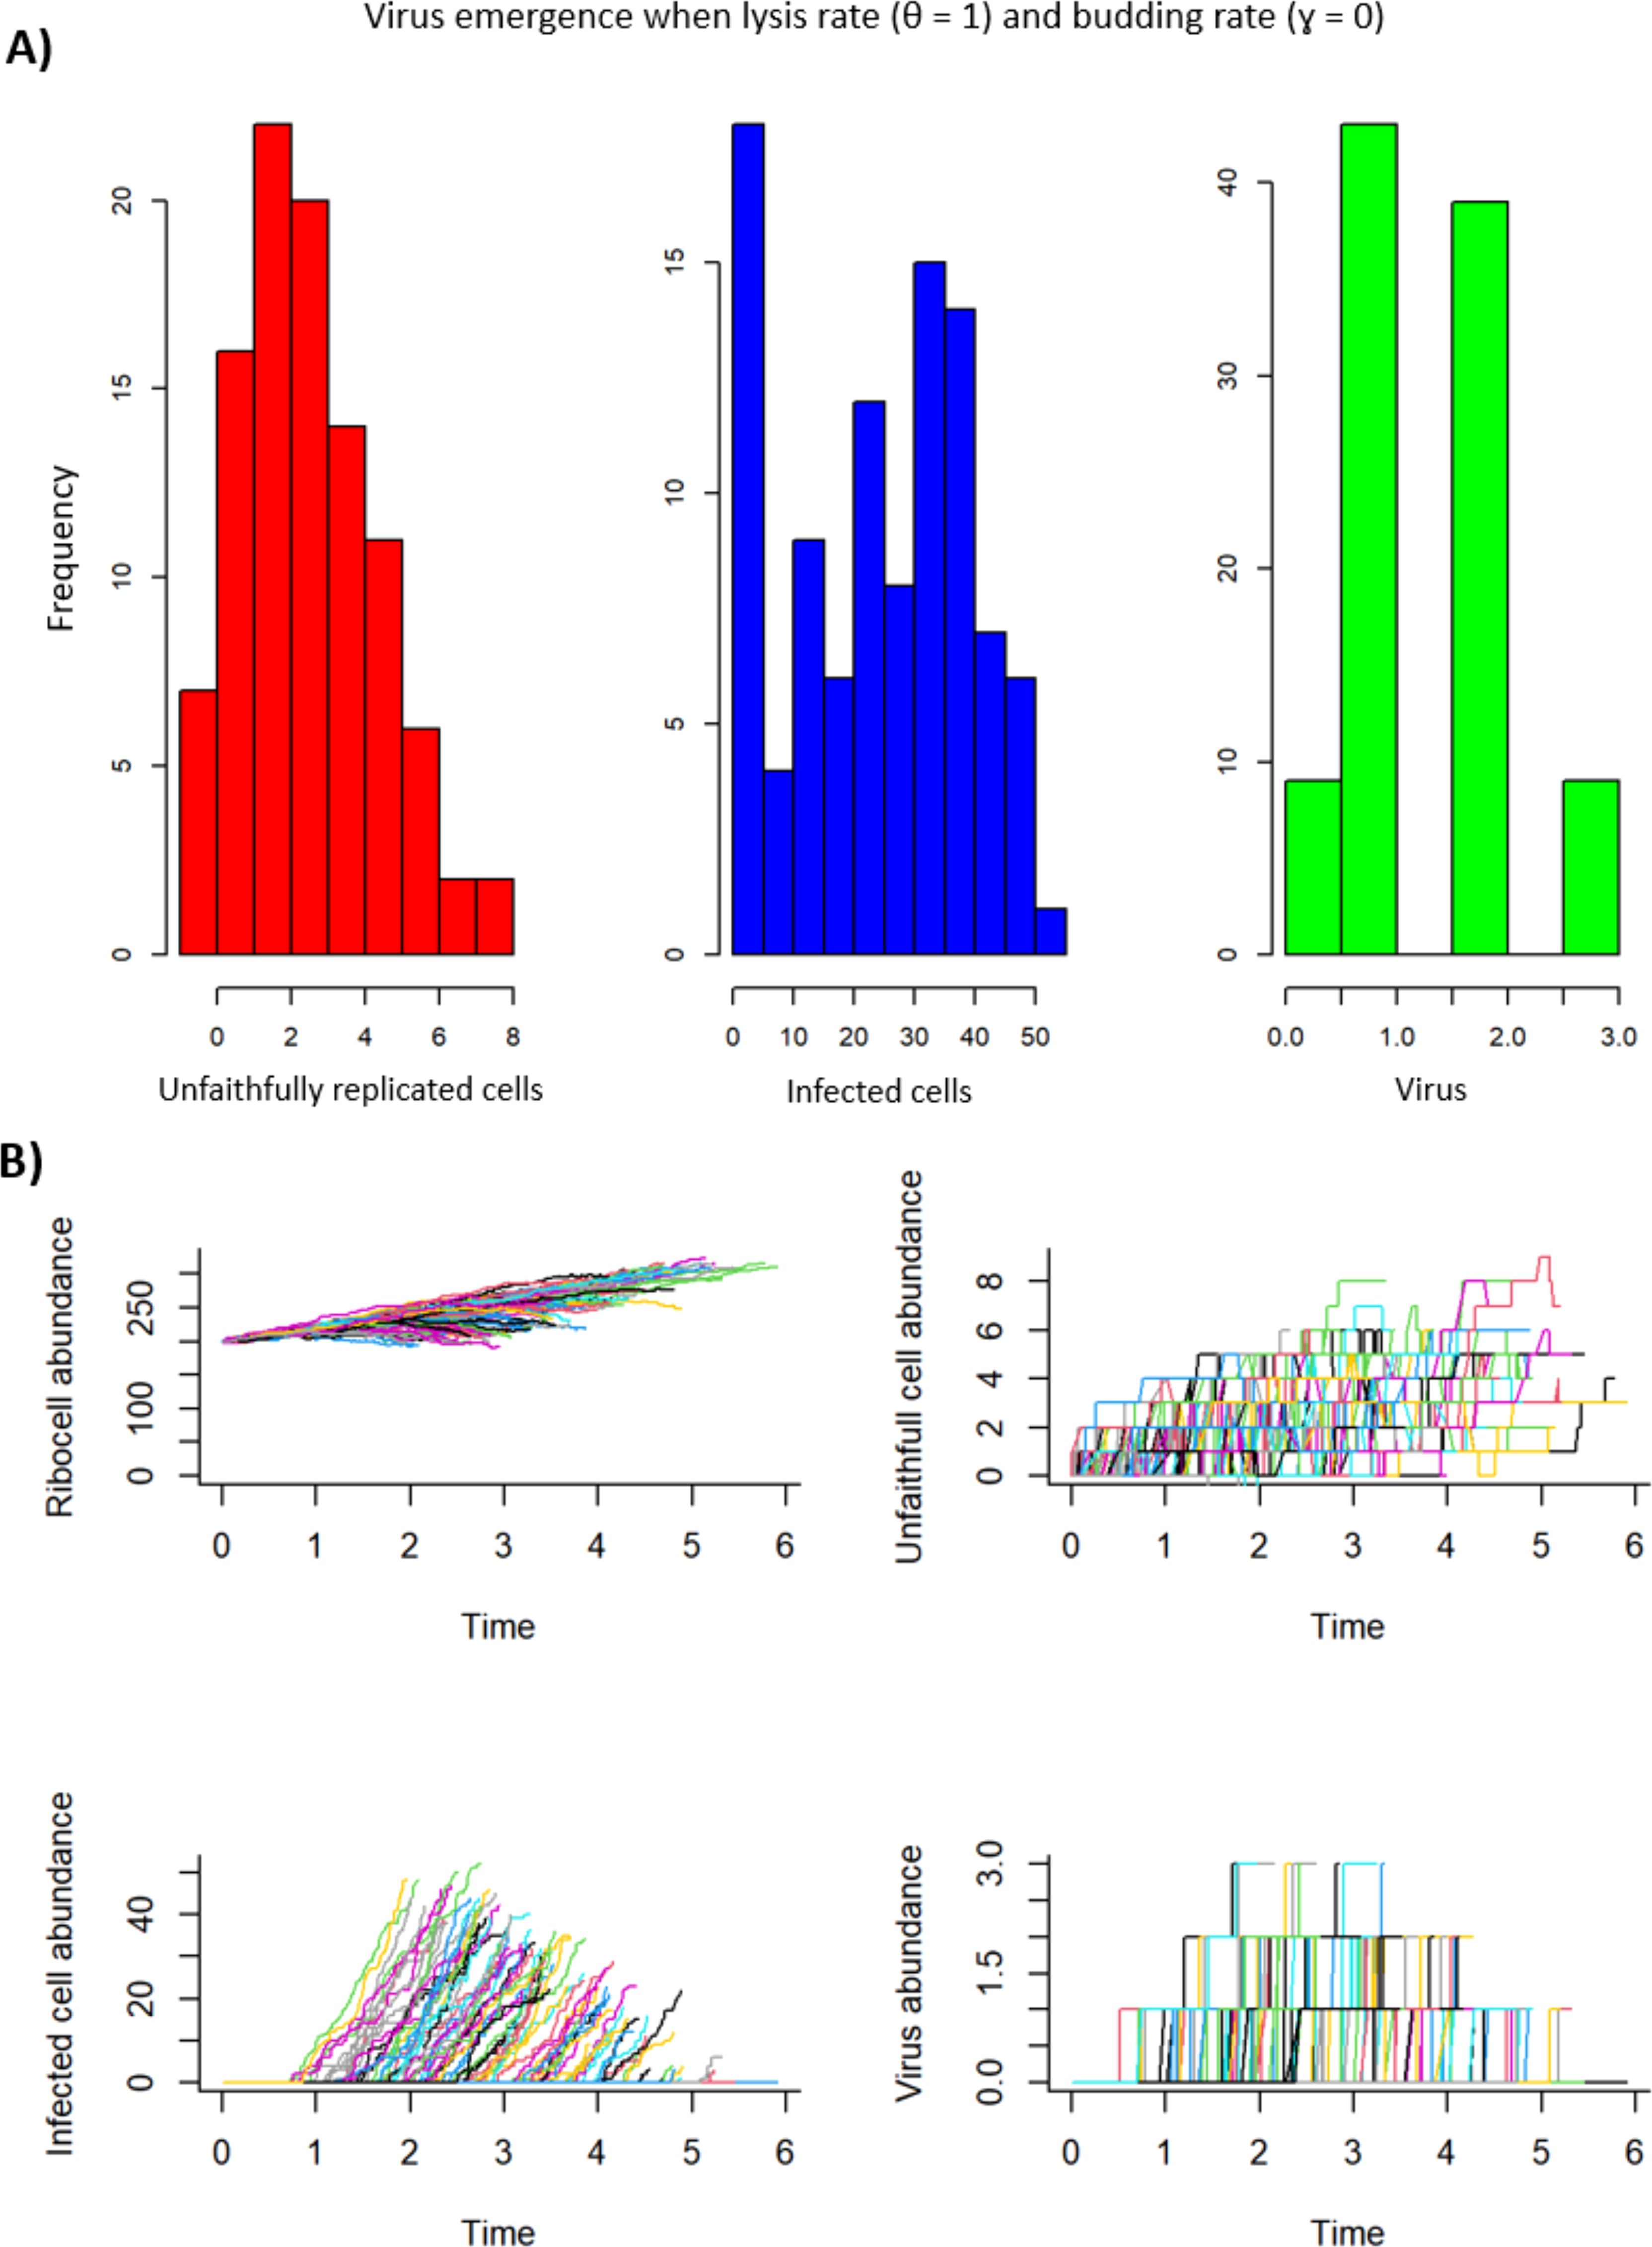
Figure 8. Virus emergence with a lysing strategy where the lysis rate (θ = 1) and the budding rate (γ = 0). For unfaithfully replicated cells (U), the mean = 2.95, the variance = 3.60, and the coefficient of variation (CV) = 0.64. For infected cells (I), the mean = 24.44, the variance = 229.48, and the CV = 0.62. For virus (V), the mean = 1.48, the variance = 0.62, and the CV = 0.53. (A) A histogram representation of the frequency per model iteration of the number of unfaithfully replicated cells, infected cells, and virus produced. (B) Ribocell (R), unfaithfully replicated cell (U), infected cell (I), and virus abundance (V) over time. Each positive line represents emergence and dynamics of R, U, I and V for an iteration of the model run.
Out of all the stochastic model runs, specific parameter combinations lead to the most probable outcomes for the emergence of unfaithfully replicated cells (U), virus (V), and infected cells (I). While several parameter combinations lead to the emergence of unfaithfully replicated cells (U), two in particular are most successful. The first case was when the infection rate (β) was set to zero, the ribocell reproduction rate (λ) and unfaithfully replicated ribocell reproduction rate (λ’) were equal (0.05), and all other parameters were set to the values in Table 2. With this parameter combination, there was a 100% chance of unfaithfully replicated cell emergence, a mean of 29.57 unfaithfully replicated cells, and the lowest coefficient of variation (CV) of all other model runs for U (CV = 0.159).
The second case was when the infection rate (β) was set to zero, the ribocell reproduction rate (λ = 0.005) was lower than the unfaithfully replicated ribocell reproduction rate (λ’ = 0.05), and all other parameters were set to the values in Table 2. With this parameter combination, there was a 100% chance of unfaithfully replicated cell emergence, a mean of 30.87 unfaithfully replicated cell emergence (the highest value of all model runs for U), and the second lowest coefficient of variation (CV) of all other model runs for U (CV = 0.181).
One parameter combination most successfully gave rise to virus (V). This combination was the same as the previous, where infection rate (β) was set to zero, the ribocell reproduction rate (λ = 0.005) was lower than the unfaithfully replicated ribocell reproduction rate (λ’ = 0.05), and all other parameters were set to the values in Table 2. With this parameter combination, there was a 100% chance of virus emergence, a mean of 41.43 virus particles emergence (the highest value of all model runs for V), and the lowest coefficient of variation (CV) of all other model runs for V (CV = 0.095). This set of results corroborated those found in the deterministic analyses – that in order for unfaithfully replicated cells (and, therefore, virus) to emerge, the unfaithfully replicated cell production rate (λ’) should be equal to or greater than the ribocell reproduction rate (λ). Virus emerging via the escape hypothesis would most likely have to originate from ribocells with similar characteristics.
Three parameter combinations most successfully gave rise to infected ribocells (I). The first combination was when the maturation rate (m = 0.2) was double the infection rate (β = 0.1) and all other parameters were set to values in Table 2 (note that the values for m and β are also consistent with the values in Table 2). This parameter set led to an 88% chance of infected ribocell emergence, with a mean of 29.85 infected ribocell emergence (the second highest of all model runs for I), and the second lowest coefficient of variation (CV) of all other model runs for I (CV = 0.541).
The second parameter combination of interest for infected ribocells was when the lysis rate (θ) was set to zero and the budding rate (γ) was set to 1, and all other parameters were set to the values in Table 2 (Figure 7). In this case, there was a 90% chance for the emergence of infected ribocells, with a mean of 32.47 infected ribocell emergence (the highest of all model runs for I), and the lowest coefficient of variation (CV) of all other model runs for I (CV = 0.503).
The third parameter combination of interest for infected ribocells also involves the lysis and budding rates, except this time the lysis rate (θ) was set to 1 and the budding rate (γ) was set to zero (Figure 8). In this case, there was a 91% chance for the emergence of infected ribocells, with a mean of 24.44 infected ribocell emergence (the fourth highest of all model runs for I), and the third lowest coefficient of variation (CV) of all other model runs for I (CV = 0.620). These results suggest that while budding is slightly more likely to give rise to infected ribocells, a lysing strategy would yield a higher mean of infected ribocells.
Discussion
In this study, we developed theoretical approaches to understanding the evolutionary dynamics of the escape hypothesis for viral origins as proposed by Forterre and Krupovic (11). Our model allowed for the analyses of early virus emergence and the generation of results about which parameters impact virus fitness and emergence most. We also examined early virus strategies for proliferation by comparing budding and lysing virus reproduction methods.
Over 50 years ago, Eigen (18) introduced hypercycle models of self-replicating molecules, where each molecule catalyzes the creation of the next. Our study’s model similarly links events leading to virus emergence. Eigen and Schuster (19) expanded on the hypercycle concept, proposing quasi-species – a given distribution of macro-molecular species with interrelated sequences, dominated by master copies. External constraints selected the best adapted distribution, and our model also used external constraints to drive virus emergence.
Further work (20) proposed that viruses are quasi-species and examining them in the context of hypercycles could reveal clues to understanding and defeating them. Eigen (21) leveraged RNA virus systems in his hypercycle model to explore the origins of genetic information to support this idea. Recent studies on RNA virus quasi-species dynamics show the concept helps in understanding virus populations, pathogenicity, and therapeutic countermeasures against pandemics (22). The methods developed in our study to evaluate the escape hypothesis are similar to those comprising a modified Eigen hypercycle and build on the ideas of hypercycles to evaluate other drivers of virus emergence and persistence.
Virus and infected ribocell death rates
Sensitivity and deterministic analyses highlight key parameters that have a positive or negative impact on virus fitness included the virus death rate (μV) and infected ribocell death rate (μI). Results also showed that virus death rate (μV) and infected cell death rate (μI) must be above a certain critical threshold for viruses to emerge and persist through the escape hypothesis. A lower virus death rate results in faster and increased growth of virus particles, while a higher virus death rate reduces the lifespan of a virion. A higher infected cell death rate also reduces the likelihood of infection or the likelihood of lysis. This is consistent with the findings from other studies. For instance, work on influenza A virus (23), suggests that the mechanism for changes in these rates could be due to cellular immune response. This could indicate that the first types of ribocells to be infected by viruses may have had a limited cell protection and/or weak immune responses.
Unfaithful ribocell production and maturation rates
Deterministic and stochastic analyses both demonstrated the importance of the relationship between unfaithfully replicated cell production (λ’) and cell reproduction rates (λ). For viruses to emerge from unfaithfully replicated cells, deterministic analyses revealed that λ’ must be roughly equal to, or greater than, λ. The stochastic analyses results corroborated those found by the deterministic analyses – that for unfaithfully replicated cells (and, therefore, virus) to emerge, the unfaithfully replicated cell production rate (λ’) should be equal to, or greater than, the ribocell reproduction rate (λ). This relationship ensures that enough unfaithfully replicated ribocells have an opportunity to transition into viruses. It follows that for viruses to emerge via the escape hypothesis, they would likely have emerged from a set of ribocells with a high rate of unfaithful cell division.
Our results support the idea that unfaithful or unequal ribocell division is a key component of the escape hypothesis (11). Given that unfaithful ribocells emerged and gave rise to viruses, the stochastic analyses also supported the idea that viruses could be polyphyletic, emerging numerous times from different origin points as has been suggested by others (4, 24).
Invasion analyses initially did not indicate that maturation rate would impact virus emergence. However, the deterministic and stochastic analyses resolved this and showed that a sufficiently high maturation rate from unfaithfully replicated cells is, in fact, important for the emergence of virus through the escape hypothesis. The most successful stochastic model runs resulting in the persistence of infected cells all had the highest value evaluated for maturation rate (m = 0.2). Additionally, deterministic analyses showed that for virus to emerge from unfaithfully replicated cells alone, the maturation rate must be above a certain critical threshold (Equation 13). That is, the maturation rate must be greater than the unfaithful ribocell replication rate minus the unfaithful ribocell loss rate.
Intrinsic to maturation rate and ribocell reproduction is whether enough genetic information is carried over during the replication process to meet the functions of a minimal cell. Some have argued that RNA cannot be replicated faithfully to meet these conditions and suggested that viruses did not emerge through the escape hypothesis (25, 26). However, alternative arguments suggest that ancient RNA-based cells could have existed and replicated successfully (11). Whether or not ancient ribocells existed and could faithfully replicate is a key question to understanding how viruses could have emerged via the escape hypothesis. If ancient ribocells existed and had unstable rates of faithful replication, then the maturation rate would likely be a key driver in whether viruses could have emerged from the maturation of unfaithfully replicated ribocells.
Empirically, this question has been difficult to answer in the past but synthetic biology could provide insights as to whether an ancient RNA-based cell could be engineered (11). Indeed, several recent advances in RNA synthetic biology could further enable this area of research (27–29). An engineered RNA-based cell could be subject to reduction-of-function experiments to mimic an ancient cell that could have given rise to viruses through the escape hypothesis. If this was the case, maturation and ribocell replication dynamics could be experimentally explored.
Infection rate
Deterministic and stochastic analyses both demonstrated the important role of the infection rate (β) for the persistence of infected ribocells (I), and, therefore, virus. Results indicated that the infection rate must be above a certain critical threshold for infected ribocells to persist through the escape hypothesis. As the infection rate decreased by orders of magnitude, the probability of the emergence of infected ribocells, and the average number of infected ribocells emerging, also decreased. These results corroborated other findings (30) suggesting that severe transmission bottlenecks (e.g., low infection rate) likely reduce virulence due to stochastic loss of more virulent pathotypes. They also suggested that this is especially true for RNA viruses (which are likely to have been the first to originate) due to their rapid evolution rate. Several others have also noted that differing infection rates have positive and negative impacts on virus fitness and evolution (31–35). It follows that infection rate is important for successful early virus emergence and persistence.
Budding vs. lysing
The initial invasion analyses showed that when viruses emerge solely from unfaithfully replicated cells, lysis may be a preferred strategy. This is most likely attributable to the virus life-history characteristics, particularly the length of time delays (12). Other things being equal, our results support a lysing strategy for early viruses. The results from the sensitivity analysis highlighted that the budding delay (τ’) has the most influence on virus fitness. In contrast to the invasion analysis, the results indicated that budding (over lysis) could, therefore, be an early virus strategy. The results also showed that virus fitness exponentially decreased as budding time delay increased. This suggests that shorter time delays are preferrable for virus fitness. These findings corroborate those of Lord and Bonsall (12), who found that budding delay is an important parameter in virus evolutionary dynamics. When budding delays are shorter, budding itself could support a self-sustaining population more readily than lysis.
Deterministic analyses also revealed that with the propensity for reinfection, budding delays (τ’) play a crucial role in virus fitness. Shorter budding delays lead to more rapid virus (V) emergence and longer budding delays result in slower emergence of infected ribocells (I). The results also showed that if the budding delay (τ’) is shorter than the lysis delay (τ), virus emerges more rapidly. This further suggests that budding could be an early strategy over lysis for viruses emerging via the escape hypothesis, supporting the general finding that time delays and budding may be a preferred virus strategy (12). Furthermore, retroviruses are some of the oldest viruses that infect multi-cellular life, potentially emerging before the early Paleozoic Era (36). Most relevant here is that retrovirus replication also mirrors many of the mechanisms relevant to the escape hypothesis for virus emergence (37). The fact that nearly all retroviruses proliferate through budding supports the idea of a budding strategy for early viruses (38).
The very first viruses could have proliferated through budding and/or lysis (11). Supporting these ideas, results from the stochastic analyses suggested that while budding is slightly less likely to give rise to infected ribocells, a lysing strategy yields a lower mean number of infected ribocells. When budding delays are shorter, budding itself could support a self-sustaining population more readily than lysis.
Conclusion
The theoretical and numerical approaches developed here provide a novel way of evaluating the fitness of a virus emerging through the escape hypothesis. Our model framework could be adapted in future work on virus emergence such as the virus-first (39), reduction (9), chimeric (40), and symbiogenic (41) hypotheses. Subsequent models could then be compared to determine the most likely hypothesis origin and which biological constraints are necessary for virus to emerge using a certain hypothesis. This model could also be adapted to consider physical or environmental constraints, allowing for the examination of these hypotheses with other celestial bodies within the solar system to determine which are most likely to give rise to virus (42). Our work serves as a foundation for future analyses and shows that the development of a mathematical evolutionary approach can help explore the origin and emergence of viruses.
Data availability statement
The datasets presented in this study can be found in online repositories. The names of the repository/repositories and accession number(s) can be found below: https://osf.io/pdut2/.
Author contributions
JO’B: Conceptualization, Formal analysis, Investigation, Visualization, Writing – original draft. AG: Supervision, Writing – review & editing. MB: Conceptualization, Formal analysis, Methodology, Supervision, Writing – review & editing.
Funding
The author(s) declare that financial support was received for the research and/or publication of this article. We acknowledge that this work was supported, in part, by funding from the Open Philanthropy Project. The funder has had no role in the design, implementation or writing of this work.
Conflict of interest
The authors declare that the research was conducted in the absence of any commercial or financial relationships that could be construed as a potential conflict of interest.
Generative AI statement
The author(s) declare that no Generative AI was used in the creation of this manuscript.
Publisher’s note
All claims expressed in this article are solely those of the authors and do not necessarily represent those of their affiliated organizations, or those of the publisher, the editors and the reviewers. Any product that may be evaluated in this article, or claim that may be made by its manufacturer, is not guaranteed or endorsed by the publisher.
Supplementary material
The Supplementary Material for this article can be found online at: https://www.frontiersin.org/articles/10.3389/fviro.2025.1555137/full#supplementary-material
References
1. Dance A. Beyond coronavirus: the virus discoveries transforming biology. Nature. (2021) 595:22–5. doi: 10.1038/d41586-021-01749-7
2. Suttle CA. Viruses: unlocking the greatest biodiversity on Earth. Genome. (2013) 56:542–4. doi: 10.1139/gen-2013-0152
3. Sime-Ngando T. Environmental bacteriophages: viruses of microbes in aquatic ecosystems. Front Microbiol. (2014) 5:355. doi: 10.3389/fmicb.2014.00355
4. Durzyńska J, Goździcka-Józefiak A. Viruses and cells intertwined since the dawn of evolution. Virol J. (2015) 12:169. doi: 10.1186/s12985-015-0400-7
5. Harris HMB, Hill C. A place for viruses on the tree of life. Front Microbiol. (2020) 11:604048. doi: 10.3389/fmicb.2020.604048
6. French RK, Holmes EC. An ecosystems perspective on virus evolution and emergence. Trends Microbiol. (2020) 28:165–75. doi: 10.1016/j.tim.2019.10.010
7. Rohwer F, Prangishvili D, Lindell D. Roles of viruses in the environment. Environ Microbiol. (2009) 11:2771–4. doi: 10.1111/j.1462-2920.2009.02101.x
8. Nasir A, Kim KM, Caetano-Anolles G. Viral evolution: Primordial cellular origins and late adaptation to parasitism. Mob Genet Elements. (2012) 2:247–52. doi: 10.4161/mge.22797
9. Bândea CI. A new theory on the origin and the nature of viruses. J Theor Biol. (1983) 105:591–602. doi: 10.1016/0022-5193(83)90221-7
10. Temin HM. The protovirus hypothesis: speculations on the significance of RNA-directed DNA synthesis for normal development and for carcinogenesis. J Natl Cancer Inst. (1971) 46:3–7. doi: 10.1093/jnci/46.2.III
11. Forterre P, Krupovic M. The Origin of Virions and Virocells: The Escape Hypothesis Revisited. In: Witzany G, editor. Viruses: Essential Agents of Life. Springer Netherlands, Dordrecht (2012).
12. Lord JS, Bonsall MB. The evolutionary dynamics of viruses: virion release strategies, time delays and fitness minima. Virus Evol. (2021) 7. doi: 10.1093/ve/veab039
13. Otto SP, Day T. A Biologist's Guide to Mathematical Modeling in Ecology and Evolution. Princeton, NJ: Princeton University Press (2007).
14. Vincent TL, Brown JS. Evolutionary Game Theory, Natural Selection, and Darwinian Dynamics. Cambridge University Press: Cambridge (2005).
15. Gillespie DT. A general method for numerically simulating the stochastic time evolution of coupled chemical reactions. J Comput Phys. (1976) 22:403–34. doi: 10.1016/0021-9991(76)90041-3
16. Gillespie DT. Exact stochastic simulation of coupled chemical reactions. J Phys Chem. (1977) 81:2340–61. doi: 10.1021/j100540a008
17. Feller W. On the integro-differential equations of purely discontinuous Markoff processes. Trans Am Math Soc. (1940) 48:488–515. doi: 10.1090/S0002-9947-1940-0002697-3
18. Eigen M. Selforganization of matter and the evolution of biological macromolecules. Naturwissenschaften. (1971) 58:465–523. doi: 10.1007/BF00623322
19. Eigen M, Schuster P. A principle of natural self-organization. Naturwissenschaften. (1977) 64:541–65. doi: 10.1007/BF00450633
20. Eigen M. The origin of genetic information: viruses as models. Gene. (1993) 135:37–47. doi: 10.1016/0378-1119(93)90047-7
22. Martínez MA, Martrus G, Capel E, Parera M, Franco S, Nevot M. Quasispecies Dynamics of RNA Viruses. In: Witzany G, editor. Viruses: Essential Agents of Life. Springer Netherlands, Dordrecht (2012).
23. Baccam P, Beauchemin C, Macken CA, Hayden FG, Perelson AS. Kinetics of influenza A virus infection in humans. J Virol. (2006) 80:7590–9. doi: 10.1128/JVI.01623-05
24. Forterre P, Krupovic M, Prangishvili D. Cellular domains and viral lineages. Trends Microbiol. (2014) 22:554–8. doi: 10.1016/j.tim.2014.07.004
25. Koonin EV, Martin W. On the origin of genomes and cells within inorganic compartments. Trends Genet. (2005) 21:647–54. doi: 10.1016/j.tig.2005.09.006
26. Takeuchi N, Hogeweg P, Koonin EV. On the origin of DNA genomes: evolution of the division of labor between template and catalyst in model replicator systems. PloS Comput Biol. (2011) 7:e1002024. doi: 10.1371/journal.pcbi.1002024
27. Chappell J, Watters KE, Takahashi MK, Lucks JB. A renaissance in RNA synthetic biology: new mechanisms, applications and tools for the future. Curr Opin Chem Biol. (2015) 28:47–56. doi: 10.1016/j.cbpa.2015.05.018
28. Dykstra PB, Kaplan M, Smolke CD. Engineering synthetic RNA devices for cell control. Nat Rev Genet. (2022) 23:215–28. doi: 10.1038/s41576-021-00436-7
29. Schaffter SW, Strychalski EA. Cotranscriptionally encoded RNA strand displacement circuits. Sci Adv. (2022) 8:eabl4354. doi: 10.1126/sciadv.abl4354
30. Bergstrom CT, Mcelhany P, Real LA. Transmission bottlenecks as determinants of virulence in rapidly evolving pathogens. Proc Natl Acad Sci. (1999) 96:5095–100. doi: 10.1073/pnas.96.9.5095
31. Ben-Shachar R, Koelle K. Transmission-clearance trade-offs indicate that dengue virulence evolution depends on epidemiological context. Nat Commun. (2018) 9:2355. doi: 10.1038/s41467-018-04595-w
32. Bull JJ, Lauring AS. Theory and empiricism in virulence evolution. PloS Pathog. (2014) 10:e1004387. doi: 10.1371/journal.ppat.1004387
33. Pybus OG, Tatem AJ, Lemey P. Virus evolution and transmission in an ever more connected world. Proc Biol Sci. (2015) 282:20142878. doi: 10.1098/rspb.2014.2878
34. Saad-Roy CM, Metcalf CJE, Grenfell BT. Immuno-epidemiology and the predictability of viral evolution. Science. (2022) 376:1161–2. doi: 10.1126/science.abn9410
35. Sanjuan R. From molecular genetics to phylodynamics: evolutionary relevance of mutation rates across viruses. PloS Pathog. (2012) 8:e1002685. doi: 10.1371/journal.ppat.1002685
36. Aiewsakun P, Katzourakis A. Marine origin of retroviruses in the early Palaeozoic Era. Nat Commun. (2017) 8:13954. doi: 10.1038/ncomms13954
38. Pincetic A, Leis J. The mechanism of budding of retroviruses from cell membranes. Adv Virol. (2009) 2009:6239691–6239699. doi: 10.1155/2009/623969
39. Moelling K, Broecker F. Viruses and evolution – viruses first? A personal perspective. Front Microbiol. (2019) 10. doi: 10.3389/fmicb.2019.00523
40. Krupovic M, Dolja VV, Koonin EV. Origin of viruses: primordial replicators recruiting capsids from hosts. Nat Rev Microbiol. (2019) 17:449–58. doi: 10.1038/s41579-019-0205-6
41. Mughal F, Nasir A, Caetano-Anollés G. The origin and evolution of viruses inferred from fold family structure. Arch Virol. (2020) 165:2177–91. doi: 10.1007/s00705-020-04724-1
Keywords: evolution, mathematical modelling, origins of life, virus dynamics, virus proliferation, virus replication
Citation: O’Brien JT, George AM and Bonsall MB (2025) The origins of viruses: evolutionary dynamics of the escape hypothesis. Front. Virol. 5:1555137. doi: 10.3389/fviro.2025.1555137
Received: 03 January 2025; Accepted: 28 March 2025;
Published: 29 April 2025.
Edited by:
Humberto J. Debat, Instituto Nacional de Tecnología Agropecuaria, ArgentinaReviewed by:
Savio Torres Farias, Federal University of Paraíba, BrazilTapan Goel, University of Maryland, United States
Copyright © 2025 O’Brien, George and Bonsall. This is an open-access article distributed under the terms of the Creative Commons Attribution License (CC BY). The use, distribution or reproduction in other forums is permitted, provided the original author(s) and the copyright owner(s) are credited and that the original publication in this journal is cited, in accordance with accepted academic practice. No use, distribution or reproduction is permitted which does not comply with these terms.
*Correspondence: Michael B. Bonsall, bWljaGFlbC5ib25zYWxsQGJpb2xvZ3kub3guYWMudWs=