 Vasco Reis
 Ana Almeida
- CERIS, CESUR, Instituto Superior Técnico, Universidade de Lisboa, Lisbon, Portugal
Increasingly significant freight transport had led to larger and more complex transport chains. More specifically, intermodal transport has arisen as a desirable alternative to long-haul road transport, as it creates opportunities for cost reduction and to decrease both polluting emissions and road congestion. Hence, achieving good levels of service in intermodal dedicated structures is of paramount importance for the success of this transport option.The global objective of this research is to determine the capacity of the Freight Village of Turin. This is motivated by future changes in traffic demand, related with the neighboring Port of Savona-Vado. The role of freight villages and other logistics centers is becoming progressively more substantial with saturating sea ports focusing on handling operations. Existing literature shows success in intermodal transport highly depends on terminal performance.To fulfill the already mentioned objective, a simulation model was developed, based on discrete-event methodology, which simulates rail and handling operation inside the freight village. The model is then used to test several scenarios with the purpose of investigating variation in operation techniques and resources and the respective impact it has on comprehensive capacity.Confronting the tested scenarios allowed to comprehend the inefficiencies of both rail and handling processes, hence concluding that locomotive operation presents the most limiting factor. Furthermore, by combining different operation conditions and resources, it was possible to conclude how these affect final capacity and overall performance.
Introduction
The introduction of transport unit drastically transformed the world of transport. By standardizing the way cargo is transported, handling and stocking activities were significantly optimized, thus reducing costs and overall dwell times.
Regarding sea ports, this change in size altered freight arrival dynamics. Ports now must deal with concentrated peaks of arrival which call for efficient handling processes and larger stocking dedicated areas. To address these issues, forwarding containers to the hinterland has been a common solution, thus shifting various functions from sea ports to the respective hinterland ports.
Therefore, hinterland ports now have a more significant role. These can often work as an extended gateway for sea ports. Customers can profit from having their cargo in closer proximity to their customers. Furthermore, hinterland ports can deviate road traffic from seaports, which are frequently highly congested, allowing for shorter dwell times and better planning of shuttle services (Rodrigue and Notteboom, 2009). Furthermore, this concept also includes the performance of added value activities (Iannone, 2012).
Regarding the case of North-Western Italy, a European project named VAMP UP has been approved in 2016, with the main objective of increasing traffic in the Port of Savona-Vado. Along with a renewed port authority for the western ports of the Liguria region, The VAMP UP project (Vado Multimodal Platform Intermodal Connection Optimization and Upgrading) aims to improve the port, regarding organization, infrastructure and technology. The first results are expected in the beginning of 2018. This initiative is also a result of the near saturation state of the ports of Genova and La Spezia, which form a bottleneck to the hinterland (Autorità Portuale di Savona-Vado, 2014).
Furthermore, it intends to promote an effective integration in the core TEN-T (Trans European Transport Network), namely the Mediterranean Corridor. Consequently, its objectives exceed the sea port itself and call for an overall incorporation of all agents regarding freight transport in the hinterland, as well as infrastructure improvements, namely in the rail sector.
One of these agents is the freight village of Turin, which has had an historical relationship with the port of Savona. Its position is favorable, given that it integrates the Mediterranean corridor. Additionally, it poses as an inland terminal between the Liguria region and the north-west of Europe, as well as a buffer point for the city of Turin and the Piedmont region.
This research aimed at identifying and testing alternative scenarios of resource allocation and process organization that would fulfill the service level requirements under different traffic demand conditions.
Case Study
Port of Savona
The Liguria Region in Italy is the most important southern transport gateway to Europe. From the ports of Savona-Vado, Genova and La Spezia, over 3,2 million TEU containers pass every year (APM 2014). The port of Savona-Vado is composed by two sections (Savona and Vado). Located in a 6-km bay connecting the two cities. With a total surface of 100 ha, it currently presents 13 terminal operators, as well as 4 oil plants.
The VAMP UP project's main objectives include fortifying freight transport on the core network, namely the Rhine-Alpine and Mediterranean Corridor, along with last-mile connections, by achieving integration with other modes of transport, especially rail. Particularly, the technical documents state a road-to-rail shift with a final rail quota of 40%. The Port authority foresees an increase in container traffic up to 425000 TEU/year in the first year and 720000 TEU/year, when fully operational.
Turin distances 159 km by rail and 140 km by road from Savona. According to the foreseen data provided by the port administration, regarding container capacity, it is possible to reach an estimation regarding containers arriving in Turin's freight village, based on the current situation. According to the port authority, around 30% of the freight moved by rail will have Turin as a final or intermediate destination. Meaning, thus, an average of 51,000 TEU/year in the first years and 86,400 TEU/year, when fully operational, arriving in Turin. Given that the freight village of Turin is the only structure prepared to receive this traffic, estimative for upcoming traffic will be based on these values.
Freight Village of Turin
Turin's freight village is located in the city of Orbassano, south-west of the city of Turin. It has 350,000 m2 dedicated to storage units and 750,000 m2 for intermodal transport. More than 150 companies detain property inside the inland port. These warehouses act as buffers considering distribution for the city of Turin and the Piedmont region and represent an attraction factor toward the terminal as it allow lowering warehousing costs as well as increase adaptability from the forwarders (Rodrigue and Notteboom, 2009). Furthermore, there is also a dedicated area for customs, meaning for international movement of goods.
There are two areas dedicated to intermodal transport (Figure 1): SITO yard (managed by Società Interporto di Torino), the same entity which handles the freight village and Terminal Italia yard, also called RFI yard. The latter is managed by Rete Ferroviaria Italiana or RFI, which is the same entity which is responsible for rail operations within the terminal.
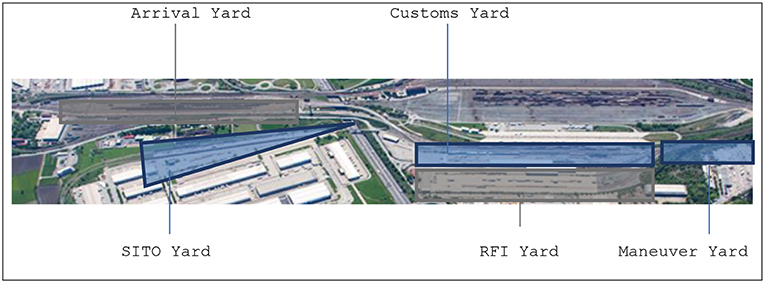
Figure 1. The layout in the Freight Village of Turin.
SITO is composed by four tracks (D, E, F, and G) in which is it possible to perform unloading and loading operations. As to complete intermodal operations, SITO yard has four reach stackers available. On the other hand, RFI yard has five tracks dedicated to intermodal operations, and it also owns four reach stackers.
The terminal detains two diesel locomotives to perform all the operations. Electrical installation goes up to the end of arrival yard. From then on, all movements need the diesel locomotive. Other than handling intermodal trains to both yards, locomotives are responsible for a sort of tasks related to control testing and the transport toward the FIAT factory, which benefits from a dedicated line departing from the freight village of Turin.
When it comes to RFI yard, operationally speaking there are some peculiarities. Due to the terminal underuse, trains are often split in half, even if there are no dimensional conflicts. This measure aims at optimizing the use of the reach stackers and it also happens because of the yard underuse. This option critically limits current terminal capacity, given that a train occupies two tracks instead of one.
Literature Review
The Concept of Freight Village
A Freight Village can be described as an area comprising all the activities related to transports, logistics and goods' distribution (Baydar and Çelik, 2017). According to the same authors, these are usually located outside cities and often allow stakeholders to develop added-value activities. However, if located near a large city, freight villages also create opportunity for efficient local distribution in urban context (Ballis, 2006).
The concentration of activities promotes the creation of a synergy, fomenting thus coordination and collaboration between the different agents. Tsamboulas and Kapros (2003) underline the Freight Villages' role in stimulating intermodal transport. The same authors point out the importance of Freight Villages to the intermodal transport chain, pointing them as the “principal component,” by allowing the transshipment of cargo between different modes of transport. More specifically regarding the present case study of Turin, the same authors highlight the importance of freight village as an integrator between maritime regions and densely populated inland areas.
On the other hand, Freight Villages can have a broader impact on the transport network, by acting has a hub for freight, along with allowing for modal change (Kapros et al., 2014). In fact, according to Ferguson (2013), freight villages can actually create opportunity for smaller companies to use intermodal transport.
Simulation
It is often impossible to perform experimentation in real life systems, due to cost or time associated reasons. For example, in this case, numerous trains would have to arrive at the freight village, to access capacity. And how would the stochastic factors, such as delays in arrivals or operations be tested? Simulation appears as a valuable technique of analysis, which allows to reduce reality into a model, in which several scenarios and hypothesis can be tested (Garrido, 2009).
Consequently, modeling requires abstraction, by including the details considered to be essential and disregarding the ones believed not to be important (Grigoryev, 2016). Furthermore, simulation modeling allows for an infinite variety of abstraction levels, each one consenting a certain degree of freedom. This could never be achieved in the real world and that is why simulation is considered to be a risk-free environment, where virtually all the possible scenarios can be experimented (Grigoryev, 2016). Additionally, with simulation, it is possible to track elements and trace variables (such as time or cost) which make possible to construct a statistical analysis.
Bearing this in mind, it is possible to distinguish two types of simulation, according to the level of abstraction and complexity, as well as the way system's elements interact with each other:
Discrete-Event
Developed in the 1960's, this category of simulation is one of the traditional methods regarding system modeling. Discrete-event simulation is a type of modeling in which a system changes at precise points in time and otherwise remains unaffected. It is also often referred as “Process-Centric” (Grigoryev, 2016) given its analysis of the system as a well-defined sequence of actions, completed by entities. Consequently, a process described by discrete-event simulation can be easily represented by a sequence of connected process blocks. Meaning that discrete-event is particularly appropriate for situations where variables change in well-defined moments and by well-defined actions (Özgün and Barlas, 2009).
Agent-Based
Developed during the 1990's, it is a more recent type of simulation which focus on the individual level, as opposed to the other types which concentrate more on the system itself. In agent-based simulation, the behavior or each agent is modeled. These are later put in a certain environment. The overall performance is, therefore, determined by all the different individual performances. Consequently, it is possible to build an agent-based simulation model having no knowledge of how the real system works, its dependencies and variables, as long as there is a clear notion of the entities (agents) and behavior (AnyLogic, 2017).
Several studies point out that discrete-event modeling is more appropriate for modeling as a strategic/tactical level, whereas continuous simulation is more suitable to perform strategic decisions (Tako and Robinson, 2012).
To sum up, opting for a type of simulation often depends on the kind of system to analyze and the sought objectives. As well as the desired level of complexity and abstraction.
More specifically in the case of intermodal transport, simulation is often pointed as the most adequate tool to analyze both rail terminal operations and port operations. Marinov and Viegas (2011) proposed a model to evaluate freight train operations in a rail network. Here, the importance of using simulation is justified by the possibility to test different scenarios as well as to explore system limitations. (Adamko et al., 2010) recommend simulation especially when a change in the system will take place and its consequences need to be anticipated. As an example, a change in the inbound flows. The same authors underline simulation as a valuable tool because it allows for experimentation, discovery of the system's properties and its response to different settings. Finally, Lin and Cheng (2011) emphasize the importance of simulation to recreate the complexity of rail operations and to test possible infrastructure improvements.
There are few studies on the assessment of inland intermodal terminals. Consequently, research was extended to maritime terminals, given that these are object to a superior number of investigation works. When analyzing former studies on terminals, it is possible to organize them according to their methodology and objectives. A summary is presented in Table 1.
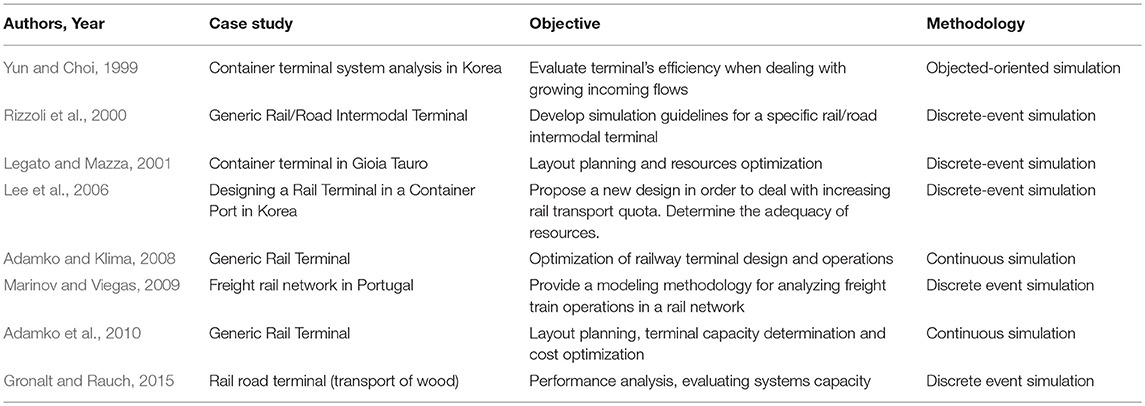
Table 1. A summary of simulation studies regarding sea ports and intermodal terminals.
Simulation is used to investigate various problems, from layout definition, to performance analysis. Also, it is possible to conclude that previous authors recurred mainly to discrete-event simulation to evaluate an intermodal terminal's performance. Continuous simulation was used in cases where the layout of the terminal needed to be defined or redesigned, always involving infrastructural and disposition alterations. In these cases, more variables can be simultaneously changed and therefore, they require a more complex analysis tool.
Simulation Model
AnyLogic was the chosen tool to build the simulation model, and it makes use of the 8.0.5 version. Firstly because of its comprehensive variety of complexity levels which allows to model any system with the desired level of detail.
As described in previous sections, the type of simulation is related with the pretended level of abstraction and complexity. Hence, going back to the objectives of this research, determining capacity and investigating problems and limitations, it is crucial to correctly define all the operation process sequence, along with resource allocation. Therefore, discrete-event simulation proves to be the indicated instrument to analyze the problem concerning the Freight Village of Turin.
Discrete-event presents as a suitable alternative, not only because all the processes performed can be described as discrete (loading/unloading of container, arrival of handling equipment) but also because the main purpose of this paper is to obtain service characteristics such as terminal capacity and dwell times. Furthermore, it is also important to have the possibility to test different scenarios, namely the present and future scenarios regarding the implementation of changes.
Model Definition
Firstly, the boundaries of the simulation were defined as the entrance of the rail terminal and the loading yards, where handling takes place. Consequently, the arrival and loading of trucks will not be consider in this study, nor the transport toward the different warehouses located within the terminal. Consequently, the physical model ends in the rail loading yards.
Given that the majority of the extend of the freight village is not electrified, all operations concerning the movement of trains require a diesel locomotive. Nevertheless, to reduce model's complexity, the locomotive is treated as a resource. Consequently, all the operations will be modeled as delays with a stochastic component. This allowed for simplifications in the terminal's physical appearance, by eliminating the locomotive dedicated tracks, as well as the locomotive depot and maintenance area.
Operation constraints were also considered when designing the simulation. The first one regards the locomotive schedule of operations, which determines how many locomotives (0, 1 or 2) are available in each moment. This schedule was provided by the operations department of the terminal. Moreover, there is an important contractual limitation when it comes to train operations, which limits trains waiting times to 2 h.
Model Architecture
In this section, the model is explained and detailed. Starting from the most abstract logic stages to the more objective options taken in terms of the software model. Conceptually, the model can be divided into three layers which interact with each other:
Modeling Environment—all the operations take place in a well-defined physical environment which is the rail terminal.
Process Logic—within the scope of discrete-event modeling, the process is developed using entities which flow through a sequence of operations.
Resources—certain operations need resources to be developed. These resources can be finite and its availability will limit the model progress and its results.
Model Structure
The following subchapters will explain the simulation model, taking advantage of its inseparability with physical space, by dividing the model into sections, each corresponding to a certain spatial section of the Freight Village (Figure 2). This is then followed by an animation subsection. To finish, the last subchapter will deal with the verification and validation of the model.
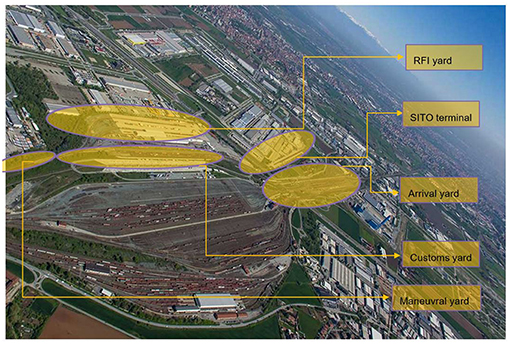
Figure 2. Freight Village's layout.
The model time unit is minutes and the simulation analysis comprises a week, starting on Monday 12/06/2017 at 5 am and finishing on the following Monday 19/06/2017 also at 5 am.
Train
The train is the main entity which flows through the chain of events. In order to accommodate different train typologies, different train populations were created. Each population has specific parameters which will alter their behavior in the chain of events and in the model. Furthermore, each trains population if connected to a RailCar population for color identification purposes.
The main reason behind the creation of agent populations was the possibility to depict the current traffic. Therefore, six different train typologies are part of the model. The train speed inside the freight village is obviously limited by the locomotive speed, which is 10 km/h. Each train agent is inserted in the system using a Train Source block, which is related to an arrival schedule or defined by an interarrival time.
Arrival Yard
Figure 3 represents the process sequence taking place in the arrival yard, after train creation. “movArrivalLine” starts by inserting the train in the arrival yard, randomly choosing a free line. Then, the “{“ icon represents the beginning of a restricted area. This means that if all loading lines are occupied, the incoming trains wait in the arrival yard until one of the trains exits the restricted area, after finishing the loading process. This ensures that no more than 9 trains move beyond the buffer zone. Then, “seizelocomotive” puts on a request for the locomotive.
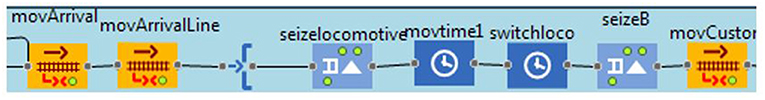
Figure 3. Section of the block sequence.
Consequently, in case there are free lines for loading, the train then waits for the locomotive to arrive. To recall, the locomotive is represented by delays, consequently, “movtime1” represents the waiting time since the request to the arrival of the locomotive.
Customer and Maneuver Yards
The train then proceeds to the customs yard, again by randomly choosing between free lines. From the maneuver yard, the process diagram suffers ramifications according to destination yard and need to split. After this assortment, trains are moved toward the loading yard according to the initially defined parameters.
Loading Yards
After arriving to a loading track, the locomotive is let go and the loading process begins. The loading operation conveyed in this model is based on observations and it was subjected to validation by the operations staff at the Freight Village. Each yard has 4 reach stackers for the loading and unloading operations. when a train enters the loading area, the loading time is calculated using expression [1]:
The resulting time is then subjected to an exponential probabilistic function to create a stochastic delay. Moreover, this function has a static nature, meaning that it does not present a dynamic evaluation of the number of trains being loaded. Therefore, this function can either under or overestimate the loading time because it does not consider the trains that enter or exit while the process is performed. However, in the long run, these errors are compensated by each other. This is obviously a limitation associated with using discrete event simulation.
The loading process is followed by a sequence of “seize” and “release” of the locomotive and the bottleneck sections of the rail infrastructure, until it reaches the arrival yard, where the locomotive is again switched and the train can exit the terminal.
Model Animation
While not relevant to obtain results, a model animation was developed along with the logic process. This animation had two main purposes. The first one was related to the nature of this research. Being related to a real case study, the animation made it easier to convey the simulation role and its results to the Freight Village of Turin. This way, it is easier to understand even for those who are not familiar with simulation and, at the same time, is visually attractive (Figure 4). The second reason regarded the debugging process inherent to any simulation model. Sometimes, the animation made it easier to understand the nature of the problem and allowed for verification that the compatibility between logic and spatial dimensions was achieved.

Figure 4. Simulation window in AnyLogic.
Results
Before proceeding to the discussion of results, it is crucial to define the analyzed variables. While running the simulation is it possible to collect results regarding locomotive and yards utilization rates. These variables are important to convey to what extend are these elements being used, giving thusly, notions of underuse or overuse, as well as performance. Furthermore, other variables are collected in the end of each simulation run, using an Excel file. These variables are instants of time in which the agent train passes through the different stages of the process:
• Entering the arrival yard
• Leaving arrival yard
• Arriving to the loading track
• Time spent in loading process
• Leaving loading track
• Leaving the terminal
These variables are essential to understand the system's performance in terms of dwell times. Moreover, due to the limitations in terms of waiting times, it is important to check in every run if the contractual restrictions are being respected.
Scenarios
Different scenarios considered to analyze the present situation and future improvements (Table 2). The first scenario A regards the current circumstances in terms of traffic, resources and infrastructure. This scenario is used both to understand existing limitations and to serve as a tool for model validation.
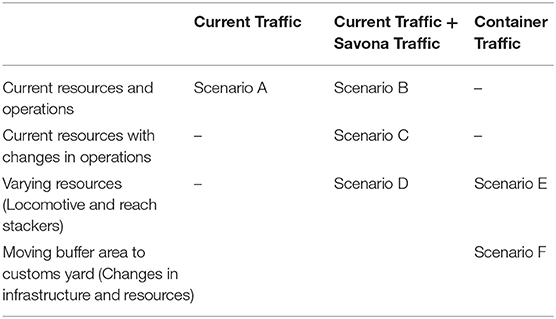
Table 2. Analyzed scenarios with respective changed variables.
The following scenario B overlaps scenario A with the upcoming traffic from Savona and it aims to check if there is compatibility between the two traffics. Scenario C is an improvement alternative of Scenario B, and it mainly focus on operation changes. Scenarios D, E and F allow for changes in resources (locomotive and reach stackers) and scenario F proposes a change in infrastructure. Scenario D is a consequence of scenario C and its main objective is to understand how resources affect the situation where the traffic of Savona is introduced in the present. Finally, scenarios E and F relate to the other objective of this thesis, which is the determination of capacity in terms of containers, considering thus alternative demand conditions.
The resources varied in scenarios D, E, and F could not be tested to exhaustion, therefore it was defined a limit of 2 locomotives and 8 reach stackers in each yard.
Consequently, scenarios can also be divided in three sections. Scenarios A represents the current scenario, scenarios, B, C, and D regard the advances in the VAMP UP project and the expected traffic coming from the Port of Savona. On the other hand, scenarios E and F aim to represent a hypothetical situation, in which all traffic resorts to transport units. Furthermore, scenarios E and F will investigate the terminal's capacity in terms of container units.
Discussion
To perform an easier comparison between all scenarios, these are divided in three categories: scenarios which the current situation A, scenarios regarding the additional traffic from Savona (B, C, and D) and scenarios which aim to determine the total terminal capacity in terms of container traffic (E and F).
Firstly, scenarios B, C, and D are compared with base scenario A. Because trains type 6 do not feature in scenario A, scenario B becomes the reference for this type of train.
By analyzing Table 3, it is possible to understand that inserting the traffic from Savona results in several increases in time, mainly for trains type 1 and 5, resulting, thus, in waiting times which do not respect contractual regulations (120-min waiting time).
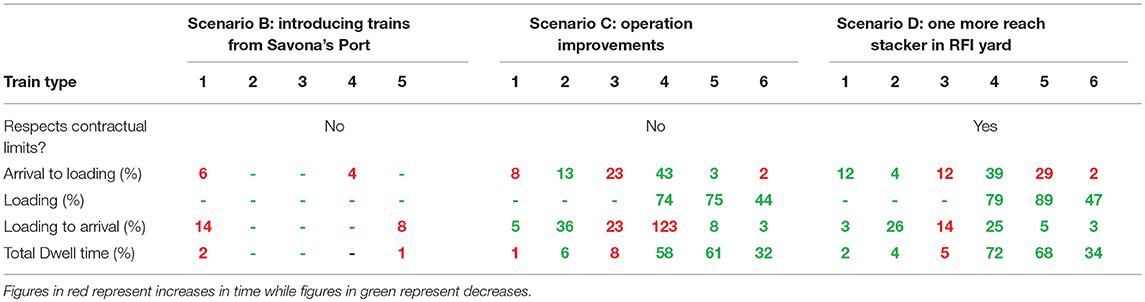
Table 3. Changes in scenario B, C and D regarding scenario A.
Then, when analyzing scenario C, even though the improvements in terms of operations result in several reductions, both in loading times and service times, the accumulation of tasks regarding locomotive is the main reason why scenario C alone does not solve problems from scenario B. In fact, in some cases scenario C worsens the performance, while in other cases it improves it.
Scenario D shows as an additional solution, with the same requirements as B (brief and simple implementation) and it proposes to test the effect of varying the number of reach stackers, along with the operational changes made in C. The main conclusion is that one more reach stacker in RFI yard fixes the situation in terms of time requirements. Furthermore, it decreases overall dwell times. This result was expected given that these trains present considerable potential for improvement due to the fact of being constituted by transport units. Additionally, it also explains why increasing a reach stacker in RFI yard has a bigger impact than in SITO yard, because it targets both trains with transport units.
All in all, scenario D presents the most adequate and simple solution to solve the situation created by the introduction of trains from the Port of Savona. Growing the number of handling equipment by merely one unit in RFI yard, plus the operation alterations stated previously for scenario C allow to accommodate the foreseen changes in traffic.
Secondly, scenarios E and F deal with the issue of capacity, expressed in TEU/year. Scenario E proposes to study how the different resources impact on the freight villages final capacity, whereas scenario F proposes a minor infrastructural change, which does not alter layout as it merely suggests an extension of electrified tracks with changes in operations regarding the buffer zone.
By analyzing Figure 5, scenario E with one dedicated locomotive presents the smallest capacity, with variation in the number of reach stackers having very low impact in the results. Furthermore, this scenario was tested only until the number of reach stackers in both yards reached 6. This is because, from 5+6 reach stackers, the capacity decreased. This was due to the significant train rotation which results in an overload of requests for the locomotive. The limitation of having only one locomotive is clear in the results, along with the inefficiencies of the current process, where the locomotive needs to go back and forth from the loading area to the arrival yard.
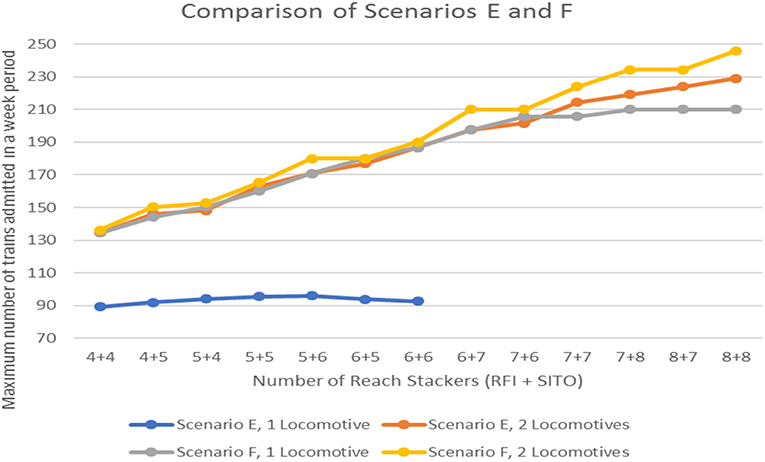
Figure 5. Different throughputs in scenarios E and F.
The remaining three scenarios present equivalent results in terms of capacity, with scenario F (2 dedicated locomotives) granting the highest capacity. Scenario E with 2 locomotives reinforces the conclusions drew previously, with one more locomotive allowing for much higher capacity. Having two locomotives in the conditions of scenario F brings little to none benefit, given that, in this case the capacity was limited by the loading process and not by the locomotive operation. This was evident on the low utilization percentages of this resource, denoting significant idle times.
For scenario E, the buffer zone is never capacity limiting, given that is allows for 18 trains to wait simultaneously. Consequently, time requirements are always surpassed before the buffer zone is fully occupied.
Conclusions
A methodology was outlined to evaluate the freight village's operational and handling processes, also by confronting diverse scenarios which aim to test the effect of varying mostly operation methods and resources. To meet this purpose, a simulation model was developed, having discrete-event modeling as a base. This model represents rail and handling operations performed inside the freight village, mainly focusing on the entity “train.” Furthermore, the outcome in terms of analyzed variables was mainly related to time and resource's occupation rate, which allowed to evaluate and compare each scenario.
A total of six scenarios were analyzed, divided in two sections. The first section, composed by four scenarios, aimed at understanding the current situation and respective limitations, as well as determining the feasibility of introducing trains from the Savona-Vado port, along with testing the effects of operation and resources improvements. The second sections were developed with the objective of determining capacity in terms of containers, along with testing alternative scenarios in terms of resources and simple infrastructure changes.
In terms of total capacity, the effect of varying resources was successfully assessed, along with scenario F proposing an extend in the electrification grid present on the terminal, to make it possible to shift the buffer area toward the loading yards. In terms of performance, scenario F with one locomotive presents clear advantages because, not only allows to decrease locomotive use but is also presents the highest occupation rate of loading yards. On the other hand, scenario F with two locomotives does not allow for a significant improvement in capacity and it presents severely low utilization rates for the locomotive, making it a less attractive alternative
Concerning scenario E, having merely one locomotive strongly limits terminals' capacity, presenting the less appealing results. Increasing locomotive number for two allows to surpass this limitation, rising capacity values significantly. It is important to point out that inefficiencies found today in the freight village are mainly associated with the rail operation. This also relates to the inadequacy of the base infrastructure to perform intermodal activities. Therefore, the extensive path the locomotive goes through every time a train enter the terminal is surely something that needs to be addressed, as shown by the simulation results and it was the base from which scenario F was developed.
The results discussion focuses merely on capacity and performance. This is also conveyed by the analyzed variables. To investigate the validity of each scenario it would be interesting to perform a broad economic analysis to better understand if the extra costs related to resources and infrastructure improvements would be compensated by the increase in performance and, therefore, final capacity. This fragmented nature of the freight village, in terms of ownership and governance would be an obstacle to this end. Nonetheless, it would draw important conclusions in terms of feasibility.
The final considerations would have to do with a model which would test an overall improvement of infrastructure. Chiara et al. (2013) propose to adapt a former marshaling yard in Alexandria to a gateway terminal to better handle intermodal traffic. A study of the sort would be an interesting option for the freight village of Turin as it could convert the obsolete infrastructure into a terminal which is more adequate to present and future traffic conditions.
Author Contributions
AA was responsible for developing the model, collecting the data and running the experiments. VR was responsible for model conceptualization and specification, and analysis of the results.
Conflict of Interest Statement
The authors declare that the research was conducted in the absence of any commercial or financial relationships that could be construed as a potential conflict of interest.
References
Adamko, N., and Klima, V. (2008). Optimisation of railway terminal design and operations using villon generic simulation model. Transport 23, 335–340. doi: 10.3846/1648-4142.2008.23.335-340
Adamko, N., Klima, V., and Marton, P. (2010). Designing railway terminals using simulation techniques. Int. J. Civil Eng. 8, 57–67.
Autorità Portuale di Savona-Vado (2014). Vado Multimodal Platform Rail/Road Intermodal Connectitons Optimization and Upgrading (VAMP UP). Savona.
Ballis, A. (2006). Freight villages: warehouse design and rail link aspects. Transport. Res. Record 1966, 27–33. doi: 10.1177/0361198106196600104
Baydar, A. M., and Çelik, M. (2017). Freight villages: A literature review from the sustainability and societal equity perspective. J. Cleaner Product. 167, 1208–1221. doi: 10.1016/j.jclepro.2017.07.224
Chiara, B., Manti, E, and Marino, M. (2013). Terminali intermodali con funzione gateway: simulazione progettuale su un caso studio. Ingegneria Ferroviaria 6:587.
Ferguson, M. R. (2013). An Exploration of the Freight Village Concept and its Applicability to Ontario. McMaster Institute of Transportation and Logistics.
Garrido, J. M. (2009). “Object oriented simulation a modeling and programming perspective,” in Proceedings of the 49th Annual Southeast Regional Conference (ACM-SE '11) (New York, NY: ACM).
Grigoryev, I. (2016). AnyLogic 7 in Three Days, Quick Course in Simulation Modeling. Available online at: http://www.anylogic.com/free-simulation-book-and-modeling-tutorials
Gronalt, M., and Rauch, P. (2015). Analyzing rail road terminal performance in the forest wood supply chain – a simulation based approach. Int. J. Forest Eng. 28, 162–170. doi: 10.1080/14942119.2018.1488913
Iannone, F. (2012). The private and social cost efficiency of port hinterland container distribution through a regional logistics system. Transport. Res. Part A Policy Pract. 46, 1424–1448. doi: 10.1016/j.tra.2012.05.019
Kapros, S., Panou, K., and Tsamboulas, D. A. (2014). Multicriteria approach to the evaluation of intermodal freight villages.
Lee, B. K., Park, S. O., and Seo, J. H. (2006). “A simulation study for designing a Ra Il terminal in a container port,” in Proceedings of the 38th Conference on Winter Simulation (WSC '06) (Monterey, CA), 1388–1397.
Legato, P., and Mazza, R. M. (2001). Theory and methodology berth planning and resources optimisation at a container terminal via discrete event simulation. Eur. J. Oper. Res. 133, 537–547. doi: 10.1016/S0377-2217(00)00200-9
Lin, E., and Cheng, C. (2011). “Simulation and analysis of railroad hump yards in North America,” in Proceedings of the 2011 Winter Simulation Conference (WSC) (Phoenix, AZ), 3710–3718.
Marinov, M., and Viegas, J. (2009). A simulation modelling methodology for evaluating flat-shunted yard operations. Simul. Model. Pract. Theory. 17, 1106–1129. doi: 10.1016/j.simpat.2009.04.001
Marinov, M., and Viegas, J. (2011). A mesoscopic simulation modelling methodology for analyzing and evaluating freight train operations in a rail network. Simul. Model. Pract. Theory. 19, 516–536. doi: 10.1016/j.simpat.2010.08.009
Özgün, O., and Barlas, Y. (2009). “Discrete vs. continuous simulation: when does it matter?,” in Proceedings of the 27th International Conference of The System Dynamics Society (Albuquerque, NM).
Rizzoli, A. E., Fornara, N., and Gambardella, L. M. (2000). A simulation Tool for combined rail/road transport in intermodal terminals. J. Mathemat. Comput. Simul. 59, 57–71. doi: 10.1016/S0378-4754(01)00393-7
Rodrigue, J. P., and Notteboom, T. E. (2009). The terminalization of supply chains: reassessing the role of terminals in port/hinterland logistical relationships. Maritime PolicyManag. 36, 165–183. doi: 10.1080/03088830902861086
Tako, A. A., and Robinson, S. (2012). The application of discrete event simulation and system dynamics in the logistics and supply chain context. Decision Supp. Syst. 52, 802–815. doi: 10.1016/j.dss.2011.11.015
Tsamboulas, D. A., and Kapros, S. (2003). Freight village evaluation under uncertainty with public and private financing. Transport Pol. 10, 141–156. doi: 10.1016/S0967-070X(03)00002-7
Keywords: freight village, discrete-event modeling, simulation, capacity, intermodal transport
Citation: Reis V and Almeida A (2019) Capacity Evaluation of a Railway Terminal Using Microsimulation: Case Study of a Freight Village in Turin. Front. Built Environ. 5:75. doi: 10.3389/fbuil.2019.00075
Received: 26 January 2019; Accepted: 20 May 2019;
Published: 06 June 2019.
Edited by:
Sakdirat Kaewunruen, University of Birmingham, United KingdomReviewed by:
Marco Guerrieri, University of Trento, ItalyPing Liu, Jiangsu University of Science and Technology, China
Copyright © 2019 Reis and Almeida. This is an open-access article distributed under the terms of the Creative Commons Attribution License (CC BY). The use, distribution or reproduction in other forums is permitted, provided the original author(s) and the copyright owner(s) are credited and that the original publication in this journal is cited, in accordance with accepted academic practice. No use, distribution or reproduction is permitted which does not comply with these terms.
*Correspondence: Vasco Reis, dmFzY29yZWlzQHRlY25pY28udWxpc2JvYS5wdA==