 Tezin A. Walji1†Sarah E. Turecamo1†Alejandro Coca Sanchez2Bryan A. Anthony3Grazia Abou-Ezzi3
 Erica L. Scheller4Daniel C. Link3Robert P. Mecham1
 Clarissa S. Craft1,4*
- 1Department of Cell Biology and Physiology, Washington University School of Medicine, St. Louis, MO, USA
- 2Department of Medicine and Medical Specialties, Faculty of Medicine and Health Sciences, University of Alcala de Henares, Madrid, Spain
- 3Department of Medicine, Oncology Division, Washington University School of Medicine, St. Louis, MO, USA
- 4Department of Medicine, Bone and Mineral Diseases Division, Washington University School of Medicine, St. Louis, MO, USA
Marrow adipose tissue (MAT) is an endocrine organ with the potential to influence skeletal remodeling and hematopoiesis. Pathologic MAT expansion has been studied in the context of severe metabolic challenge, including caloric restriction, high fat diet feeding, and leptin deficiency. However, the rapid change in peripheral fat and glucose metabolism associated with these models impedes our ability to examine which metabolic parameters precede or coincide with MAT expansion. Microfibril-associated glycoprotein-1 (MAGP1) is a matricellular protein that influences cellular processes by tethering signaling molecules to extracellular matrix structures. MAGP1-deficient (Mfap2−/−) mice display a progressive excess adiposity phenotype, which precedes insulin resistance and occurs without changes in caloric intake or ambulation. Mfap2−/− mice were, therefore, used as a model to associate parameters of metabolic disease, bone remodeling, and hematopoiesis with MAT expansion. Marrow adiposity was normal in Mfap2−/− mice until 6 months of age; however, by 10 months, marrow fat volume had increased fivefold relative to wild-type control at the same age. Increased gonadal fat pad mass and hyperglycemia were detectable in Mfap2−/− mice by 2 months, but peaked by 6 months. The development of insulin resistance coincided with MAT expansion. Longitudinal characterization of bone mass demonstrated a disconnection in MAT volume and bone volume. Specifically, Mfap2−/− mice had reduced trabecular bone volume by 2 months, but this phenotype did not progress with age or MAT expansion. Interestingly, MAT expansion in the 10-month-old Mfap2−/− mice was associated with modest alterations in basal hematopoiesis, including a shift from granulopoiesis to B lymphopoiesis. Together, these findings indicate MAT expansion is coincident with insulin resistance, but not excess peripheral adiposity or hyperglycemia in Mfap2−/− mice; and substantial MAT accumulation does not necessitate a proportional decrease in either bone mass or bone marrow cellularity.
Introduction
Adipose tissue exists in multiple variations, the most extensively studied being: brown, white, and beige. Brown adipocytes specialize in utilizing energy to produce heat (thermogenesis), white adipocytes are energy-storing reservoirs, and beige adipocytes principally store lipids but can be stimulated to transdifferentiate into a “brown-like” state (1). Less studied is a fourth lipid storing depot, located within the skeleton, marrow adipose tissue (MAT). These skeleton-associated adipocytes arise from a unique progenitor (2) and occupy approximately 70% of the marrow space within adult human bones (3). There is an evidence that MAT adipocytes exist in two forms: regulated marrow adipocytes (rMATs) that respond in size and number to physiological challenge, and the constitutive marrow adipocytes (cMATs) that persist despite challenge (4). Marrow adipocytes are not inert space-filling cells. Rather, the ability to produce leptin and adiponectin classifies them as an endocrine organ (5, 6). These cells also release fatty acids via lipolysis, suggesting that they may fuel local cellular processes (7).
Pathologic MAT expansion, as a consequence of metabolic dysfunction, has been studied in several contexts, including caloric restriction, high fat diet feeding, and leptin deficiency (6, 8–10). Unfortunately, the rapid change in peripheral fat and glucose metabolism associated with these models impedes our ability to determine which metabolic parameters precede or coincide with MAT expansion. The objective of this study was to correlate parameters of metabolic disease, bone remodeling, and hematopoiesis with MAT volume. Thus, we chose a model of progressive metabolic dysfunction – mice lacking the extracellular matrix (ECM) protein microfibril-associated glycoprotein-1 (MAGP1).
The ECM is a milieu of structural proteins, proteoglycans, and adhesive glycoproteins (11). MAGPs are a non-structural component of the ECM. The biology of this family has been recently reviewed (12). Briefly, MAGP1 (Mfap2) is broadly expressed, including both adipose tissue and bone (13, 14), and typically associates with fibrillin-rich microfibrils. MAGP1 may also interact with collagen-VI fibers (15). Characterization of MAGP1-deficient mice (Mfap2−/−) suggests that MAGP1 does not contribute to the mechanical integrity of its associated ECM fibers (16). Rather, MAGP1 functions as a gatekeeper of signal transduction. A significant body of evidence has demonstrated that MAGP1 interacts with ligands of the transforming growth factor beta (TGFβ) superfamily; sequestering them in the ECM (13, 14, 16, 17). In mice, MAGP1 deficiency (Mfap2−/−) results in adipocyte hypertrophy in peripheral white adipose tissue (WAT), diabetes, and reduced bone mass (13, 14). These phenotypes are progressive, developing with age.
Using the Mfap2−/− model, we demonstrate that MAT expansion occurs concurrent with insulin resistance, not excessive peripheral adiposity or hyperglycemia. Bone loss in the MAGP1-deficient mice occurs without corresponding increases in MAT. Furthermore, a fivefold increase in MAT in the proximal tibia does not negatively affect bone marrow (BM) cellularity.
Materials and Methods
Animals and Diet
All animals were C57BL/6 background males, housed in a pathogen-free animal facility and fed standard chow ad libitum. MAGP1-deficient mice were generated using C57BL/6-derived ES cells [Mfap2tm1a(KOMP)Wtsi] purchased from KOMP Repository (Davis, CA, USA). ES cells were injected into blastocyst from C57BL/6 donors and transferred into pseudopregnant C57BL/6 females. Offspring were maintained on the Jackson Laboratories C57BL/6J strain. These mice are a newly derived line and are therefore different from the Mfap2−/− mice used in previous studies (13, 14, 16, 17). All animals were treated in accordance with animal protocols approved by the Animal Studies Committee at Washington University.
Tissue Collection
Tissues were harvested at 2, 6, and 10 months. Mouse fur was sprayed with 70% EtOH, then gonadal white adipose tissue (gWAT), and tibias were collected. Tissues were cleaned thoroughly of all contaminants (hair, connective tissue, etc.), then frozen or stored in 10% neutral buffered formalin.
Insulin Tolerance Test
For insulin tolerance tests (ITTs), mice were fasted for 6 h and then given an injection of 0.75 U/kg Humulin-R insulin (Lilly, Indianapolis, IN, USA). Insulin was delivered by intraperitoneal injection, and tail blood glucose concentration was measured using Contour strips and meters (Bayer, Whippany, NJ, USA) at the indicated intervals.
Osmium Staining and Micro-Computed Tomography
Micro-computed tomography (μCT) was completed on tibias from 2-, 6-, and 10-month-old mice. Bones were fixed in 10% neutral buffered formalin and then embedded in 2% agarose gel. Tibias were scanned at 20 μm voxel resolution using a Scanco μCT 40 (Scanco Medical AG, Zurich, Switzerland) calibrated using a hydroxyapatite phantom. Measurements of both trabecular and cortical bones were made based on reported guidelines (18). For trabecular bone, 50 slices below the growth plate were contoured to exclude the cortical bone, allowing trabecular bone volume/tissue volume (BV/TV) and bone mineral density (BMD) to be determined. For cortical bone, 20 slices – 2 mm proximal to the tibia–fibula junction were analyzed to determine cortical tissue mineral density (TMD). A threshold of 175 for trabecular bone and 260 for cortical bone (on a 0–1000 scale) was maintained. Note: two 10-month-old Mfap2−/− bones were excluded from study due to suspected fracture.
Tibias were then decalcified in 14% EDTA for 3 weeks. Demineralized bones were incubated in a solution containing 1% osmium and 2.5% potassium dichromate for 48 h at room temperature. After thorough washing (water), tibias were embedded in 1% agarose gel. Osmium stained bones were then scanned as above, using a Scanco μCT 40, but at 10 μm voxel resolution. Analysis was performed in the same region as the trabecular bone (1,000 μm distal to the growth plate, 100 slices), using a threshold of 350 (on a 0–1000 scale). Osmium volume (OV) is quantification of the total OV within the region of interest. OV/TV is division of the OV by the volume of the marrow cavity within the same region.
Flow Cytometry
Blood, spleen, and BM (one each of pelvis bone, femur, and tibia) were harvested from Jackson Laboratories c57BL/6J WT and Mfap2−/− mice using standard techniques. Single cell suspensions were made, and red blood cells were lysed. Blood cells were counted using a Hemavet. BM and spleen cells were counted using a Cellometer. Ten million cells were stained and washed in FACS buffer (PBS, 1% BSA, 0.1% sodium aziade, and 2 μm EDTA). For monocyte, macrophage, and neutrophil analyses, cells from each tissue were stained with Brilliant Violet 421-conjugated F4/80 (BM8), peridinin chlorophyll protein complex (PerCP)-Cy5.5-conjugated MHC Class II (M5/114.15.2), phycoerythrin (PE)-Cy7-conjugated CD11c (N418), allophycocyanin (APC)-conjugated CD19 (1D3), APC-conjugated CD45R/B220 (RA3-6B2), APC-eFluor780-conjugated Ly-6G (Gr1, RB6-8C5), and PE-conjugated CD115 (AFS98). Two million live events were collected in the live gate and analyzed via FlowJo. Gating strategies can be found in Figure S1 in Supplementary Material.
Statistical Analysis
Statistical comparisons were performed using Graphpad Prism® (GraphPad Software, Inc., La Jolla, CA, USA). In Figures 1–3, with the exception of panel 2D, comparisons between wild-type (WT) and Mfap2−/− mice at each time point and over time within groups (WT or Mfap2−/−) were performed using a regular two-way ANOVA with Holm–Sidak correction for multiple comparisons. For the ITTs in panel 2D, repeated measures two-way ANOVA with Sidak’s correction was used. In Figures 4 and 5, results were compared with a two-tailed t-test. Comparisons with a P-value ≤0.05 were considered statistically significant.
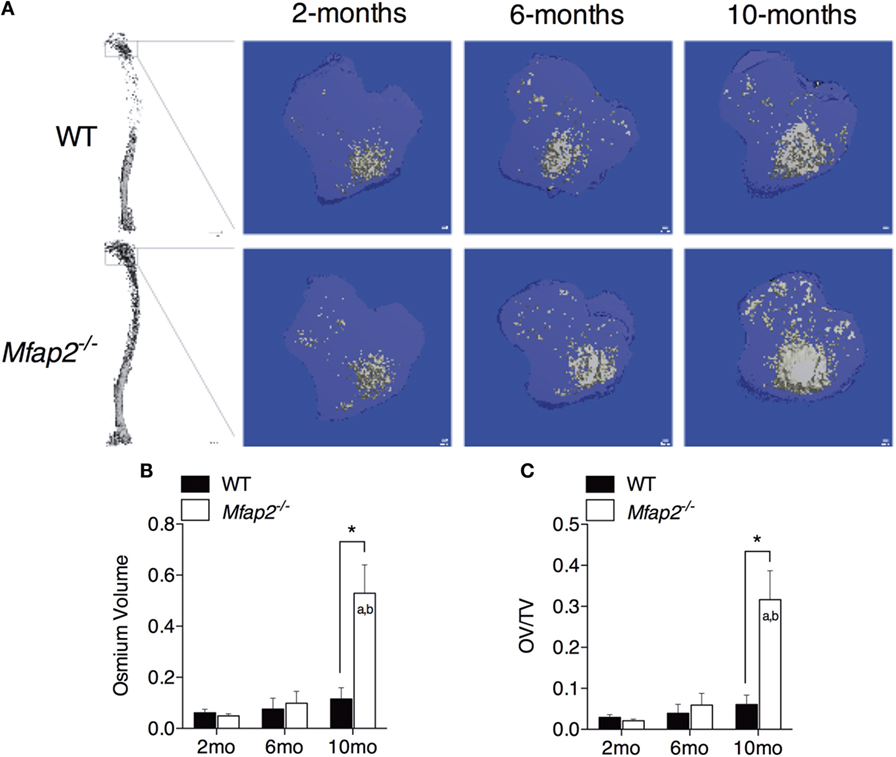
Figure 1. MAT expansion in Mfap2−/− mice. (A) Micro-computed tomography (μCT) visualization of osmium stained lipid within the decalcified proximal tibia. (B,C) Region analyzed for osmium volume (OV) was 1 mm distal to the growth plate. OV/TV is osmium volume divided by the marrow cavity volume in the same region. Mean ± SEM; Sample sizes for WT and Mfap2−/− mice, respectively: 2 months: n = 8, 8; 6 months: n = 6, 8; and 10 months: n = 8, 6. Statistical significance at each time point and within groups (WT or Mfap2−/−) over time was determined by two-way ANOVA with Holm–Sidak’s correction for multiple comparisons (*p ≤ 0.05, a = significant relative to 2 months of same genotype, and b = significant relative to 6 months of same genotype). Scale bar is 100 μm. Note: two 10-month-old Mfap2−/− bones were excluded from study due to suspected fracture.
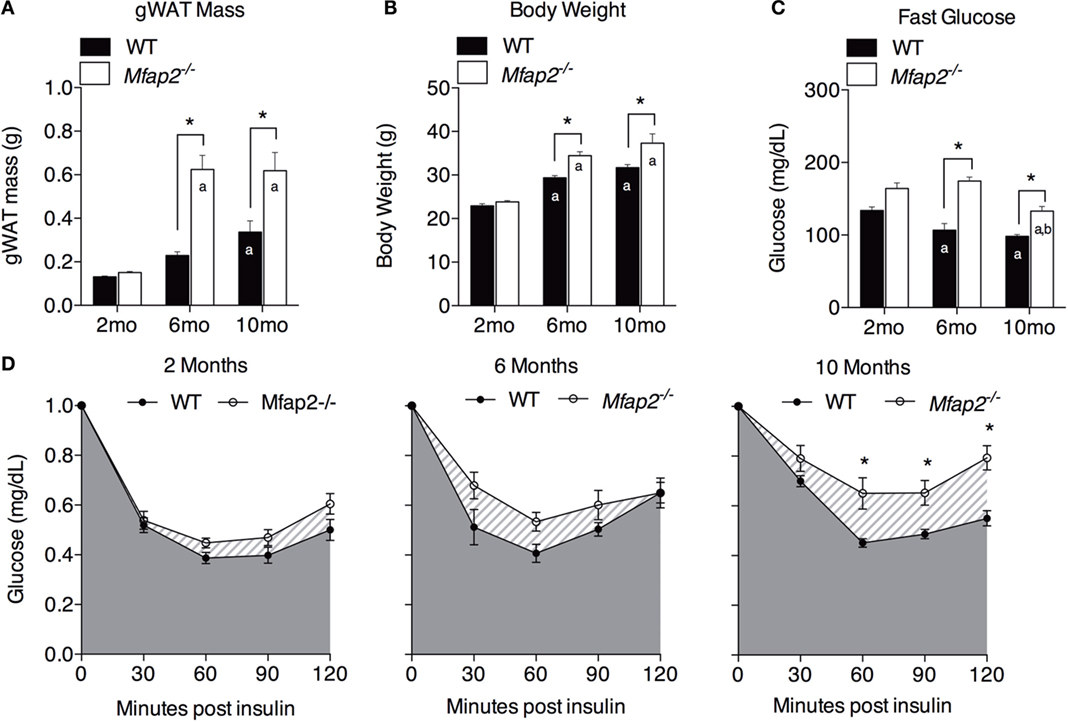
Figure 2. Characterization of metabolic disorder in Mfap2−/−mice. (A) Gonadal white adipose tissue (WAT) was harvested at 2 months (n = 10, 8), 6 months (n = 6, 8), and 10 months (n = 8, 8). (B) Total body weight at 2 months (n = 10, 8), 6 months (n = 7, 9), and 10 months (n = 8, 8). (C) Fasted (6 h) blood glucose concentration at 2 months (n = 10, 8), 6 months (n = 6, 8), and 10 months (n = 8, 8). (D) Insulin sensitivity results at 2 months (n = 10, 8), 6 months (n = 5, 8), and 10 months (n = 8, 8). Blood glucose data were normalized to time point 0 (before insulin injection). Mean ± SEM; statistical significance in (A–C) at each time point and within groups (WT or Mfap2−/−) over time was determined by two-way ANOVA with Holm–Sidak’s correction for multiple comparisons. Statistical significance in (D) was determined by repeated-measured two-way ANOVA with Sidak’s correction (*p ≤ 0.05, a = significant relative to 2 months of same genotype, and b = significant relative to 6 months of same genotype). Sample sizes shown above are for WT and Mfap2−/− mice, respectively.
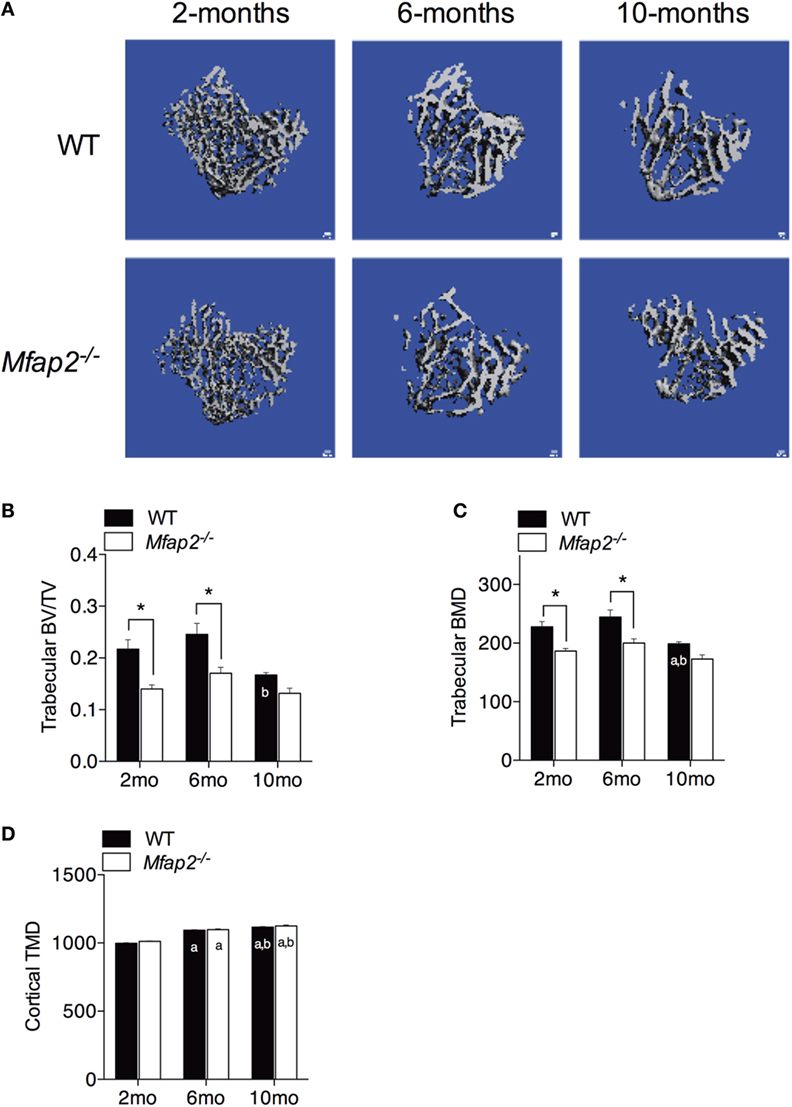
Figure 3. Skeletal changes in Mfap2−/− mice. Tibias were harvested at 2, 6, and 10 months. Micro-comupted tomography was used to determine the ratio of bone volume to total volume (BV/TV) and bone mineral density (BMD/TMD). (A–C) For trabecular bone, 1 mm distal to the growth plate was analyzed. (D) For cortical bone, tissue mineral density (TMD) was determined by contouring 400 μm located 2 mm proximal to the tibia–fibula junction. Sample size for WT and Mfap2−/− mice, respectively, are 2 months n = 8, 8; 6 months n = 6, 8; and 10 months n = 8, 6. Mean ± SEM; statistical significance at each time point and within groups (WT or Mfap2−/−) over time was determined by two-way ANOVA with Holm–Sidak’s correction for multiple comparisons (*p ≤ 0.05, a = significant relative to 2 months of same genotype, and b = significant relative to 6 months of same genotype). Scale bar is 100 μm. Note: two 10-month-old Mfap2−/− bones were excluded from study due to suspected fracture.
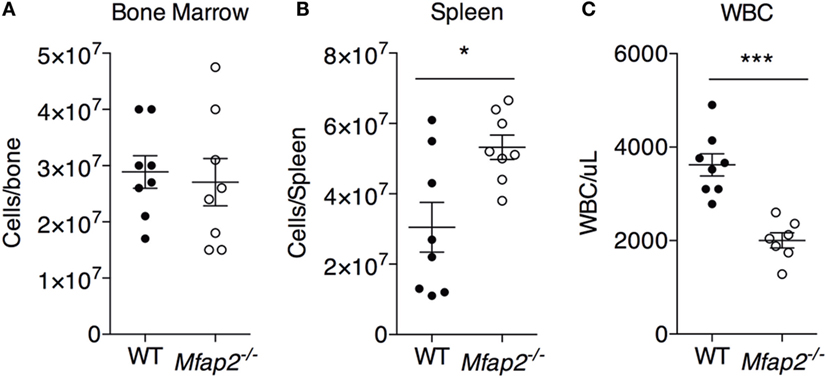
Figure 4. MAT expansion and hematopoiesis. To address the consequence of pathologic MAT expansion on hematopoiesis, the cellularity of the (A) bone marrow, (B) spleen, and (C) blood [white blood cells (WBCs)] were measured at 10 months. Sample size for WT and Mfap2−/− mice, respectively, are n = 8, 8 (A,B) or n = 8, 7 (C). Mean ± SEM; Student’s t-test was done for single comparison (*p ≤ 0.05 and ***p ≤ 0.001).
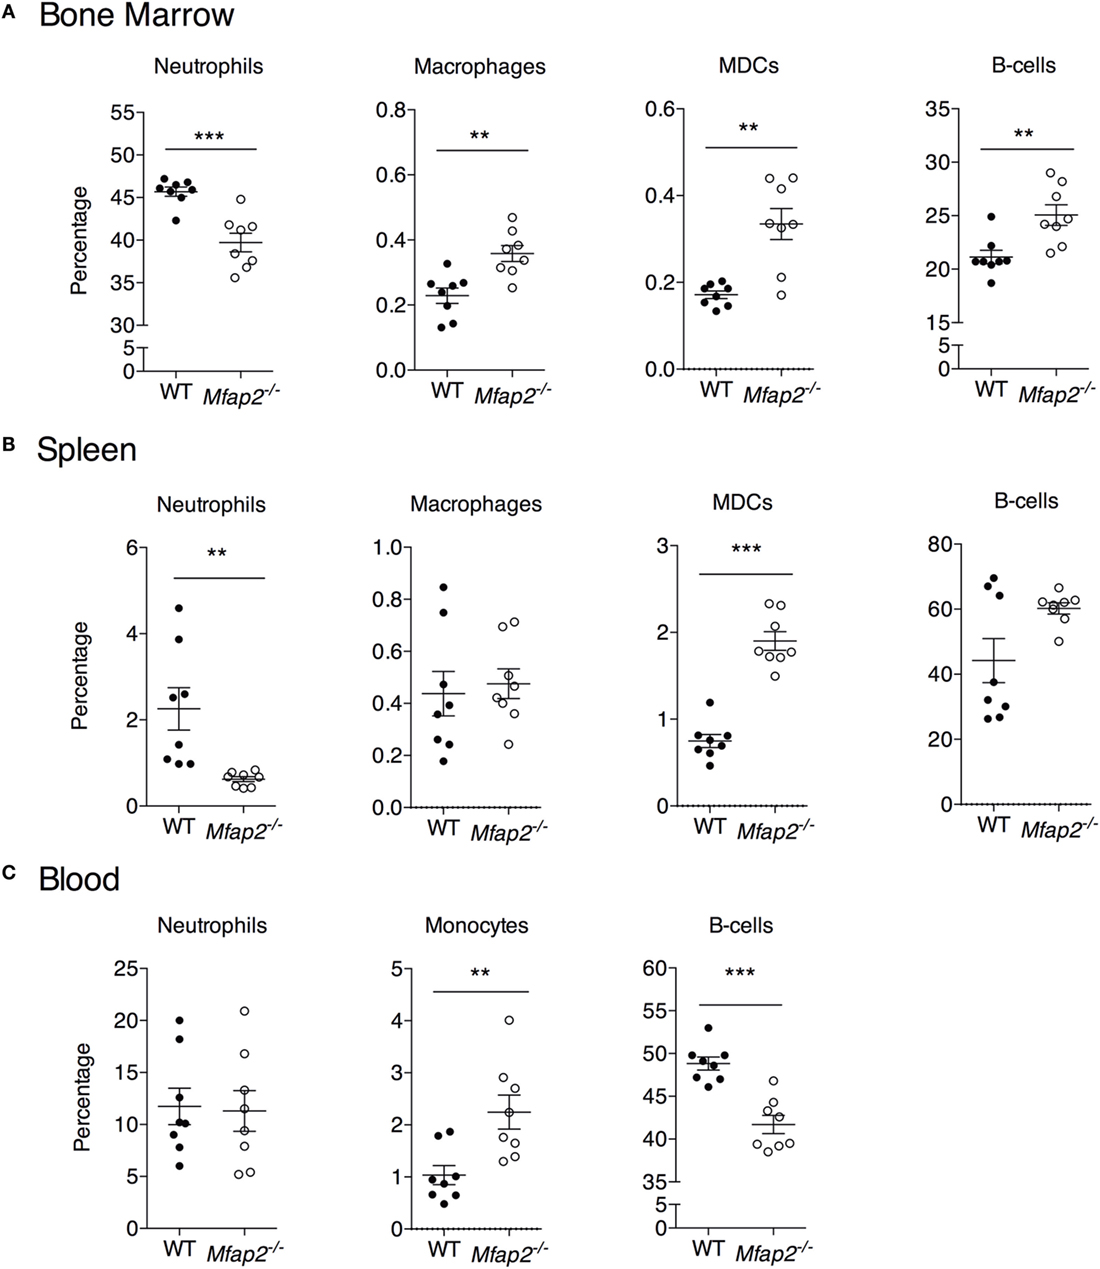
Figure 5. Neutrophil, macrophage, myeloid-derived dendritic cell, monocyte, and B cell frequency within the (A) bone marrow, (B) spleen, and (C) blood at 10 months. Neutrophils: B220−, Gr1+. Macrophage: B220−, Gr1−, MHCII+, F4/80+, and CD11c−. Dendritic cell: B220−, Gr1−, MHCII+, F4/80−, and CD11c+. Monocyte: B220−, Gr1−, and F4/80+. Sample sizes for WT and Mfap2−/− mice, respectively, are n = 8 and 8. Mean ± SEM; Student’s t-test was done for single comparison (*p ≤ 0.05, **p ≤ 0.01, and ***p ≤ 0.001).
Results
Pathologic MAT Expansion in Mfap2−/− Mice
To compare parameters of metabolic disease with MAT expansion, a longitudinal study was performed in MAGP1-deficient (Mfap2−/−) mice that are susceptible to metabolic syndrome. Marrow adiposity was determined by μCT imaging of osmium stained lipid within the proximal tibia (Figure 1A). Quantification of total marrow lipid OV and OV normalized to total marrow cavity volume (OV/TV) is shown in Figures 1B,C. Marrow adiposity was found to be indistinguishable in either young (2 months) or adult (6 months) Mfap2−/− mice, relative to WT mice. However, aged 10-month-old Mfap2−/− mice displayed a fivefold increase in marrow lipid (OV and OV/TV) relative to WT animals. WT C57BL/6 mice have only a modest, statistically insignificant, increase (54%) in MAT between 6 and 10 months.
Characterization of Metabolic Dysfunction in Mfap2−/− Mice
Previously, we demonstrated that MAGP1 deficiency results in excess adiposity and reduced bone mass (13, 14, 16). Consistent with previous results, 2-month-old Mfap2−/− mice had only a modest 15% increase in white fat (as measured by gonadal fat pad mass, Figure 2A). However, by 6 months, Mfap2−/− mice had a 2.7-fold increase in fat mass, relative to WT mice. Extending our study to 10 months of age, we found that the differential in fat mass stabilizes, indicated by a 1.8-fold increase Mfap2−/− gonadal fat pad mass relative to WT mice. Total body weight reinforced this finding (Figure 2B). Mfap2−/− body weight was insignificantly increased at 2 months, but a significant (17%) increase in Mfap2−/− weight was found at 6 months. Similar to the fat mass measurement, the weight differential between WT and Mfap2−/− mice stabilized, remaining increased by 17% relative to baseline, at 10 months. Six-hour fasting blood glucose was significantly elevated in Mfap2−/− mice by 2 months (12%, Figure 2C). By 6 months, fasted blood glucose was 63% higher in Mfap2−/− mice relative to WT mice. However, by 10 months, there was only a 35% increase in Mfap2−/− blood glucose relative to WT. To characterize metabolic function, ITTs were performed on WT and Mfap2−/− mice at all ages (Figure 2D). In contrast to fat mass, body weight, and fasting blood glucose, insulin resistance did not reach statistical significance until the Mfap2−/− mice were 10-month old. Thus, Mfap2−/− mice are severely hyperglycemic by 6 months in age, but not insulin resistant until 10 months.
Relationship between MAT Expansion and Bone Mass
Tibial bone morphology was assessed by μCT prior to osmium staining for MAT quantification (Figure 3A). Trabecular bone analysis was performed using the same region of interest analyzed for MAT (Figures 3B,C). Reduced trabecular bone volume (BV/TV) and BMD were detectable in Mfap2−/− mice by 2 months. Aging of WT mice from 6 to 10 months was associated with statistically significant reductions in trabecular bone volume (−32%, Figure 3B) and mineral density (−19%, Figure 3C), but not a statistically significant increase in MAT (Figure 1C). During this time, Mfap2−/− mice had a 22% reduction in BV/TV (Figure 3B), but a 5.2-fold increase in MAT volume (OV/TV, Figure 1C). Cortical bone density was maintained during aging and unchanged by MAT accumulation (Figure 3D). In fact, cortical BMD was highest at 10 months in both WT and Mfap2−/− mice. Additional μCT indices of bone structure can be found in Tables S1 and S2 in Supplementary Material.
MAT Expansion and Hematopoiesis
To address the impact of pathologic MAT expansion on hematopoietic function, we measured the cellularity of the BM and spleen as well as the number of circulating white blood cells (WBCs) at 10 months of age. BM cellularity was not significantly reduced in Mfap2−/− mice, despite the fivefold increase in MAT (Figure 4A). However, spleen cellularity was slightly elevated and WBC count was decreased in Mfap2−/− mice (Figures 4B,C). To further investigate these findings, flow cytometry was used to assess hematopoietic lineage distribution. Within the BM of Mfap2−/− mice, there was a modest increase in macrophages, myeloid-derived dendritic cells (MDCs), and B-cells (+61, +78, and +18%, respectively) and a corresponding decrease in neutrophils relative to WT mice (−13%) (Figure 5A). In the spleen, there was a significant increase in MDCs (+250%) and decrease in neutrophils (−72%), with a trend to increased B-cells (Figure 5B). Finally, in the blood, we observed an increase in monocytes (+216%) and a modest decrease in B-cells (−15%) in Mfap2−/− mice (Figure 5C).
Discussion
Once viewed as inert, space-filling structures, BM adipocytes are now recognized as metabolically active cells with the potential to influence bone remodeling and hematopoiesis. The relationship between MAT volume and peripheral fat mass has been addressed previously (9, 10). In rodents, weight gain resulting from HFD feeding is associated with significant MAT expansion. However, extreme peripheral fat loss due to caloric restriction also correlates with increased marrow adiposity (6). The rapid change in adiposity impedes our understanding of whether changes in peripheral adipose tissue lipid storage shift lipids to the marrow, or if metabolic changes such as insulin resistance contribute to MAT expansion. To address this question, we performed a longitudinal study of mice predisposed to excess, age-associated fat accumulation without dietary intervention.
Microfibril-associated glycoprotein-1 is a matricellular protein that associates with ECM structures but does not contribute to their biophysical properties. Instead, MAGP1 affords fibrillar structures the capacity to regulate signal transduction by tethering growth factors to the ECM [reviewed in Ref. (12)]. MAGP1 is expressed in adipose tissue. MAGP1 deficiency in mice (Mfap2−/−) causes adipocyte hypertrophy in peripheral WAT, which contributes to obesity and then insulin resistance (13). MAGP1 is also highly expressed by osteoblasts in the bone. Loss of MAGP1 in vivo leads to increased osteoclast number and reduced bone mass (14). In this study, MAT expansion did not occur coincident with bone loss or excess peripheral adiposity in Mfap2−/− mice; osteopenia was detectable by 2 months and excess adiposity by 6 months in Mfap2−/− mice whereas pathologic MAT expansion was not detectable until 10 months of age. This suggests that MAGP1 deficiency in bone is sufficient to cause abnormal bone remodeling but is unlikely to be mediating the changes in MAT. Instead, MAT expansion coincided with insulin resistance in Mfap2−/− mice. Our findings are of importance because they address three confounding factors of MAT biology: the mechanisms that drive MAT expansion, the relationship between MAT expansion and bone loss, and whether MAT is detrimental to hematopoiesis.
The coincidence of MAT expansion with insulin resistance suggests that insulin may limit MAT adipocyte size or number. Insulin signaling in marrow adipocytes has not been reported, thus, we cannot comment on insulin’s direct action on lipid storage or adipogenesis in these specialized cells. However, the pathophysiology of insulin resistance could induce a secondary complication (e.g., hyperlipidemia) that drives subsequent MAT expansion. Insulin is a potent inhibitor of lipolysis, the breakdown of triglyceride stores, in traditional white adipocytes. Insulin resistance is therefore associated with elevated circulating free fatty acids (FFA) and excess energy storage in atypical sites (e.g., muscle and liver) (19). It is possible that marrow adipocytes respond to elevated FFA associated with insulin resistance by storing them as triglycerides. Rodent models of type 1 diabetes (T1DM) also display significant MAT accumulation (20–22), providing a second example of perturbed insulin signaling associating with hyperlipidemia and MAT expansion.
The relationship between marrow adiposity and bone mass is highly debated. Published reports have shown that MAT expansion can coincide with increased, reduced, or unchanged bone volume (9, 10, 23–27).
Substantial in vitro evidence demonstrates that adipocytes and osteoblasts arise from the same mesenchymal progenitor. If true, maturation of mesenchymal stem cells through the adipocyte lineage should be at the expense of the osteoblast lineage. However, in vivo evidence is conflicting. Specifically, lineage tracing of marrow adipocytes has demonstrated that the osteoblasts are derived from a Gremlin-1 positive mesenchymal progenitor cell, but these Gremlin-1 positive cells do not differentiate into adipocytes (28). This would allow osteoblast cell numbers to exist independent of marrow adipocyte number. The marrow cavity is also a relatively defined space, and it would, therefore, seem that expansion of MAT must occur at the expense of something else, such as bone. Our study supports a disconnection between MAT volume and bone volume. When WT and Mfap2−/− mice age from 6 to 10 months, there is an increase in MAT and decrease in BV/TV. However, loss of trabecular BV/TV from 6 to 10 months is actually greater in WT mice, despite Mfap2−/− mice having a greater accrual of MAT. Specifically, in WT mice, BV/TV loss is 32% and MAT volume increases 54%; however, MAT volume in Mfap2−/− mice is increased 530% but BV/TV is decreased only 22%.
Marrow adipocytes are considered as members of the hematopoietic niche. Marrow adiposity and hematopoiesis have been studied in the context of marrow ablation by irradiation and chemotherapy. From these studies, it was concluded that the filling of the marrow with fat impedes marrow reconstitution and hematopoiesis (29–31). The current study investigated the consequence of pathologic MAT expansion on existing hematopoietic cells (not reconstitution). We found a significant reduction in circulating WBCs and a small increase in spleen cellularity, indicators of BM failure and extramedullary hematopoiesis. Further study is needed to determine whether MAT expansion in this model leads to a loss of functional hematopoietic stem cells. Unexpectedly, however, total BM cellularity was unchanged. This may be due to shifts in marrow composition to favor loss of fluid space and vascular tone with MAT expansion to allow subsequent preservation of hematopoiesis. We also examined whether fat expansion within the marrow would cause a recruitment (or retention) of macrophages. Macrophages are recruited to peripheral adipose tissue to allow remodeling of adipose tissue during expansion, and because of this, obesity is linked to fat inflammation (32). Indeed, we found a slight increase in macrophage frequency within Mfap2−/− BM. However, the implications of this finding are unclear. Future studies are needed to examine the remodeling of the MAT adipocyte niche in response to obesity.
The goal of this project was to determine the association between pathologic MAT expansion and peripheral indicators of metabolic dysfunction without the use of modified diet. We also addressed the relationship between MAT expansion and bone mass, and the consequence of pathologic MAT expansion on hematopoiesis. We found that MAT volume was not linked directly to peripheral fat accumulation and, instead, coincided with insulin resistance. Furthermore, we found that bone loss occurred, regardless of MAT expansion, in Mfap2−/− relative to WT at all ages. Lastly, we show that MAT expansion is associated with modest alterations in basal hematopoiesis, including a shift from granulopoiesis to B lymphopoiesis.
Author Contributions
TW and ST contributed equally to this work. TW, ST, AS, and BA designed and performed the experiments as well as analyzed the data. TW, ST, and CC wrote the manuscript. GA-E and DL analyzed and interpreted FACS data. CC, ES, RM, and DL provided research materials and contributed to editing of the manuscript.
Conflict of Interest Statement
The authors declare that the research was conducted in the absence of any commercial or financial relationships that could be construed as a potential conflict of interest.
Acknowledgments
We thank Dan Leib for his help in developing the osmium μCT imaging technique, and Kayla Moller for her generation of the 3-dimensional μCT images. This work was supported by National Institutes of Health grants HL-053325 and HL-105314 to RM, and K99-DE024178 to ES. An American Diabetes Association grant 7-13-JF-16 to CC. Washington University Nutrition and Obesity Research Center award P30-DK-056341 to CC, and Washington University’s Musculoskeletal Research Center award JIT2014_Craft_1 to CC. Technical support was provided by the Mouse Phenotyping Core, the Adipocyte Biology and Molecular Nutrition Core of the Nutrition and Obesity Research Center (grant P30-DK-056341), the Morphology Core of the Digestive Disease Research Core Center (grant P30-DK-52574), and the Washington University Musculoskeletal Research Center structure and strength core (grant P30-AR-057235).
Supplementary Material
The Supplementary Material for this article can be found online at http://journal.frontiersin.org/article/10.3389/fendo.2016.00087
Abbreviations
ECM, extracellular matrix; MAT, marrow adipose tissue; MAGP1, microfibril-associated glycoprotein-1.
References
1. Sanchez-Gurmaches J, Hung CM, Guertin DA. Emerging complexities in adipocyte origins and identity. Trends Cell Biol (2016) 26:313–26. doi:10.1016/j.tcb.2016.01.004
2. Berry R, Rodeheffer MS, Rosen CJ, Horowitz MC. Adipose tissue residing progenitors (adipocyte lineage progenitors and adipose derived stem cells (ADSC)). Curr Mol Biol Rep (2015) 1:101–9. doi:10.1007/s40610-015-0018-y
3. Steiner RM, Mitchell DG, Rao VM, Murphy S, Rifkin MD, Burk DL, et al. Magnetic resonance imaging of bone marrow: diagnostic value in diffuse hematologic disorders. Magn Reson Q (1990) 6:17–34.
4. Scheller EL, Doucette CR, Learman BS, Cawthorn WP, Khandaker S, Schell B, et al. Region-specific variation in the properties of skeletal adipocytes reveals regulated and constitutive marrow adipose tissues. Nat Commun (2015) 6:7808. doi:10.1038/ncomms8808
5. Cawthorn WP, Scheller EL, Parlee SD, Pham HA, Learman BS, Redshaw CM, et al. Expansion of bone marrow adipose tissue during caloric restriction is associated with increased circulating glucocorticoids and not with hypoleptinemia. Endocrinology (2016) 157:508–21. doi:10.1210/en.2015-1477
6. Cawthorn WP, Scheller EL, Learman BS, Parlee SD, Simon BR, Mori H, et al. Bone marrow adipose tissue is an endocrine organ that contributes to increased circulating adiponectin during caloric restriction. Cell Metab (2014) 20:368–75. doi:10.1016/j.cmet.2014.06.003
7. Lecka-Czernik B. Marrow fat metabolism is linked to the systemic energy metabolism. Bone (2012) 50:534–9. doi:10.1016/j.bone.2011.06.032
8. Hamrick MW, Della-Fera MA, Choi YH, Pennington C, Hartzell D, Baile CA. Leptin treatment induces loss of bone marrow adipocytes and increases bone formation in leptin-deficient ob/ob mice. J Bone Miner Res (2005) 20:994–1001. doi:10.1359/JBMR.050103
9. Doucette CR, Horowitz MC, Berry R, MacDougald OA, Anunciado-Koza R, Koza RA, et al. A high fat diet increases bone marrow adipose tissue (MAT) but does not alter trabecular or cortical bone mass in C57BL/6J mice. J Cell Physiol (2015) 230:2032–7. doi:10.1002/jcp.24954
10. Lecka-Czernik B, Stechschulte LA, Czernik PJ, Dowling AR. High bone mass in adult mice with diet-induced obesity results from a combination of initial increase in bone mass followed by attenuation in bone formation; implications for high bone mass and decreased bone quality in obesity. Mol Cell Endocrinol (2015) 410:35–41. doi:10.1016/j.mce.2015.01.001
11. Frantz C, Stewart KM, Weaver VM. The extracellular matrix at a glance. J Cell Sci (2010) 123:4195–200. doi:10.1242/jcs.023820
12. Mecham RP, Gibson MA. The microfibril-associated glycoproteins (MAGPs) and the microfibrillar niche. Matrix Biol (2015) 47:13–33. doi:10.1016/j.matbio.2015.05.003
13. Craft CS, Pietka TA, Schappe T, Coleman T, Combs MD, Klein S, et al. The extracellular matrix protein MAGP1 supports thermogenesis and protects against obesity and diabetes through regulation of TGF-β. Diabetes (2014) 63:1920–32. doi:10.2337/db13-1604
14. Craft CS, Zou W, Watkins M, Grimston S, Brodt MD, Broekelmann TJ, et al. Microfibril-associated glycoprotein-1, an extracellular matrix regulator of bone remodeling. J Biol Chem (2010) 285:23858–67. doi:10.1074/jbc.M110.113019
15. Finnis ML, Gibson MA. Microfibril-associated glycoprotein-1 (MAGP-1) binds to the pepsin-resistant domain of the alpha3(VI) chain of type VI collagen. J Biol Chem (1997) 272:22817–23. doi:10.1074/jbc.272.36.22817
16. Weinbaum JS, Broekelmann TJ, Pierce RA, Werneck CC, Segade F, Craft CS, et al. Deficiency in microfibril-associated glycoprotein-1 leads to complex phenotypes in multiple organ systems. J Biol Chem (2008) 283:25533–43. doi:10.1074/jbc.M709962200
17. Craft CS, Broekelmann TJ, Zou W, Chappel JC, Teitelbaum SL, Mecham RP. Oophorectomy-induced bone loss is attenuated in MAGP1-deficient mice. J Cell Biochem (2012) 113:93–9. doi:10.1002/jcb.23331
18. Bouxsein ML, Boyd SK, Christiansen BA, Guldberg RE, Jepsen KJ, Müller R. Guidelines for assessment of bone microstructure in rodents using micro-computed tomography. J Bone Miner Res (2010) 25:1468–86. doi:10.1002/jbmr.141
19. Karpe F, Dickmann JR, Frayn KN. Fatty acids, obesity, and insulin resistance: time for a reevaluation. Diabetes (2011) 60:2441–9. doi:10.2337/db11-0425
20. Botolin S, McCabe LR. Inhibition of PPARgamma prevents type I diabetic bone marrow adiposity but not bone loss. J Cell Physiol (2006) 209:967–76. doi:10.1002/jcp.20804
21. Botolin S, Faugere MC, Malluche H, Orth M, Meyer R, McCabe LR. Increased bone adiposity and peroxisomal proliferator-activated receptor-gamma2 expression in type I diabetic mice. Endocrinology (2005) 146:3622–31. doi:10.1210/en.2004-1677
22. Botolin S, McCabe LR. Bone loss and increased bone adiposity in spontaneous and pharmacologically induced diabetic mice. Endocrinology (2007) 148:198–205. doi:10.1210/en.2006-1006
23. Bredella MA, Fazeli PK, Miller KK, Misra M, Torriani M, Thomas BJ, et al. Increased bone marrow fat in anorexia nervosa. J Clin Endocrinol Metab (2009) 94:2129–36. doi:10.1210/jc.2008-2532
24. Ecklund K, Vajapeyam S, Feldman HA, Buzney CD, Mulkern RV, Kleinman PK, et al. Bone marrow changes in adolescent girls with anorexia nervosa. J Bone Miner Res (2010) 25:298–304. doi:10.1359/jbmr.090805
25. Schwartz AV, Sigurdsson S, Hue TF, Lang TF, Harris TB, Rosen CJ, et al. Vertebral bone marrow fat associated with lower trabecular BMD and prevalent vertebral fracture in older adults. J Clin Endocrinol Metab (2013) 98:2294–300. doi:10.1210/jc.2012-3949
26. Yeung DK, Griffith JF, Antonio GE, Lee FK, Woo J, Leung PC. Osteoporosis is associated with increased marrow fat content and decreased marrow fat unsaturation: a proton MR spectroscopy study. J Magn Reson Imaging (2005) 22:279–85. doi:10.1002/jmri.20367
27. Cohen A, Dempster DW, Stein EM, Nickolas TL, Zhou H, McMahon DJ, et al. Increased marrow adiposity in premenopausal women with idiopathic osteoporosis. J Clin Endocrinol Metab (2012) 97:2782–91. doi:10.1210/jc.2012-1477
28. Worthley DL, Churchill M, Compton JT, Tailor Y, Rao M, Si Y, et al. Gremlin 1 identifies a skeletal stem cell with bone, cartilage, and reticular stromal potential. Cell (2015) 160:269–84. doi:10.1016/j.cell.2014.11.042
29. Green DE, Adler BJ, Chan ME, Rubin CT. Devastation of adult stem cell pools by irradiation precedes collapse of trabecular bone quality and quantity. J Bone Miner Res (2012) 27:749–59. doi:10.1002/jbmr.1505
30. Green DE, Adler BJ, Chan ME, Lennon JJ, Acerbo AS, Miller LM, et al. Altered composition of bone as triggered by irradiation facilitates the rapid erosion of the matrix by both cellular and physicochemical processes. PLoS One (2013) 8:e64952. doi:10.1371/journal.pone.0064952
31. Zhu RJ, Wu MQ, Li ZJ, Zhang Y, Liu KY. Hematopoietic recovery following chemotherapy is improved by BADGE-induced inhibition of adipogenesis. Int J Hematol (2013) 97:58–72. doi:10.1007/s12185-012-1233-4
Keywords: marrow adipose tissue, obesity, insulin resistance, bone remodeling, hematopoiesis, microfibril-associated glycoprotein-1
Citation: Walji TA, Turecamo SE, Sanchez AC, Anthony BA, Abou-Ezzi G, Scheller EL, Link DC, Mecham RP and Craft CS (2016) Marrow Adipose Tissue Expansion Coincides with Insulin Resistance in MAGP1-Deficient Mice. Front. Endocrinol. 7:87. doi: 10.3389/fendo.2016.00087
Received: 05 May 2016; Accepted: 22 June 2016;
Published: 30 June 2016
Edited by:
Ann Schwartz, University of California San Francisco, USAReviewed by:
Katherine A. Staines, The Royal Veterinary College, UKBeata Lecka-Czernik, University of Toledo, USA
Copyright: © 2016 Walji, Turecamo, Sanchez, Anthony, Abou-Ezzi, Scheller, Link, Mecham and Craft. This is an open-access article distributed under the terms of the Creative Commons Attribution License (CC BY). The use, distribution or reproduction in other forums is permitted, provided the original author(s) or licensor are credited and that the original publication in this journal is cited, in accordance with accepted academic practice. No use, distribution or reproduction is permitted which does not comply with these terms.
*Correspondence: Clarissa S. Craft, clarissa.craft@wustl.edu
†Tezin A. Walji and Sarah E. Turecamo contributed equally to this work.