 Fengjiang Wei
 Jiaxin Li
 Chen Chen
 Kai Zhang3
 Wei-Dong Li
- 1Department of Genetics, College of Basic Medical Sciences, Tianjin Medical University, Tianjin, China
- 2Tianjin Medical University, Tianjin, China
- 3Tianjin Medical University General Hospital, Tianjin, China
- 4Department of Health Statistics, College of Public Health, Tianjin Medical University, Tianjin, China
Background: Non-alcoholic fatty liver disease (NAFLD) has become a serious disease affecting people's health in the world. This article studies the causal relationship between NAFLD and serum uric acid (SUA) levels.
Methods: During the 4 years of follow-up in a fixed cohort that was established in 2014, 2,832 follow-up subjects without NAFLD were finally included in this study. The study population was divided into four groups according to baseline SUA levels. Cox hazard regression model and Kaplan–Meier survival curves analysis were used to predict risk factors of NAFLD. The receiver operating characteristic curve analyses were used to determine SUA cutoffs for predicting NAFLD.
Results: The cumulative prevalence rates of NAFLD were 33.97% (962/2,832), 38.93% (758/1,947) in males and 23.05% (204/885) in females. The results showed that males had a higher incidence of NAFLD (χ2 = 68.412, P = 0.000). The Cox regression analysis disclosed that the hazard ratios of NAFLD [95% confidence interval (CI)] were 1.431 (95% CI, 1.123~1.823), 1.610 (95% CI, 1.262–2.054), and 1.666 (95% CI, 1.287–2.157) across the second to the fourth quartile of SUA adjusted for other confounders. The SUA cutoffs, sensitivity, specificity, and area under the curve (AUC) (95% CI) were ≥288.5 μmol/L, 75.5, 46.5%, 0.637(0.616–0.658), respectively, for total; ≥319.5 μmol/L, 65.8%, 48.4%, 0.590 (0.564–0.615), respectively, for males; and ≥287.5 μmol/L, 51.0%, 75.6%, 0.662 (0.619–0.704), respectively, for females. Kaplan–Meier survival curves revealed that individuals with higher SUA level had an increased risk of NAFLD in comparison to lower SUA level (P = 0.000).
Conclusion: Serum uric acid is positively correlated with NAFLD, and elevated SUA level can be used as an independent predictor for NAFLD.
Introduction
Non-alcoholic fatty liver disease (NAFLD) is a very common chronic liver disease. The prevalence of NAFLD in the general population ranges from 20 to 30%, but its prevalence in the middle-aged population of Western countries can reach 46%, and 5 to 42% in Asian countries (1–6). As a component of metabolic syndrome (MetS), NAFLD is closely related to obesity, insulin resistance (IR), type 2 diabetes mellitus (T2DM), cardiovascular disease, and other chronic diseases (7, 8).
Serum uric acid (SUA) maintains balance in the body through a series of precise regulation mechanisms. Previously, numerous studies have suggested that the level of SUA will increase with the development of chronic metabolic diseases such as cardiovascular disease (9, 10), T2DM (11), and MetS (12–14). Studies in European or Korean populations have shown that SUA is associated with the occurrence and progression of NAFLD. A meta-analysis involving 55,573 participants indicated that the level of SUA was still related to NAFLD except for the confounding factors of sex, age, and MetS (15). A study that included 6,967 participants has the same conclusion (16). But in a cohort study involving 7,564 atomic bomb survivors, this association was found to be not statistically significant (17). In a cross-sectional study including 129 children and adolescents, the association between SUA and NAFLD was not observed (18). In a Chinese prospective cohort study (PMMJS) among 841 NAFLD males, they arrived to the conclusion that the level of SUA was negatively correlated with the remission rate of NAFLD (19). A cross-sectional study of 541 patients with type 2 diabetes showed that the association between SUA and NAFLD was found only in males, but not in females (20). The reason for different conclusions may be different sample size, population, definitions of hyperuricemia, lifestyle, and eating habits.
However, the causal relationship between hyperuricemia and NAFLD is controversial. Therefore, we established a prospective cohort study in the Chinese population to determine the causal relationship between SUA level and NAFLD. All subjects provided written informed consent prior to starting the study, and the protocol was approved by the Human Ethics Committee of Tianjin Medical University.
Materials and Methods
Participants
We set up a follow-up cohort from April 2014 through October 2018. A total of 24,102 participants were enrolled in our cohort; after excluding the data that at least 1 year without a physical examination or with no test for SUA or one of the covariate variables, 4,418 subjects (3,222 men and 1,196 women) completed all inspections and measurements. Excluding 1,586 subjects (1,275 men and 311 women) with NAFLD at baseline examination, 2,832 subjects remained (1,947 men and 885 women, with an average age of 64.54 ± 14.66 years and 59.32 ± 15.83 years, respectively) in the study (Figure 1). Exclusion criteria were as follows: (1) already have NAFLD disease; (2) intake of alcohol >140 g/wk for males and 70 g/wk for females; (3) with a history of chronic liver disease.
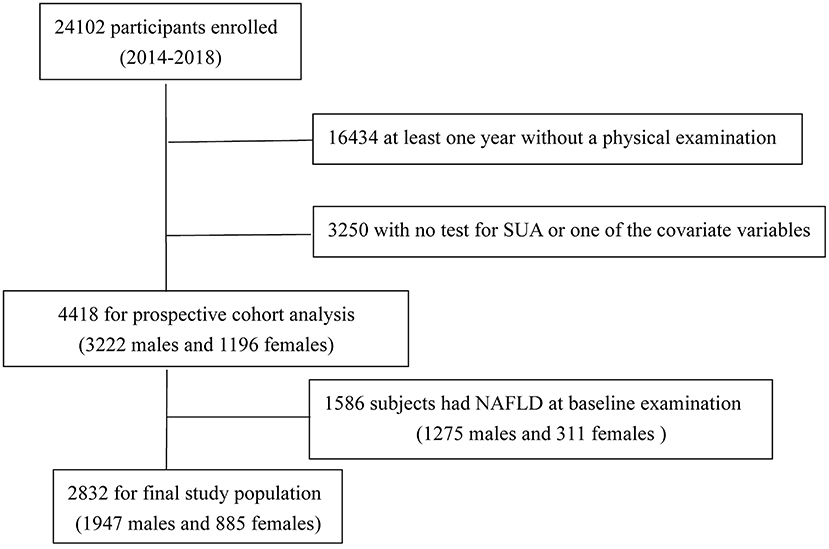
Figure 1. Flowchart of selection of study population.
Ultrasonography
All subjects underwent hepatic ultrasonic examination by a trained sonographer who was not involved in the study. Ultrasonic instrument was a Toshiba Nemio 20 sonography machine (Toshiba, Tokyo, Japan) with a 3.5-MHz probe. All subjects were classified into two groups (with or without NAFLD) according to hepatic ultrasonic examination results.
Measurement
All subjects underwent a yearly physical examination. Physiological index included height, weight, and blood pressure. Liver function index included total cholesterol (TC), high-density lipoprotein cholesterol (HDL), low-density lipoprotein cholesterol (LDL), and triglycerides (TGs); renal function index included SUA, serum creatinine (SCR), blood urea nitrogen (BUN), galactosyl glucosyltransferase, alanine aminotransferase (ALT), and aspartate transaminase. Glycometabolism index include glycated hemoglobin (HbA1c). Body mass index (BMI) was calculated (kg/m2) based on height and weight, and hypertension was defined as systolic blood pressure (SBP) of at least 140 mm Hg and/or diastolic blood pressure (DBP) of at least 90 mm Hg. The standard of hyperuricemia was SUA concentration ≥420 mol/L in men and ≥360 mol/L in women (21). The study population was divided into four groups according to the quartile of SUA levels. Estimated glomerular filtration rate (eGFR; mL/min per 1.73 m2) was calculated by using the equation proposed by investigators in the Chronic Kidney Disease Epidemiology Collaboration (22).
Statistical Analysis
Anthropometric and biochemical features were categorized as continuous or categorical variables. Mean and standard deviation or the median and interquartile range were used for continuous variables statistical description. Comparisons between the two groups (with or without NAFLD) were performed using the Student t-test or Mann–Whitney U-test. Rate and ratio were used for dichotomous variables statistical description, whereas χ2 test was used for comparisons between groups. The multiple Cox regression was used to assess the relationship between SUA and NAFLD. The hazard ratios (HRs) and the corresponding 95% confidence intervals (95% CIs) for NAFLD were calculated after controlling for demographic and other comorbidities. The Kaplan–Meier survival curves were illustrated to reveal the risk of NAFLD in each SUA quartile, and non-parametric log-rank test was used for comparison among SUA quartiles. At the same time, the sensitivity, specificity, and areas under the receiver operating characteristic (ROC) curves (AUR) were calculated to evaluate the diagnostic effect of the SUA. Determination of diagnostic cutoff point value of SUA was identified by maximizing the Youden index (J) where J = (sensitivity + specificity) – 1 (23, 24). Cox regression analysis was used to analyze the influencing factors of NAFLD. Statistical analysis software was SPSS statistical software, version 19.0 (SPSS Inc., Chicago, IL, USA) for Windows, and significance level was set at α = 0.05.
Results
The Univariate Analyses of Characteristics
The univariate analyses of factors associated with NAFLD are shown in Table 1. There was no significant difference in mean age, eGFR, TBIL, DBIL, GLB, BUN, and TC between the two groups. Gender, BMI, SBP, DBP, SUA, ALT, TP, ALB, SCR, FBG (fasting plasma glucose), HbA1c, TGs, HDL-C, and LDL-C were associated with NAFLD in univariate analysis (P < 0.05). The NAFLD group had higher BMI, SBP, DBP, ALT, TP, ALB, SCR, TGs, FBG, LDL-C, and HbA1c and lower HDL-C. The results showed that the NAFLD group had higher SUA level (Table 1).
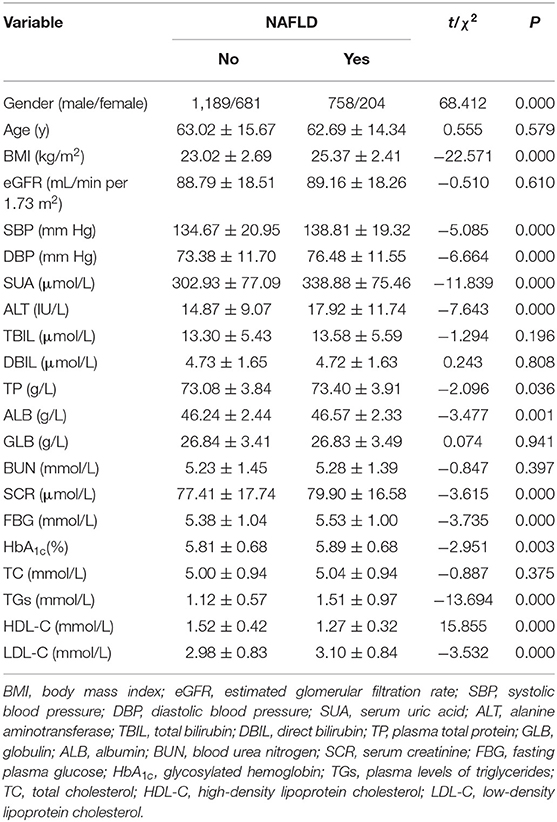
Table 1. The univariate analyses of demographic and laboratory characteristics of patients with or without NAFLD.
Association of SUA Level With Prevalence Rate of NAFLD
The cumulative prevalence rates of NAFLD after 4 years' follow-up was 33.97% (962/2,832): 38.93% (758/1,947) in males and 23.05% (204/885) in females, respectively (Table 2). Males had a higher incidence of NAFLD (χ2=49.860, P = 0.000). The prevalence rates of HUA (Hyperuricemia) identified by baseline SUA levels were 11.2% (318/2,832), 13.7% (266/1,947) in males, 6.1% (52/855) in females, respectively. The prevalence rates of HUA were higher in males (χ2=68.412, P = 0.000). The study population was divided into four quartiles by their SUA levels. As shown in Table 2, the overall prevalence of NAFLD was 18.51, 31.48, 40.06, and 45.62%, respectively, from the first quintile to the fourth in total. The results showed that the prevalence of NAFLD was significantly different among four quartiles (χ2=130.843, P = 0.000). The cumulative prevalence rates of NAFLD have a similar tendency in males and females. The results showed that SUA level was related to the prevalence of NAFLD.
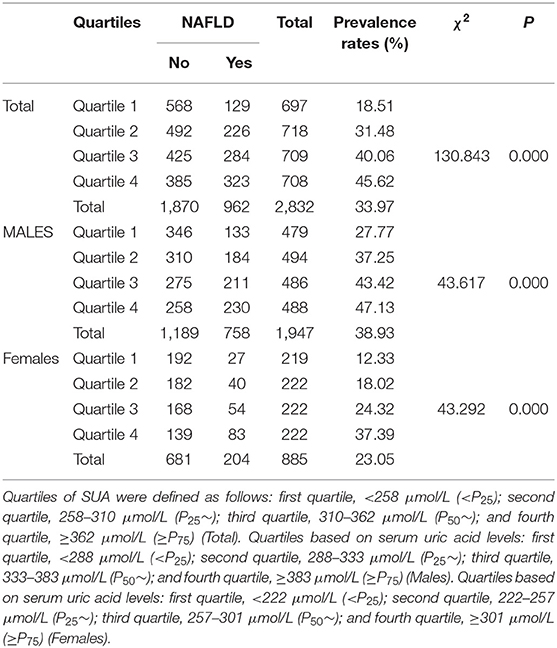
Table 2. Association of SUA level with prevalence rate of NAFLD.
The Cox Regression Analysis of SUA Levels for Incidence NAFLD
The Cox regression analysis was performed to evaluate association between SUA and NAFLD. Fourteen variables including gender, age, BMI, SBP, DBP, ALT, TP, SCR, ALB, FBG, HbA1c, TGs, HDL-C, and LDL-C were set as the independent variables, and with or without NAFLD as the dependent variable (Table 3). As shown in Table 3, among total study population, during the 4-year follow-up period from the index date, using the lowest SUA quintiles as reference, the crude HRs of NAFLD (95% CI) were 1.803 (95% CI, 1.453–2.239), 2.418 (95% CI, 1.964–2.978), and 2.864 (95% CI, 2.335–3.513) across the second to the fourth quartile of SUA in model 1 (unadjusted baseline values of variables); the HRs of NAFLD (95% CI) were 1.667 (95% CI, 1.342–2.094), 2.159 (95% CI, 1.729–2.696), and 2.487 (95% CI, 1.986–3.116) across the second to the fourth quartile of SUA in model 2 (model 1 adjusted for age and gender); the HRs of NAFLD (95% CI) were 1.431 (95% CI, 1.123–1.823), 1.610 (95% CI, 1.123–1.823), and 1.666 (95% CI, 1.287–2.157) across the second to the fourth quartile of SUA in model 3 (model 2 further adjusted for other confounders). The sex-specific association analysis between HUA and NAFLD has a similar tendency in females (Table 4, Models 4–6) and males (Table 5, Models 7–9). Notably, HUA was found to be an independent risk factor for NAFLD.
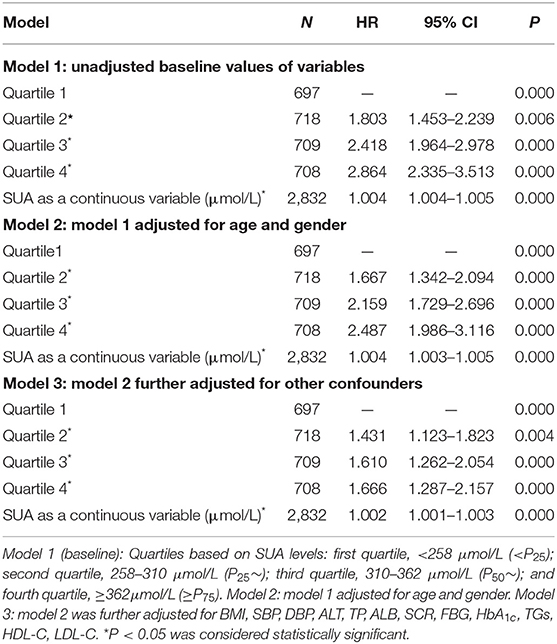
Table 3. The Cox regression analysis of SUA levels for incidence NAFLD during 4 years of follow-up among 2,832 subjects without NAFLD at the entry examination (total).
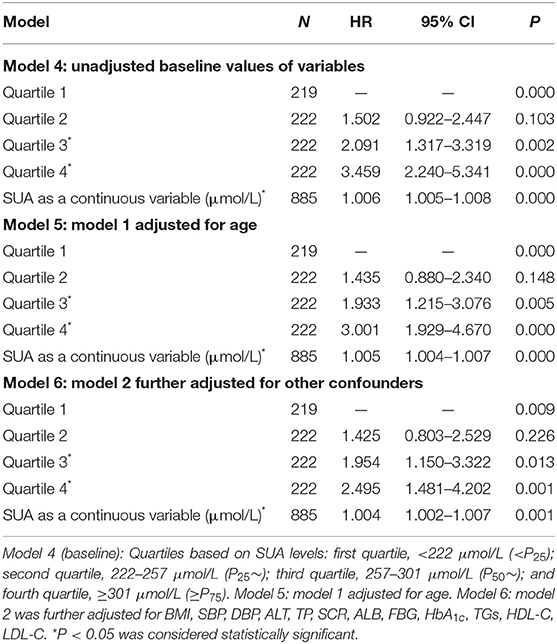
Table 4. The Cox regression analysis of SUA levels for incidence NAFLD during 3 years of follow-up among 885 subjects without NAFLD at the entry examination (females).

Table 5. The Cox regression analysis of incidence NAFLD during 3 years of follow-up among 1,947 subjects without NAFLD at the entry examination (males).
Kaplan–Meier Survival Curves for NAFLD Among SUA Quartiles
As shown in Figure 2, Kaplan–Meier survival curves illustrate the differences in prevalence of NAFLD between different SUA quartiles. Among the total study population (Figure 2A), Kaplan–Meier survival curves revealed that individuals with higher SUA level had an increased risk of NAFLD in comparison to lower SUA level (P = 0.000). Similar results were found among males (Figure 2B) and females (Figure 2C). The log-rank test showed significance for all the SUA quartiles, the first quartile showed the lowest disease hazard for NAFLD, and the fourth quartile showed the highest disease hazard. The log-rank test showed that in the third quartile vs. the fourth quartile in total and males (Figures 2A,B), and the first quartile vs. the second quartile, as well as the second quartile vs. the third quartile in females (Figure 2C), there were no significant differences. However, other quartiles displayed significant difference. The above results showed that there is a dose–effect relationship between hyperuricemia and NAFLD; NAFLD onsets significantly changed with SUA quartiles.
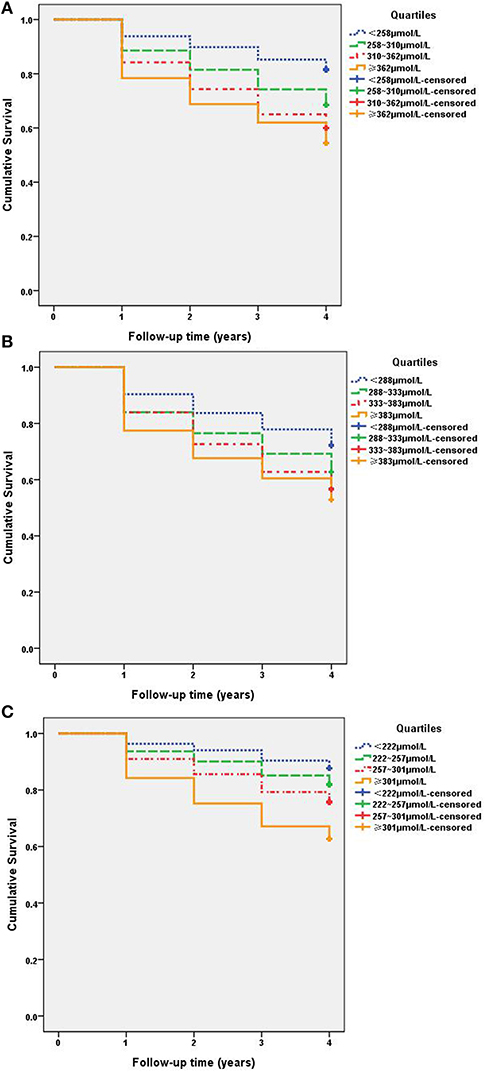
Figure 2. Kaplan–Meier survival curves for NAFLD among SUA quartiles. (A) Total: quartiles based on SUA levels: first quartile, <258 μmol/L (< P25); second quartile, 258–310 μmol/L (P25~); third quartile, 310–362 μmol/L (P50~); and fourth quartile, ≥362 μmol/L (≥P75). All subjects log-rank test P <0.05, < P25 vs. other quartiles. (B) Males: quartiles based on SUA levels: first quartile, <288 μmol/L (< P25); second quartile, 288–333 μmol/L (P25~); third quartile, 333–383 μmol/L (P50~); and fourth quartile, ≥383 μmol/L (≥P75). (C) Females: quartiles based on SUA levels: first quartile, <222 μmol/L (< P25); second quartile, 222–257 μmol/L (P25~); third quartile, 257–301 μmol/L (P50~); and fourth quartile, ≥301 μmol/L (≥P75).
ROC Curve of the SUA Level as a Predictor of NAFLD
Receiver operating characteristic analysis was used and calculated specificity and sensitivity of the prediction. The best cutoff value of SUA level to predict the incidence of NAFLD was ≥288.5 μmol/L, the AUC (95% CI) was 0.637 (0.616–0.658) with a sensitivity of 75.5% and specificity of 46.5% in total, as seen in Figure 3A. The best cutoff value was ≥319.5 μmol/L; the AUC (95% CI) was 0.590 (0.564–0.615) with a sensitivity of 65.8% and specificity of 48.4% in males, as seen in Figure 3B. The best cutoff value was ≥287.5 μmol/L; the AUC (95% CI) was 0.662 (0.619–0.704) with a sensitivity of 51.0% and specificity of 75.6% in females, as seen in Figure 3C.
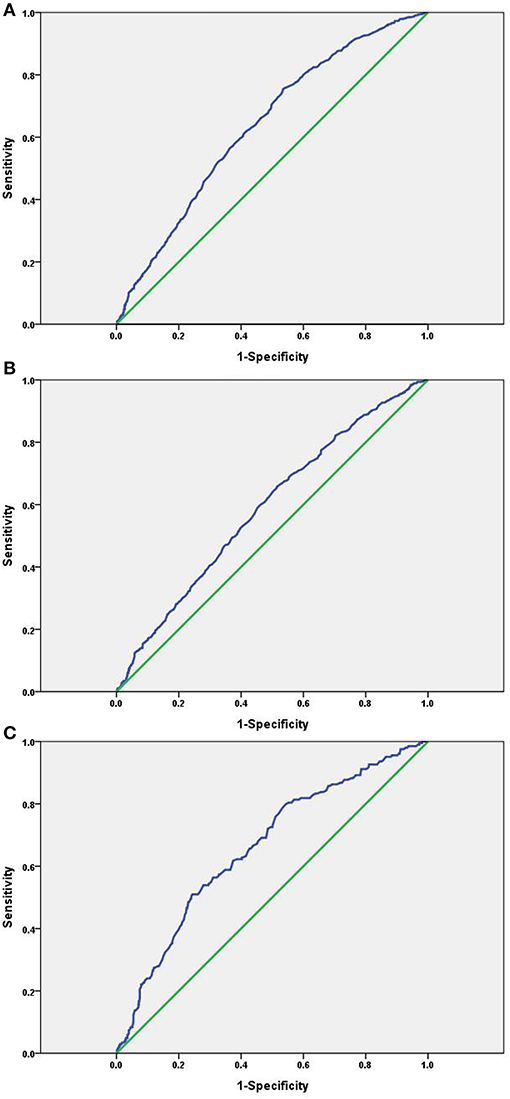
Figure 3. ROC curve of the SUA level as a predictor of NAFLD. (A) Total: AUC (95% CI) was 0.637(0.616–0.658); (B) males: AUC (95% CI) was 0.590 (0.564–0.615); (C) females: AUC (95% CI) was 0.662 (0.619–0.704).
Discussion
Non-alcoholic fatty liver disease has a higher prevalence in the Western world, and which is becoming an emerging health threat in Asia (25). We prospectively followed 2,832 subjects who were free from NAFLD at baseline examination from April 2014 through October 2018. Our results show that SUA level can be used as an independent predictor of NAFLD in a fixed cohort Chinese population.
In cross-sectional and prospective studies, SUA level was a risk factor for NAFLD. In a study including 242 male patients with NAFLD [102 with non-alcoholic steatohepatitis (NASH) and 140 with simple steatosis (SS)], the study found that SUA was associated with early liver damage in patients with NAFLD, and SUA levels were significantly higher in subjects with NASH than those of SS (26). More recently, a cross-sectional and longitudinal population study showed that SUA is related to the occurrence and development of NAFLD. Additionally, the pathogenic effect of SUA levels on fatty liver is more significant in female population than in males (27). In a meta-analysis of 11 studies that were done in various countries, including China, Korea, Japan, India, and United States, they found a significant association between SUA and NAFLD. The risk of NAFLD was increased almost 2-fold in the highest SUA group compared to the lowest group (28). As expected, we performed the Cox regression analysis, and our results showed that the HRs of NAFLD (95% CI) were 1.431 (95% CI, 1.123–1.823), 1.610 (95% CI, 1.262–2.054), and 1.666 (95% CI, 1.287–2.157) across the second to the fourth quartile of SUA vs. the first quartile after adjusting for other confounders. The sex-specific association analysis between HUA and NAFLD has a similar tendency in males and females. Our findings suggest that elevated SUA levels promote the development of NAFLD, and which is consistent with the previous hypothesis that SUA might be an important contributor to the development of NAFLD.
In our studies, the Kaplan–Meier survival curves revealed that individuals with higher SUA level had an increased risk of NAFLD in comparison to lower SUA level (P < 0.001). HUA predicted higher incidences of NAFLD in a dose-dependent manner; NAFLD onsets significantly differed across SUA quartiles. Our results are consistent with other studies conducted on Chinese population. In study of two distinct ethnic groups, Uyghur and Han in northwest China, the major findings were that SUA concentrations and NAFLD were correlated in both populations, but Uyghurs had a higher prevalence of NAFLD. This finding may indicate that some related factors such as lifestyle, dietary habits, and genetic susceptibility play a more important role in the pathogenesis of NAFLD in Uyghurs than in Hans (29). In a Chinese cross-sectional study including 8,925 subjects, the results also demonstrated the effect of SUA on NAFLD (30). In the Cardiometabolic Risk in Chinese study, they found strong positive associations between elevated SUA levels and NAFLD risk in the non-hypertensive Chinese adults, independent of other metabolic changes (31). Another prospective study that followed 6,890 men and women found a positive correlation between SUA and NAFLD (32).
The pathogenesis of NAFLD is very complex, and its specific causes are not fully explained. The occurrence and development of NAFLD are the result of genetic and environmental factors. Several major hexose–uric acid transporters, including SLC2A9 and ABCG2, are highly expressed in the liver and kidney (33, 34). In our previous studies, we found that the plasma uric acid level was dynamically coupled with the HbA1c level, depending on different stages of normal, impaired glucose tolerance, and diabetes. It seems uric acid is a regulator, or at least regulated, by the plasma glucose level (35). The first pathogenic mechanism was metabolic disturbances. Oxidative stress and lipid peroxidation were the main causes of fatty liver (36), whereas SUA was the main antioxidant in vivo, which was significantly associated with the degree of steatosis and the greater odds of advanced lobular inflammation of NAFLD (37). Another pathogenic mechanism was IR. Hyperuricemia is a component of MetS; the increase in SUA level could promote oxidative stress and reactive oxygen species level. Because of the above reasons, it would cause IR and abnormal blood glucose metabolism in the body and then cause the occurrence of NAFLD (38). Lanaspa et al. (39) found that uric acid can directly stimulate hepatic fat accumulation. This is a good supplement to the pathogenesis of NAFLD caused by SUA.
Conclusion
In summary, we conducted a follow-up study in the Chinese population, and the results showed that after excluding other confounding factors there was a causal relationship between SUA level and NAFLD. Serum uric acid can be used as an independent predictor of NAFLD. There was a dose–effect relationship between hyperuricemia and NAFLD; NAFLD onsets significantly changed with SUA quartiles. Further studies on the mechanism of NAFLD caused by SUA will not only broaden our comprehension of the NAFLD mechanisms, but also assist in the eventual development of new prevention and treatment strategies for the NAFLD.
Data Availability Statement
The datasets generated for this study are available on request to the corresponding author.
Ethics Statement
The studies involving human participants were reviewed and approved by Human Ethics Committee of Tianjin Medical University. The patients/participants provided their written informed consent to participate in this study.
Author Contributions
W-DL conceived and designed the study. W-DL and FW wrote the manuscript. JM, SF, FW, CC, KZ, LC, JL, and XW collected subjects and clinical data. FW and JL analyzed the data. All authors have reviewed the manuscript.
Funding
This work was supported in part by National Key R&D Program of China (2017YFC1001900); grant 2016M601273 from the China Postdoctoral Science Foundation to FW; grant 81070576 from the National Natural Science Foundation of China; and grant 12JCZDJC24700 from Natural Science Foundation of Tianjin Municipal Science and Technology Commission to WD-L.
Conflict of Interest
The authors declare that the research was conducted in the absence of any commercial or financial relationships that could be construed as a potential conflict of interest.
Acknowledgments
We thank all subjects who took part in this study.
References
1. Amarapurkar DN, Hashimoto E, Lesmana LA, Sollano JD, Chen PJ, Goh KL, et al. How common is non-alcoholic fatty liver disease in the Asia-Pacific region and are there local differences? J Gastroenterol Hepatol. (2007) 22:788–93. doi: 10.1111/j.1440-1746.2007.05042.x
2. Fan JG, Saibara T, Chitturi S, Kim BI, Sung JJ, Chutaputti A, et al. What are the risk factors and settings for non-alcoholic fatty liver disease in Asia-Pacific? J Gastroenterol Hepatol. (2007) 22:794–800. doi: 10.1111/j.1440-1746.2007.04952.x
3. Bedogni G, Nobili V, Tiribelli C. Epidemiology of fatty liver: an update. World J Gastroenterol. (2014) 20:9050–4. doi: 10.3748/wjg.v20.i27.9050
4. Fung J, Lee CK, Chan M, Seto WK, Lai CL, Yuen MF, et al. High prevalence of non-alcoholic fatty liver disease in the Chinese - results from the Hong Kong liver health census. Liver Int. (2015) 35:542–9. doi: 10.1111/liv.12619
5. Hu X, Huang Y, Bao Z, Wang Y, Shi D, Liu F, et al. Prevalence and factors associated with nonalcoholic fatty liver disease in Shanghai work-units. BMC Gastroenterol. (2012) 12:123. doi: 10.1186/1471-230X-12-123
6. Zhang X, Wan Y, Zhang S, Lu L, Chen Z, Liu H, et al. Non-alcoholic fatty liver disease prevalence in urban school-aged children and adolescents from the Yangtze River delta region: a cross-sectional study. Asia Pac J Clin Nutr. (2015) 24:281–8. doi: 10.6133/apjcn.2015.24.2.13
7. Liu Y, Liu C, Shi X, Lin M, Yan B, Zeng X, et al. Correlations of non-alcoholic fatty liver disease and serum uric acid with subclinical atherosclerosis in obese Chinese adults. J Diabetes. (2017) 9:586–95. doi: 10.1111/1753-0407.12441
8. Song P, Yu J, Wang M, Chang X, Wang J, An L. Prevalence and correlates of suspected nonalcoholic fatty liver disease in Chinese children. Int J Environ Res Public Health. (2017) 14:E465. doi: 10.3390/ijerph14050465
9. Wu AH, Gladden JD, Ahmed M, Ahmed A, Filippatos G. Relation of serum uric acid to cardiovascular disease. Int J Cardiol. (2016) 213:4–7. doi: 10.1016/jijcard.2015.08.110
10. Li C, Hsieh MC, Chang SJ. Metabolic syndrome, diabetes, and hyperuricemia. Curr Opin Rheumatol. (2013) 25:210–6. doi: 10.1097/BOR.0b013e32835d951e
11. Ye X, Cao Y, Gao F, Yang Q, Zhang Q, Fu X, et al. Elevated serum uric acid levels are independent risk factors for diabetic foot ulcer in female Chinese patients with type 2 diabetes. J Diabetes. (2014) 6:42–7. doi: 10.1111/1753-0407.12079
12. Choi H, Kim HC, Song BM, Park JH, Lee JM, Yoon DL, et al. Serum uric acid concentration and metabolic syndrome among elderly Koreans: the Korean Urban Rural Elderly (KURE) study. Arch Gerontol Geriatr. (2016) 64:51–8. doi: 10.1016/j.archger.2016.01.005
13. Yuan H, Yu C, Li X, Sun L, Zhu X, Zhao C, et al. Serum uric acid levels and risk of Metabolic Syndrome: A dose-response meta-analysis of prospective studies. J Clin Endocrinol Metab. (2015) 100:4198–207. doi: 10.1210/jc2015-2527
14. Richette P, Perez-Ruiz F. Serum uric acid and metabolic risk. Curr Med Res Opin. (2013) 29:9–15. doi: 10.1185/03007995.2013.790801
15. Zhou Y, Wei F, Fan Y. High serum uric acid and risk of nonalcoholic fatty liver disease: a systematic review and meta-analysis. Clin Biochem. (2016) 49:636–42. doi: 10.1016/j.clinbiochem.2015.12.010
16. Shih MH, Lazo M, Liu SH, Bonekamp S, Hernaez R, Clark JM. Association between serum uric acid and nonalcoholic fatty liver disease in the US population. J Formos Med Assoc. (2015) 114:314–20. doi: 10.1016/j.jfma.2012.11.014
17. Baba T, Amasaki Y, Soda M, Hida A, Imaizumi M, Ichimaru S, et al. Fatty liver and uric acid levels predict incident coronary heart disease but not stroke among atomic bomb survivors in Nagasaki. Hypertens Res. (2007) 30:823–9. doi: 10.1291/hypres.30.823
18. Cardoso AS, Gonzaga NC, Medeiros CC, Carvalho DF. Association of uric acid levels with components of metabolic syndrome and non-alcoholic fatty liver disease in overweight or obese children and adolescents. J Pediatr. (2013) 89:412–8. doi: 10.1016/j.jped.2012.12.008
19. Zhou Z, Song K, Qiu J, Wang Y, Liu C, Zhou H, et al. Associations between serum uric acid and the remission of non-alcoholic fatty liver disease in Chinese males. PLoS ONE. (2016) 11:e0166072. doi: 10.1371/journal.pone.0166072
20. Fan N, Zhang L, Xia Z, Peng L, Wang Y, Peng Y. Sex-specific association between serum uric acid and nonalcoholic fatty liver disease in Type 2 diabetic patients. J Diabetes Res. (2016) 2016:3805372. doi: 10.1155/2016/3805372
21. Wang Y, Yan S, Li C, Zhao S, Lv J, Wang F, et al. Risk factors for gout developed from hyperuricemia in China: a five-year prospective cohort study. Rheumatol Int. (2013) 33:705–10. doi: 10.1007/s00296-012-2439-8
22. Levey AS, Stevens LA, Schmid CH, Zhang YL, Castro AF 3rd, Feldman HI, et al. A new equation to estimate glomerular filtration rate. Ann Intern Med. (2009) 150:604–12. doi: 10.7326/0003-4819-150-9-200905050-00006
23. Zager E, Fletcher DJ, Goggs R. Evaluation of the association between strong ion acid-base disturbances and mortality in dogs: a retrospective study. Vet Med Sci. (2018) 4:206–17. doi: 10.1002/vms3.101
24. Youden WJ. Index for rating diagnostic tests. Cancer. (1950) 3:32–5. doi: 10.1002/1097-0142(1950)3:1<32::aid-cncr2820030106>3.0.co;2-3
25. Kim SS, Cho HJ, Kim HJ, Kang DR, Berry JR, Kim JH, et al. Non-alcoholic fatty liver disease as a sentinel marker for the development of diabetes mellitus in non-obese subjects. Dig Liver Dis. (2018) 50:370–7. doi: 10.1016/j.dld.2017.12.018
26. Sertoglu E, Ercin CN, Celebi G, Gurel H, Kayadibi H, Genc H, et al. The relationship of serum uric acid with non-alcoholic fatty liver disease. Clin Biochem. (2014) 47:383–8. doi: 10.1016/j.clinbiochem.2014.01.029
27. Wu SJ, Zhu GQ, Ye BZ, Kong FQ, Zheng ZX, Zou H, et al. Association between sex-specific serum uric acid and non-alcoholic fatty liver disease in Chinese adults: a large population-based study. Medicine. (2015) 94:e802. doi: 10.1097/MD.0000000000000802
28. Darmawan G, Hamijoyo L, Hasan. Association between serum uric acid and non-alcoholic fatty liver disease: a meta-analysis. Acta Med Indones. (2017) 49:136–47. doi: 10.7717/peerj.7563
29. Cai W, Wu X, Zhang B, Miao L, Sun YP, Zou Y, et al. Serum uric acid levels and non-alcoholic fatty liver disease in Uyghur and Han ethnic groups in northwestern China. Arq Bras Endocrinol Metabol. (2013) 57:617–22. doi: 10.1590/s0004-27302013000800006
30. Li Y, Xu C, Yu C, Xu L, Miao M. Association of serum uric acid level with non-alcoholic fatty liver disease: a cross-sectional study. J Hepatol. (2009) 50:1029–34. doi: 10.1016/j.jhep.2008.11.021
31. Liang J, Pei Y, Gong Y, Liu XK, Dou LJ, Zou CY, et al. Serum uric acid and non-alcoholic fatty liver disease in non-hypertensive Chinese adults: the Cardiometabolic Risk in Chinese (CRC) study. Eur Rev Med Pharmacol Sci. (2015) 19:305–11.
32. Xu C, Yu C, Xu L, Miao M, Li Y. High serum uric acid increases the risk for nonalcoholic Fatty liver disease: a prospective observational study. PLoS ONE. (2010) 5:e11578. doi: 10.1371/journal.pone.0011578
33. Han X, Gui L, Liu B, Wang J, Li Y, Dai X, et al. Associations of the uric acid related genetic variants in SLC2A9 and ABCG2 loci with coronary heart disease risk. BMC Genet. (2015) 16:4. doi: 10.1186/s12863-015-0162-7
34. Vlaming ML, Lagas JS, Schinkel AH. Physiological and pharmacologi cal roles of ABCG2 (BCRP): recent findings in Abcg2 knockout mice. Adv Drug Deliv Rev. (2009) 61:14–25. doi: 10.1016/j.addr.2008.08.007
35. Wei F, Chang B, Yang X, Wang Y, Chen L, Li W. Serum uric acid levels were dynamically coupled with hemoglobin A1c in the development of type 2 diabetes. Sci Rep. (2016) 6:28549. doi: 10.1038/srep28549(2016)
36. Cai W, Song JM, Zhang B, Sun YP, Yao H, Zhang YX. The prevalence of nonalcoholic fatty liver disease and relationship with serum uric acid level in Uyghur population. Sci. World J. (2014) 2014:393628. doi: 10.1155/2014/393628
37. Huang Q, Yu J, Zhang X, Liu S, Ge Y. Association of the serum uric acid level with liver histology in biopsy-proven non-alcoholic fatty liver disease. Biomed Rep. (2016) 5:188–192. doi: 10.3892/br.2016.698
38. Zhu Y, Hu Y, Huang T, Zhang Y1, Li Z, Luo C, et al. High uric acid directly inhibits insulin signalling and induces insulin resistance. Biochem Biophys Res Commun. (2014) 447:707–14. doi: 10.1016/j.bbrc.2014.04.080
39. Lanaspa MA, Sanchez-Lozada LG, Choi YJ, Cicerchi C, Kanbay M, Roncal-Jimenez CA, et al. Uric acid induces hepatic steatosis by generation of mitochondrial oxidative stress: potential role in fructose-dependent and -independent fatty liver. J Biol Chem. (2012) 287:40732–44. doi: 10.1074/jbc.M112.399899
Keywords: non-alcoholic fatty liver disease, hyperuricemia, serum uric acid, risk factor, cohort study
Citation: Wei F, Li J, Chen C, Zhang K, Cao L, Wang X, Ma J, Feng S and Li W-D (2020) Higher Serum Uric Acid Level Predicts Non-alcoholic Fatty Liver Disease: A 4-Year Prospective Cohort Study. Front. Endocrinol. 11:179. doi: 10.3389/fendo.2020.00179
Received: 09 December 2019; Accepted: 12 March 2020;
Published: 09 April 2020.
Edited by:
James Harper, Sam Houston State University, United StatesReviewed by:
Giuseppe Pasqualetti, University of Pisa, ItalyLuis Enrique Gomez-Quiroz, Autonomous Metropolitan University, Mexico
Copyright © 2020 Wei, Li, Chen, Zhang, Cao, Wang, Ma, Feng and Li. This is an open-access article distributed under the terms of the Creative Commons Attribution License (CC BY). The use, distribution or reproduction in other forums is permitted, provided the original author(s) and the copyright owner(s) are credited and that the original publication in this journal is cited, in accordance with accepted academic practice. No use, distribution or reproduction is permitted which does not comply with these terms.
*Correspondence: Ximo Wang, wangximo@126.com; Jun Ma, junma@tmu.edu.cn; Shuzhi Feng, shuzhifeng@hotmail.com; Wei-Dong Li, liweidong98@tmu.edu.cn
†These authors have contributed equally to this work