 Wei Li1†Kuan Sun1†
 Zhongying Ren1†Chengxiang Song2Xiaoyu Pei1Yangai Liu1Zhenyu Wang1Kunlun He1Fei Zhang1Xiaojian Zhou1Xiongfeng Ma1*
 Daigang Yang1*
- 1State Key Laboratory of Cotton Biology, Institute of Cotton Research of Chinese Academy of Agricultural Sciences, Anyang, China
- 2College of Agriculture, Yangtze University, Jingzhou, China
Sucrose transporters (SUTs) play key roles in allocating the translocation of assimilates from source to sink tissues. Although the characteristics and biological roles of SUTs have been intensively investigated in higher plants, this gene family has not been functionally characterized in cotton. In this study, we performed a comprehensive analysis of SUT genes in the tetraploid cotton Gossypium hirsutum. A total of 18 G. hirsutum SUT genes were identified and classified into three groups based on their evolutionary relationships. Up to eight SUT genes in G. hirsutum were placed in the dicot-specific SUT1 group, while four and six SUT genes were, respectively, clustered into SUT4 and SUT2 groups together with members from both dicot and monocot species. The G. hirsutum SUT genes within the same group displayed similar exon/intron characteristics, and homologous genes in G. hirsutum At and Dt subgenomes, G. arboreum, and G. raimondii exhibited one-to-one relationships. Additionally, the duplicated genes in the diploid and polyploid cotton species have evolved through purifying selection, suggesting the strong conservation of SUT loci in these species. Expression analysis in different tissues indicated that SUT genes might play significant roles in cotton fiber elongation. Moreover, analyses of cis-acting regulatory elements in promoter regions and expression profiling under different abiotic stress and exogenous phytohormone treatments implied that SUT genes, especially GhSUT6A/D, might participate in plant responses to diverse abiotic stresses and phytohormones. Our findings provide valuable information for future studies on the evolution and function of SUT genes in cotton.
Introduction
Sucrose, the major form of sugar transported in plants, is allocated to various sink tissues to support growth and storage. Sucrose transporters (SUTs also called SUCs) play important mediating roles in the active transport of sucrose across the plasma membrane from source tissue to some sink cells Thomasl and Davidm (2010). Plant SUTs belong to the major facilitator superfamily (MFS), which is characterized by the presence of 12 predicted transmembrane-spanning domains with N- and C- termini in the cytoplasm (Lalonde et al., 2004; Sun et al., 2010). The first identified plant SUT gene, SoSUT1, was isolated from spinach by yeast functional complementation (Riesmeier et al., 1992). A large number of SUT proteins have subsequently been identified in many plant species, including monocots such as rice (Aoki et al., 2003), maize (Usha, 2015), sorghum (Milne et al., 2013), and hexaploid wheat (Deol et al., 2013), and dicots such as Arabidopsis (Weise et al., 2000), Populus (Hackel et al., 2006; Payyavula et al., 2011), cacao (Li et al., 2014b), and pear (Zhang et al., 2013). These findings have revealed that SUT is a small gene family usually comprising three to nine members per species.
On the basis of phylogenetic and structural analyses, plant SUTs have been divided into five subgroups: SUT1 (dicot specific), SUT3 and SUT5 (monocot specific), and SUT2 and SUT4 (both monocots and dicots). SUT family genes are not only involved in sucrose transport, but also play essential roles in pollen germination, fruit ripening, and ethylene biosynthesis in many species (Sivitz et al., 2008; Srivastava et al., 2009; Payyavula et al., 2011; Chincinska et al., 2013). For example, the AtSUC1 gene in Arabidopsis thaliana is predominantly expressed in pollen and facilitates anthocyanin accumulation (Sivitz et al., 2008). Another Arabidopsis gene, AtSUC5, has specific expression in seeds (Baud et al., 2005), and the mutant atsuc9 functions to promote the floral transition by regulating the uptake of sucrose (Sivitz et al., 2007). In rice, disruption of the expression of the OsSUT1 gene impairs pollen function (Hirose et al., 2010). The OsSUT2 gene is significantly expressed in germinating embryos of rice seeds (Siao et al., 2011; Eom et al., 2016). In maize, a SUT1 mutant displays growth retardation and hindered tassel development (Usha, 2015). In Populus, PtaSUT4-RNA interference (RNAi) plants have higher shoot water contents and delayed wilting relative to wild-type plants (Frost et al., 2012). In hexaploid wheat, the TaSUT2 gene is expressed in the veins of developing seeds and the subepidermal mesophyll cells of leaf blades (Deol et al., 2013). In transgenic tomato, independent inhibition of the expressions of LeSUT1 and LeSUT2 affects fruit and seed development (Hackel et al., 2006).
The genus Gossypium (cotton) consists of 50 species, of which 45 are diploid (2n = 2x = 26) and five are tetraploid (2n = 4x = 52) species. The genomes of diploid cotton species are labeled as followes: A, B, C, D, E, F, G, and K (Wendel and Cronn, 2002). The tetraploid cotton Gossypium hirsutum (upland cotton), the most extensively cultivated cotton species, is one of the most economically important crops in the world and a naturally renewable fiber source for the textile industry (Ulloa et al., 2005; Pang et al., 2010). Thus far, however, the functions of SUT genes in cotton are largely unknown, especially those in response to abiotic and biotic stresses. The recent completion of genome sequencing of G. hirsutum provides an opportunity to systematically analyze the SUT gene family in cotton.
In this study, we carried out genome-wide identification of the SUT gene family in G. hirsutum and analyzed phylogenetic relationships, gene structures, chromosomal locations, and collinearity. We then investigated putative cis-elements related to stress responses in the promoters of G. hirsutum SUT genes. Finally, we used real-time quantitative PCR (qRT-PCR) to profile SUT gene expressions in different tissues and under various abiotic stress conditions, including cold, heat, drought, and salt, and under hormonal stresses, including auxin (IAA), gibberellin (GA), and salicylic acid (SA). Our findings provide valuable insights into the evolution, expansion, tissues-specific expression, and stress responses of SUT genes in cotton.
Materials and Methods
Identification and Sequence Analysis of SUT Genes
Genomic and protein sequences of G. arboreum, G. raimondii, and G. hirsutum were downloaded from https://www.cottongen.org. We also downloaded protein sequences for the following species: rice (v7.01), sorghum (v3.1.12), Brachypodium distachyon (v3.13), cacao (v2.04), grape (12X5), and tomato (v3.26). Amino acid sequences of A. thaliana SUTs were acquired from the TAIR 10 database7 and used as queries to search the G. hirsutum genome database with the BlastP program. All candidate G. hirsutum SUT sequences were then filtered to confirm the presence of the MFS domain using Pfam database analyses (E-value cut-off of 1.08). To verify sequence accuracy, the putative SUT genes were subsequently aligned, and those with inconsistent alignments were cloned to determine the complete sequences. SUT genes in rice, maize, sorghum, B. distachyon, cacao, grape, tomato, G. arboreum, and G. raimondii were analyzed as described above for G. hirsutum. Finally, the molecular weight (MW) and isoelectric point (pI) of each deduced G. hirsutum SUT proteins was predicted using DNAMAN v9.0 software.
Multiple Sequence Alignments and Phylogenetic Analysis
The complete protein sequences of SUTs were comprehensively aligned using MegAlign 7.1.0 with default settings (Clewley and Arnold, 1997). Phylogenetic analysis of the full-length SUT protein sequences of A. thaliana, rice, sorghum, B. distachyon, cacao, grape, tomato, G. arboreum, G. raimondii, and G. hirsutum was carried out using neighbor joining as implemented in MEGA (v7.0) (Tokyo Metropolitan University, Tokyo, Japan). A bootstrap analysis was performed with 1,000 iterations.
Gene Structure, Chromosomal Localization, and Gene Duplication Analysis
The exon/intron organizations of G. hirsutum SUT genes were obtained by comparing their CDS sequences and corresponding genomic sequences using the GSDS server (Guo et al., 2007).
SUT gene loci were extracted from the genome annotation gff3 file. Orthologous and paralogous groups of the SUT gene family among the three Gossypium species were identified on the basis of phylogenetic trees and sequence alignments (Wang et al., 2014; Cui et al., 2017). To identify segmental duplications in diploid and polyploid cotton species, all SUT protein sequences were queried against a local database using the BlastP program and analyzed with MCScanX9 (Wang et al., 2013). Finally, the resulting collinearity map was plotted using Circos (Krzywinski et al., 2009).
Calculation of Ka/Ks Values of Duplicated Genes
The gene coding sequences from segmentally duplicated pairs and orthologous pairs were primarily aligned using paraAT2.0 (Zhang et al., 2012); thereafter, the aligned sequences were employed to estimate non-synonymous (Ka) and synonymous (Ks) substitution rates with KaKs_Calculator2.0 (Zhang et al., 2006). The calculated Ka/Ks ratios were then analyzed to explore the selection pressure on each duplicated gene pair. Generally, a Ka/Ks ratio greater than, equal to, or less than 1 indicates positive (diversifying) selection, neutral evolution, or purifying (negative) selection, respectively. The divergence time t of each gene pair was subsequently estimated using the formula t = Ks/2λ, with λ, the neutral substitution rate, set to 2.6 × 10⁻⁹ (Senchina et al., 2003; Zhang et al., 2015).
Plant Materials and Stress and Hormone Treatments
Gossypium hirsutum cultivar TM-1 was used in this study. After germination on wet filter paper for 3 days at 28°C, cotton seedlings were transferred to liquid medium containing nutrients and grown in a plant growth chamber under a 16-h light/8-h dark cycle for 2 weeks. Three-leaf-stage seedlings were subjected to one of several different treatments. To explore response to temperature stress, seedlings were incubated at 4 and 38°C in a lighted growth chamber, respectively. For drought and salt treatments, the roots of cotton seedlings were submerged in a solution containing 20% PEG 6000 and 150 mM NaCl. The leaves of treated plants were harvested at 0, 1, 3, 6, and 12 h. For GA, SA, and IAA treatments, seedlings were irrigated with 100 μM GA, SA, or IAA, respectively, and their roots were sampled at 0, 0.5, 1, 3, and 5 h. All harvested samples were immediately frozen in liquid nitrogen and kept at -80°C for total RNA isolation.
RNA Extraction and qRT-PCR Analysis
A plant RNA purification kit (Tiangen, Beijing, China) was used to extract RNA from different organs and stress-treated samples. DNase I was then used to remove any genomic DNA contamination from the extracted RNA. The RNA concentration in each sample was measured by 1.5% gel electrophoresis and on a Nanodrop2000 nucleic acid analyzer. For each sample, the first cDNA strand was synthesized from 1 μg total RNA using a PrimeScript RT reagent kit (Takara, Dalian, China). The cDNA was diluted fivefold for subsequent experiments. Homologous gene-specific primer pairs for real-time PCR were designed using Primer-BLAST10 and are listed in Supplementary Table S1. The G. hirsutum Histone3 gene, GhHis3, was used as an internal control. Transcript levels were determined by qRT-PCR using a LightCycler480 96 system (Roche, Mannheim, Germany) and SYBR Premix Ex Taq (2 × ) (Takara). PCR amplification parameters were as follows: 95°C for 30 s, followed by 40 cycles of 95°C for 5 s, 60°C for 1 min, and 72°C for 10 s, with a final step of 50°C for 30 s. The gene expression data were calculated using the 2-ΔΔCt method (Bustin and Mueller, 2005). Finally, the data were plotted with Origin 9 software.
Results
Identification of SUT Genes in G. hirsutum
To globally identify members of the SUT gene family in cotton, we performed BlastP searches of nine Arabidopsis SUT proteins against the G. hirsutum genome database. As a result, 18 deduced SUT genes were identified in upland cotton. Following multiple sequence alignment, the sequences of two candidate genes were cloned and then manually edited. All putative SUTs were further verified using InterProScan to confirm the existence of the highly conserved MFS domain, thereby confirming the presence of 18 typical SUT genes in the entire genome of G. hirsutum. For comparative purposes, nine SUT genes each were also identified in the genomes of two diploid cotton species, G. raimondii and G. arboreum using the same methods. SUTs in G. raimondii were named GrSUT1–GrSUT9 according to their genomic locations and SUT genes in G. arboreum were then assigned names based on their homologs in G. raimondii (Supplementary Table S2). Finally, SUT genes in G. hirsutum were given names corresponding to their orthologs in G. raimondii and G. arboreum, with suffixes D and A appended after each gene names to, respectively, indicate the Dt and At subgenomes. Characteristics of the identified G. hirsutum SUT genes, including gene name, ID, protein length, MW, pI, and chromosomal location, are detailed in Table 1.
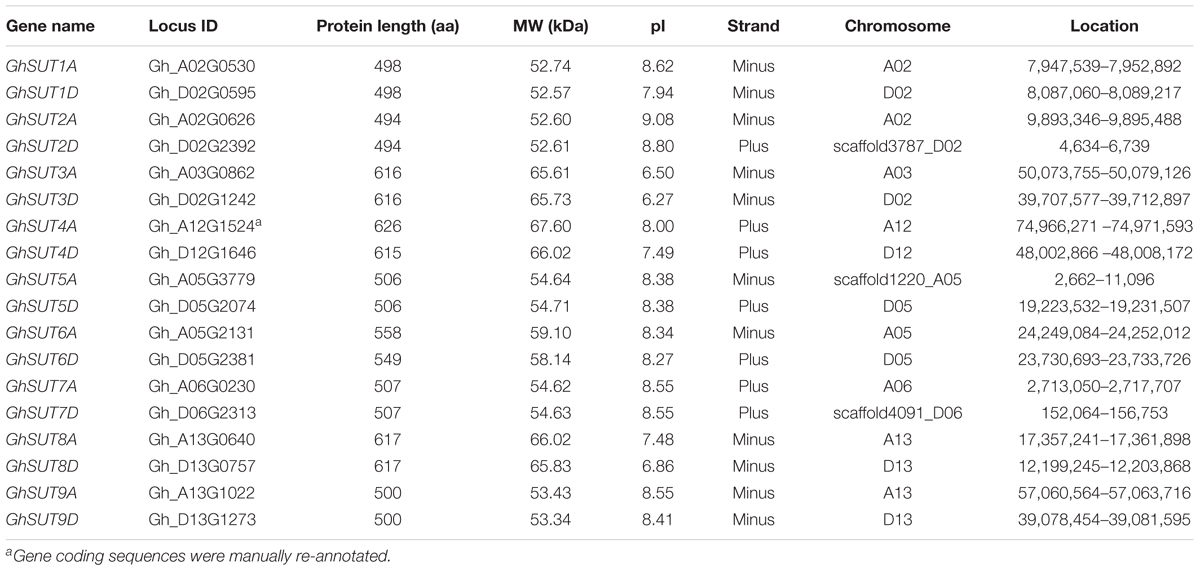
TABLE 1. Characteristics of G. hirsutum SUT genes.
Sequence Alignment and Phylogenetic Analysis of SUT Genes in G. hirsutum
To explore the properties of SUT proteins, we aligned the amino acid sequences of the 18 G. hirsutum SUT proteins. As revealed by the multiple sequence alignment, all 18 contained 12 transmembrane helix domains. Moreover, the SUTs had consensus sequences that were highly conserved, including the histidine residue and other motifs in the extra cellular loop (Supplementary Figure S1). The conserved histidine residue is involved in sucrose binding during the transport process. A dileucine motif (LRQLX) was observed in the cytoplasmic N-terminus of proteins in the SUT4 group (GhSUT5A, GhSUT5D, GhSUT7A, and GhSUT7D).
To systematically infer evolutionary relationships of SUT genes between G. hirsutum and other plant species, the full-length sequences of SUT genes in three Gossypium species and other representative plants, including three monocot and four dicot species, were used to generate a phylogenetic tree. In the resulting tree (Figure 1), all 73 identified SUT proteins were divided into five classes (SUT1, SUT2, SUT3, SUT4, and SUT5). Among the five groups, SUT1 genes were specific to dicotyledonous species, while SUT3 and SUT5 genes were restricted to monocots. SUT2 and SUT4 included both dicots and monocots. Notably, the SUT gene family comprised two distinct clades in the phylogenetic tree, with SUT1 and SUT4 in one clade and the other three groups in another, thus indicating that two ancestral SUTs were present in both dicots and monocots.
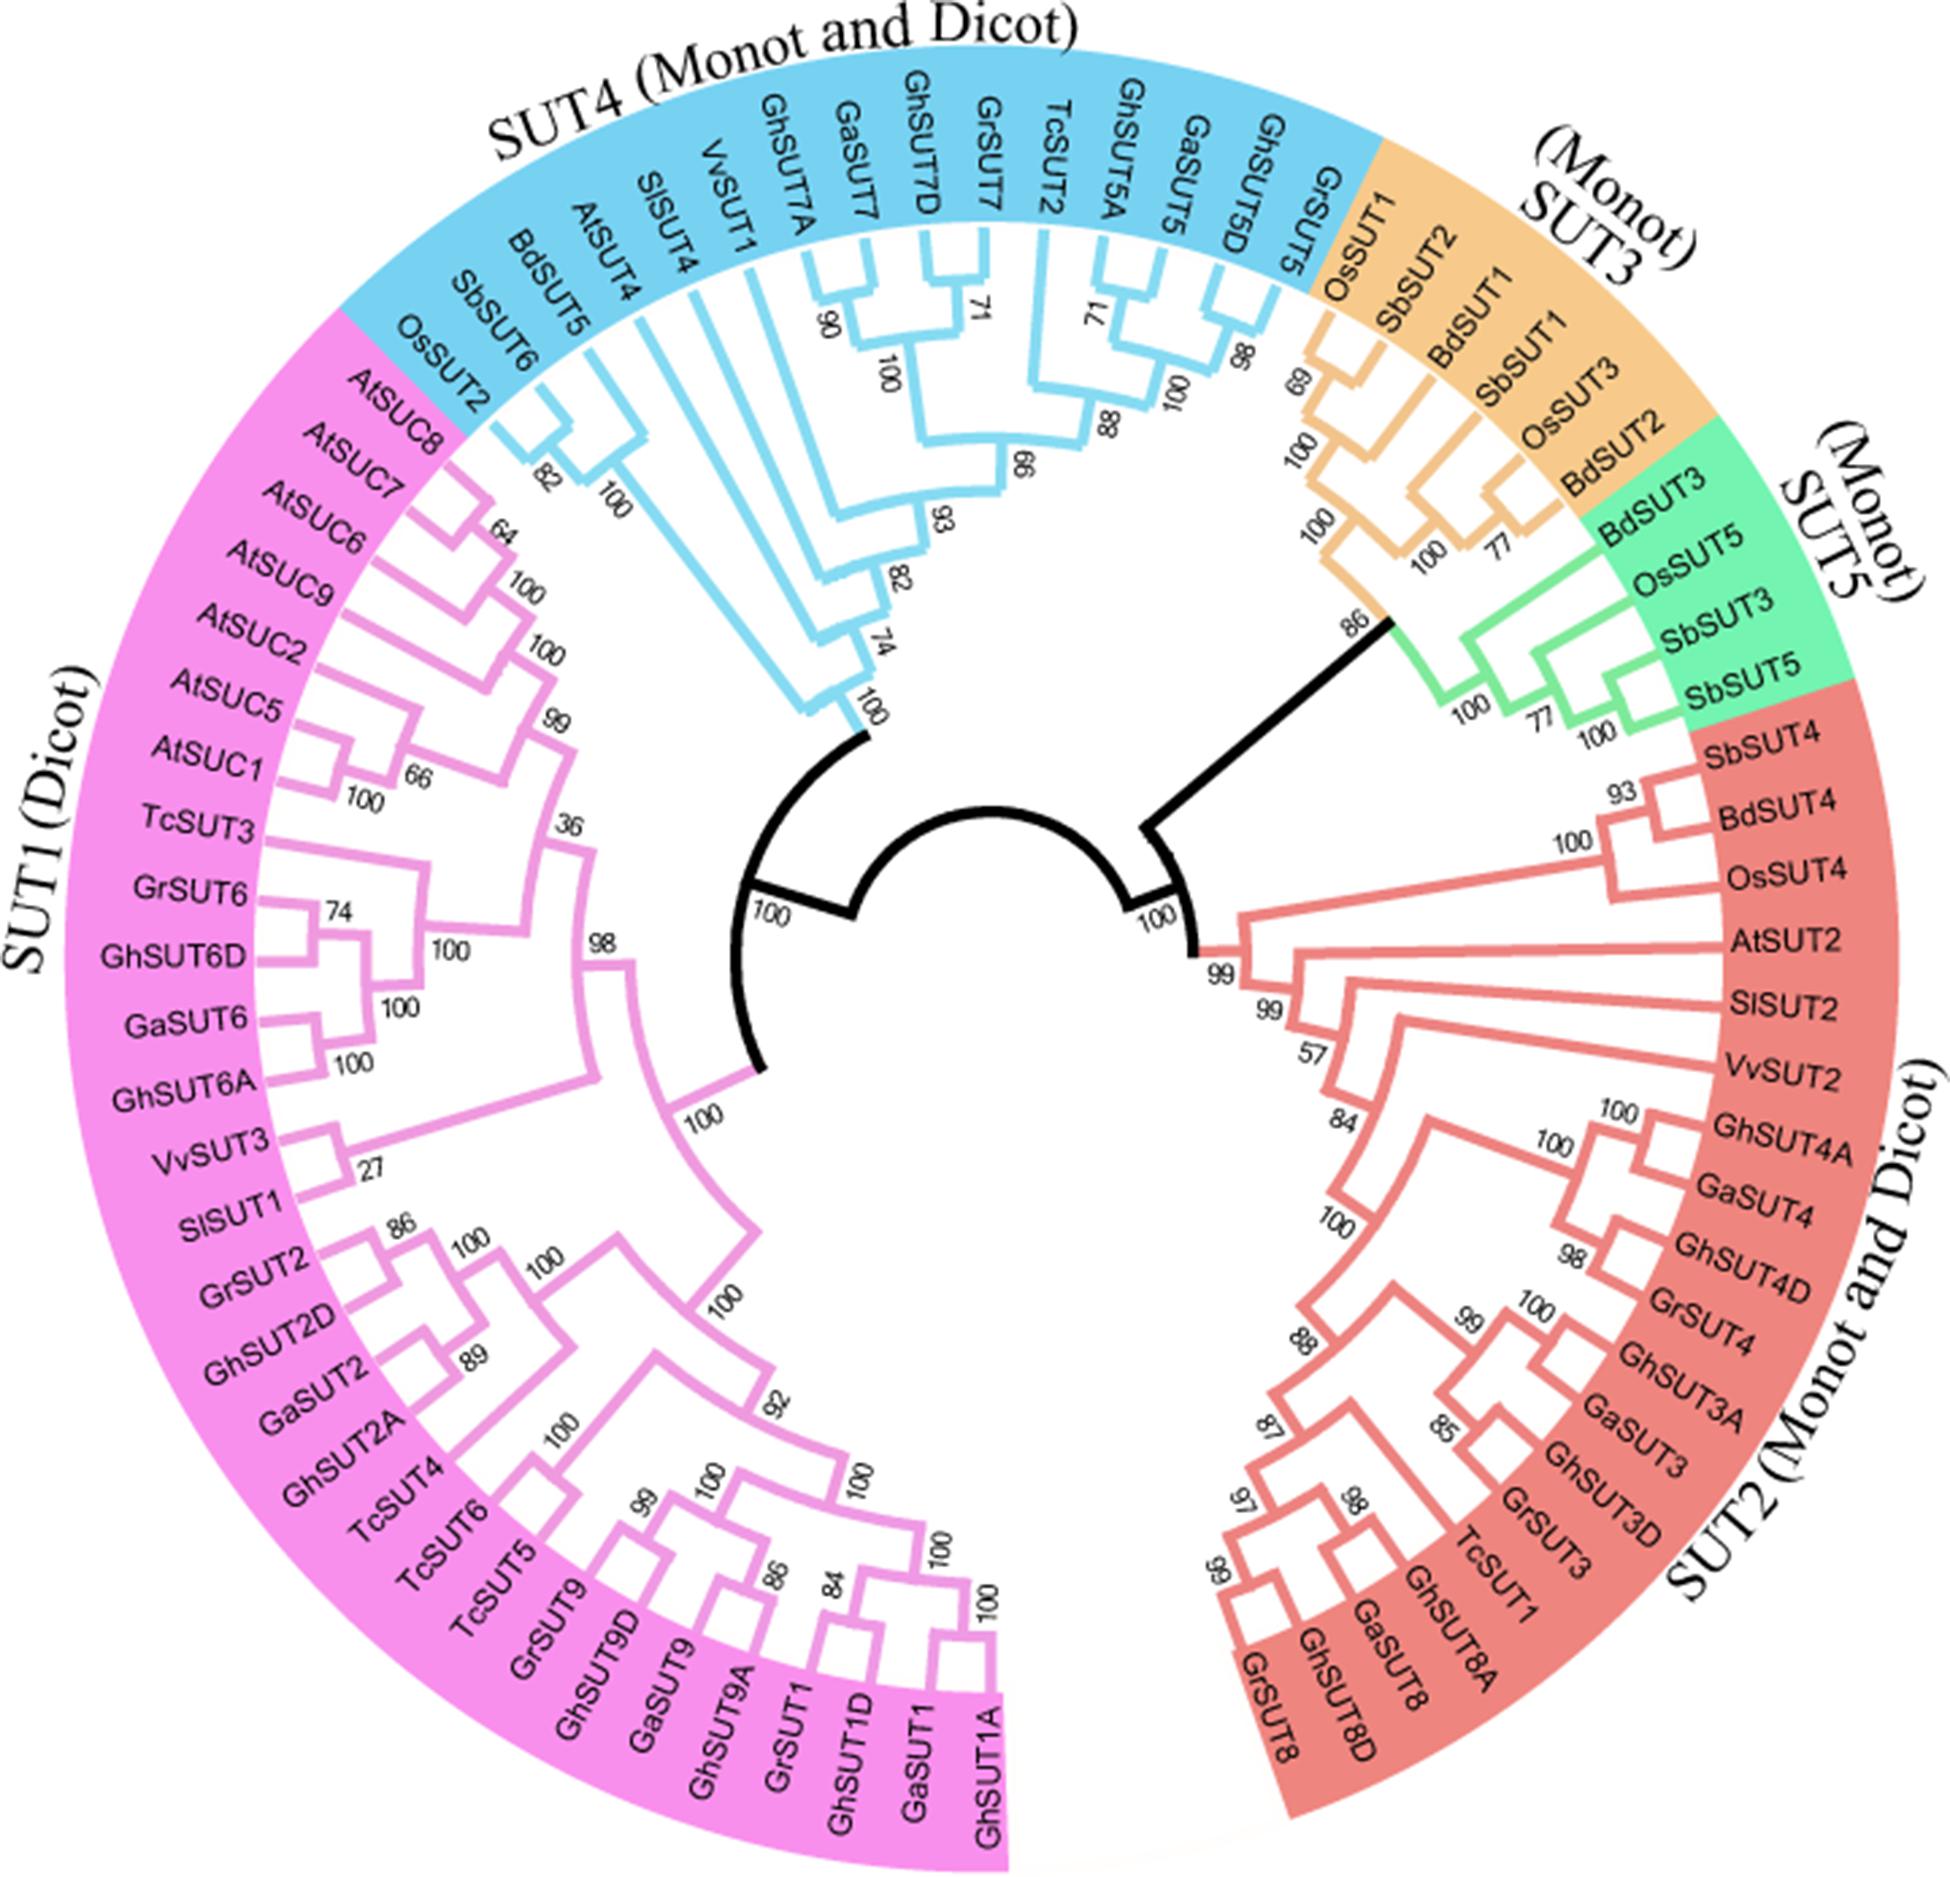
FIGURE 1. Neighbor-joining phylogenetic tree of SUT proteins from three Gossypium species and other plants SUT homologs. The SUT proteins were classified into five groups, which are shown in different colors. Loci and numbers of different plant SUT groups are listed in Supplementary Tables S3, S4, respectively.
In dicot-specific SUT1, closely related paralogs were present in each dicotyledonous species, which suggests that gene duplication events contributed to the amplification of the SUT gene family after the divergence of dicots from monocots. Interestingly, SUT2 and SUT4 had only one representative in each dicot and monocot species except for the three Gossypium species In contrast, three G. raimondii, three G. arboreum, and six G. hirsutum SUT2 genes were detected, with two G. raimondii, two G. arboreum, and four G. hirsutum genes belonging to SUT4. The presence of these multiple copies provides further evidence of the expansion of SUT2 and SUT4 gene groups in cotton. In monocot-specific SUT3 and SUT5, recent gene duplication events were inferred to have taken place in sorghum.
Chromosomal Locations and Syntenic Analysis of SUT Genes in G. hirsutum
Gossypium hirsutum (AD1), an allotetraploid species, was ultimately derived from the natural hybridization of two diploid species resembling G. arboreum (A2) and G. raimondii (D5) followed by chromosome doubling and natural and human selection. When referring to the genomic composition of this species, chromosome numbers 1–13 are reserved for the A subgenome (At), while chromosome numbers 14–26 are assigned to the D subgenome (Dt) (where ‘t’ indicates tetraploid) (Li et al., 2015). To better understand the physical distribution and collinear relationships of intraspecific and interspecific homologous genes among the three Gossypium species, we investigated SUT gene loci on cotton chromosomes and performed a synteny analysis (Figure 2 and Supplementary Figure S2). In G. arboreum, the nine SUT genes were distributed unevenly on seven chromosomes. Chromosomes 5 and 6 harbored two genes each. The other five genes were located on chromosomes 1, 8, 10, 11, and 13. In G. raimondii, the nine SUTs were mapped on five chromosomes, with chromosome 5 containing the largest number of genes. Two genes were present on chromosomes 9 and 13, while only one SUT gene each was located on chromosomes 8 and 10. In addition, 15 of the 18 G. hirsutum SUT genes were present on 8 of 13 At chromosomes and 4 of 13 Dt chromosomes. Three genes (GhSUT2D, GhSUT5A, and GhSUT7D) were distributed on scaffolds whose exact locations on chromosomes were not determined. Chromosomes At-chr2, At-chr13, Dt-chr2, Dt-chr5, and Dt-chr13 contained two genes each, while one gene each was present on chromosomes At-chr3, At-chr5, At-chr6, At-chr12, and Dt-chr12.
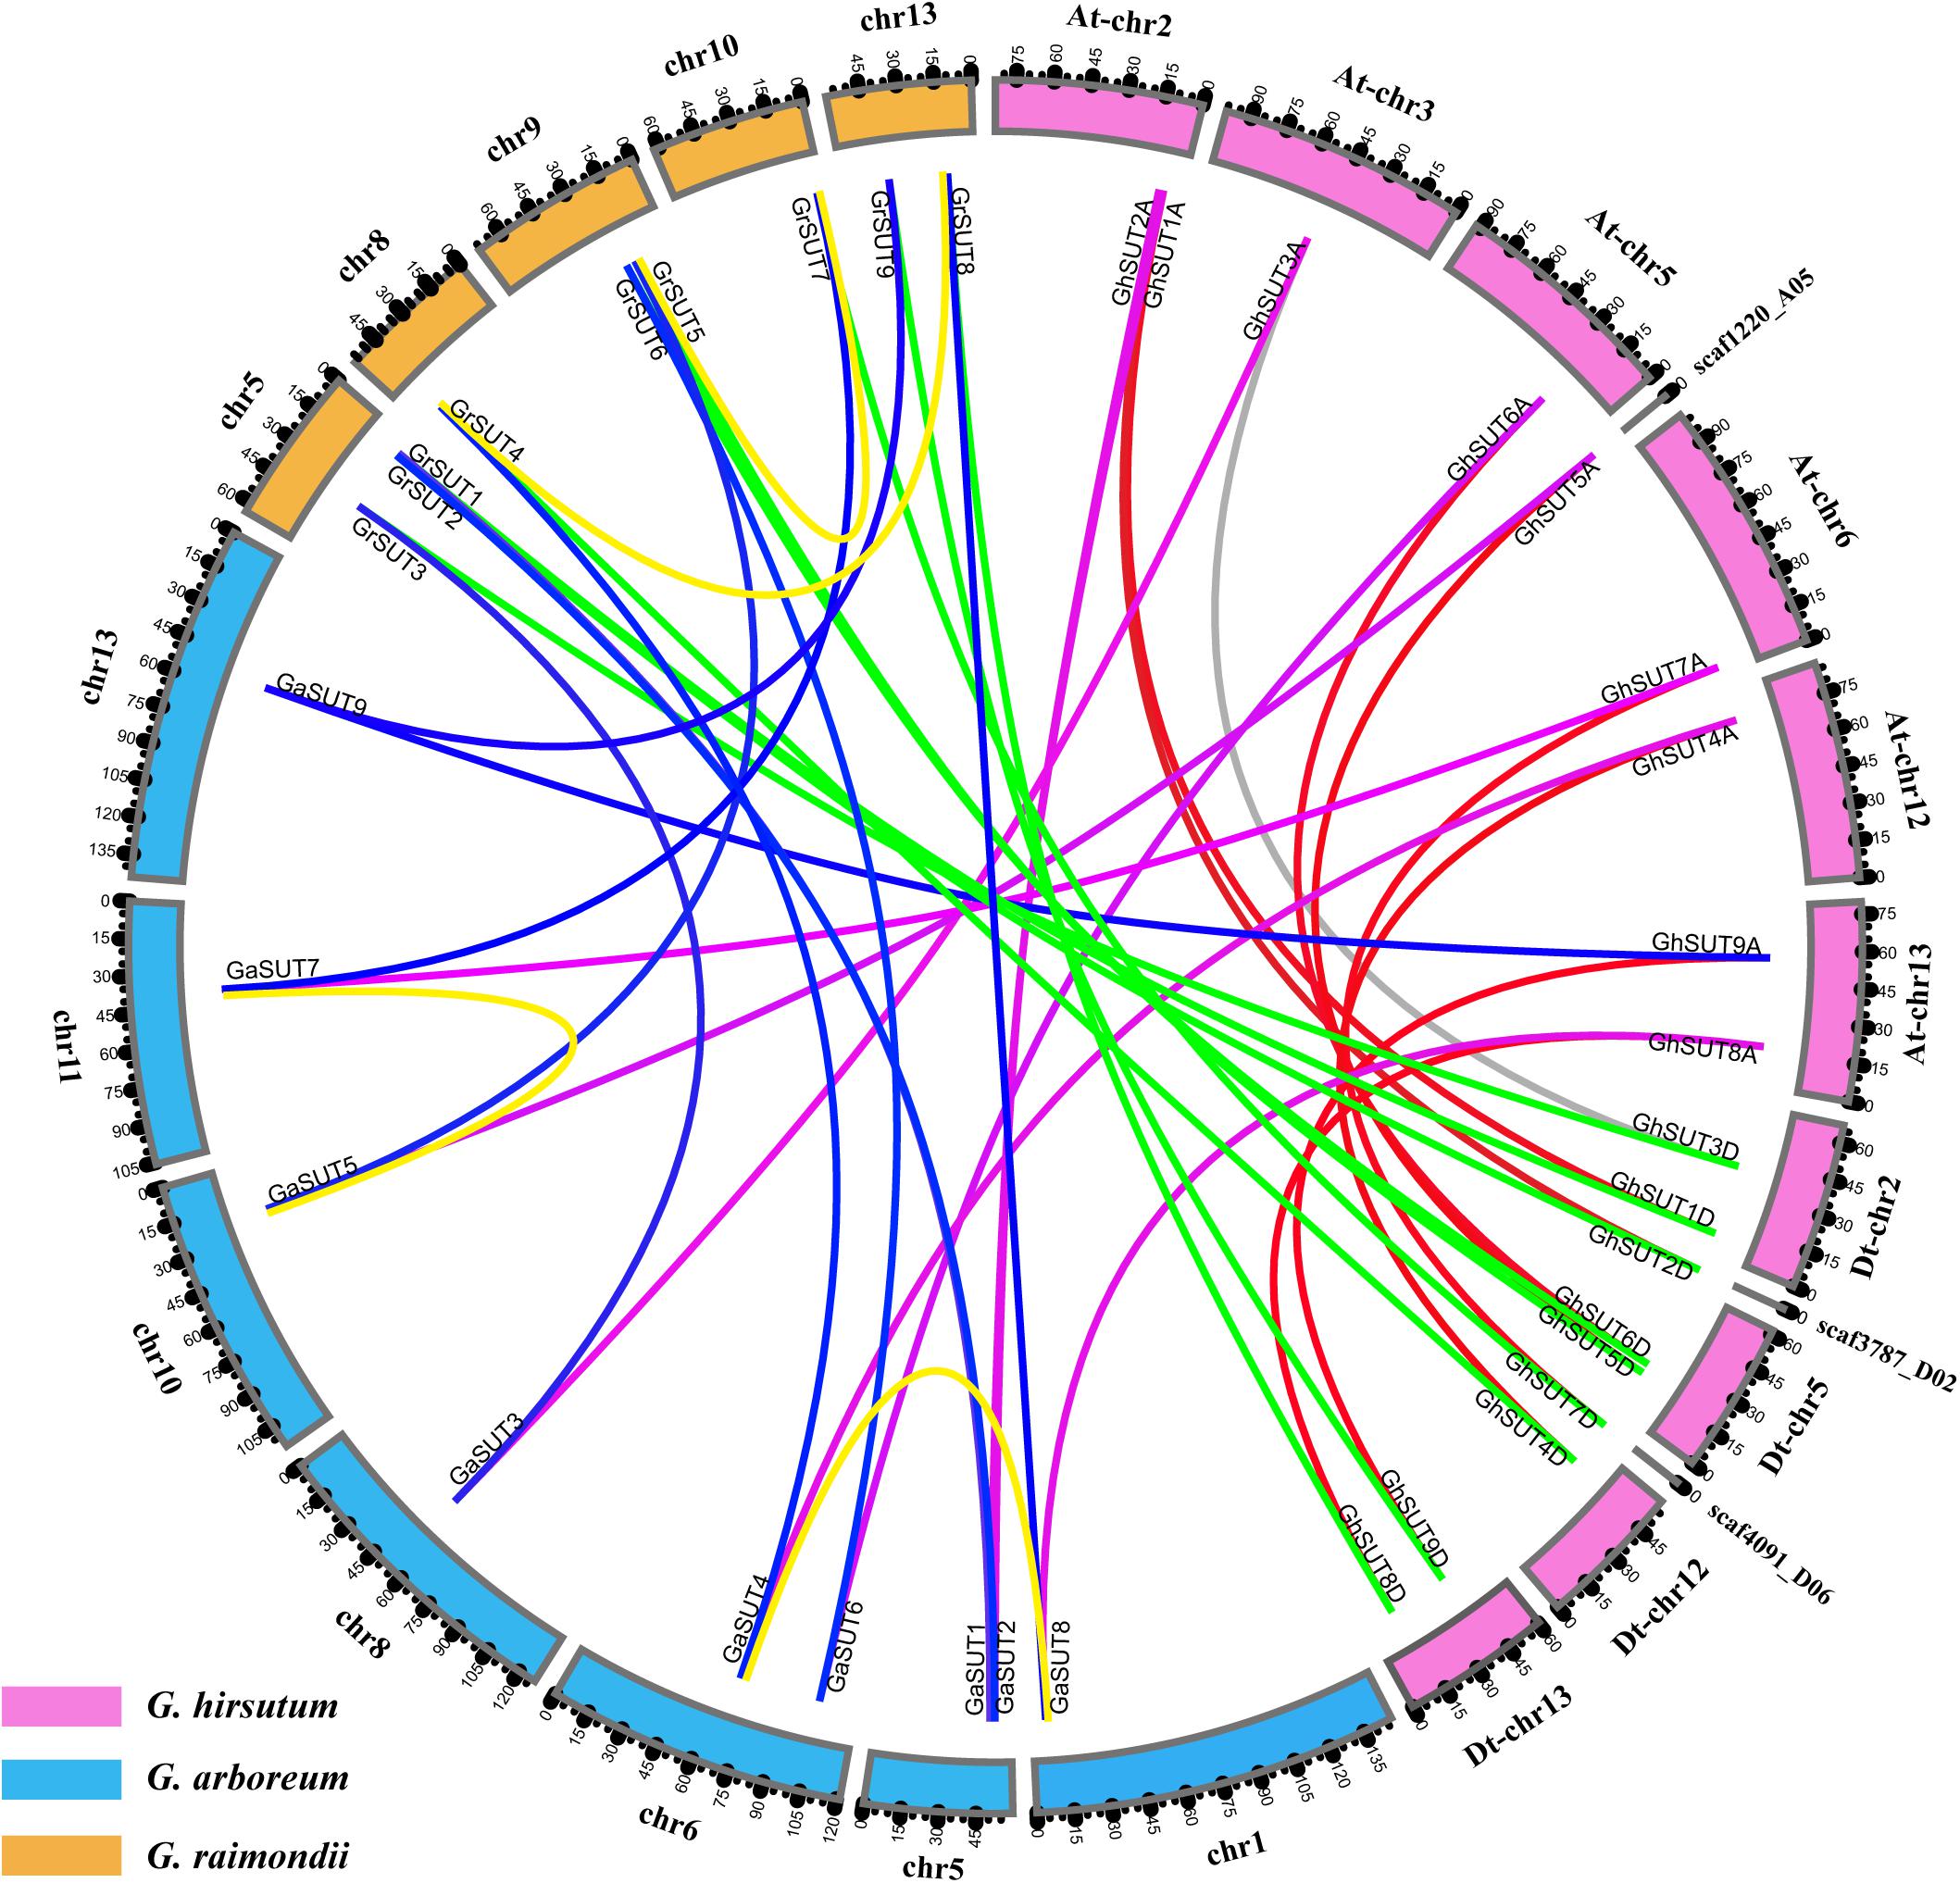
FIGURE 2. Locations and syntenic relationships of SUT genes from G. hirsutum, G. arboreum and G. raimondii. Chromosomes of G. hirsutum, G. arboreum and G. raimondii are indicated by pink, blue, and yellow, respectively. Putative homologous SUT genes between homoeologous chromosomes of G. hirsutum At and Dt subgenomes, the At subgenome and G. arboreum, the Dt subgenome and G. raimondii, and G. arboreum and G. raimondii are connected by red, purple, green and blue, respectively. Gray line link homologous genes located on non-homoeologous chromosomes in the At and Dt subgenomes. Duplicated gene pairs in G. arboreum and G. raimondii are connected by yellow lines.
The collinearity analysis revealed one-to-one relationships between homologous genes of the two diploid cotton species and the two subgenomes of the tetraploid species. In addition, most SUT loci were significantly conserved. For example, nine SUT paralogous gene pairs were identified between the At and Dt subgenomes of G. hirsutum, eight of which were anchored across five homoeologous chromosomes (Supplementary Figure S2). Only the paralogous pair GhSUT3A and GhSUT3D was located on the non-homoeologous chromosomes, possibly the result of a chromosomal translocation. Consistently, all nine G. arboreum SUTs and G. raimondii SUTs had corresponding orthologous genes in the G. hirsutum genome. We also investigated gene duplication events in the three Gossypium species. Two segmental duplication genes pairs were identified in G. arboreum (GaSUT4 and GaSUT8, GaSUT5 and GaSUT7) and G. raimondii (GrSUT4 and GrSUT8, GrSUT5 and GrSUT7), respectively (Figure 2). Notably, they belonged to the same subfamilies (SUT2 and SUT4 groups) and were also orthologous genes between the two diploid cotton. This result indicates that segmental duplications in SUT2 and SUT4 groups may have contributed to the amplification of the SUT gene family in G. arboreum and G. raimondii. Natural polyploidization then doubled the number of SUTs during the subsequent evolution of G. hirsutum. Whereas, no tandem duplication event was observed.
To assess the molecular evolutionary history of SUT genes in cotton, we next calculated the Ka/Ks ratio of each duplicated gene pair between both diploid and polyploid cotton species (Table 2 and Supplementary Table S5). Almost all calculated Ka/Ks values (except for GaSUT3/GhSUT3A, and GaSUT7/GhSUT7A) in inter-genomic (At and Dt) and intra-genomic (A2 and At or D5 and Dt) comparisons were less than 1; this demonstrates that these genes have undergone strong purifying selection pressure after duplication, which could lead to limited functional divergence followed by segmental duplications and polyploidization. Only two gene pairs (GaSUT3/GhSUT3A, and GaSUT7/GhSUT7A) have Ka/Ks larger than 1, indicating that these genes might have experienced relatively rapid evolution following duplication. We also estimated divergence time of duplicated SUT gene pairs in the diploid cotton (Supplementary Table S5). In G. arboreum and G. raimondii, segmental duplications were estimated to have occurred between 59.519 and 74.981 million years ago (MYA). These observations provide insights into the evolutionary conservation of the SUT gene family between the G. hirsutum genome and the two diploid genomes.
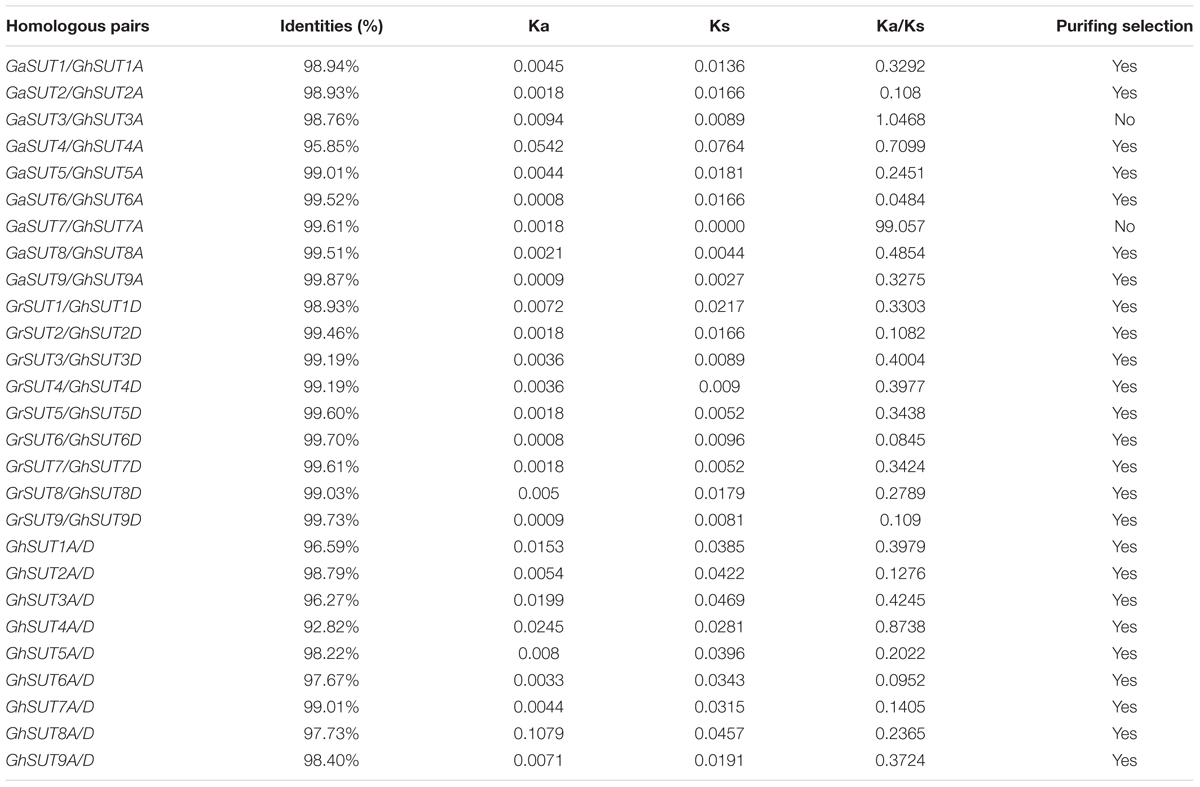
TABLE 2. Ka and Ks values of duplicated SUT genes between both diploid and polyploid cotton species.
Analysis of Exon/Intron Organization of SUT Genes in G. hirsutum
The arrangement of exons and introns can be used to analyze the evolution of gene families. To shed light on the structural evolution of G. hirsutum SUTs, we constructed an unrooted phylogenetic tree and compared coding and genomic sequences (Figure 3). The analyzed SUTs could be classified into three distinct groups; their structures showed great variation, with exon numbers ranging from 5 to 14. At the same time, most members of a given group had similar characteristics, differing only in the lengths of their introns. For example, all SUT genes in the SUT2 group contained 14 exons, which was approximately three times the number in other SUT genes, which had four or five exons. Within the SUT1 group, GhSUT2A and GhSUT2D, with 96.23% nucleotide sequence identity, and GhSUT9A and GhSUT9D, with 93.78% nucleotide sequence identity, had similar exon numbers and phase patterns. These results suggest that the exon/intron structure of SUT genes is associated with their evolutionary relationships and may reflect their functional conservation and divergence.
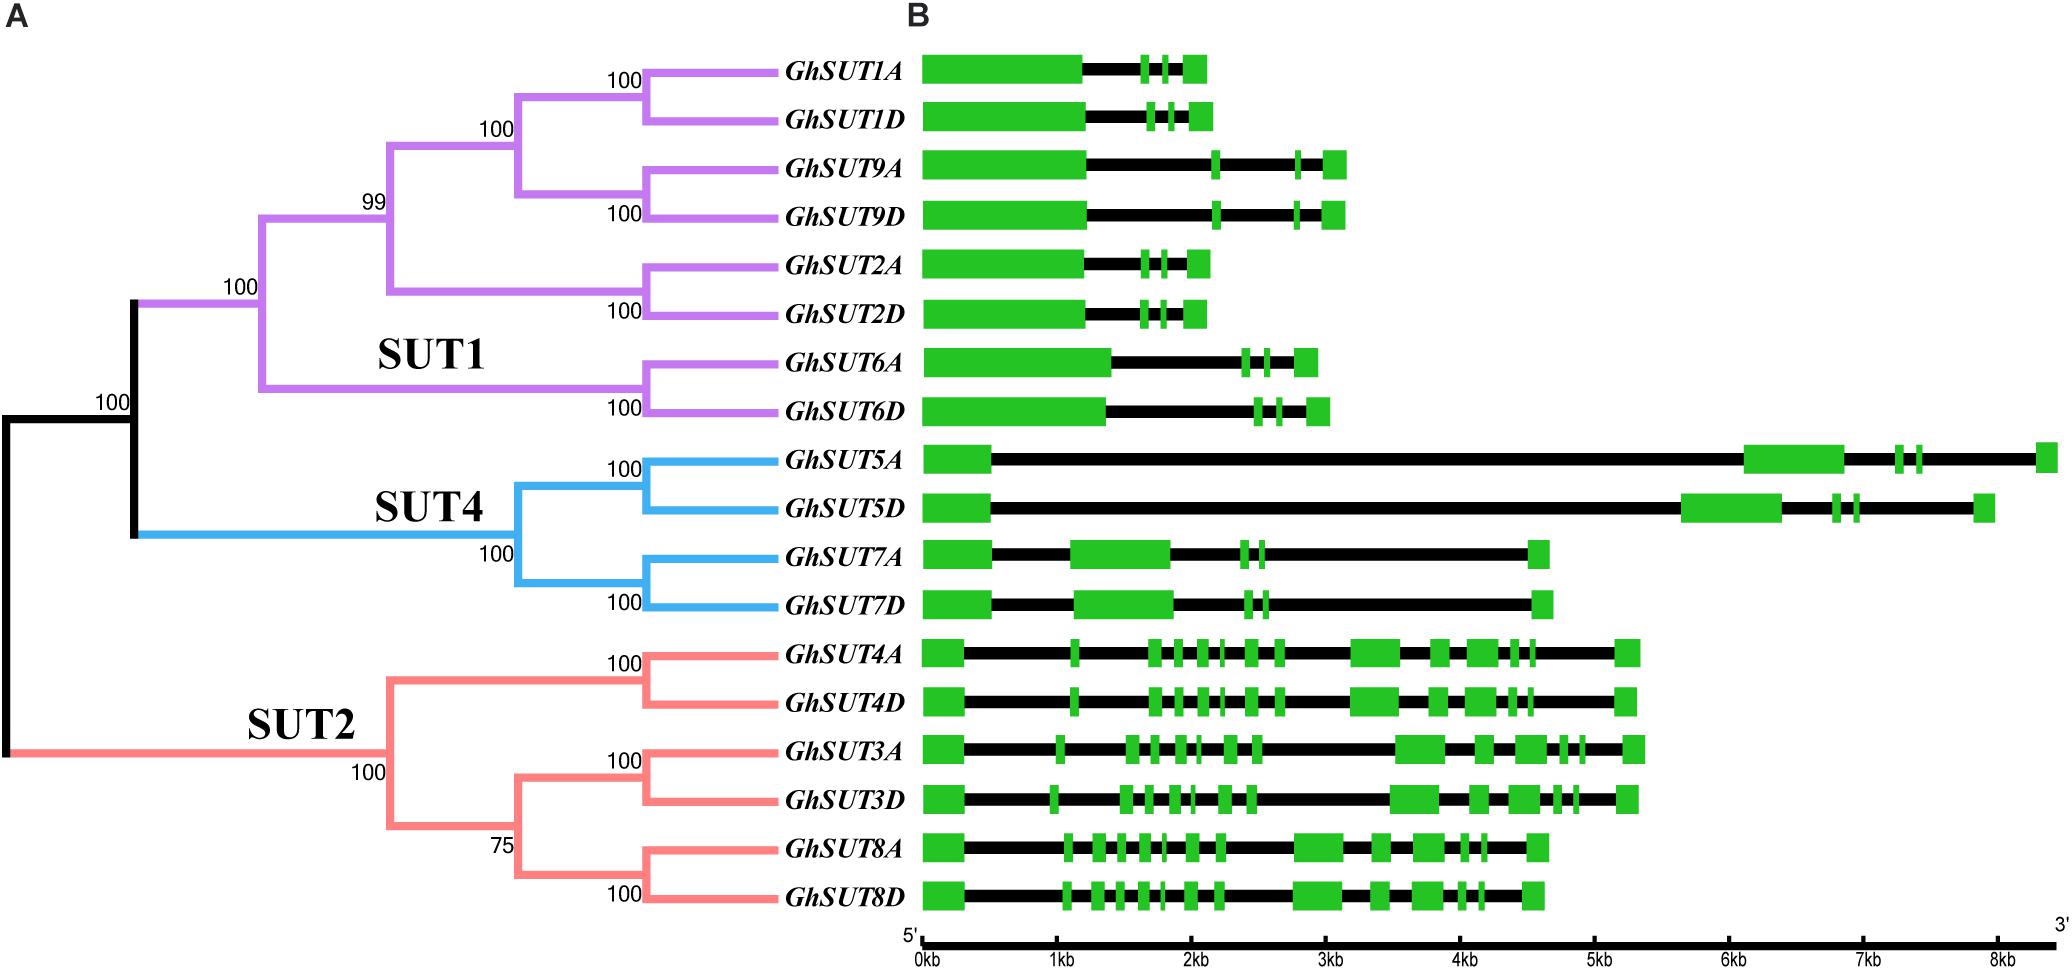
FIGURE 3. Phylogenetic relationships and structure of G. hirsutum SUT genes. (A) Neighbor-joining phylogenetic tree of G. hirsutum SUT proteins. The SUT genes in G. hirsutum were classified into three groups, SUT1, SUT4, and SUT2, which are represented by purple, blue, and orange, respectively. (B) Exon–intron structures of SUT genes. Green boxes and black lines represent exons and introns, respectively.
Expression Patterns of SUT Genes in Different Tissues of G. hirsutum
The expression pattern of a gene may reflect its biological function. In the present study, expression profiles of G. hirsutum SUT genes were investigated by qRT-PCR in several tissues, namely, roots, stems, leaves, sepals, petals, stamens, carpels, ovules at 0 DPA and fibers at 7 DPA, 15 DPA, and 20 DPA. Paralogs were difficult to distinguish by qRT-PCR because their sequences were highly similar. We therefore designed primers to amplify paralogs together (Figure 4). Overall, SUT genes exhibited diverse expression tendencies. Among the nine paralogous SUT gene pairs, GhSUT7A/D, GhSUT8A/D, and GhSUT9A/D were exclusively and highly expressed in 15 DPA fibers, which suggest that these genes play significant roles during cotton fiber elongation. GhSUT1A/D displayed a highly stamen-specific expression pattern. GhSUT2A/D was preferentially expressed in petals, while GhSUT3A/D was relatively highly expressed in roots, stems, stamens, and 20 DPA fibers. Transcripts of GhSUT4A/D and GhSUT5A/D were not only detected in fibers, but were also highly abundant in roots. Finally, GhSUT6A/D displayed higher expression levels in carpels and 0 DPA ovules.
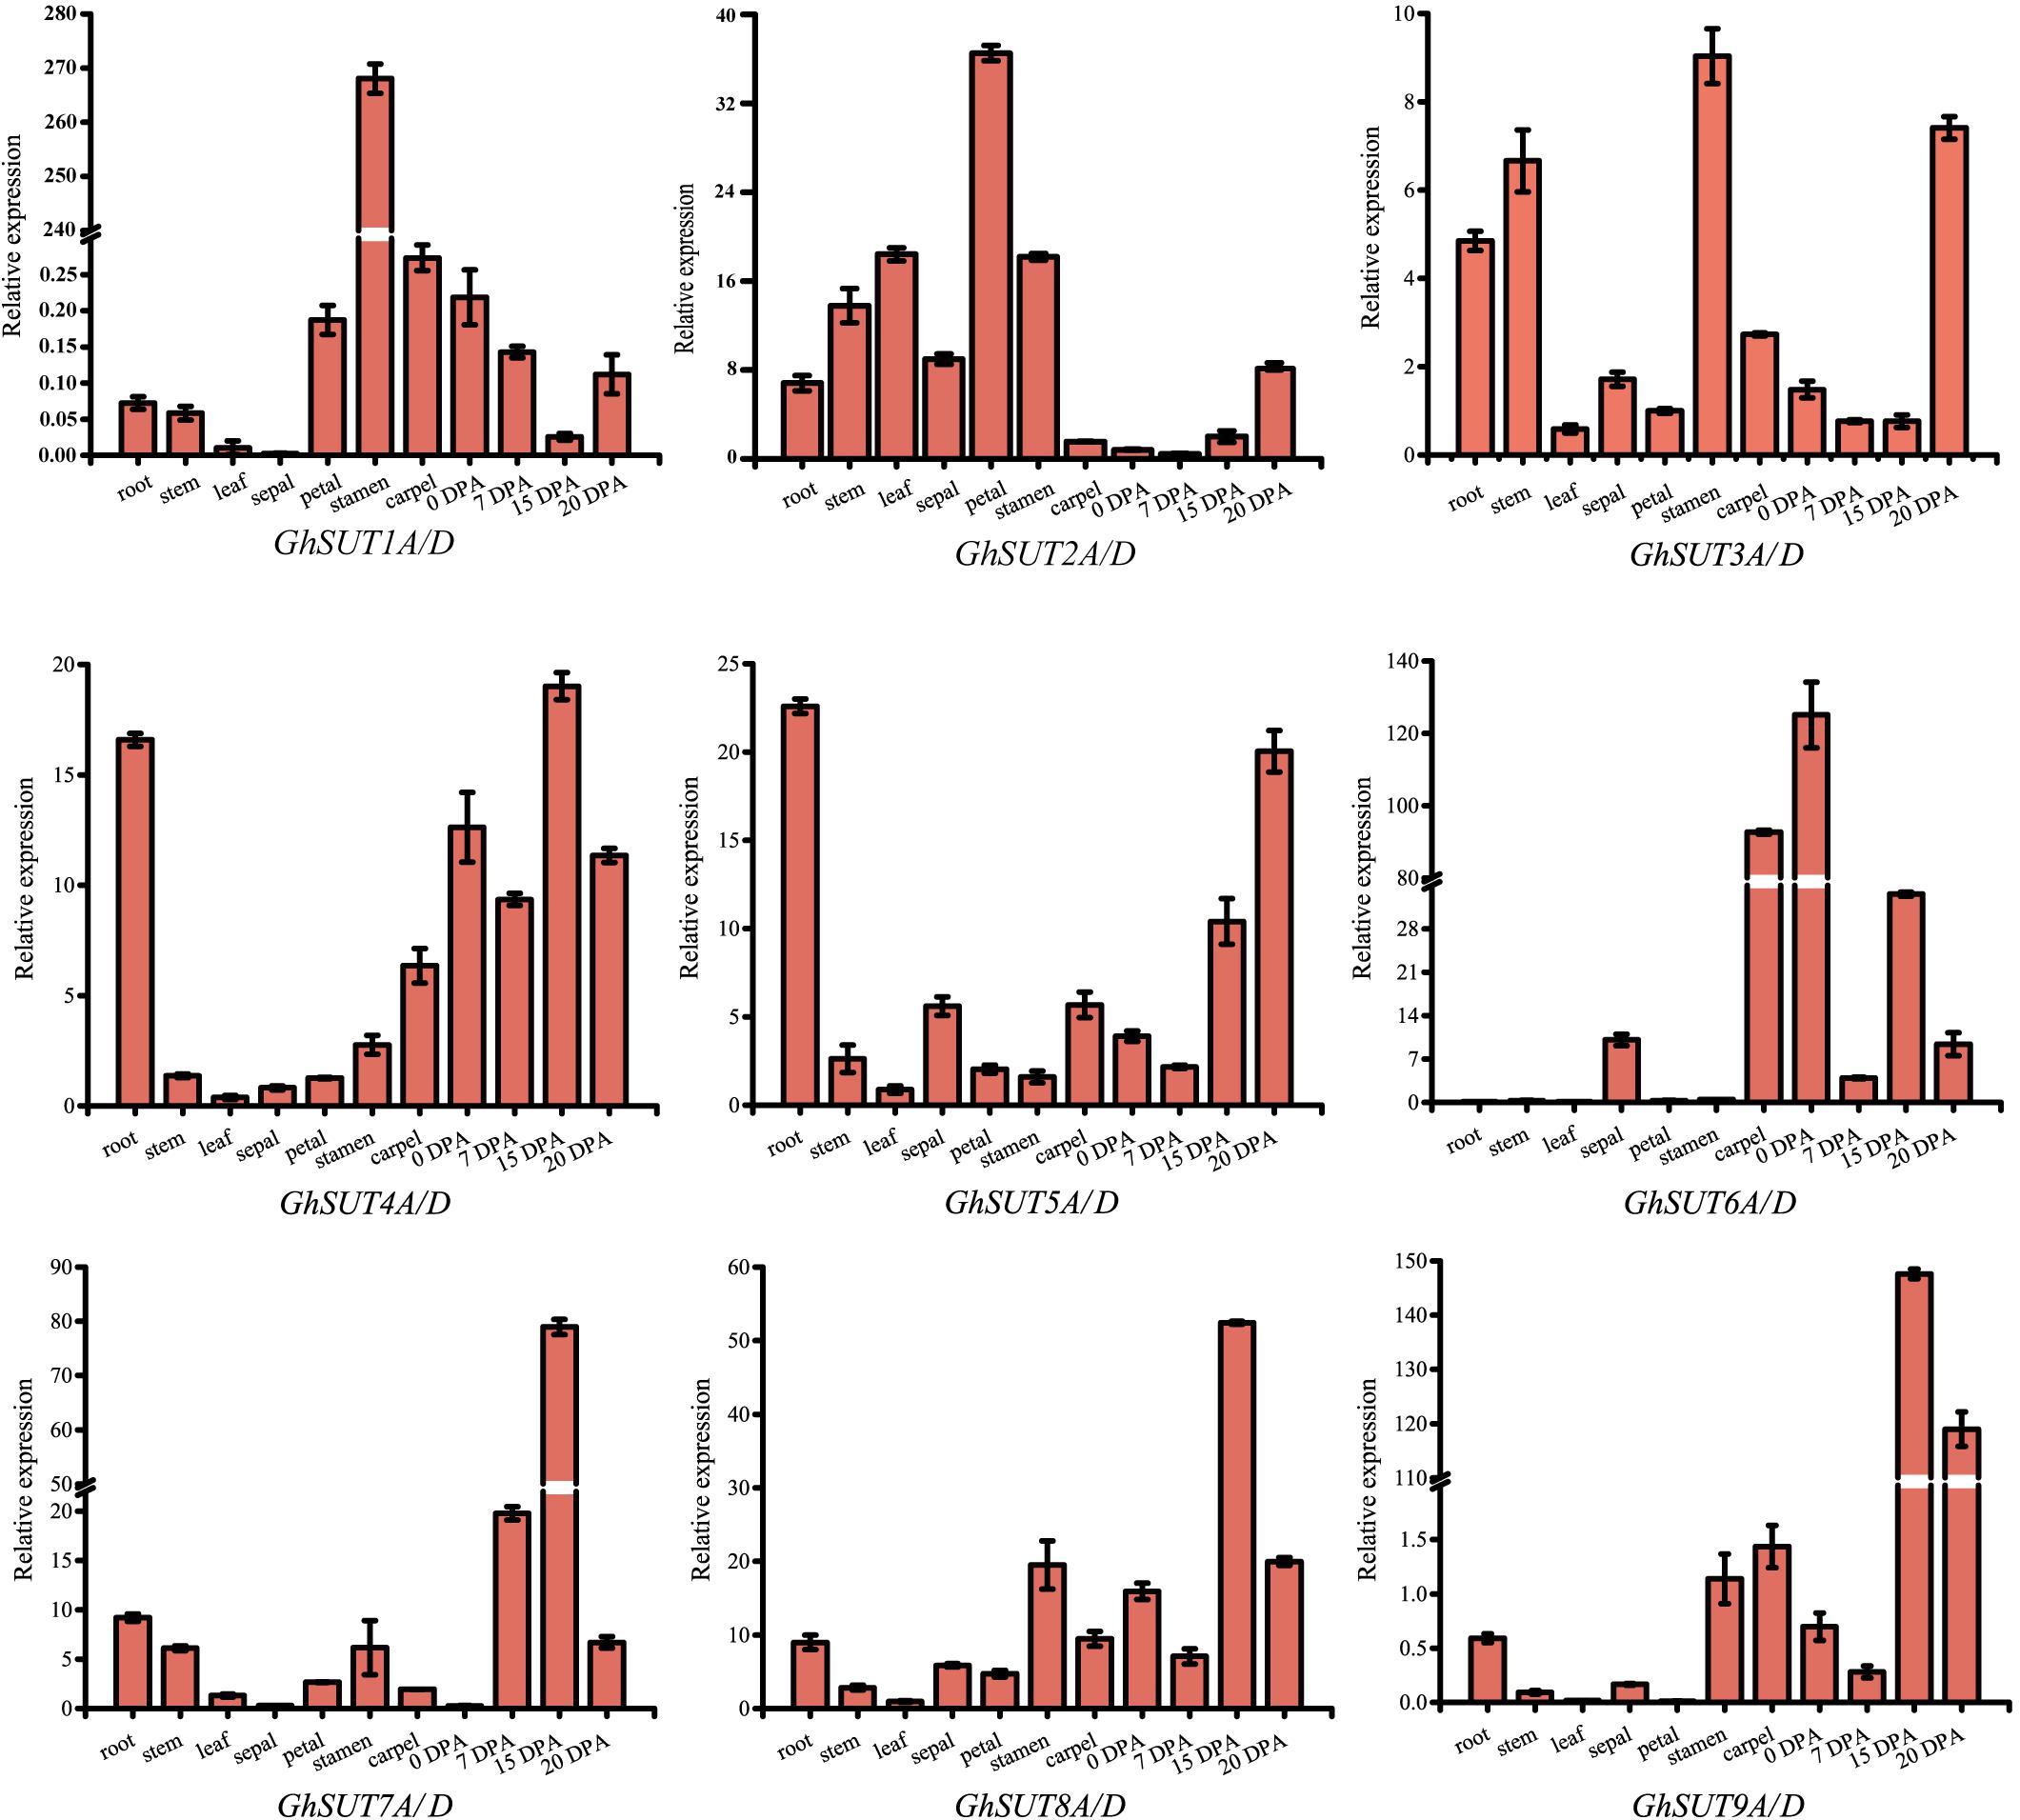
FIGURE 4. Tissues-specific expression profiles of G. hirsutum SUT genes. Expressions of nine paralogous SUT gene pairs were investigated in roots, stems, leaves, sepals, petals, stamens, carpels, ovules at 0 DPA, and fibers during different developmental stages by qRT-PCR. The GhHis3 gene was used as an internal control. Error bars indicate the standard deviations of three independent experiments.
Abiotic Stress-Induced Expression Profiles of G. hirsutum SUT Genes
During growth and development, many plants are affected by various environmental conditions, such as exposure to low and high temperatures, high salinity, and drought. Previous studies have indicated that the plant SUT gene family is involved in abiotic and biotic stress responses (Frost et al., 2012; Jian et al., 2016; Liao et al., 2016; Xu et al., 2018). At the same time, multiple putative stress cis-acting regulatory elements were predicted in the promoters of G. hirsutum SUT genes in our study (Figure 5). We therefore profiled the expressions of all nine SUT paralogous gene pairs in G. hirsutum by qRT-PCR under four types of stress, namely, cold, heat, drought, and salinity (Figure 6). In general, the SUT genes exhibited variations in response to one or more stresses. Only a few genes were up-regulated at some treatment time point under heat stress, which suggest that most of these SUT genes are insensitive to high temperature and have complex regulatory mechanisms in response to heat stress. After cold treatment, GhSUT6A/D showed the greatest variation. GhSUT4A/D and GhSUT7A/D were up-regulated after 1 h of treatment, and their expressions then declined until 6 h of treatment and increased once more after 12 h of treatment. Transcripts of GhSUT8A/D and GhSUT9A/D were up-regulated after 1 h of constant cold treatment and were then down-regulated. After 1 h of drought stress, GhSUT2A/D and GhSUT3A/D genes were dramatically induced, and they were down-regulated after 3 h of treatment, up-regulated after 6 h, and down-regulated within 12 h of treatment. Expressions of GhSUT4A/D, GhSUT7A/D, and GhSUT8A/D were increased early during drought treatment, decreased at 3 h, and then gradually up-regulated during treatment until 12 h. Transcript levels of GhSUT6A/D were significantly increased during continued drought stress, whereas GhSUT5A/D and GhSUT9A/D were down-regulated at early time points in the treatment. Interestingly, seven out of nine SUT gene pairs were gradually up-regulated until 6 h of salt treatment and then showed a decrease at 12 h of treatment. Transcript levels of GhSUT9A/D decreased after 1 h of treatment, but increased from 3 to 6 h and then declined after 12 h. These results further suggest that these up-regulated SUT genes are involved in signaling pathways related to abiotic stress response during plant growth and development.
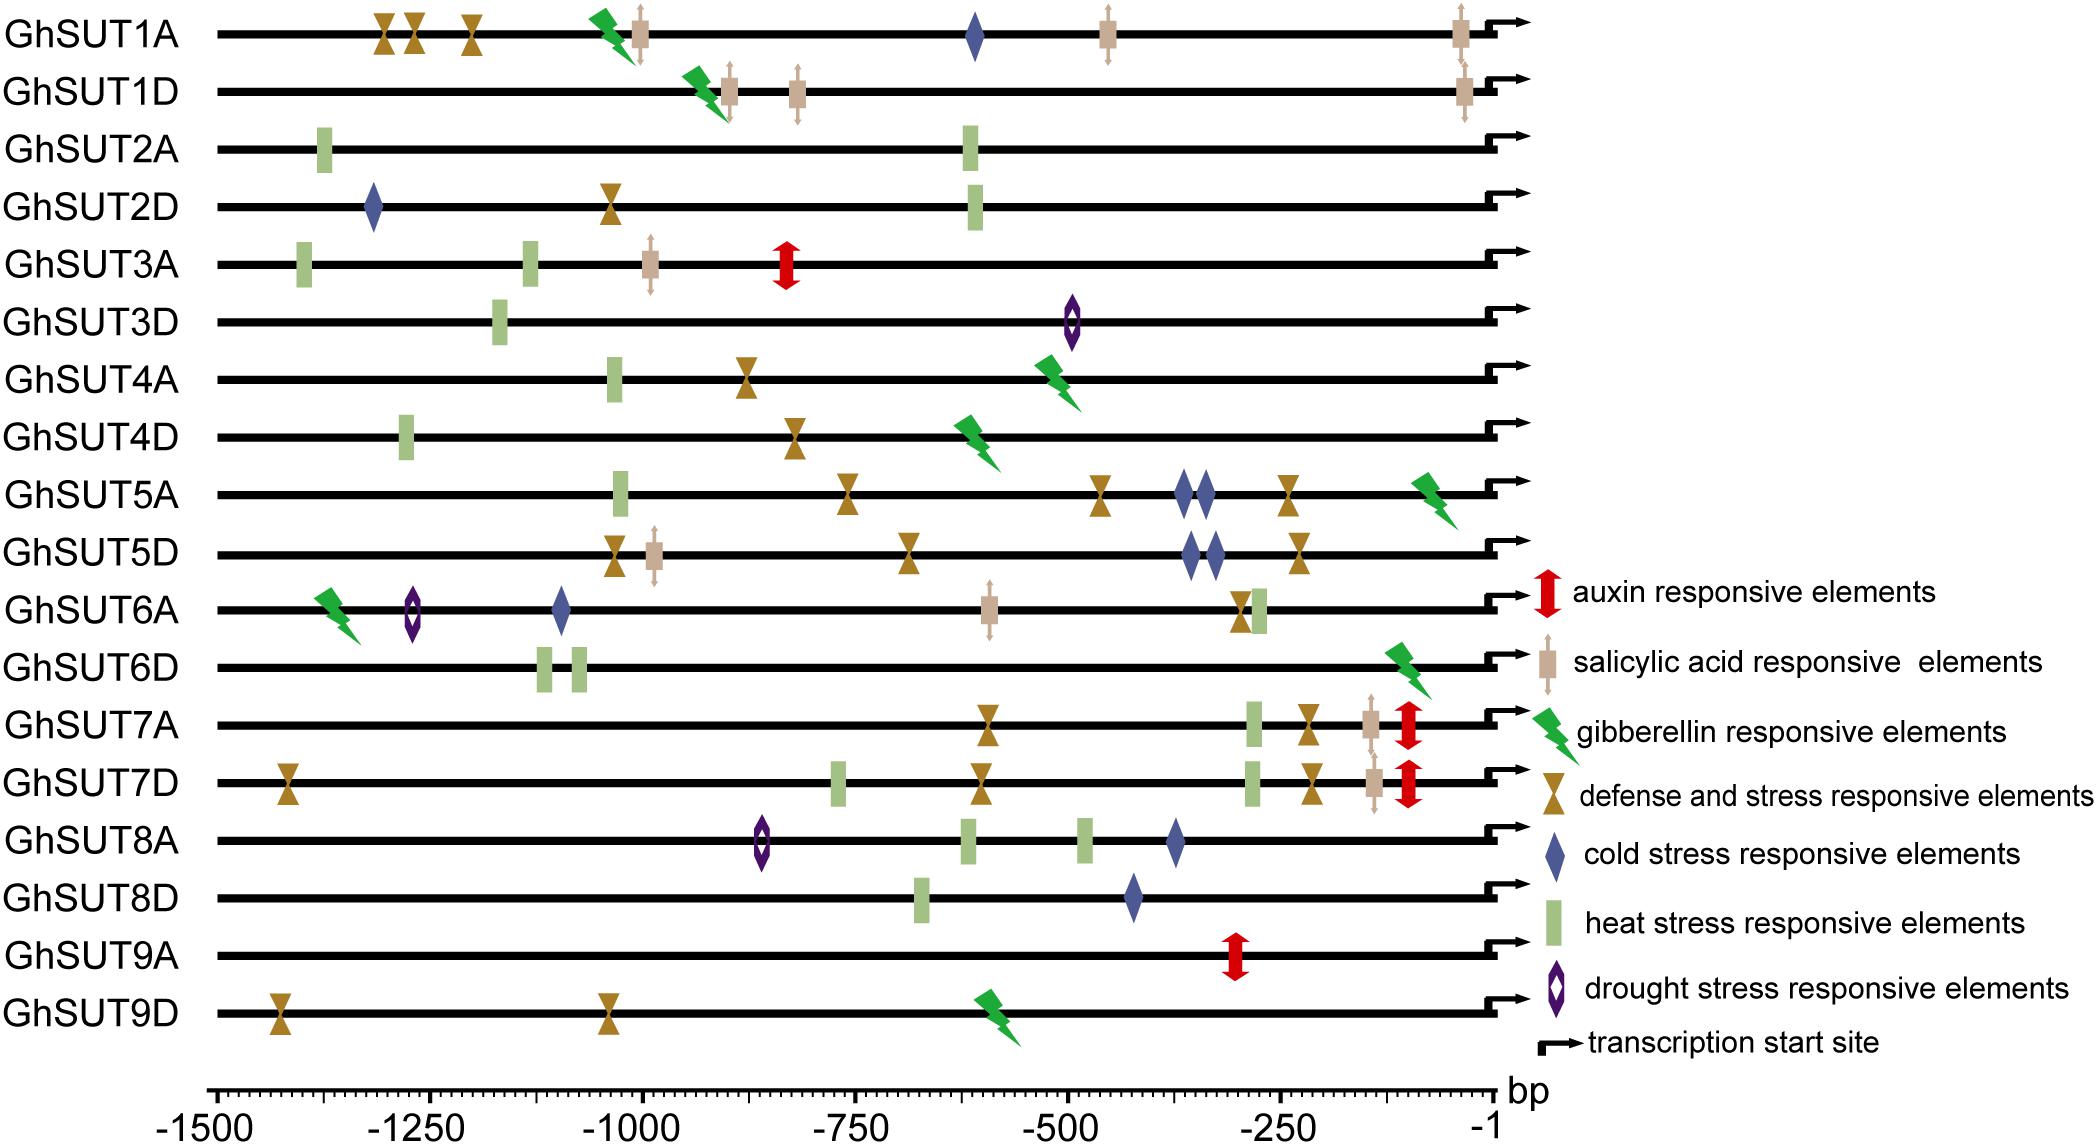
FIGURE 5. Putative cis-acting regulatory elements related to stress and hormone response in promoters of G. hirsutum SUT genes.
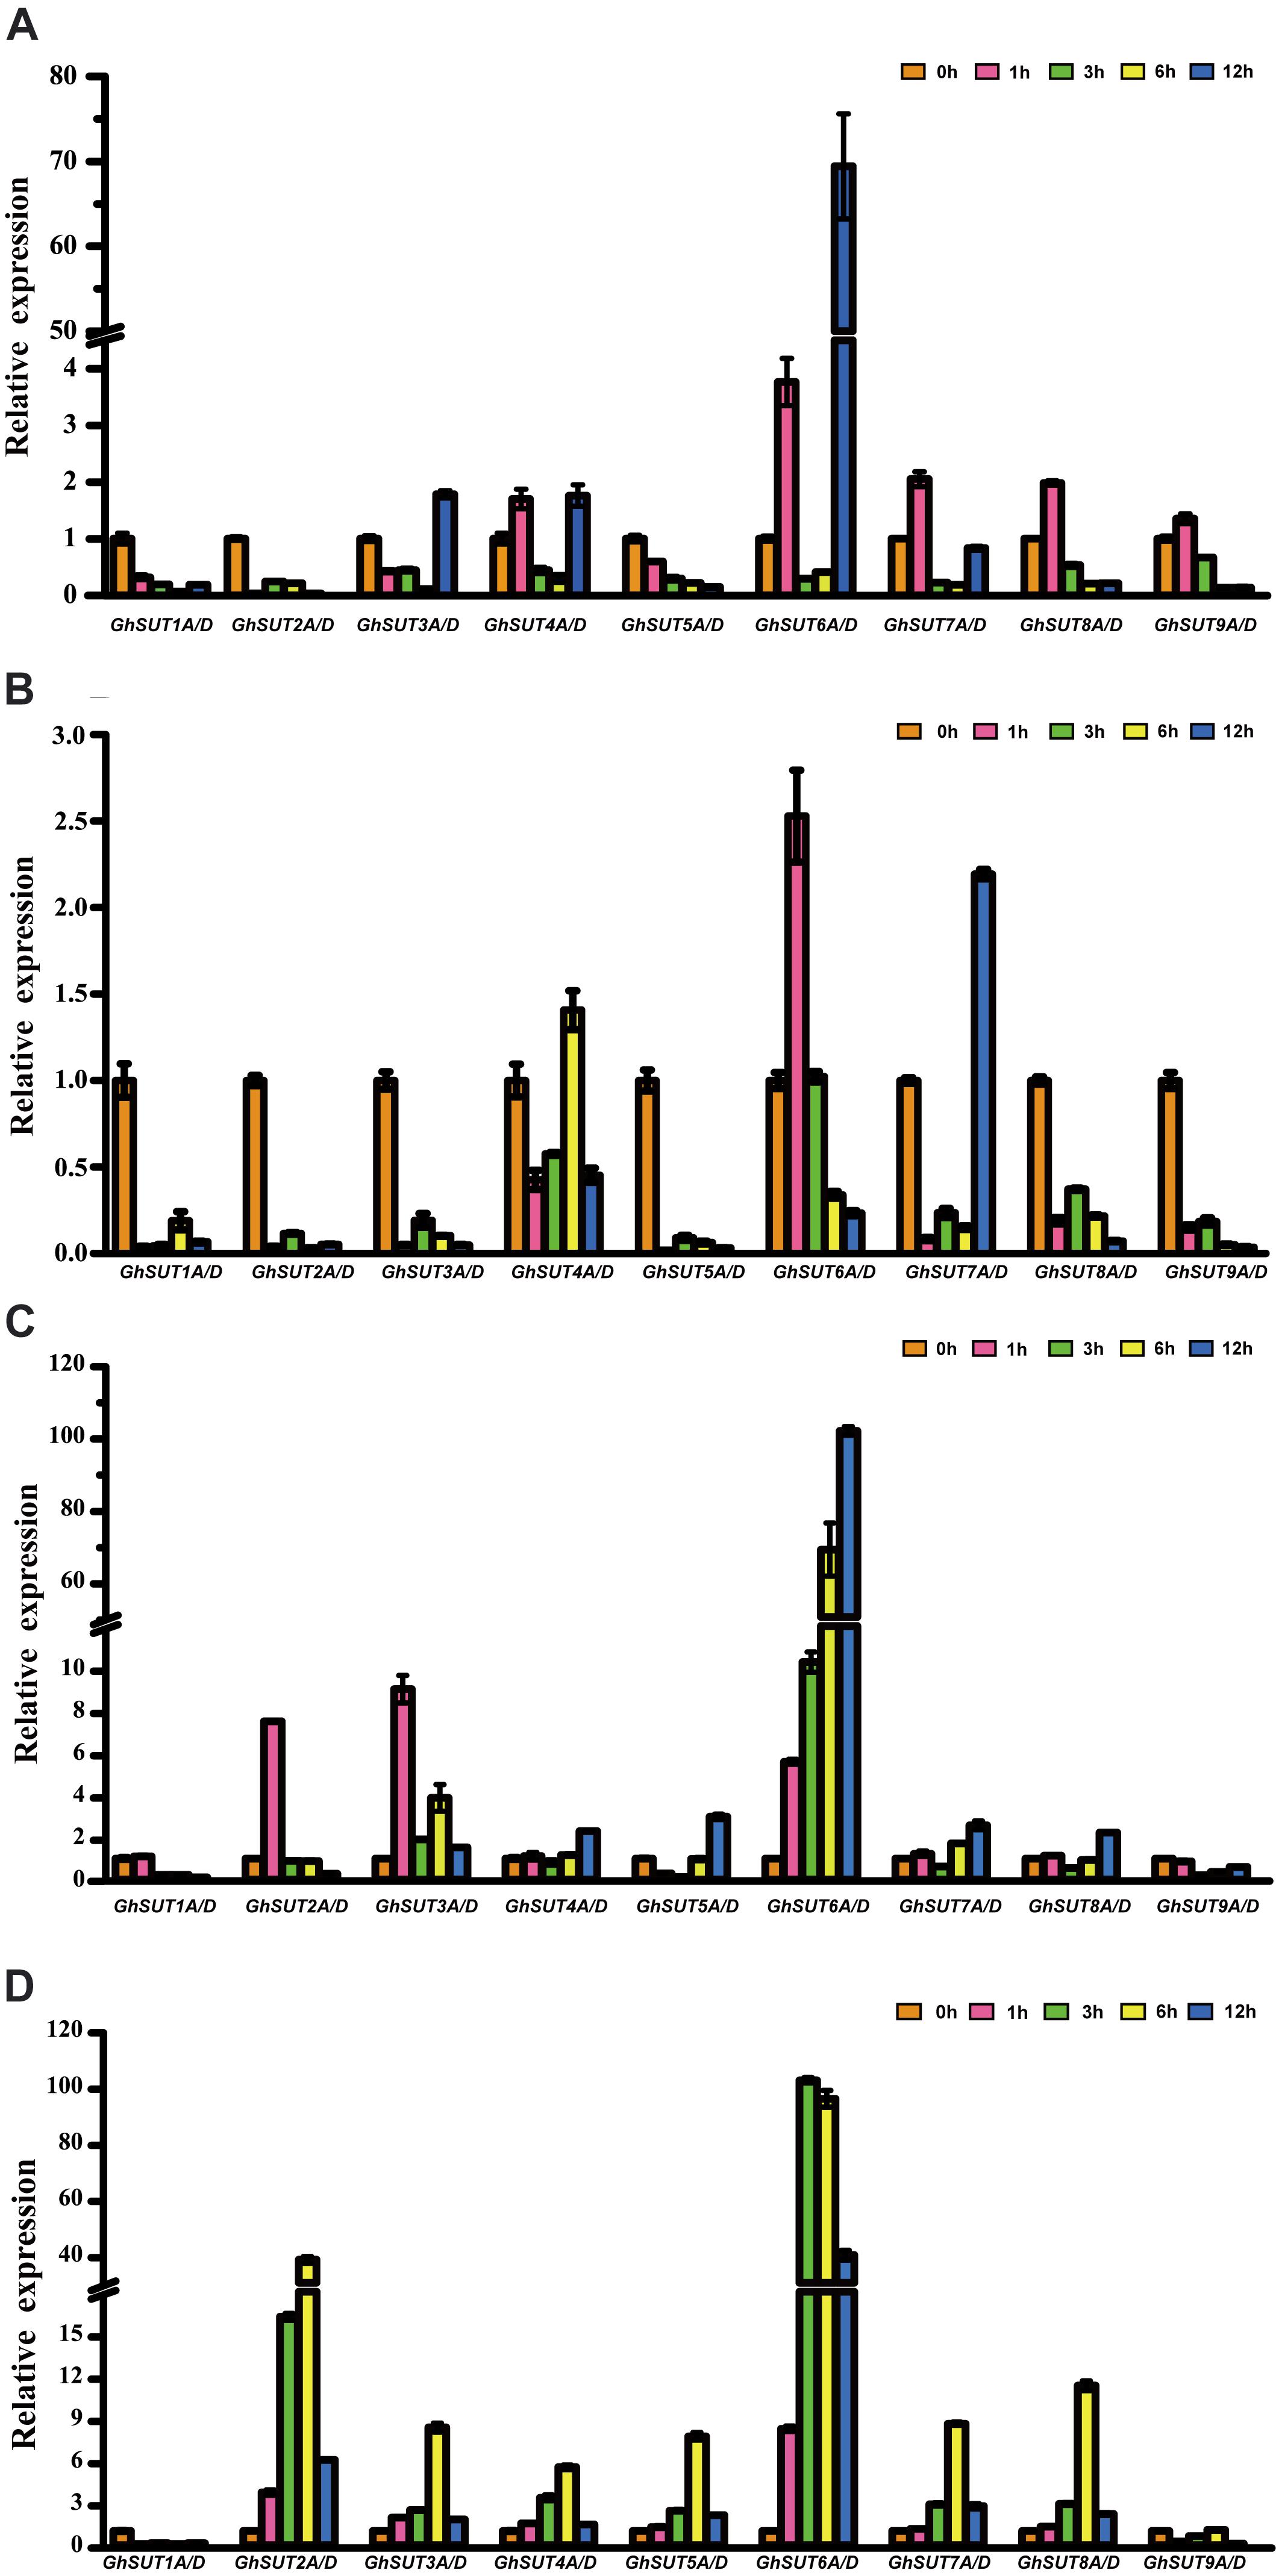
FIGURE 6. Expression analysis of G. hirsutum SUT genes by qRT-PCR under different abiotic treatments: (A) cold; (B) heat; (C) drought; (D) salt. Transcript levels of each gene were calculated by the 2-ΔΔCt method and expressed relative to non-stressed values (0 h) set to 1. GhHis3 was used as a housekeeping gene. Error bars represent the standard deviation of three independent experiments.
Expression Analysis of G. hirsutum SUT Genes Exposed to Different Exogenous Phytohormones
Our analysis of cis-regulatory elements in G. hirsutum SUT promoters, also revealed that most G. hirsutum SUT genes contained hormone stress-responsive cis-regulatory elements in their promoter regions (Figure 5). To further investigate the roles of SUT genes in response to plant hormones, we used qRT-PCR to examine the differential regulation of nine paralogous SUT gene pairs by IAA, GA, and SA stresses (Figure 7). After treatment with IAA, five SUT genes (GhSUT2A/D, GhSUT3A/D, GhSUT4A/D, GhSUT7A/D, and GhSUT8A/D) were significantly up-regulated until 3 h of treatment, with their expressions then decreasing at 5 h. Transcript levels of GhSUT5A/D gradually increased until 1 h of IAA treatment and then decreased from 3 to 5 h. Expression levels of GhSUT6A/D were slightly down-regulated at 0.5 h and then remained elevated during continued IAA stress. While GhSUT9A/D was not obviously altered at early time points in the IAA treatment, their expressions were significantly increased after 3 h of treatment, followed by a decline at 5 h. At different time points during GA treatment, meaningful differences were observed. Overall, G. hirsutum SUT genes generally exhibited two different expression trends. In particular, five genes (GhSUT1A/D, GhSUT3A/D, GhSUT5A/D, GhSUT7A/D, and GhSUT8A/D) were prominently induced until 1 h of treatment and then down-regulated for the remaining treatment period. Expressions of the other four SUT genes gradually increased during treatment until 3 h and then decreased after 5 h of treatment. Under SA treatment, SUT genes displayed diverse expression patterns. GhSUT1A/D and GhSUT5A/D were initially up-regulated and then down-regulated, while GhSUT2A/D and GhSUT4A/D transcript levels gradually increased and peaked at 3 h. Expressions of GhSUT3A/D and GhSUT7A/D slowly increased until 1 h of SA treatment, but these genes were then down-regulated for the remainder of the treatment. Surprisingly, transcript levels of GhSUT6A/D fluctuated greatly. The expression of this gene pair was instantly induced at 0.5 h, mildly decreased at 1 h, increased highly significantly after 3 h of treatment, and again reduced at 5 h. In contrast, GhSUT8A/D was strongly induced throughout the entire treatment period. GhSUT9A/D expressions showed a sharp increase after 0.5 h of treatment, around 20-fold higher than those under untreated conditions, and subsequently decreased until 3 h and then slowly increased beginning at 5 h of treatment.
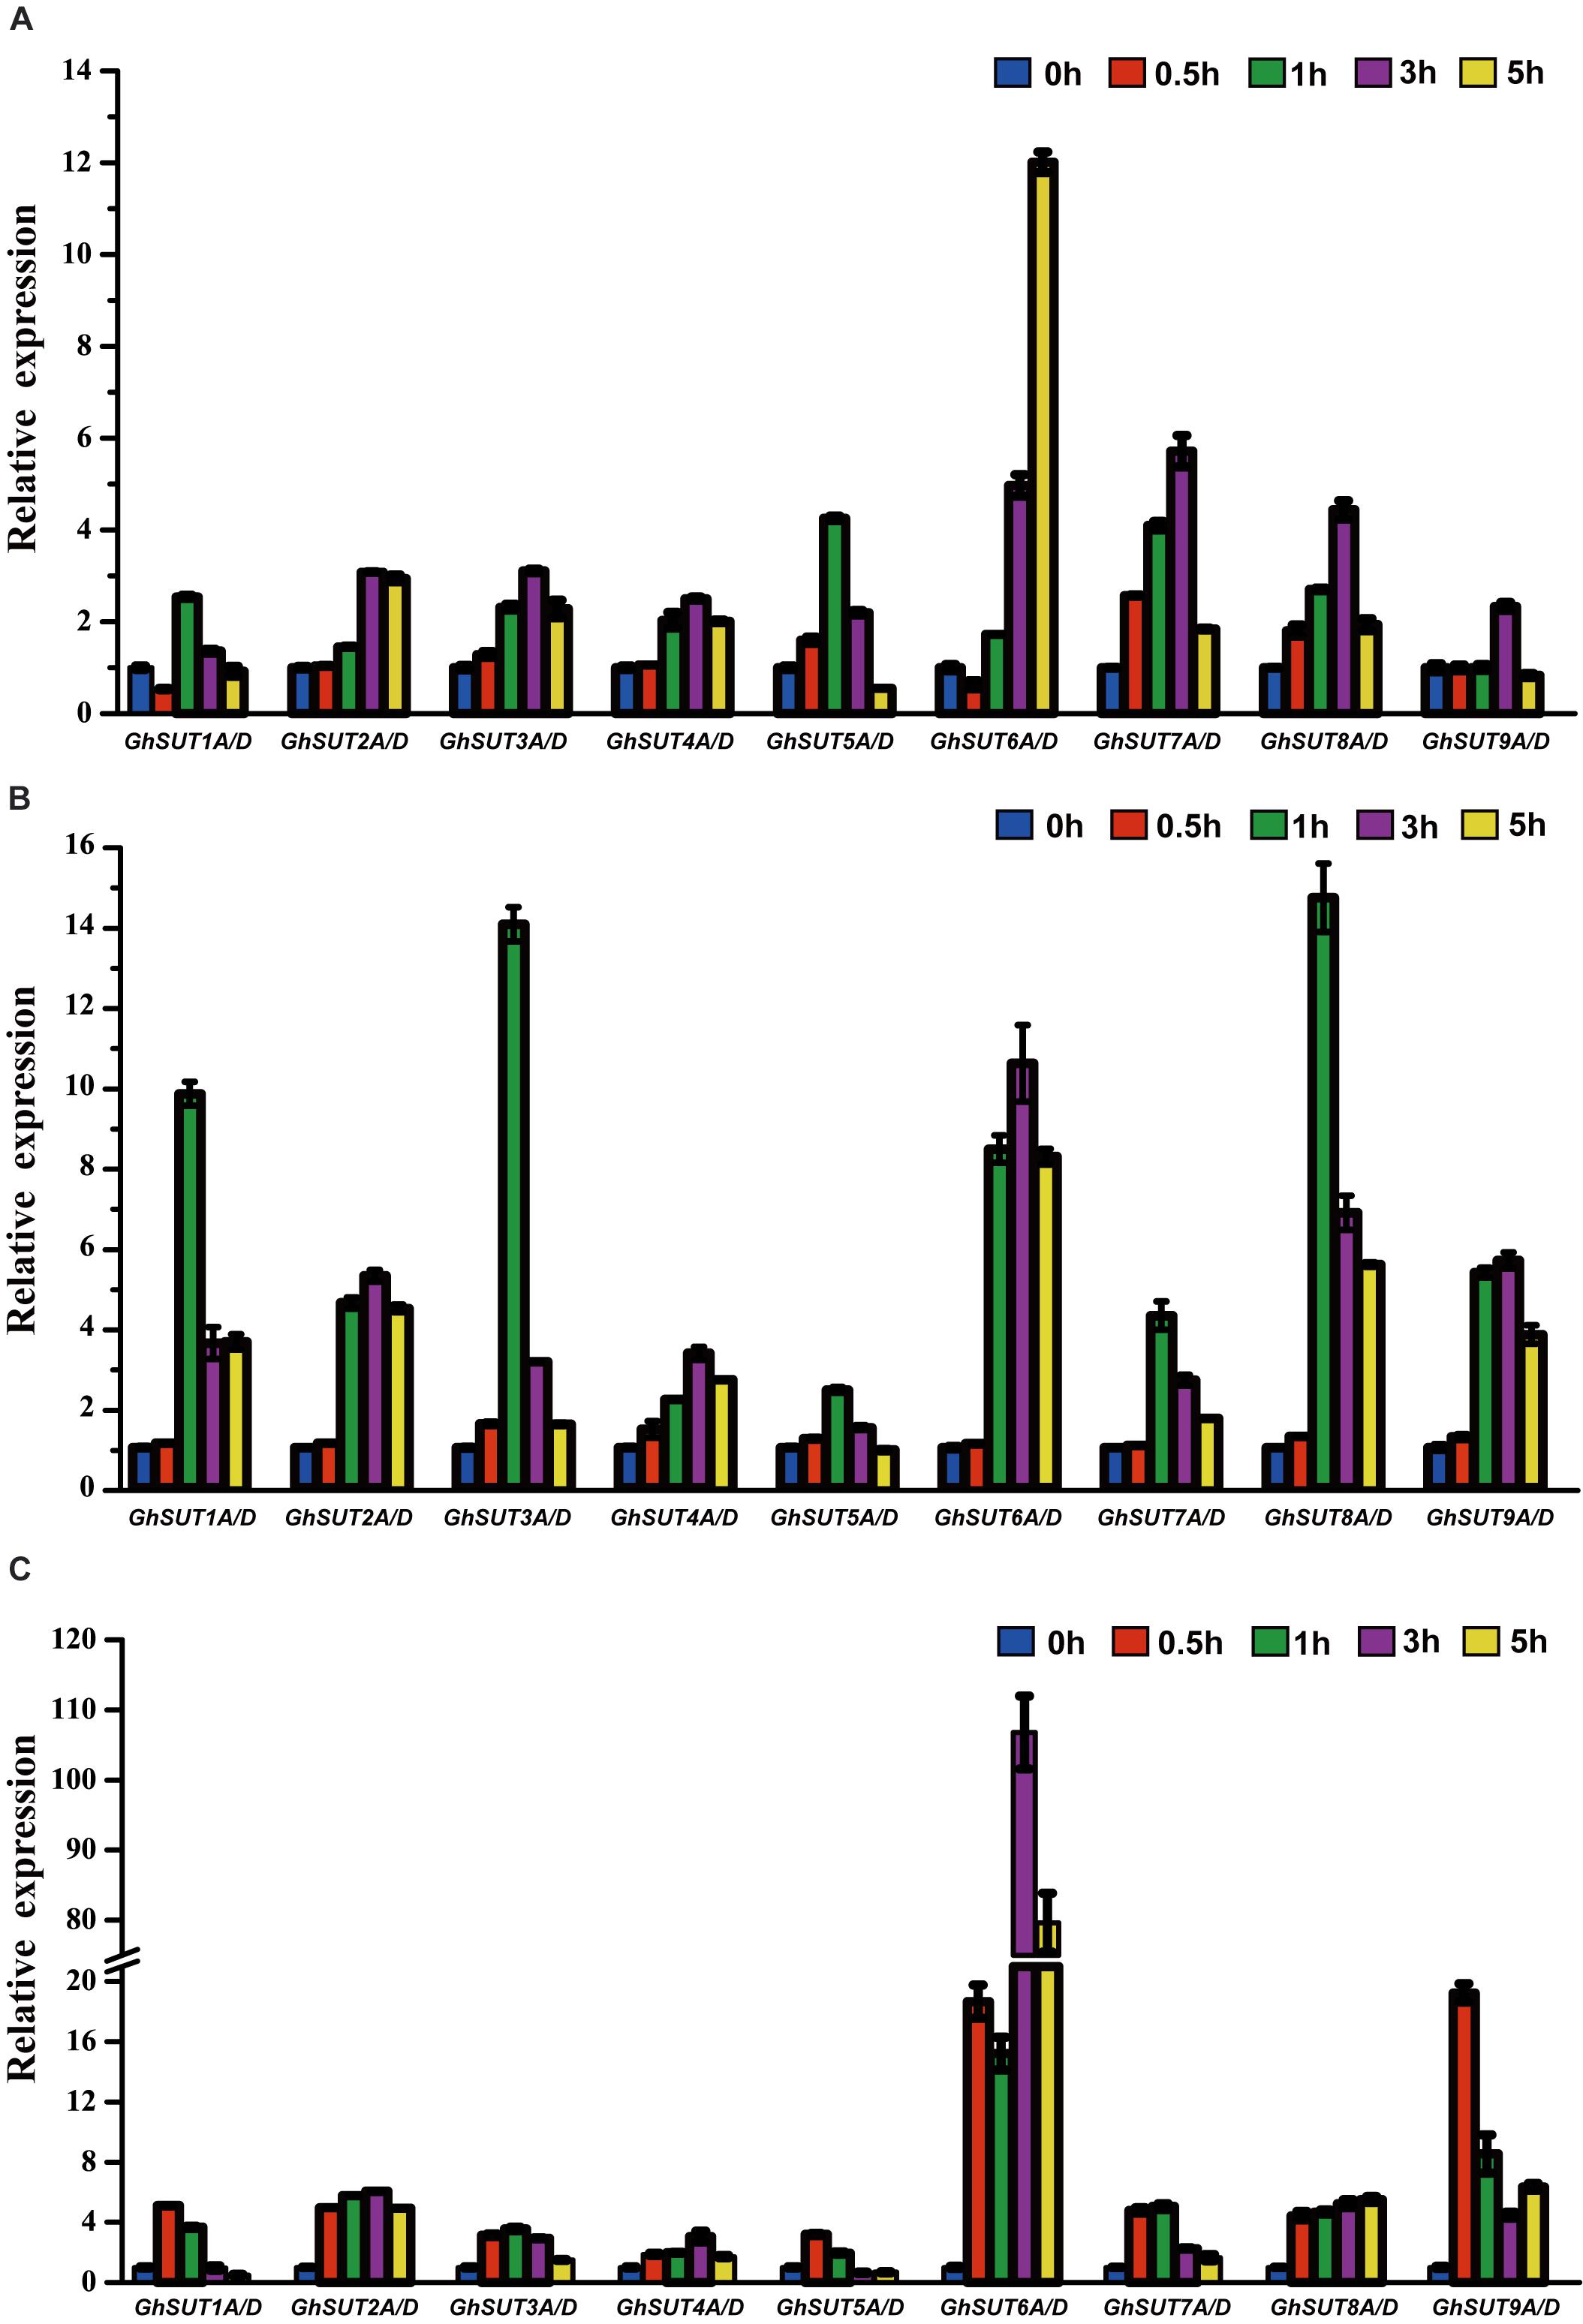
FIGURE 7. Relative transcriptional expression levels of G. hirsutum SUT genes based on qRT-PCR under different plant hormones treatments: (A) IAA; (B) GA; (C) SA. Transcript levels of each gene were calculated by the 2-ΔΔCt method and expressed relative to the non-stressed values (0 h) set to 1. GhHis3 was used as a housekeeping gene. Error bars represent the standard deviation of three independent experiments.
Discussion
SUT genes have been characterized in various plant species, including Arabidopsis (Srivastava et al., 2008; Li et al., 2012), rice (Aoki et al., 2003; Sun et al., 2010), maize (Usha, 2015), hexaploid wheat (Deol et al., 2013), Medicago truncatula (Doidy et al., 2012), Populus (Frost et al., 2012), cacao (Li et al., 2014b), and Saccharum (Zhang et al., 2016). In addition, recent findings have demonstrated that SUT proteins play crucial roles in cotton fiber elongation (Ruan et al., 2001; Zhang et al., 2017). No related studies, however, have focused on the genome-wide characterization and stress responses of this family in cotton. Comprehensive identification and analysis of the SUT gene family in cotton is needed to understand the evolution and functional role of this gene family as a foundation for future research.
Conservation and Divergence of G. hirsutum SUT Genes During Evolution
SUTs, which mediate sucrose translocation from source tissues to sink cells, are characterized by 12 transmembrane-spanning domains in the cytoplasm (Aoki et al., 2003; Usha, 2015). Previous studies have revealed that a histidine residue in the extracellular loop is involved in sucrose binding and transportation (Deol et al., 2013; Zhang et al., 2013). Consistent with this earlier report, we also observed this structure in G. hirsutum, which implies that the 12 transmembrane-spanning domains and the histidine residue are highly conserved across different species (Supplementary Figure S1). Additionally, the dileucine-like motif LXXLL is present in the cytoplasmic N-terminal of group SUT4 members and facilitates the storage and transport of sucrose to the vacuolar membrane (Deol et al., 2013; Zhang et al., 2013). In our study, however, the motif LRQLX was located at this position, which differed by several amino acid residues compared with reported SUTs, suggesting that gene locus mutations and chromosomal recombinations and rearrangements have caused sequences to diverge after gene duplication events during upland cotton evolution. Exon/intron characteristics provide significant information on the evolution of a gene family (Lynch, 2002; Del Campo et al., 2013). In our study, exon numbers and structural patterns of SUT genes in the same group were highly similar, which suggested that genes in the same subfamily shared a common ancestor and have similar biological functions.
Biological evolution has played an important role in the history of life during the 4.6 billion years of the Earth’s existence. A- and D-genome diploid cotton species, originating, respectively, in Africa and Mexico, diverged approximately 5–10 MYA (Paterson et al., 2012). G. hirsutum, an allotetraploid species derived from the hybridization and chromosome doubling of an ancestral A-genome species resembling G. arboreum (A2) and a progenitor D-genome species resembling G. raimondii (D5), emerged approximately 1–2 MYA (Paterson et al., 2012; Li et al., 2015).
On the basis of phylogenetic relationships, previous authors have categorized plant SUT genes in two different ways, dividing them into five groups (SUT1, SUT2, SUT3, SUT4, and SUT5) (Kühn and Grof, 2010; Deol et al., 2013; Milne et al., 2013; Li et al., 2014b; Zhang et al., 2016) or alternatively three types (I, II, and III) (Aoki et al., 2003; Reinders et al., 2012; Zhang et al., 2013; Xu et al., 2018). In regard to the two classifications, we found that group SUT1 corresponds to type I, SUT2 belongs to type II, and SUT3, SUT4, and SUT5 are included in type III. The results of our study are consistent with the first classification scheme, which is more applicable to dicots and monocots (Figure 1). As SUT3 and SUT5 are specific to monocots, all 36 SUT genes from G. arboreum, G. raimondii, and G. hirsutum fall into SUT1, SUT2, and SUT4. Interestingly, only one member each of SUT2 and SUT4 are present in other analyzed plant species, whereas each of the three Gossypium species contain at least two SUT genes and may have undergone specific expansion caused by gene duplication. Our collinearity analysis revealed that two segmental duplication events have contributed to gene amplification in the two diploid cotton groups over the course of evolution (Figure 2). At the same time, the average divergence time of duplicated SUT genes in the two diploid cotton was estimated as 69.98 MYA, which implies that segmental duplications events may have occurred before the divergence of the A- and D-genome diploid and thus lead to the expansion of SUT2 and SUT4 groups in G. arboreum and G. raimondii (Table 2 and Supplementary Table S5). After natural polyploidization, the SUT loci were transferred from the two diploid genomes to the subgenomes of new tetraploid cotton indicated GhSUTs were conserved and subjected to strong purifying selection pressure. Consequently, segmental duplication and polyploidy have been the predominant contributors to the expansion of SUT genes in cotton, which is similar to findings reported for SOD and SWEET gene families (Wang et al., 2017; Li et al., 2018). Although evidence for tandem duplication was not found in our study, that process is also a basic driving force for gene expansion in genomic evolution (Flagel and Wendel, 2009). At the same time, phylogenetic analysis has revealed a close relationship between cacao and cotton, both of which belong to Malvaceae and have diverged from a common ancestor (Wang et al., 2012; Li et al., 2014a).
Functional Role of G. hirsutum SUT Genes
Gene expression profiling can provide crucial clues to gene functions. We investigated the expressions of nine paralogous gene pairs in 11 different tissues of G. hirsutum by qRT-PCR. Most of the analyzed SUT genes were predominantly expressed in floral and fiber development processes. For example, GhSUT1A/D and GhSUT2A/D had very high expression levels in floral organs. The mutant of their ortholog AtSUC9 is also abundantly expressed in flowers and promotes flowering under short-day conditions in Arabidopsis (Sivitz et al., 2007), which implies that GhSUT1A/D and GhSUT2A/D had functions in floral development similar to those of AtSUC9. In addition, GhSUT4A/D, GhSUT7A/D, GhSUT8A/D, GhSUT9A/D, GhSUT3A/D, and GhSUT5A/D were significantly expressed in 15 DPA and 20 DPA fibers. Only GhSUT6A/D displayed high expression levels during cotton fiber initiation. As is well known, fibers are the main product of cotton and the focus of genetic breeding research. A recent study has revealed that suppression of the expression of GhSCP2D, which encodes a putative sterol carrier protein, dramatically increases the expression of GhSUT9A/D (Locus ID: Gh_A13G1022/Gh_D13G1273) during fiber elongation stages, thus indicating that SUT genes play significant roles in cotton fiber cell elongation (Ruan et al., 2001; Zhang et al., 2017). Despite these findings, the molecular mechanism underlying the function of G. hirsutm SUT genes in fiber development is unclear and requires further investigation.
In addition to their association with plant growth, SUT genes are involved in the control of plant responses to abiotic stresses, biotic stresses, and phytohormones (Chincinska et al., 2008; Frost et al., 2012; Xu et al., 2018). For example, the OsSUT2 gene is significantly up-regulated upon exposure to drought and salinity stress in rice (Ibraheem et al., 2011). In poplar, RNAi-PtaSUT4 plants exhibit reduced rates of water uptake and delayed wilting in response to acute, short-term drought stress (Frost et al., 2012). Over-expression of the NtSUT1 gene can alleviate inhibition of root elongation and confer higher growth capacity in aluminum-treated tobacco cells (Sameeullah et al., 2013; Kariya et al., 2017). StSUT4 expression in wild-type potato plants is prominently induced by treatment with GA3 and the ethylene precursor ethephon (Chincinska et al., 2008). Furthermore, the BnSUC1-2 gene is dramatically induced by SA, GA, and heat treatments in oilseed rape (Jian et al., 2016). In the present study, we analyzed G. hirsutum SUT gene expression patterns in response to four different abiotic and three phytohormone stress treatments. We found that most SUT genes were up-regulated under salt treatment (Figure 6). Physiologically, salinity, mainly from NaCl, can directly affect the absorption of water and nutrients, in turn reducing crop growth and yield. Although no salt-response elements were detected in SUT promoter regions, our results suggest that SUTs play essential roles in salt response. In a previous study, G. hirsutum SUT genes under drought stress exhibited various expression patterns consistent with those of SUTs in three Saccharum species (Zhang et al., 2016), and this phenomenon was also observed in our study. These results suggest that SUT genes are involved in distinct regulatory networks and have diverse functions in response to drought treatment. In addition, expression levels of almost all SUT genes were induced by different phytohormone treatments (Figure 7), which indicates that these genes likely participate in phytohormone-related signal responses. Notably, hormone stress-responsive cis-regulatory elements were found in most G. hirsutum SUT promoters (Figure 5), which provides further support for the likelihood that G. hirsutum SUT genes have phytohormone stress tolerance-related functions. In particular, the GhSUT6A/D gene pair of group SUT1 was intensively up-regulated under abiotic and phytohormone stresses compared with other SUT genes. Because few studies have been performed on stress-related functions of GhSUT6 orthologs in Arabidopsis and rice, the putative stress response function of GhSUT6 should be a focus. Taken together, these results provide novel clues regarding G. hirsutum SUT genes enhancement of tolerance to various stresses. Further analyses are needed to explore the possible relationship between sucrose transport and the physiological functions of G. hirsutum SUT genes triggered by different stresses.
Conclusion
In this study, we performed a genome-wide analysis of SUT gene family members in G. hirsutum, including their classification, structure, evolutionary relationships, chromosomal location, expression patterns in diverse tissues, and transcriptional changes in response to a range of abiotic stresses and exogenous phytohormones. First, 18 SUT genes were identified in G. hirsutum and classified into three groups according to their phylogenetic relationships. G. hirsutum SUT genes within the same group displayed similar exon/intron characteristics. In addition, homologous genes in At and Dt subgenomes of the tetraploid cotton G. hirsutum and the two diploid cottons G. arboreum and G. raimondii exhibited one-to-one relationships. Furthermore, we found that the duplicated genes in the three cotton species have evolved through purifying selection, which suggest that SUT genes are highly conserved in these Gossypium species. Second, expression analyses in different tissues indicated that SUT genes may play significant roles in cotton fiber elongation. Third, analyses of cis-acting regulatory elements in promoter regions and expression profiling under different abiotic stress and exogenous phytohormone conditions implied that SUT genes, especially GhSUT6A/D, may participate in plant responses to diverse abiotic stresses and phytohormones. Our findings lay a foundation for future studies of the functions of SUT genes in plant stress response. In addition, these results may aid the breeding of new cotton varieties with enhanced stress tolerance and accelerate cotton genetic research.
Author Contributions
DY, XM, and WL conceived and designed the research. KS, ZR, FZ, CS, and XZ performed the experiments. XP, YL, and KH prepared the materials. WL, KS, ZR, and ZW analyzed the data. WL and ZR wrote the paper. DY, XM, and KS revised the manuscript. All authors read and approved the final manuscript.
Funding
This work was supported by the National Key R&D Program for Crop Breeding (2016YFD0100306), and the Key Project of Science and Technology of Henan Province of China (182102110306).
Conflict of Interest Statement
The authors declare that the research was conducted in the absence of any commercial or financial relationships that could be construed as a potential conflict of interest.
Acknowledgments
We acknowledge Zhiqiang Zhang and Wei Liu (Agronomy College, Henan Agricultural University, Zhengzhou, China) for revising the original manuscript and Peng Huo (Zhengzhou Research Center, Institute of Cotton Research of CAAS, Zhengzhou, China) for technical assistance.
Supplementary Material
The Supplementary Material for this article can be found online at: https://www.frontiersin.org/articles/10.3389/fgene.2018.00494/full#supplementary-material
FIGURE S1 | Alignment of amino acid sequences of all deduced SUTs in G. hirsutum. The 12 transmembrane domains are shown in bold and designated as Ito XII. The marked consensus sequence is derived from the highly conserved region of known functional plant SUTs, where 1 = I, L or V. The putative vacuolar targeting dileucine motif is shown in a red box.
FIGURE S2 | Chromosomal distribution of SUT genes in G. hirsutum. The red dotted lines link paralogs located on At and Dt subgenomes. A megabase is provided.
TABLE S1 | Sequences of qRT-PCR primers used to amplify nine SUT paralogous gene pairs in G. hirsutum and the GhHis3 internal reference gene.
TABLE S2 | Details on G. raimondii and G. arboreum SUT genes.
TABLE S3 | Information on SUT genes in other species used in the study.
TABLE S4 | The distribution of SUT family members in three monocot and seven dicot species.
TABLE S5 | Ka/Ks analysis of duplicated SUT genes in G. arboreum and G. raimondii.
Footnotes
- ^http://rice.plantbiology.msu.edu/index.shtml
- ^https://phytozome.jgi.doe.gov/pz/portal.html#!info?alias=Org_Sbicolor
- ^https://phytozome.jgi.doe.gov/pz/portal.html#!info?alias=Org_Bdistachyon
- ^cocoa-genome-hub.southgreen.fr/download
- ^http://www.genoscope.cns.fr/externe/GenomeBrowser/Vitis/
- ^ftp://ftp.solgenomics.net/genomes/Solanum_lycopersicum/annotation/
- ^http://www.arabidopsis.org
- ^http://pfam.xfam.org/search#searchBatchBlock
- ^http://chibba.agtec.uga.edu/duplication/mcscan/
- ^https://www.ncbi.nlm.nih.gov/tools/primer-blast/index.cgi?LINK_LOC=BlastHome
References
Aoki, N., Hirose, T., Scofield, G. N., Whitfeld, P. R., and Furbank, R. T. (2003). The sucrose transporter gene family in rice. Plant Cell Physiol. 44, 223–232. doi: 10.1093/pcp/pcg030
Baud, S., Wuillème, S., Lemoine, R., Kronenberger, J., Caboche, M., Lepiniec, L., et al. (2005). The AtSUC5 sucrose transporter specifically expressed in the endosperm is involved in early seed development in Arabidopsis. Plant J. 43, 824–836. doi: 10.1111/j.1365-313X.2005.02496.x
Bustin, S. A., and Mueller, R. (2005). Real-time reverse transcription PCR (qRT-PCR) and its potential use in clinical diagnosis. Clin. Sci. 109, 365–379. doi: 10.1042/CS20050086
Chincinska, I., Gier, K., Krügel, U., Liesche, J., He, H., Grimm, B., et al. (2013). Photoperiodic regulation of the sucrose transporter StSUT4 affects the expression of circadian-regulated genes and ethylene production. Front. Plant Sci. 4:26. doi: 10.3389/fpls.2013.00026
Chincinska, I. A., Liesche, J., Krügel, U., Michalska, J., Geigenberger, P., Grimm, B., et al. (2008). Sucrose transporter StSUT4 from potato affects flowering, tuberization, and shade avoidance response. Plant Physiol. 146, 515–528. doi: 10.1104/pp.107.112334
Clewley, J. P., and Arnold, C. (1997). MEGALIGN. The multiple alignment module of LASERGENE. Methods Mol. Biol. 70, 119–129.
Cui, Y., Zhao, Y., Wang, Y., Liu, Z., Ijaz, B., Huang, Y., et al. (2017). Genome-wide identification and expression analysis of the biotin carboxyl carrier subunits of heteromeric acetyl-CoA carboxylase in Gossypium. Front. Plant Sci. 8:624. doi: 10.3389/fpls.2017.00624
Del Campo, E. M., Casano, L. M., and Barreno, E. (2013). Evolutionary implications of intron-exon distribution and the properties and sequences of the RPL10A gene in eukaryotes. Mol. Phylogenet. Evol. 66, 857–867. doi: 10.1016/j.ympev.2012.11.013
Deol, K. K., Mukherjee, S., Gao, F., Brûlé-Babel, A., Stasolla, C., and Ayele, B. T. (2013). Identification and characterization of the three homeologues of a new sucrose transporter in hexaploid wheat (Triticum aestivum L.). BMC Plant Biol. 13:181. doi: 10.1186/1471-2229-13-181
Doidy, J., van Tuinen, D., Lamotte, O., Corneillat, M., Alcaraz, G., and Wipf, D. (2012). The Medicago truncatula sucrose transporter family: characterization and implication of key members in carbon partitioning towards arbuscular mycorrhizal fungi. Mol. Plant 5, 1346–1358. doi: 10.1093/mp/sss079
Eom, J.-S., Nguyen, C. D., Lee, D.-W., Lee, S.-K., and Jeon, J.-S. (2016). Genetic complementation analysis of rice sucrose transporter genes in Arabidopsis SUC2 mutant atsuc2. J. Plant Biol. 59, 231–237. doi: 10.1007/s12374-016-0015-6
Flagel, L. E., and Wendel, J. F. (2009). Gene duplication and evolutionary novelty in plants. New Phytol. 183, 557–564. doi: 10.1111/j.1469-8137.2009.02923.x
Frost, C. J., Nyamdari, B., Tsai, C. J., and Harding, S. A. (2012). The tonoplast-localized sucrose transporter in Populus (PtaSUT4) regulates whole-plant water relations, responses to water stress, and photosynthesis. PLoS One 7:e44467. doi: 10.1371/journal.pone.0044467
Guo, A. Y., Zhu, Q. H., Chen, X., and Luo, J. C. (2007). [GSDS: a gene structure display server]. Yi Chuan 29, 1023–1026. doi: 10.1360/yc-007-1023
Hackel, A., Schauer, N., Carrari, F., Fernie, A. R., Grimm, B., and Kühn, C. (2006). Sucrose transporter LeSUT1 and LeSUT2 inhibition affects tomato fruit development in different ways. Plant J. Cell Mol. Biol. 45, 180–192. doi: 10.1111/j.1365-313X.2005.02572.x
Hirose, T., Zhang, Z., Miyao, A., Hirochika, H., Ohsugi, R., and Terao, T. (2010). Disruption of a gene for rice sucrose transporter, OsSUT1, impairs pollen function but pollen maturation is unaffected. J. Exp. Bot. 61, 3639–3646. doi: 10.1093/jxb/erq175
Ibraheem, O., Dealtry, G., Roux, S., and Bradley, G. (2011). The effect of drought and salinity on the expressional levels of sucrose transporters in rice (Oryza sativa Nipponbare) cultivar plants. Plant Omics 4, 68–74.
Jian, H., Lu, K., Yang, B., Wang, T., Zhang, L., Zhang, A., et al. (2016). Genome-wide analysis and expression profiling of the SUC and SWEET gene families of sucrose transporters in oilseed rape (Brassica napus L.). Front. Plant Sci. 7:1464. doi: 10.3389/fpls.2016.01464
Kariya, K., Sameeullah, M., Sasaki, T., and Yamamoto, Y. (2017). Overexpression of the sucrose transporter gene NtSUT1 alleviates aluminum-induced inhibition of root elongation in tobacco (Nicotiana tabacum L.). Soil Sci. Plant Nutr. 63, 45–54. doi: 10.1080/00380768.2017.1283646
Krzywinski, M., Schein, J., Birol,Ý., Connors, J., Gascoyne, R., Horsman, D., et al. (2009). Circos: an information aesthetic for comparative genomics. Genome Res. 19, 1639–1645. doi: 10.1101/gr.092759.109
Kühn, C., and Grof, C. P. (2010). Sucrose transporters of higher plants. Curr. Opin. Plant Biol. 13, 288–298. doi: 10.1016/j.pbi.2010.02.001
Lalonde, S., Wipf, D., and Frommer, W. B. (2004). Transport mechanisms for organic forms of carbon and nitrogen between source and sink. Annu. Rev. Plant Biol. 55, 341–372. doi: 10.1146/annurev.arplant.55.031903.141758
Li, F., Fan, G., Lu, C., Xiao, G., Zou, C., Kohel, R. J., et al. (2015). Genome sequence of cultivated Upland cotton (Gossypium hirsutum TM-1) provides insights into genome evolution. Nat. Biotechnol. 33, 524–530. doi: 10.1038/nbt.3208
Li, F., Fan, G., Wang, K., Sun, F., Yuan, Y., Song, G., et al. (2014a). Genome sequence of the cultivated cotton Gossypium arboreum. Nat. Genet. 46, 567–572. doi: 10.1038/ng.2987
Li, F., Wu, B., Qin, X., Yan, L., Hao, C., Tan, L., et al. (2014b). Molecular cloning and expression analysis of the sucrose transporter gene family from Theobroma cacao L. Gene 546, 336–341. doi: 10.1016/j.gene.2014.05.056
Li, W., Ren, Z., Wang, Z., Sun, K., Pei, X., Liu, Y., et al. (2018). Evolution and stress responses of Gossypium hirsutum SWEET genes. Int. J. Mol. Sci. 19:769. doi: 10.3390/ijms19030769
Li, Y., Li, L. L., Fan, R. C., Peng, C. C., Sun, H. L., Zhu, S. Y., et al. (2012). Arabidopsis sucrose transporter SUT4 interacts with cytochrome b5-2 to regulate seed germination in response to sucrose and glucose. Mol. Plant 5, 1029–1041. doi: 10.1093/mp/sss001
Liao, W. B., Li, Y. Y., Lu, C., and Peng, M. (2016). Expression of sucrose metabolism and transport genes in cassava petiole abscission zones in response to water stress. Biol. Plant. 61, 219–226. doi: 10.1007/s10535-016-0658-7
Lynch, M. (2002). Intron evolution as a population-genetic process. Proc. Natl. Acad. Sci. U.S.A. 99, 6118–6123. doi: 10.1073/pnas.092595699
Milne, R. J., Byrt, C. S., Patrick, J. W., and Grof, C. P. L. (2013). Are sucrose transporter expression profiles linked with patterns of biomass partitioning in Sorghum phenotypes? Front. Plant Sci. 4:223. doi: 10.3389/fpls.2013.00223
Pang, C. Y., Wang, H., Pang, Y., Xu, C., Jiao, Y., Qin, Y. M., et al. (2010). Comparative proteomics indicates that biosynthesis of pectic precursors is important for cotton fiber and Arabidopsis root hair elongation. Mol. Cell. Proteomics 9, 2019–2033. doi: 10.1074/mcp.M110.000349
Paterson, A. H., Wendel, J. F., Gundlach, H., Guo, H., Jenkins, J., Jin, D., et al. (2012). Repeated polyploidization of Gossypium genomes and the evolution of spinnable cotton fibres. Nature 492, 423–427. doi: 10.1038/nature11798
Payyavula, R. S., Tay, K. H. C., Tsai, C. J., and Harding, S. A. (2011). The sucrose transporter family in Populus: the importance of a tonoplast PtaSUT4 to biomass and carbon partitioning. Plant J. 65, 757–770. doi: 10.1111/j.1365-313X.2010.04463.x
Reinders, A., Sivitz, A. B., and Ward, J. M. (2012). Evolution of plant sucrose uptake transporters. Front. Plant Sci. 3:22. doi: 10.3389/fpls.2012.00022
Riesmeier, J. W., Willmitzer, L., and Frommer, W. B. (1992). Isolation and characterization of a sucrose carrier cDNA from spinach by functional expression in yeast. EMBO J. 11, 4705–4713. doi: 10.1002/j.1460-2075.1992.tb05575.x
Ruan, Y. L., Llewellyn, D. J., and Furbank, R. T. (2001). The control of single-celled cotton fiber elongation by developmentally reversible gating of plasmodesmata and coordinated expression of sucrose and K+ transporters and expansin. Plant Cell 13, 47–60.
Sameeullah, M., Sasaki, T., and Yamamoto, Y. (2013). Sucrose transporter NtSUT1 confers aluminum tolerance on cultured cells of tobacco (Nicotiana tabacum L.). Soil Sci. Plant Nutr. 59, 756–770. doi: 10.1080/00380768.2013.830230
Senchina, D. S., Alvarez, I., Cronn, R. C., Liu, B., Rong, J., Noyes, R. D., et al. (2003). Rate variation among nuclear genes and the age of polyploidy in Gossypium. Mol. Biol. Evol. 20, 633–643. doi: 10.1093/molbev/msg065
Siao, W., Chen, J.-Y., Hsiao, H.-H., Chung, P., and Wang, S.-J. (2011). Characterization of OsSUT2 expression and regulation in germinating embryos of rice seeds. Rice 4, 39–49. doi: 10.1007/s12284-011-9063-1
Sivitz, A. B., Reinders, A., Johnson, M. E., Krentz, A. D., Grof, C. P., Perroux, J. M., et al. (2007). Arabidopsis sucrose transporter AtSUC9. High-affinity transport activity, intragenic control of expression, and early flowering mutant phenotype. Plant Physiol. 143, 188–198. doi: 10.1104/pp.106.089003
Sivitz, A. B., Reinders, A., and Ward, J. M. (2008). Arabidopsis sucrose transporter AtSUC1 is important for pollen germination and sucrose-induced anthocyanin accumulation. Plant Physiol. 147, 92–100. doi: 10.1104/pp.108.118992
Srivastava, A. C., Ganesan, S., Ismail, I. O., and Ayre, B. G. (2008). Functional characterization of the Arabidopsis AtSUC2 sucrose/H+ symporter by tissue-specific complementation reveals an essential role in phloem loading but not in long-distance transport. Plant Physiol. 148, 200–211. doi: 10.1104/pp.108.124776
Srivastava, A. C., Ganesan, S., Ismail, I. O., and Ayre, B. G. (2009). Effective carbon partitioning driven by exotic phloem-specific regulatory elements fused to the Arabidopsis thaliana AtSUC2 sucrose-proton symporter gene. BMC Plant Biol. 9:7. doi: 10.1186/1471-2229-9-7
Sun, Y., Reinders, A., LaFleur, K. R., Mori, T., and Ward, J. M. (2010). Transport activity of rice sucrose transporters OsSUT1 and OsSUT5. Plant Cell Physiol. 51, 114–122. doi: 10.1093/pcp/pcp172
Thomasl, S., and Davidm, B. (2010). Current perspectives on the regulation of whole-plant carbohydrate partitioning. Plant Sci. 178, 341–349. doi: 10.3389/fpls.2014.00516
Ulloa, M., Saha, S., Jenkins, J. N., Meredith, W. R., Mccarty, J. C., and Stelly, D. M. (2005). Chromosomal assignment of RFLP linkage groups harboring important QTLs on an intraspecific cotton (Gossypium hirsutum L.) Joinmap. J. Hered. 96, 132–144. doi: 10.1093/jhered/esi020
Usha, B. (2015). Diverse expression of sucrose transporter gene family in Zea mays. J. Genet. 94, 151–154. doi: 10.1007/s12041-015-0491-3
Wang, J., Sun, N., Deng, T., Zhang, L., and Zuo, K. (2014). Genome-wide cloning, identification, classification and functional analysis of cotton heat shock transcription factors in cotton (Gossypium hirsutum). BMC Genomics 15:961. doi: 10.1186/1471-2164-15-961
Wang, K., Wang, Z., Li, F., Ye, W., Wang, J., Song, G., et al. (2012). The draft genome of a diploid cotton Gossypium raimondii. Nat. Genet. 44, 1098–1103. doi: 10.1038/ng.2371
Wang, W., Zhang, X., Deng, F., Yuan, R., and Shen, F. (2017). Genome-wide characterization and expression analyses of superoxide dismutase (SOD) genes in Gossypium hirsutum. BMC Genomics 18:376. doi: 10.1186/s12864-017-3768-5
Wang, Y., Li, J., and Paterson, A. H. (2013). MCScanX-transposed: detecting transposed gene duplications based on multiple colinearity scans. Bioinformatics 29, 1458–1460. doi: 10.1093/bioinformatics/btt150
Weise, A., Barker, L., Kühn, C., Lalonde, S., Buschmann, H., Frommer, W. B., et al. (2000). A new subfamily of sucrose transporters, SUT4, with low affinity/high capacity localized in enucleate sieve elements of plants. Plant Cell 12, 1345–1355. doi: 10.1105/tpc.12.8.1345
Wendel, J. F., and Cronn, R. C. (2002). Polyploidy and the evolutionary history of cotton. Adv. Agron. 78, 139–186. doi: 10.1016/S0065-2113(02)78004-8
Xu, Q., Chen, S., Yunjuan, R., Chen, S., and Liesche, J. (2018). Regulation of sucrose transporters and phloem loading in response to environmental cues. Plant Physiol. 176, 930–945. doi: 10.1104/pp.17.01088
Zhang, H., Zhang, S., Qin, G., Wang, L., Wu, T., Qi, K., et al. (2013). Molecular cloning and expression analysis of a gene for sucrose transporter from pear (Pyrus bretschneideri Rehd.) fruit. Plant Physiol. Biochem. 73, 63–69. doi: 10.1016/j.plaphy.2013.08.009
Zhang, Q., Hu, W., Zhu, F., Wang, L., Yu, Q., Ming, R., et al. (2016). Structure, phylogeny, allelic haplotypes and expression of sucrose transporter gene families in Saccharum. BMC Genomics 17:88. doi: 10.1186/s12864-016-2419-6
Zhang, T., Hu, Y., Jiang, W., Fang, L., Guan, X., Chen, J., et al. (2015). Sequencing of allotetraploid cotton (Gossypium hirsutum L. acc. TM-1) provides a resource for fiber improvement. Nat. Biotechnol. 33, 531–537. doi: 10.1038/nbt.3207
Zhang, Z., Li, J., Zhao, X., Wang, J., and Wong, K. S. (2006). KaKs_calculator: calculating ka and Ks through model selection and model averaging. Genomics Proteomics Bioinformatics 4, 259–263. doi: 10.1016/S1672-0229(07)60007-2
Zhang, Z., Ruan, Y. L., Zhou, N., Wang, F., Guan, X., Fang, L., et al. (2017). Suppressing a putative sterol carrier gene reduces plasmodesmal permeability and activates sucrose transporter genes during cotton fiber elongation. Plant Cell 29, 2027–2046. doi: 10.1105/tpc.17.00358
Keywords: cotton, sucrose transporter, phylogenetic relationship, expression profile, abiotic stress, phytohormone
Citation: Li W, Sun K, Ren Z, Song C, Pei X, Liu Y, Wang Z, He K, Zhang F, Zhou X, Ma X and Yang D (2018) Molecular Evolution and Stress and Phytohormone Responsiveness of SUT Genes in Gossypium hirsutum. Front. Genet. 9:494. doi: 10.3389/fgene.2018.00494
Received: 16 June 2018; Accepted: 04 October 2018;
Published: 23 October 2018.
Edited by:
Rogerio Margis, Universidade Federal do Rio Grande do Sul (UFRGS), BrazilReviewed by:
Wei Wu, Sun Yat-sen University, ChinaAlexandre Augusto Pereira Firmino, Embrapa Recursos Genéticos e Biotecnologia, Brazil
Copyright © 2018 Li, Sun, Ren, Song, Pei, Liu, Wang, He, Zhang, Zhou, Ma and Yang. This is an open-access article distributed under the terms of the Creative Commons Attribution License (CC BY). The use, distribution or reproduction in other forums is permitted, provided the original author(s) and the copyright owner(s) are credited and that the original publication in this journal is cited, in accordance with accepted academic practice. No use, distribution or reproduction is permitted which does not comply with these terms.
*Correspondence: Xiongfeng Ma, bWF4aW9uZ2ZlbmdAY2Fhcy5jbg== Daigang Yang, eWFuZ2RhaWdhbmdAY2Fhcy5jbg==
†These authors have contributed equally to this work