 Pierpaolo Maisano Delser1,2
 Metka Ravnik-Glavač3,4
 Paolo Gasparini5,6
 Damjan Glavač3*
 Massimo Mezzavilla5*
- 1Smurfit Institute of Genetics, Trinity College Dublin, Dublin, Ireland
- 2Department of Zoology, University of Cambridge, Cambridge, United Kingdom
- 3Department of Molecular Genetics, Institute of Pathology, Faculty of Medicine, University of Ljubljana, Ljubljana, Slovenia
- 4Institute of Biochemistry, Faculty of Medicine, University of Ljubljana, Ljubljana, Slovenia
- 5Institute for Maternal and Child Health, IRCCS “Burlo Garofolo”, Trieste, Italy
- 6Department of Medical, Surgical and Health Sciences, University of Trieste, Trieste, Italy
The Slovenian territory played a crucial role in the past serving as gateway for several human migrations. Previous studies used Slovenians as a source population to interpret different demographic events happened in Europe but not much is known about the genetic background and the demographic history of this population. Here, we analyzed genome-wide data from 96 individuals to shed light on the genetic role and history of the Slovenian population. Y chromosome diversity splits into two major haplogroups R1b and R1a with the latter suggesting a genetic contribution from the steppe. Slovenian individuals are more closely related to Northern and Eastern European populations than Southern European populations even though they are geographically closer. This pattern is confirmed by an admixture and clustering analysis. We also identified a single stream of admixture events between the Slovenians with Sardinians and Russians around ∼2630 BCE (2149-3112). Using ancient samples, we found a significant admixture in Slovenians using Yamnaya and the early Neolithic Hungarians as sources, dated around ∼1762 BCE (1099-2426) suggesting a strong contribution from the steppe to the foundation of the observed modern genetic diversity. Finally, we looked for signals of selection in candidate variants and we found significant hits in HERC2 and FADS responsible for blue eye color and synthesis of long-chain unsaturated fatty acids, respectively, when Slovenians were compared to Southern Europeans. While the comparison was done with Eastern Europeans, we identified significant signals in PKD2L1 and IL6R which are genes associated with taste and coronary artery disease, respectively.
Introduction
The Slovenian territory is geographically located between the Alps, the Adriatic Sea and the Pannonian basin and as such it could have been used as a gateway for different populations over several periods of time. However, the presence of geographical and possibly cultural barriers could have led to a more puzzling role for this region. The territory of modern day Slovenia was settled during the 6th and 7th centuries AD by different Slavic tribes from at least two different directions: one from the north and one from the east (Grafenauer, 1950). The origin of the present-day Slovenian population and their language is still debate between different theories regarding the Slavic migration and settlement (Grafenauer, 1950; Žužek, 2007). Indeed, there are several hypotheses about a South Slavic influence or a West Slavic origin followed by a South Slavic contribution (Grafenauer, 1950; Bezljaj, 1967; Žužek, 2007). However, this background gives us only little clues regarding the genetic features of the founder pool.
Previous genetic studies were only based on Y chromosome variation (Zupan et al., 2013) showing strong affinity of the Slovenians with West Slavic populations. However, a fine characterization of the Slovenia population using genome wide data is missing even though this population was used in previous studies (Esko et al., 2013). Therefore, a gap is left on what we know about the history and the role of the Slovenian population in the past. Furthermore, the availability of ancient genomes during the last years empowered our ability to better understand the history of modern and past populations (Haber et al., 2016); in particular several papers revealed a significant contribution of Yamnaya population to Europeans (Haak et al., 2015). According to the authors, the steppe ancestry persisted in all sampled central Europeans until at least 3,000 years ago, and it is equally distributed in present-day Europeans, providing also evidences for a steppe-origin of the Indo-European languages (Haak et al., 2015).
All these elements highlight the necessity of a broader and more comprehensive genetic study on Slovenian population. Outcomes of this kind of study could be useful to several disciplines and not only for population genetics and linguistics. For example, in the context of genetic epidemiology, describing the genetic landscape of this population would be beneficial to understand the genetic background of disease-related loci and their distribution; in fact Slovenians show evidence of familial hypercholesterolemia (3.1%) (Catapano et al., 2016), a disease characterized by increased risk of coronary heart disease. A recent report also showed that more than 10% of women in Slovenia are affected by heart or circulation problems (Townsend et al., 2016).
Therefore, our aims are to provide (i) a detailed characterization of the genetic structure of Slovenians in a broader European context using both Y chromosome and autosomal data, (ii) a description of the past and present admixture pattern, and (iii) a survey of variants putatively under selection and associated with different traits/diseases. For these purposes, we used genotype data from 96 Slovenian individuals and we analyzed them together with previously published modern and ancient samples.
Materials and Methods
Samples Data and QC
Overall, 96 samples ranging from Slovenian littoral to Lower Styria were genotyped for 713,599 markers using the OmniExpress 24-V1 BeadChips (Figure 1), genetic data were obtained from Esko et al. (2013). After removing related individuals, 92 samples were left. The Slovenian dataset has been subsequently merged with the Human Origin dataset (Lazaridis et al., 2016) for a total of 2163 individuals. Only population with a minimum samples size of 10 individuals were retained and related individuals were discarded (PI_HAT cut-off of 0.125 in PLINK Purcell et al., 2007). The final dataset includes 1116 individuals grouped in 55 populations distributed worldwide (Slovenia_HO dataset). Finally, a subset including only European populations was also created and it groups 443 individuals from 20 populations (Slovenian_HO_EU). We also generated a dataset containing ancient genomes form Haak et al. (2015) (Slovenian_AG). Additional details can be found in Supplementary Table 1.
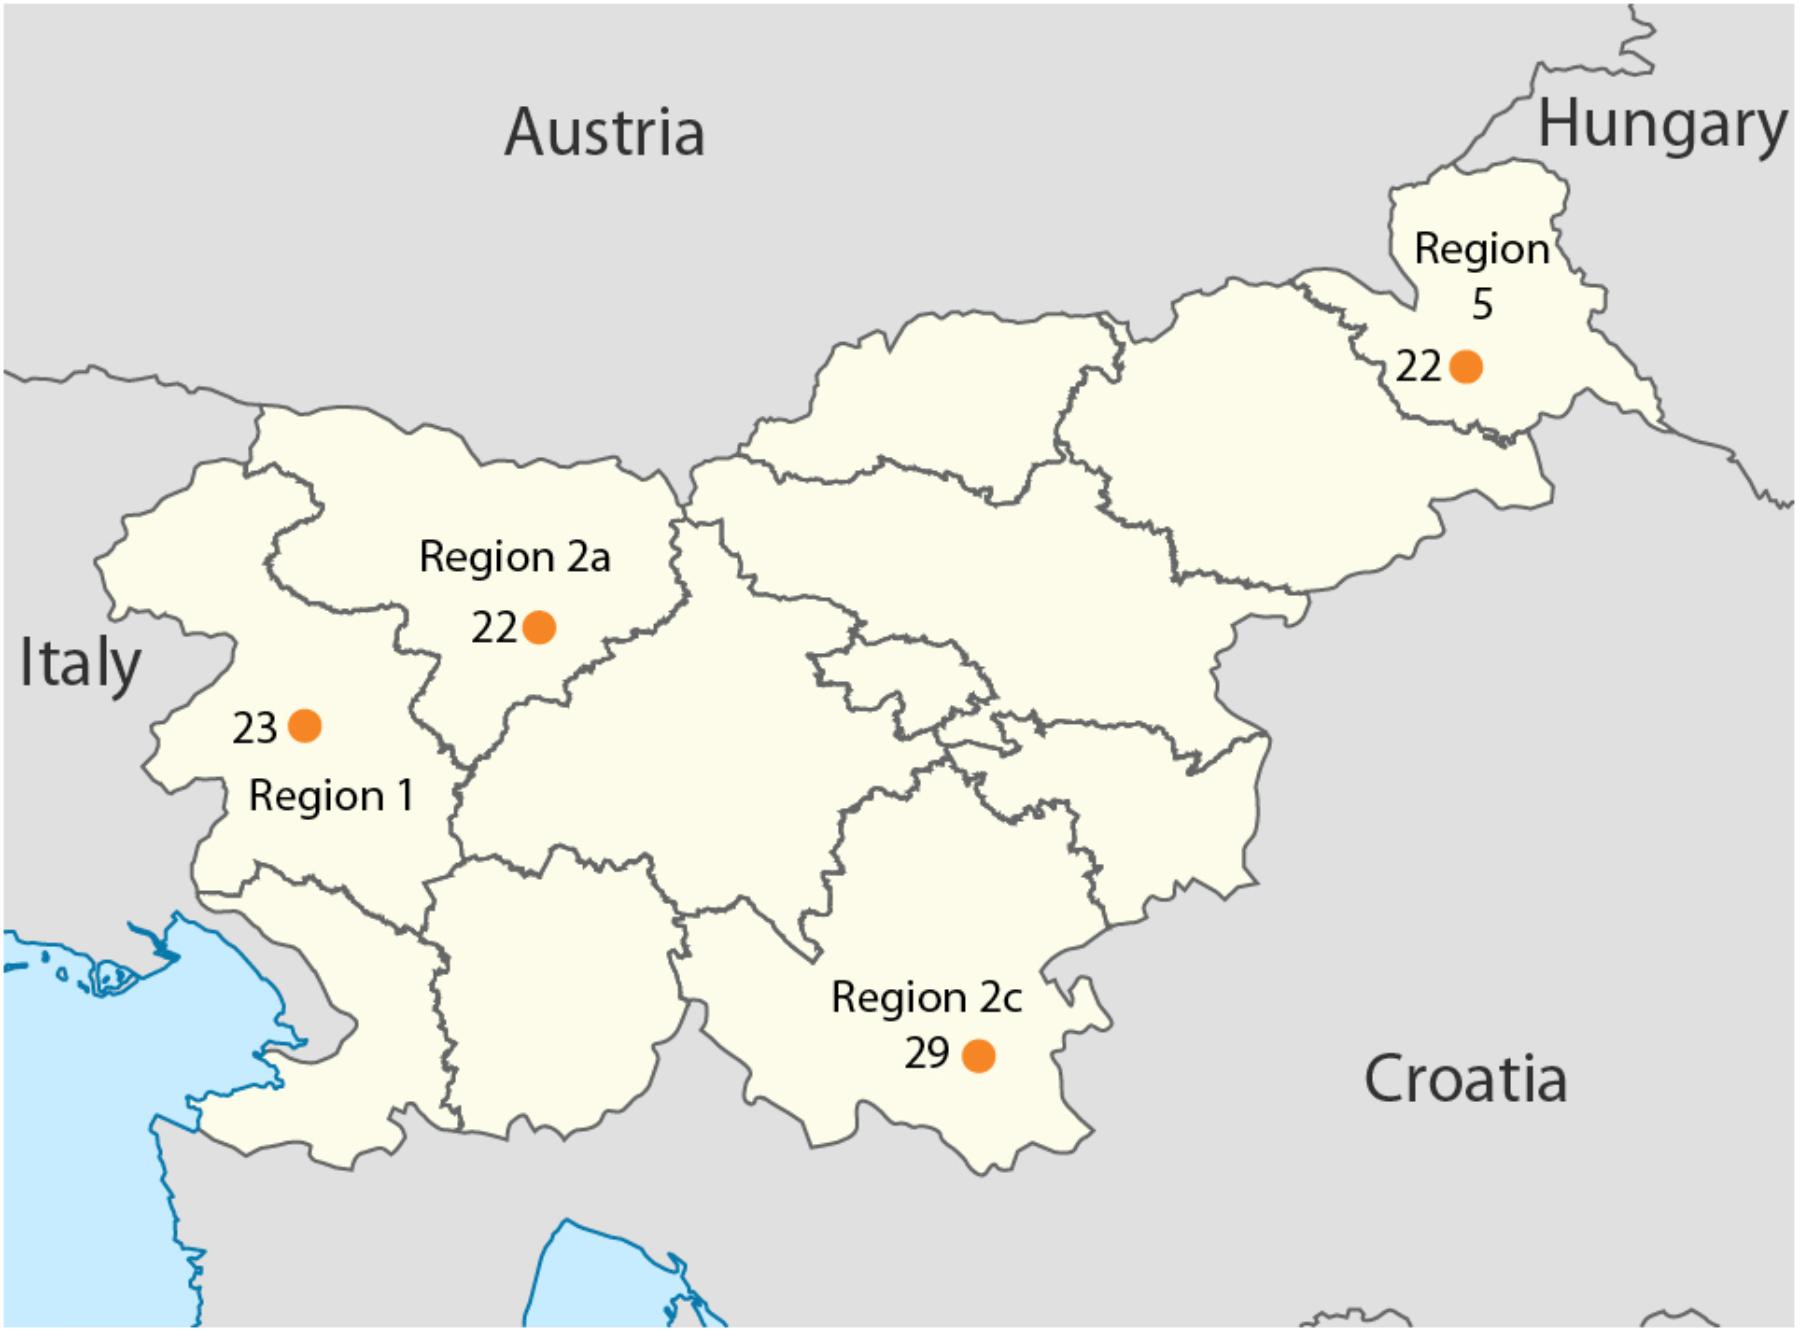
FIGURE 1. Geographical location of the samples included in this study. Sample size is reported next to each sampling location together with the region ID. Map has been modified from https://nl.m.wikipedia.org/wiki/Bestand:Slovenia,_administrative_divisions_-_de_(statistical_regions).svg.
.svg.)
Y Chromosome Analyses
First, 52 male samples were extracted from the dataset and Y chromosome haplogroups were assigned using AMY-tree v2.0 software (Van Geystelen et al., 2013). Input files were created by converting PED and FAM files into a vcf using PGDSpider v2.1.1.1 (Lischer and Excoffier, 2012) and then from a vcf into AMY-tree input files with R scripts v3.2.3 (R Core Team, 2015). Results were then combined together using in-house R scripts v3.2.3 (R Core Team, 2015).
Population Structure
Principal Component Analysis (PCA) was performed using the option –pca in PLINK v1.9 (Purcell et al., 2007). Presence of genetic clusters was assessed using Gaussian mixture modeling implemented in the library “Mclust” v1.0 (Fraley et al., 2016) which uses several clustering models based on different characteristics of the geometric distribution (volume, shape, and orientation). Cluster plots were generated in R environment using the library “adegenet” v1.4-2 (Jombart and Ahmed, 2011). Pairwise Fst was calculated using the program 4P (Benazzo et al., 2015), and a UPGMA tree was then built with the R package “phangorn” (Schliep, 2011) including all populations listed in Supplementary Table 1 without any filter for sample size. Runs of homozygosity (ROH) were calculated using PLINK v1.9 (Purcell et al., 2007) on the dataset Slovenian_HO_EU. ROH hotspots were estimated using the command –homozyg-group implemented in PLINK using default parameters and all Slovenians samples. Genes contained in the ROH hotpots shared by at least 10 individuals were analyzed with BioMart (Zerbino et al., 2018). Genes found associated to trait in GWAS catalog were also reported.
Admixture Pattern
We inferred the ancestral structure using ADMIXTURE v1.30 (Alexander et al., 2009), using maximum likelihood for components (K) from K = 2 to 12. Cross validation error was also performed. Gene flow and time of admixture between Slovenian and modern populations in the Slovenian_HO_EU dataset was investigated using ALDER v.1.30 (Loh et al., 2013) and MALDER (Pickrell et al., 2014). These two approaches exploit the decay of linkage disequilibrium as a function of genetic distance. Slovenian population was always used as a target of admixture between two sources. All possible pairs of populations with a sample size greater than 10 were used as sources. Ancient gene flow was assessed using the f3 statistic implemented in ADMIXTOOLS (Patterson et al., 2012) using the dataset containing ancient genomes. Only significant results with Z-score <= -4 were retained and ALDER was then performed in the ancient reference population with sample size >= 5. The outgroup f3 statistic was estimated in the form (Modern; Ancient, Yoruba) for modern populations with sample size greater than 10.
Natural Selection
Analyses looking for signals of selection were performed using PCAdapt implemented in the R package PCAdapt (Luu et al., 2017). A 2-population system was applied comparing Slovenian population with one South European reference, one East European, one North European, and one West European. Markers with False discovery rate (FDR) < 0.1 were analyzed and SNPs reported in GWAS catalog associated with a trait with p-value < 1e-8 were then selected. Furthermore, markers reported in Mathieson et al. (2015) were also analyzed as potential candidates in Europeans.
Results
Genetic Context of the Slovenian Population
First, Y chromosome genetic diversity was assessed. A total of 52 Y chromosomes were analyzed for 195 SNPs. The majority of individuals (25, 48.1%) belong to the haplogroup R1a1a1a (R-M417) while the second major haplogroup is represented by R1b (R-M343) including 15 individuals (28.8%). Twelve samples are assigned to haplogroup I (I M170): five and two samples belong to haplogroup I2a (I L460) and I1 (I M253), respectively, while the remaining five samples did not have enough information to be further assigned. We then performed principal component analysis on autosomal data to further investigate the presence of structure within the Slovenian population. We did not find any clusters even when samples were highlighted by the region of origin (Supplementary Figure 1).
A principal component analysis was then performed on the Slovenian_HO dataset including 127,385 SNPs. The first two PCs explained ∼63% of the variance and PC1 divides the African samples while PC2 highlights the Asian cluster (Supplementary Figure 2). PC3 separates the Caucasian and Middle Eastern populations but all Slovenian individuals group within the European cluster. To further investigate the role of the Slovenia genetic diversity within the European scenario, a principal component analysis was also carried out on the Slovenia_HO_EU dataset. Considering the unbalanced sample size of the Slovenian population compared to the other populations included in the dataset, a subset of 20 Slovenian individuals randomly sampled was used. In order to verify that the 20 Slovenian individuals did not show any bias (i.e., population structure), this approach has been replicated 10 times and PCAs showed the same pattern. One of the replicates of the PCAs is shown in Figure 2A. The first two PCs explained ∼16% of the variance with Slovenian samples grouping together with the Croatians, Hungarians and close to the Czechs. PC1 represents a west-to-east cline with the Basque at one extreme and the “Eastern-European” cluster made by Lithuanians, Estonians, Russians, Belarusians, and Mordovians at the opposite side. The second principal component highlights a north-to-south cline with English, Norwegians, Orcadians, and Icelanders at the top and Sicilians and Greeks at the bottom. PC3 explains ∼5.5% of the variance and emphasizes this cline by separating more clearly the French and the English from the Spanish and the other Northern-European populations, respectively.
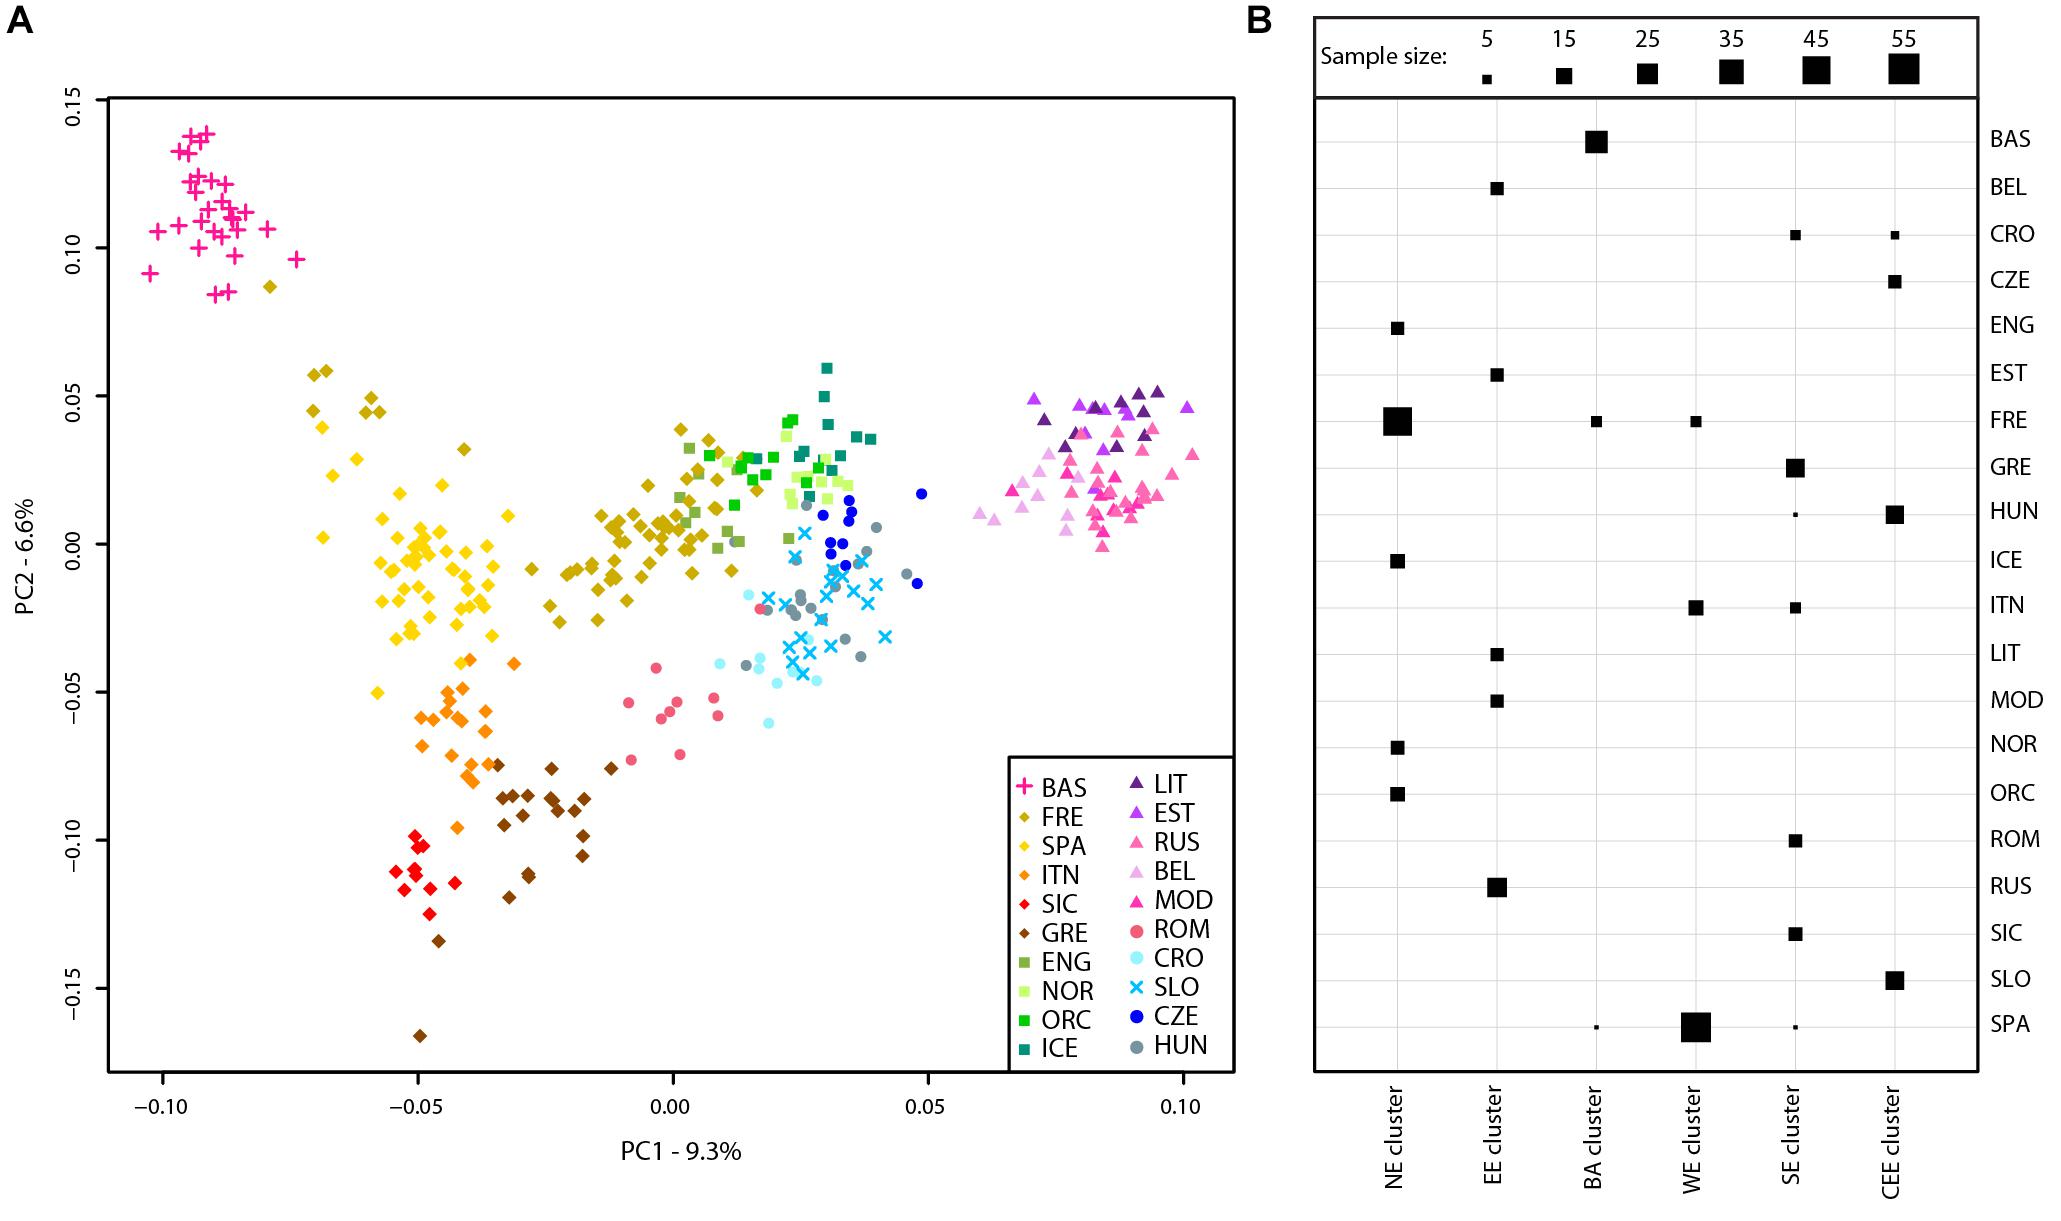
FIGURE 2. Population structure of Slovenian samples. (A) PCA of Slovenian samples with European populations (Slovenian_HO_EU dataset). For details regarding the populations included, see Supplementary Table 1. (B) Mclust clustering (Fraley et al., 2016) of European samples based on the first eight principal component of the PCA. The number of clusters is k = 6 as suggested by multiple clustering models, see Supplementary Figure 3. Horizontal lines represent populations while vertical lines represent the six clusters. The size of each square is proportional to the number of individuals assigned to each cluster as shown in the figure legend. For population acronyms see Supplementary Table 1. NE, Northern European cluster; EE, Eastern European cluster; BA, Basque cluster; WE, Western European cluster; SE, Southern-European cluster; CEE, Central-Eastern European cluster.
The presence of genetic clusters within the Slovenia_HO_EU dataset has been further investigated using “Mclust” which suggests k = 6 as the most likely number of clusters (Figure 2B and Supplementary Figure 3). All Slovenian samples group together with Hungarians, Czechs, and some Croatians (“Central-Eastern European” cluster) as also suggested by the PCA. All Basque individuals with few French and Spanish cluster together (“Basque” cluster) while a “Northern-European” cluster is made of the majority of French, English, Icelanders, Norwegians, and Orcadians. Five populations contributed to the “Eastern-European” cluster including Belarusians, Estonians, Lithuanians, Mordovians, and Russians. Western and South Europe is split into two cluster: the first (“Western European” cluster) includes all Spanish individuals, few French, and some Italians (North Italy) while the second (“Southern-European” cluster) groups Sicilians, Greeks, some Croatians, Romanians, and some Italians (North Italy).
The relationships between populations were also assessed by computing a pairwise Fst matrix. Analysis of the UPGMA tree based on the Fst matrix shows all Slovenian individuals clustering together with Hungarians, Czechs, Croatians, Ukrainians, and Belarusians (Supplementary Figure 4).
Pattern of runs of homozygosity computed on the Slovenian population does not differ significantly from Hungarians, Czechs, Croatians (Mann Whitney p-value > 0.09), albeit showing a slightly higher amount of segments and total homozygosity (Supplementary Table 2). We investigated the ROH hotspot pattern and we found total of 13 regions in homozygous state shared by more than 10 individuals, the average sizes of regions is 435 KB. The regions range from 131 Kb to 988 Kb where we found a total of 159 genes, 14 of them are present in GWAS catalog with a marker associated with a reported p-value <= 1e-8. These genes are mainly involved in blood metabolites levels such as SLC7A6, RAB3GAP1, ADK, lipid traits (PLA2G15 and TP53BP1), and blood pressure (ACAD10 and HECTD4) (Supplementary Tables 3, 4).
Admixture Pattern and Migration
All Slovenian individuals share common pattern of genetic ancestry, as revealed by ADMIXTURE analysis. The three major ancestry components are the North East and North West European ones (light blue and dark blue, respectively, Figure 3), followed by a South European one (dark green, Figure 3). Contribution from the Sardinians and Basque are present in negligible amount. The admixture pattern of Slovenians mimics the one suggested by the neighboring Eastern European populations, but it is different from the pattern suggested by North Italian populations even though they are geographically close. (Figure 3).
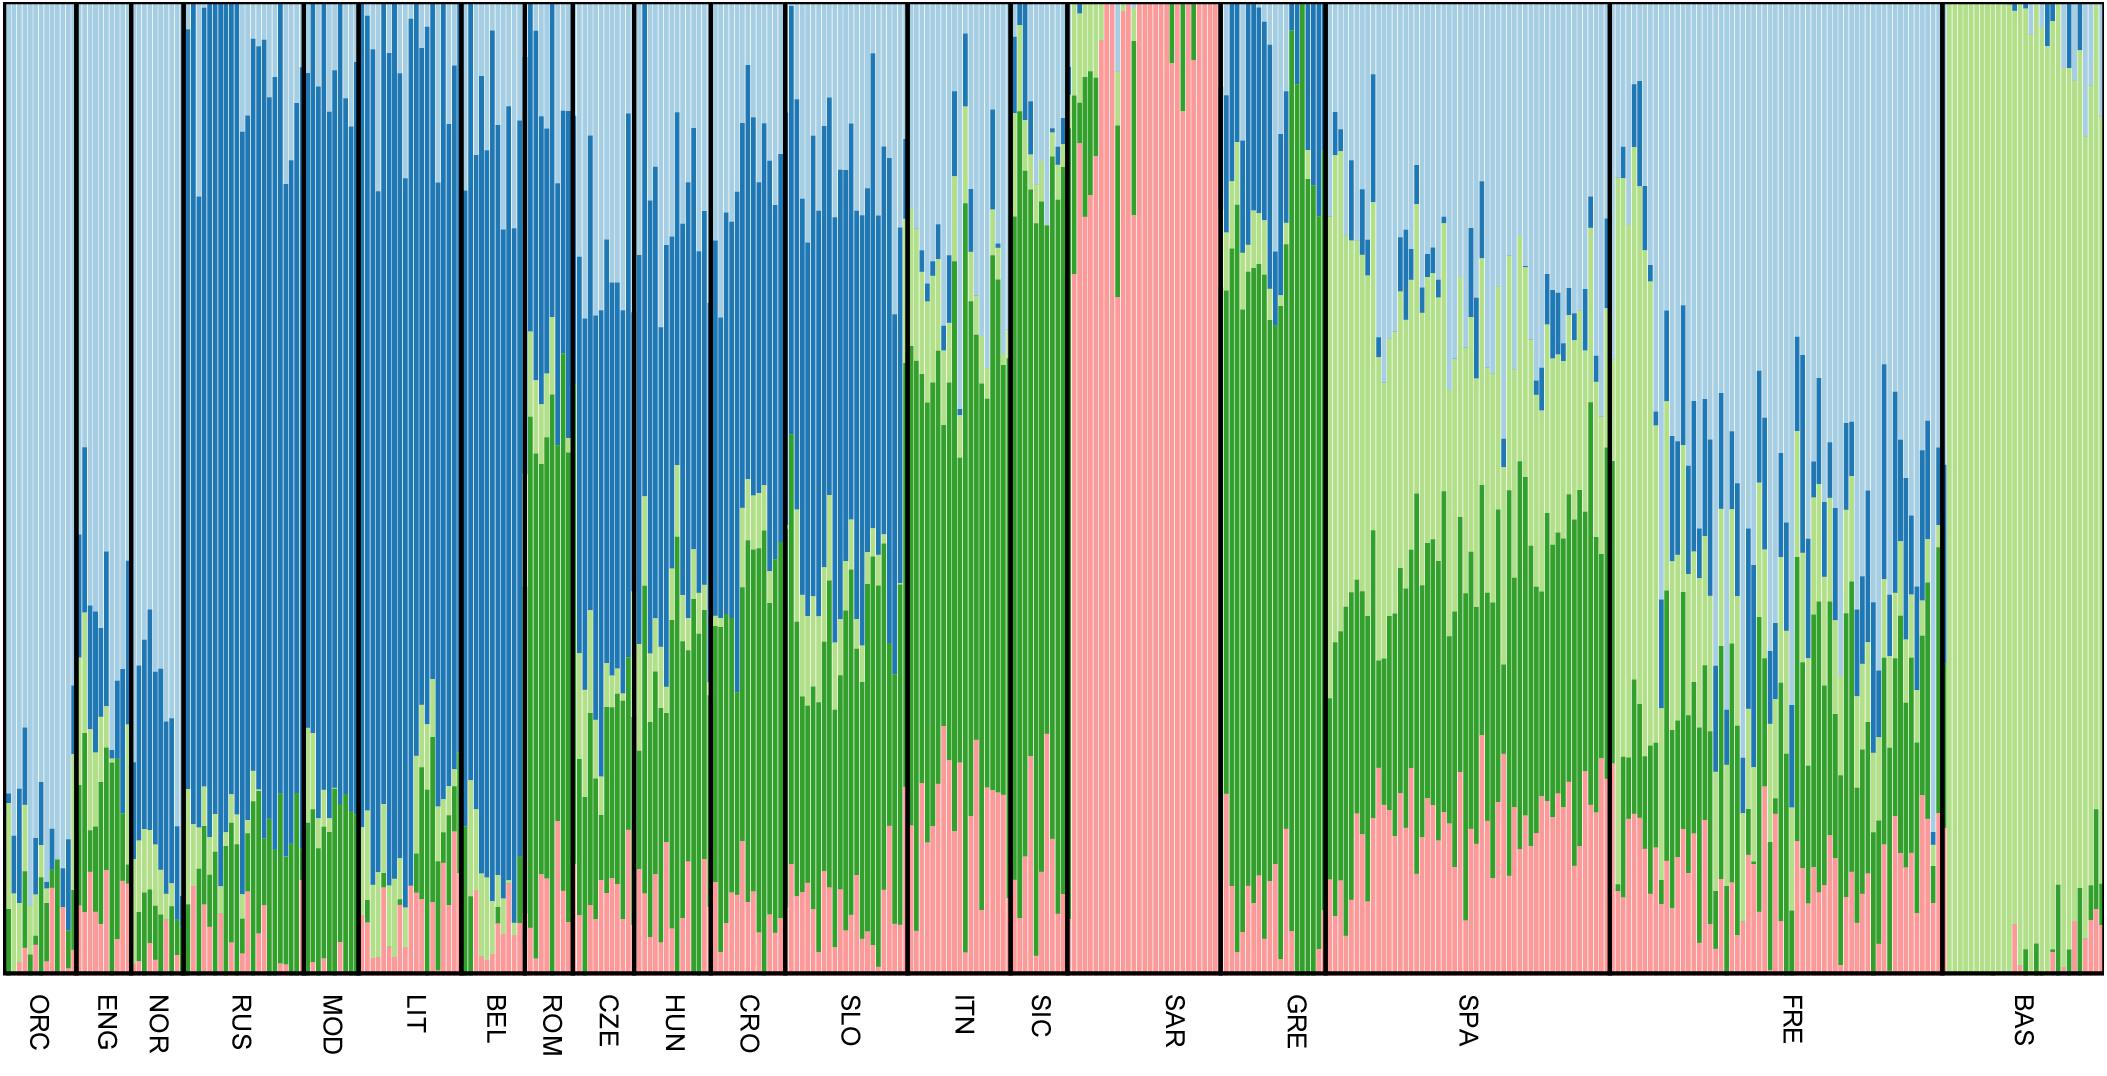
FIGURE 3. Unsupervised admixture analysis of Slovenians. Results for K = 5 are showed as it represents the lowest cross-validation error. Slovenian samples show an admixture pattern similar to the neighboring populations such as Croatians and Hungarians. The major ancestral components are: the blue one which is shared with Lithuanians and Russians, followed by the dark green one that is mostly present in Greek samples and the light blue which characterizes Orcadians and English. For population acronyms see Supplementary Table 1.
Using ALDER, the most significant admixture event was obtained with Russians and Sardinians as source populations and it happened 135 ± 9.31 generations ago (Z-score = 11.54). Moreover, we found significant signals also using Bedouin, and Russian population as possible sources of gene flow. When tested for multiple admixture events (MALDER), we obtained evidence for one admixture event 165.391 ± 17.1918 generations ago corresponding to ∼2620 BCE (CI: 3101–2139) considering a generation time of 28 years (Figure 4), with Kalmyk and Sardinians as sources. Most of admixture events involve Sardinians as one of the source populations coupled with North-East Europeans, Caucasian populations, and Western European populations (see Supplementary Table 1 for additional details). All significant results for ALDER are summarized in Supplementary Table 5.
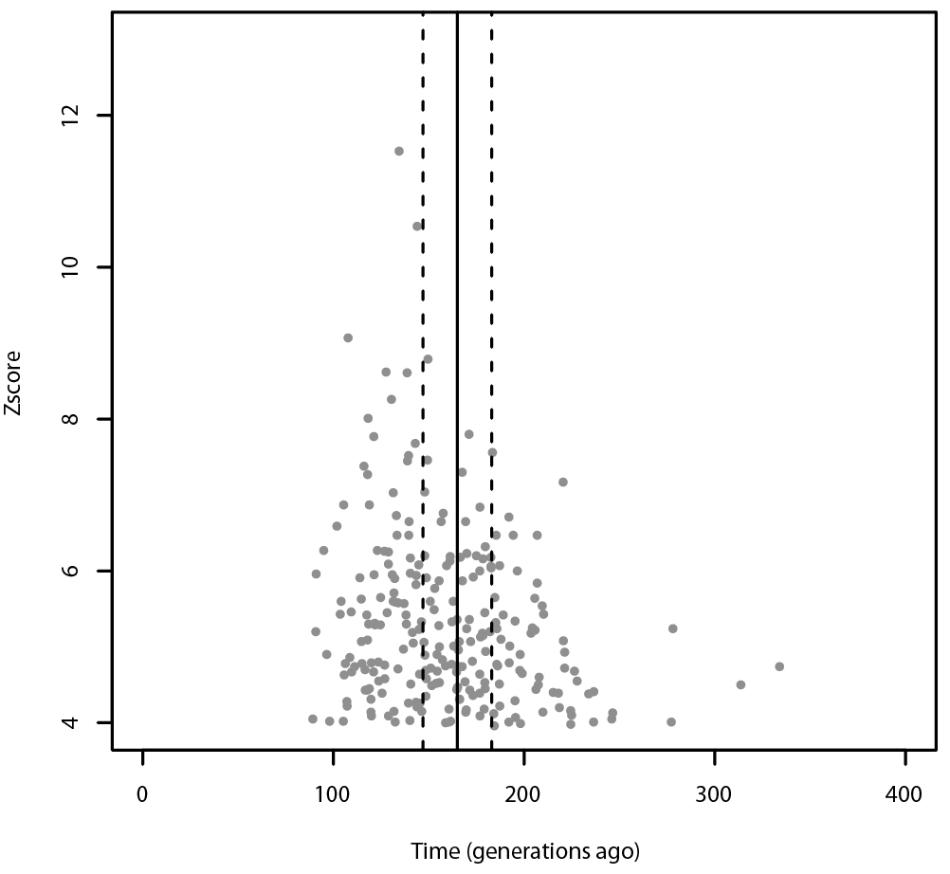
FIGURE 4. Admixture events identified with ALDER and MALDER. The gray dots represent significant admixture events detected with ALDER using Slovenians as target, the solid line represents the single admixture event detected using MALDER, dashed lines represent the confidence interval. Only the significant results after multiple testing correction are plotted. For ALDER results see Supplementary Table 5.
We then modeled the Slovenian population as target of admixture of ancient individuals from Haak et al. (2015) while computing the f3(Ancient 1, Ancient 2, Slovenian) statistic. The most significant signal was obtained with Yamnaya and HungaryGamba_EN (Z-score = -10.66), followed by MA1 with LBK_EN (Z-score -9.7) and Yamnaya with Stuttgart (Z-score = -8.6) used as possible source populations (Supplementary Figure 5). Overall, we found a significant signal when we used Yamnaya and Early Neolithic genomes as potential admixture sources. Using ALDER, we modeled the time of admixture using Yamnaya with LBK_EN and Yamnaya with HungaryGamba_EN as possible ancient sources of admixture. We found a significant signal of admixture by using both pairs as ancient sources. Specifically, for the pair Yamnaya and Hungary_EN the admixture event is dated at 134.38 ± 23.69 generations ago (Z-score = 5.26, p-value of 1.5e-07) while for Yamnaya and LBK_EN at 153.65 ± 22.19 generations ago (Z-score = 6.92, p-value 4.4e-12). Outgroup f3 with Yamnaya put Slovenian population close to Hungarians, Czechs, and English, indicating a similar shared drift between these population with the Steppe populations (Supplementary Figure 6).
Signals of Selection in Candidate Variants
Considering the pattern of admixture in Slovenian population, we searched for highly differentiated loci between Slovenians and specific reference populations. By comparing Russians and Slovenians we found that rs4129267 on IL6R is significantly differentiated with increase derived allele frequency in Slovenians. This marker is associated with several traits including C-reactive protein, fibrinogen and protein quantitative traits. Moreover, we found that rs603424 on PKD2L1 shows higher derived allele frequency in Slovenians compared to Russians: this marker is significantly associated with metabolic traits and glycerophospholipid levels. Furthermore, the pattern of derived allele frequency is highly negatively correlated with latitude in our dataset (Pearson = -0.88, p-value = 6.38e-16). On the other hand, PCAdapt analysis using as reference South Europeans and Sardinians reveals significant differentiation for pigmentation allele rs12913832 (linked to blue eye color) in the HERC2 gene. The derived allele frequency of rs12913832 in Slovenians and Russians is 0.64 and 0.86, respectively, which is higher when compared to Greeks and Spanish showing a derived allele frequency of 0.25 and 0.29, respectively. Moreover, we found a significant differentiation for three polymorphisms (rs1535, rs174547, and rs174550) in FADS1 and FADS2 genes which are implicated in lipid traits showing higher derived allele frequency in Greeks when compared to the Slovenians. Interestingly, we identified a signal on BACE2 for rs6517656: this polymorphism shows a high derived allele frequency in Europe, Middle East and Asia while the ancestral allele is still predominant within Africa. A graphical representation of the worldwide allele variation is shown in Supplementary Figure 7 and the characteristics of selected GWAS SNPs are reported in Table 1 and Supplementary Table 6 with their frequency in each population in Supplementary Table 7.
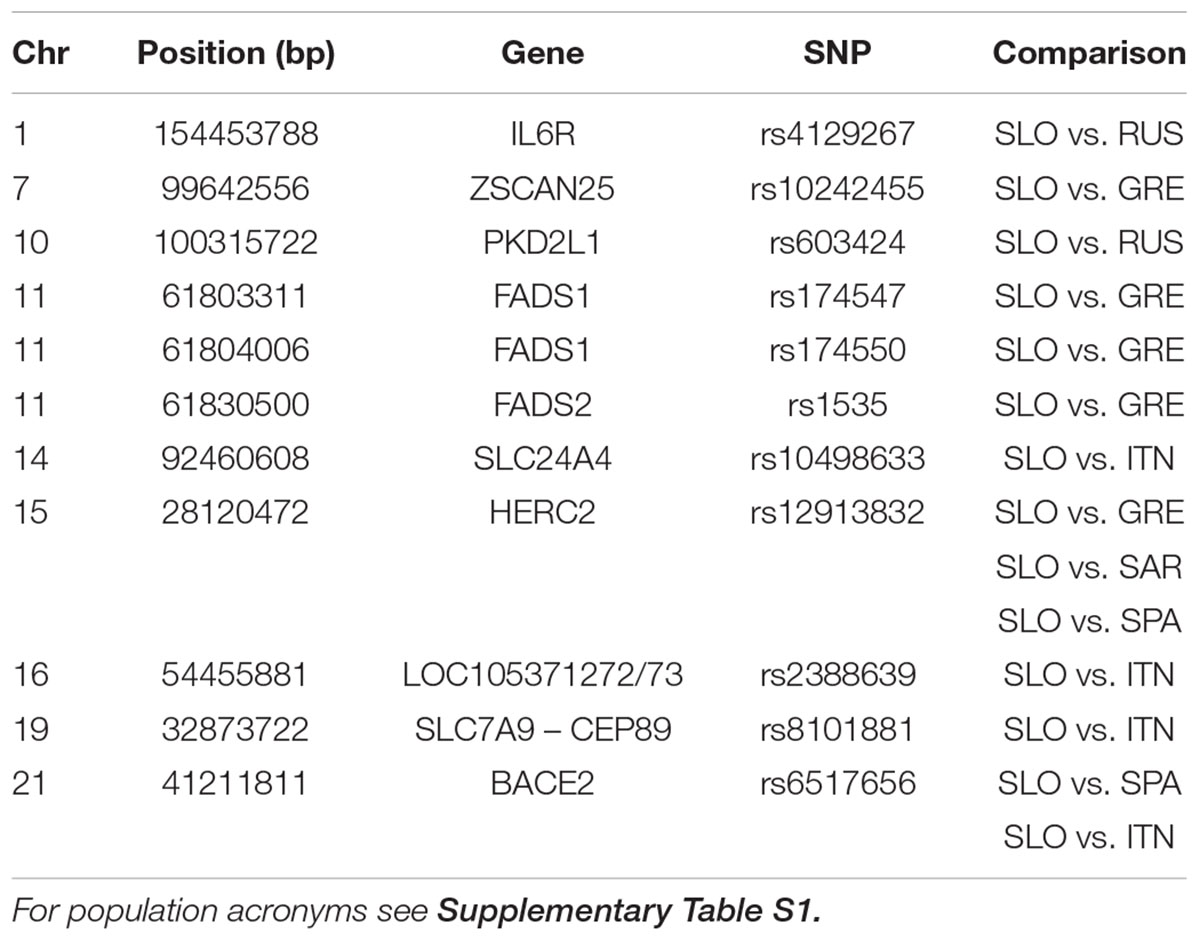
TABLE 1. GWAS-SNP with FDR < 0.1 in selection scan.
Discussion
Slovenia presents a peculiar landscape, composed by mountain regions on the North West changing to flat lands toward the East. The border with the West not only represents a geographical barrier but also a linguistic one. To date no previous studies have described the genetic variation in Slovenian population. We considered different measurements of population admixture, isolation, and selection. In this study, we addressed the genetic features of Slovenian genomes and how admixture and selection shaped the genetic diversity of this population. Analysis of Y chromosome variation showed a presence of two main haplogroups R1b and R1a, confirming previous findings and suggesting gene flow from the Steppe (Haak et al., 2015). According to Zupan et al. (2013) analyses on Y chromosome variation suggested the existence of a common ancestral Slavic population in central European region. This would be in agreement with our findings highlighting a major contribution of genetic diversity from the Steppe.
From autosomal data our analyses on population structure revealed the absence of strong substructure within the Slovenian samples, although the samples came from different regions of the country. We discovered a strong affinity between Slovenians and Central-Eastern European populations such as Czechs and Hungarians. Slovenians are closer to North European samples respect to South European ones including the neighboring North Italian population. Our findings suggest that the Slovenian ancestry seems more closely related to population from Northern-Central Europe, respect to Western-South Europe.
For purpose of further studies focused on genetic epidemiology, our analyses show that Slovenians have no evidences of isolation. Nevertheless, we found a specific pattern of ROH hotspot in our Slovenian samples, despite the limitation of the possibility to replicate this pattern in other populations of the dataset due to the difference of sample size. Some of these regions contains interesting genes linked to GWAS traits including Type 1 Diabetes that should be further investigated.
Our analyses of admixture events using methods based on LD decay revealed that the modern Slovenian gene pool could be explained by several admixture events that happened in a single window of time. We also showed that that there is no support for multiple admixture events across time. Overall, the Slovenian genetic pool seems to have been formed during the Bronze Age period as admixture between North-Eastern European populations and Near-Eastern populations as proxy. This pattern has been further confirmed when we used ancient genomes. Specifically, we obtained the strongest signal for Slovenians using as references Yamnaya and Hungary Early Neolithic samples. The estimated admixture time falls within the range of that one obtained using modern populations. We can conclude that populations closely related to Yamnaya and early Neolithic Hungarians contributed during the Bronze age to the foundation of the modern genetic variability in Slovenians. We could make the hypothesis that also disease and specific traits-alleles were likely to have been introduced in the Slovenian genetic pool during this period, such as pigmentation alleles (including the high frequency of blue eyes alleles found in Slovenian samples), lactose tolerance (rs4988235, whose frequency in Slovenia is 0.36) and also immune related alleles such as rs4833095 in TLR1 (Slovenian derived allele frequency of 0.7, Bronze Age ∼0.8).
Considering the discovered admixture pattern that contribute to the actual genetic diversity of this populations, we analyzed the possible selection signals in a broader context. We specifically focused on putatively selected variants in this population that could be useful for genetic epidemiology and to better understanding the forces shaping the genetic diversity in the Slovenians. Our selection study revealed significant hits on markers associated mainly on lipid traits and eye pigmentation when compared to South Europeans (Greeks) such as HERC2 for blue eye color and FADS1-FADS2 alleles; FADS genes are essential for the synthesis of long-chain unsaturated fatty acids (Teslovich et al., 2010). These genes have been previously found under selection in different populations from East Asia (Auton et al., 2015) and Greenland (Fumagalli et al., 2015), with also evidence of ancient selection in Africa (Ameur et al., 2012). Finally, in Mathieson et al. (2015) the FADS1 and FADS2 loci were found under selection in Neolithic samples from Europe. This pattern suggests that these genes played an important role in human adaptation to different diets and dietary habits in Slovenian ancestors could have played a role in the selection pressure for these genes.
On the other hand, when we compared Slovenians with North-Eastern populations, such as Russians, Slovenians showed signature of selection in PKD2L1 which is a gene involved in taste (Fujikura, 2016) and also possibly in olfaction (Keydar et al., 2013) and therefore could be also linked to dietary patterns in Slovenians. We also found that the frequency of the putatively selected allele shows high negative correlation with latitude and its derived frequency in Slovenians is very similar to North Italians, whereas populations as Czechs and Lithuanians show much lower derived allele frequency. This further suggests a putative link with different dietary habits associated with latitude that could have affected the variation in PKD2L1. Another signal has been found on IL6R: this gene was discovered as underlying coronary artery disease (Byars et al., 2017) and harboring signature of selection and presence of antagonistic pleiotropic trade-offs. Moreover, IL6R was discovered to suppress feeding and improves glucose tolerance in mice (Timper et al., 2017). Overall, using our approach we found several genes linked to diet that could explain possible selection forces on these alleles that were introduced previously from different sources in the Slovenian genetic pool. Our results show that the pattern of selected genes in modern Slovenians was shaped by several admixture events during the Bronze Age. Slovenian population shows that some GWAS specific alleles differentiated with both North-Eastern European population and South European populations.
One limitation of our study is the use of only SNP-chip data, future studies involving whole-genome sequencing would highlight more details the genetic features of the genes under selection, also enhancing the power to detect putatively deleterious rare variants.
Author Contributions
MM and PM designed the project, performed the analyses, and wrote the manuscript. MR-G and DG collected the samples. PG, MR-G participated in project coordination and helped to draft the manuscript. All authors read and approved the final manuscript.
Funding
This project has received funding from the HERA Joint Research Programme “Uses of the Past” (CitiGen), and the European Union’s Horizon 2020 research and innovation programme under Grant Agreement 649307.
Conflict of Interest Statement
The authors declare that the research was conducted in the absence of any commercial or financial relationships that could be construed as a potential conflict of interest.
Acknowledgments
We are grateful to the genotoul bioinformatics platform Toulouse Midi-Pyrenees (Bioinfo Genotoul) for providing computing resources (www.bioinfo.genotoul.fr). We wish to acknowledge the DJEI/DES/SFI/HEA Irish Centre for High-End Computing (ICHEC) for the provision of computational facilities and support.
Supplementary Material
The Supplementary Material for this article can be found online at: https://www.frontiersin.org/articles/10.3389/fgene.2018.00551/full#supplementary-material
References
Alexander, D. H., Novembre, J., and Lange, K. (2009). Fast model-based estimation of ancestry in unrelated individuals. Genome Res. 19, 1655–1664. doi: 10.1101/gr.094052.109
Ameur, A., Enroth, S., Johansson, A., Zaboli, G., Igl, W., Johansson, A. C., et al. (2012). Genetic adaptation of fatty-acid metabolism: a human-specific haplotype increasing the biosynthesis of long-chain omega-3 and omega-6 fatty acids. Am. J. Hum. Genet. 90, 809–820. doi: 10.1016/j.ajhg.2012.03.014
Auton, A., Brooks, L. D., Durbin, R. M., Garrison, E. P., Kang, H. M., Korbel, J. O., et al. (2015). A global reference for human genetic variation. Nature 526, 68–74. doi: 10.1038/nature15393
Benazzo, A., Panziera, A., and Bertorelle, G. (2015). 4P: fast computing of population genetics statistics from large DNA polymorphism panels. Ecol. Evol. 5, 172–175. doi: 10.1002/ece3.1261
Byars, S. G., Huang, Q. Q., Gray, L. A., Bakshi, A., Ripatti, S., Abraham, G., et al. (2017). Genetic loci associated with coronary artery disease harbor evidence of selection and antagonistic pleiotropy. PLoS Genet. 13:e1006328. doi: 10.1371/journal.pgen.1006328
Catapano, A. L., Lautsch, D., Tokgozoglu, L., Ferrieres, J., Horack, M., Farnier, M., et al. (2016). Prevalence of potential familial hypercholesteremia (FH) in 54,811 statin-treated patients in clinical practice. Atherosclerosis 252, 1–8. doi: 10.1016/j.atherosclerosis.2016.07.007
Esko, T., Mezzavilla, M., Nelis, M., Borel, C., Debniak, T., Jakkula, E., et al. (2013). Genetic characterization of northeastern Italian population isolates in the context of broader European genetic diversity. Eur. J. Hum. Genet. 21, 659–665. doi: 10.1038/ejhg.2012.229
Fraley, A. E., Raftery, T. B., and Scrucca, L. (2016). mclust: Gaussian Mixture Modelling for Model-Based Clustering, Classification, and Density Estimation. Available at: http://www.stat.washington.edu/mclust/
Fujikura, K. (2016). Corrigendum: multiple loss-of-function variants of taste receptors in modern humans. Sci. Rep. 6:20741. doi: 10.1038/srep20741
Fumagalli, M., Moltke, I., Grarup, N., Racimo, F., Bjerregaard, P., Jorgensen, M. E., et al. (2015). Greenlandic Inuit show genetic signatures of diet and climate adaptation. Science 349, 1343–1347. doi: 10.1126/science.aab2319
Grafenauer, B. (1950). Nekaj vprašanj i dobe naseljevanja južnih Slovanov. Zgodovinski časopis 6, 23–129.
Haak, W., Lazaridis, I., Patterson, N., Rohland, N., Mallick, S., Llamas, B., et al. (2015). Massive migration from the steppe was a source for Indo-European languages in Europe. Nature 522, 207–211. doi: 10.1038/nature14317
Haber, M., Mezzavilla, M., Xue, Y., and Tyler-Smith, C. (2016). Ancient DNA and the rewriting of human history: be sparing with Occam’s razor. Genome Biol. 17:1. doi: 10.1186/s13059-015-0866-z
Jombart, T., and Ahmed, I. (2011). adegenet 1.3-1: new tools for the analysis of genome-wide SNP data. Bioinformatics 27, 3070–3071. doi: 10.1093/bioinformatics/btr521
Keydar, I., Ben-Asher, E., Feldmesser, E., Nativ, N., Oshimoto, A., Restrepo, D., et al. (2013). General olfactory sensitivity database (GOSdb): candidate genes and their genomic variations. Hum. Mutat. 34, 32–41. doi: 10.1002/humu.22212
Lazaridis, I., Nadel, D., Rollefson, G., Merrett, D. C., Rohland, N., Mallick, S., et al. (2016). Genomic insights into the origin of farming in the ancient Near East. Nature 536, 419–424. doi: 10.1038/nature19310
Lischer, H. E., and Excoffier, L. (2012). PGDSpider: an automated data conversion tool for connecting population genetics and genomics programs. Bioinformatics 28, 298–299. doi: 10.1093/bioinformatics/btr642
Loh, P. R., Lipson, M., Patterson, N., Moorjani, P., Pickrell, J. K., Reich, D., et al. (2013). Inferring admixture histories of human populations using linkage disequilibrium. Genetics 193, 1233–1254. doi: 10.1534/genetics.112.147330
Luu, K., Bazin, E., and Blum, M. G. (2017). pcadapt: an R package to perform genome scans for selection based on principal component analysis. Mol. Ecol. Resour. 17, 67–77. doi: 10.1111/1755-0998.12592
Mathieson, I., Lazaridis, I., Rohland, N., Mallick, S., Patterson, N., Roodenberg, S. A., et al. (2015). Genome-wide patterns of selection in 230 ancient Eurasians. Nature 528, 499–503. doi: 10.1038/nature16152
Patterson, N., Moorjani, P., Luo, Y., Mallick, S., Rohland, N., Zhan, Y., et al. (2012). Ancient admixture in human history. Genetics 192, 1065–1093. doi: 10.1534/genetics.112.145037
Pickrell, J. K., Patterson, N., Loh, P. R., Lipson, M., Berger, B., Stoneking, M., et al. (2014). Ancient west Eurasian ancestry in southern and eastern Africa. Proc. Natl. Acad. Sci. U.S.A. 111, 2632–2637. doi: 10.1073/pnas.1313787111
Purcell, S., Neale, B., Todd-Brown, K., Thomas, L., Ferreira, M. A., Bender, D., et al. (2007). PLINK: a tool set for whole-genome association and population-based linkage analyses. Am. J. Hum. Genet. 81, 559–575. doi: 10.1086/519795
Schliep, K. P. (2011). phangorn: phylogenetic analysis in R. Bioinformatics 27, 592–593. doi: 10.1093/bioinformatics/btq706
Teslovich, T. M., Musunuru, K., Smith, A. V., Edmondson, A. C., Stylianou, I. M., Koseki, M., et al. (2010). Biological, clinical and population relevance of 95 loci for blood lipids. Nature 466, 707–713. doi: 10.1038/nature09270
Timper, K., Denson, J. L., Steculorum, S. M., Heilinger, C., Engstrom-Ruud, L., Wunderlich, C. M., et al. (2017). IL-6 improves energy and glucose homeostasis in obesity via enhanced central IL-6 trans-signaling. Cell Rep. 19, 267–280. doi: 10.1016/j.celrep.2017.03.043
Townsend, N., Wilson, L., Bhatnagar, P., Wickramasinghe, K., Rayner, M., and Nichols, M. (2016). Cardiovascular disease in Europe: epidemiological update 2016. Eur. Heart J. 37, 3232–3245. doi: 10.1093/eurheartj/ehw334
Van Geystelen, A., Decorte, R., and Larmuseau, M. H. (2013). Updating the Y-chromosomal phylogenetic tree for forensic applications based on whole genome SNPs. Forensic Sci. Int. Genet. 7, 573–580. doi: 10.1016/j.fsigen.2013.03.010
Zerbino, D. R., Achuthan, P., Akanni, W., Amode, M. R., Barrell, D., Bhai, J., et al. (2018). Ensembl 2018. Nucleic Acids Res. 46, D754–D761. doi: 10.1093/nar/gkx1098
Zupan, A., Vrabec, K., and Glavac, D. (2013). The paternal perspective of the Slovenian population and its relationship with other populations. Ann. Hum. Biol. 40, 515–526. doi: 10.3109/03014460.2013.813584
Keywords: Slovenia, human, single nucleotide polymorphism, demographic histories, selection, admixture
Citation: Maisano Delser P, Ravnik-Glavač M, Gasparini P, Glavač D and Mezzavilla M (2018) Genetic Landscape of Slovenians: Past Admixture and Natural Selection Pattern. Front. Genet. 9:551. doi: 10.3389/fgene.2018.00551
Received: 27 July 2018; Accepted: 29 October 2018;
Published: 19 November 2018.
Edited by:
Fulvio Cruciani, Sapienza University of Rome, ItalyReviewed by:
Horolma Pamjav, Bűnügyi Szakértői és Kutatóintézet, HungaryHovirag Lancioni, University of Perugia, Italy
Antonio González-Martín, Complutense University of Madrid, Spain
Copyright © 2018 Maisano Delser, Ravnik-Glavač, Gasparini, Glavač and Mezzavilla. This is an open-access article distributed under the terms of the Creative Commons Attribution License (CC BY). The use, distribution or reproduction in other forums is permitted, provided the original author(s) and the copyright owner(s) are credited and that the original publication in this journal is cited, in accordance with accepted academic practice. No use, distribution or reproduction is permitted which does not comply with these terms.
*Correspondence: Damjan Glavač, ZGFtamFuLmdsYXZhY0BtZi51bmktbGouc2k= Massimo Mezzavilla, bWFzc2ltby5tZXp6YXZpbGxhQGJ1cmxvLnRyaWVzdGUuaXQ=