 Tingxian Deng1,2
 Aixin Liang1*Jiajia Liu1Guohua Hua1Tingzhu Ye1Shenhe Liu1Giuseppe Campanile3
 Graham Plastow4
 Chunyan Zhang4Zhiquan Wang4
 Angela Salzano3Bianca Gasparrini3
 Martino Cassandro5
 Hasan Riaz6
 Xianwei Liang2
 Liguo Yang1*
- 1Key Lab of Agricultural Animal Genetics, Breeding and Reproduction of Ministry of Education, Huazhong Agricultural University, Wuhan, China
- 2Guangxi Provincial Key Laboratory of Buffalo Genetics, Breeding and Reproduction Technology, Buffalo Research Institute, Chinese Academy of Agricultural Sciences, Nanning, China
- 3Department of Veterinary Medicine and Animal Productions, University of Naples “Federico II”, Naples, Italy
- 4Department of Agricultural, Food, and Nutritional Sciences, University of Alberta, Edmonton, AB, Canada
- 5Department of Agronomy Food Natural Resources Animal Environmental, University of Padova, Legnaro, Italy
- 6Department of Biosciences, COMSATS Institute of Information Technology, Sahiwal, Pakistan
Linkage disequilibrium (LD) is a useful parameter for guiding the accuracy and power of both genome-wide association studies (GWAS) and genomic selection (GS) among different livestock species. The present study evaluated the extent of LD, persistence of phase and effective population size (Ne) for the purebred (Mediterranean buffalo; n = 411) and crossbred [Mediterranean × Jianghan × Nili-Ravi buffalo, n = 9; Murrah × Nili-Ravi × local (Xilin or Fuzhong) buffalo, n = 36] buffalo populations using the 90K Buffalo SNP genotyping array. The results showed that the average square of correlation coefficient (r2) between adjacent SNP was 0.13 ± 0.19 across all autosomes for purebred and 0.09 ± 0.13 for crossbred, and the most rapid decline in LD was observed over the first 200 kb. Estimated r2 ≥ 0.2 extended up to ~50 kb in crossbred and 170 kb in purebred populations, while average r2 values ≥0.3 were respectively observed in the ~10 and 60 kb in the crossbred and purebred populations. The largest phase correlation (RP, C = 0.47) was observed at the distance of 100 kb, suggesting that this phase was not actively preserved between the two populations. Estimated Ne for the purebred and crossbred population at the current generation was 387 and 113 individuals, respectively. These findings may provide useful information to guide the GS and GWAS in buffaloes.
Introduction
Genomic selection (GS) has been widely used to estimate the breeding values in various fields, such as animal and plant breeding programs (Newell and Jannink, 2014; Liu and Chen, 2017; Weller et al., 2017). These breeding programs select their breeding animals or plants based on predicted genomic breeding values (GBVs). However, the accuracy of GBVs is vital for the successful application and is mainly affected by estimation methods (Vanraden, 2008), marker density (Solberg et al., 2008), linkage disequilibrium (LD) (Cañas-Álvarez et al., 2016; Lenz et al., 2017), and the training population size (Akdemir et al., 2015).
LD is defined as the non-random association of alleles at different loci in a given population. The LD extent differs among different livestock breeds and is influenced by their evolutionary history and effective population size (Ne). The Ne that is estimated using the r2 coefficient has been an explosion of interest in the application of population genetics (Wang et al., 2016) and conservation biology (Husemann et al., 2016). Notably, Ne can serve as an essential parameter for determining the GS accuracy in livestock species (Daetwyler et al., 2010). In this regard, several modern technologies, such as genome-wide SNP array and high-throughput sequencing created new opportunities to estimate the LD extent and Ne in livestock (Qanbari et al., 2010; Biegelmeyer et al., 2016) and human (Tenesa et al., 2007; Park, 2011). For instance, Cañas-Álvarez et al. (2016) reported the average r2 value of 0.20 was obtained by using only 5% (38,000 SNPs) of BovineHD chip, which corresponded to an average genomic distance of 80 kb. Existing evidence revealed that the average r2 value of 0.20 was considered enough to achieve an accuracy of >0.80 for GBVs estimation (Calus et al., 2008; Meuwissen, 2009; Brito et al., 2011). Consequently, understanding of the LD extent and Ne in the buffalo population is essential for the application of GS technology.
Water buffalo (Bubalus bubalis) is a dual-purpose (milk and meat) livestock across the world that can generally be divided into two subspecies: River (2n = 50) and Swamp (2n = 48) buffalo. These animals were domesticated 3,000–6,000 years ago, and the independent domestication events occur in swamp buffalo from China and the river buffalo from the Indian subcontinent (Lei et al., 2007). To date, the river buffalo including Murrah, Nili-Ravi, and Mediterranean buffalo breeds are mainly distributed in India, Pakistan, and Italy, respectively, while the swamp buffalo are mostly distributed in the Asian countries, with China having its largest population. The Chinese swamp buffaloes have recently been divided into 14 local types based mainly on regional distribution (Yue et al., 2013). In an attempt to improve milk production traits, exotic dairy buffalo breeds (Murrah, Nili-Ravi, and/or Mediterranean buffaloes) were imported to China in 1950s. The river buffaloes are usually selected as male parents in the crossbreeding system, while swamp (local) buffaloes or crossbred offspring are used as female parents. After multiple cross breeding for several decades, a new crossbred breed has emerged with average milk production of ~1,700 kg per lactation which is significantly lower than that of the purebred breeds (2,200 kg/lactation). Notably, to investigate the LD extent and Ne is essential for dissecting the economically important traits and further development of the molecular breeding technology in buffaloes. The Axiom® Buffalo SNP genotyping Array (90K) (ThermoFisher Scientific, Santa Clara, CA, USA) is the only commercial SNP genotyping array that can be utilized for obtaining the genome-wide SNP data in buffalo. Using this SNP genotyping array, moderate r2 levels (0.20–0.32) were observed in Brazilian buffalo for greater distances (10–70 kb) (Cardoso et al., 2014). However, limited information on the extent of genome-wide LD has yet been assessed in different buffalo breeds. Hence, this study aims to investigate the extent of LD, determine the persistence of phase, and estimate the Ne in the purebred Mediterranean breed and crossbred buffalo population.
Materials and Methods
Sample Collection and Genotyping
All experimental procedures and designs were approved by the Committee for the Ethics University of Naples “Federico II” Italy and Huazhong Agricultural University, Wuhan, China.
A total of 495 buffaloes, including 430 purebred Mediterranean and 65 Chinese crossbred buffaloes [Mediterranean × Jianghan × Nili-Ravi buffalo, n = 29; Murrah × Nili-Ravi × local (Xilin or Fuzhong) buffalo, n = 36], were used in the present study. The purebred was selected from four herds in the Southern part of Italy, while the crossbred animals were chosen from two herds located at the Hubei Jinniu farm and Guangxi Buffalo Research Institute, respectively. The crossbred individuals were 3-way cross buffaloes and selected by the pedigree information against full- or half-sib animals. Genomic DNA was isolated from the blood sample using the standard phenol-chloroform extraction protocol. Genotyping was conducted at the Delta Genomics (Edmonton AB, Canada) using the Axiom® Buffalo SNP Genotyping Array. Quality control (QC) was performed using PLINK v1.90 (Purcell et al., 2007) software under the following criteria: call rate ≥ 0.95, minor allele frequency (MAF) ≥ 0.05, and highly significant deviations (P ≥ 10−6) from Hardy-Weinberg Equilibrium (HWE). For the studied populations, principal component analysis (PCA) was used to estimate the population admixture using the R (Null et al., 2013) with the aim to identify the unrelated individuals (Figure S1). Finally, remaining SNPs for purebred (n = 411) and crossbred (n = 45) buffaloes after QC were included for further analysis.
Minor Allele Frequency and Haplotype Blocks Construction
The PLINK v1.90 (Purcell et al., 2007) was utilized to calculate the MAF for each SNP in the studied population, and their results were analyzed and plotted using the in-house R-scripts.
Haplotype block structure characterizes the typical patterns of LD in populations and has immediate implications for genetic studies (Guryev et al., 2006). Here, the inference of haplotype was performed using the Expectation Maximization (EM) algorithm approach implemented in PLINK v1.90 (Purcell et al., 2007) with the default parameters.
Linkage Disequilibrium Analysis
The LD was determined using the pairwise r2 (Hill and Robertson, 1968) and calculated for each pair of loci on each chromosome (Lynch and Walsh, 1997). The equation for LD estimate is represented as follows:
where, pA, pa, pB, and pb are the frequencies of alleles A, a, B, and b, respectively; pAB, pab, pAb, and paB are the haplotype frequencies among the alleles in the population. The LD values for each breed were separately estimated using the genome-wide SNP data. The LD decay was then estimated for 10 kb intervals (from 0 to 1,000 kb). Three minimum MAF thresholds (MAF ≥ 0.05, MAF ≥ 0.1, MAF ≥ 0.2) were selected for calculating the effects of MAF on LD estimate.
Random sampling for the purebred population was performed by taking bootstrap subsamples of size 25, 45, 51, 55, 102, 205, and 411 for the r2 estimation, aiming to estimate the effect of samples size on LD. One thousand replicates for each sample size were generated and used for calculating the average r2 values. All procedures for each samples size were performed using the in-house R scripts.
Persistence of Phase
Persistence of phase can be used to determine the genetic relationships among populations and the reliability of the GS across different populations (Goddard et al., 2006). In this study, the SNPs that were common to the populations were selected to estimate the LD phase with the following equation (Badke et al., 2012):
where, RP, C = the correlation of phase between rij(P) in the purebred (P) and rij(C) in the crossbred (C) population, S(P) and S(C) = the standard deviations of rij(P) and rij(C), respectively, and = the average rij across all SNP i and j within interval l for populations P and C, respectively. Pearson correlations among the positive r-values between the populations were estimated for 100 kb intervals (from 0 to 1,000 kb) using the in-house R scripts.
Effective Population Size
The Ne was estimated using the SNeP tool (Barbato et al., 2015) based on the relationship between r2, Ne, and c (recombination rate) (Sved, 1971). The equation is as follows:
where NT = the effective population size t generations ago calculated as t = (2∫(ct))−1(Hayes et al., 2003), ct = the recombination rate; r2adj = r2 – (βn)−1where r2adj = the LD value adjusted for sample size (n = sample size, β = 2 when the gametic phase is known and β = 1 if unknown) and α = a correction for the occurrence of mutations (Ohta and Kimura, 1971).
Results
Marker Statistics
After removing the duplicate and chromosomal unknown SNPs, a total of 62,716 genotyped autosomal SNPs was obtained in this study. Of them, 55,090 SNPs for purebred and 55,032 SNPs for crossbred passed quality control, respectively. Moreover, both shared 52,478 SNPs (Table S1). A summary of the SNP distribution in each population was shown in Table 1. The SNPs covered ~2.47 Gb of the buffalo autosomal genome. The number of SNPs per autosome ranged from 997 to 4,627, and the average physical distance between SNPs was 44.96 kb for crossbred and 44.94 kb for the purebred breed. Moreover, the average MAF over all autosomes was 0.29 ± 0.13 in purebred and 0.32 ± 0.12 in crossbred populations, and the purebred had the higher percentage of SNPs with MAF in the range 0.05–0.1 than that of the crossbred (Figure S2).
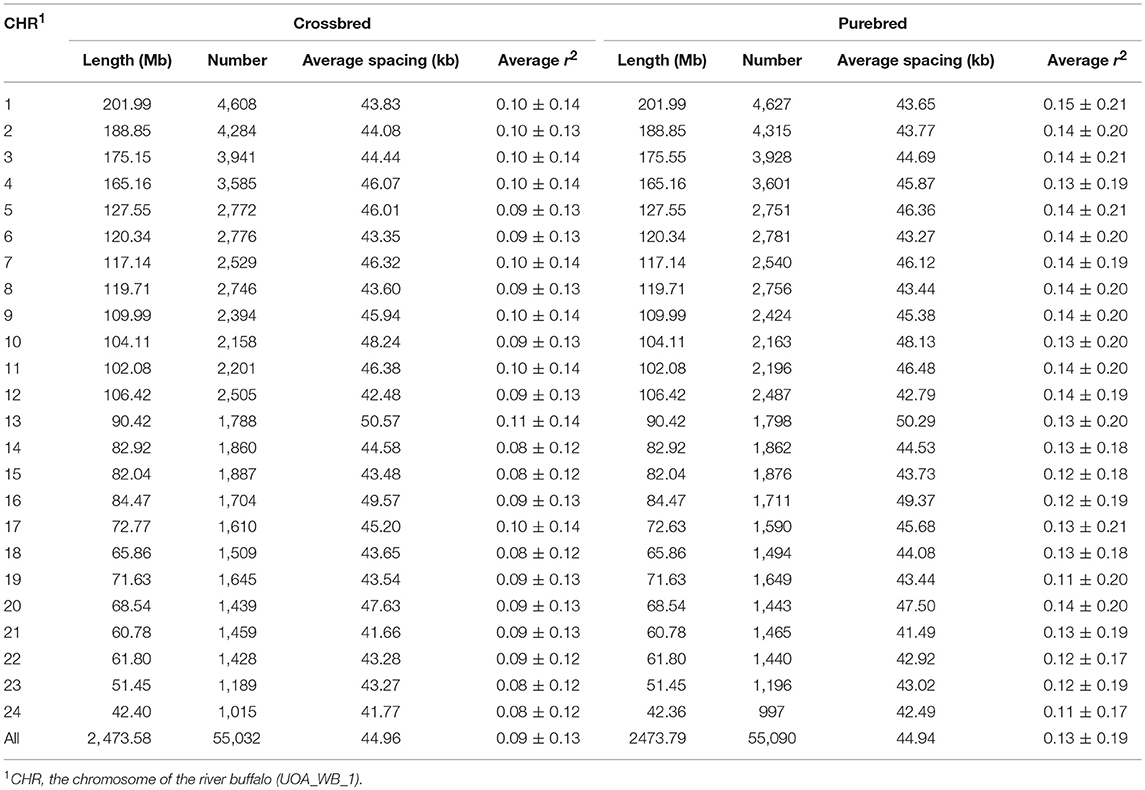
Table 1. Summary of SNP distribution and average r2 between adjacent SNPs for chromosome within the crossbred and purebred populations.
Haplotype Block Structure
The distribution of genome-wide haplotype block within the population was shown in Table 2. After quality control, 20.04% of SNPs formed haploblocks in the purebred but only 4.71% in the crossbred population. A total of 4,557 and 722 haploblocks were detected in the purebred and crossbred populations, with the mean length of 123.08 and 82.10 kb, respectively. For the purebred population, a total of 2,564 (56.27%) haplotype blocks with the genome length >123.08 kb, and 69 blocks with the length >1.99 Mb were detected. Notably, the purebred population had the longest block coverage (560.88 Mb) in haploblock. In the crossbred population, 368 (50.97%) haplotype blocks were detected with length more than 82.10 kb, and two of them were longer than 1.99 Mb. The mean number of SNPs within the haplotype blocks was 4.36 and 3.59 for the purebred and crossbred breeds, respectively. The maximum number of SNPs within the haplotype block was 11 for purebred and 12 for crossbred, respectively.
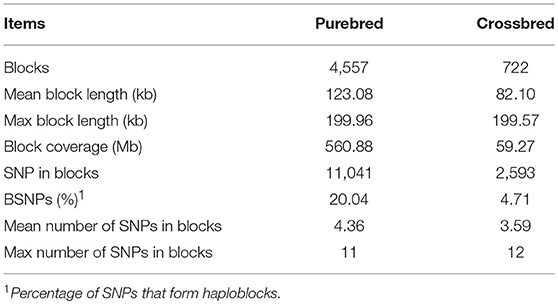
Table 2. Summary statistics for haploblock structure in purebred and crossbred buffalo populations.
Linkage Disequilibrium Analysis
LD is a fundamental approach for unveiling the genetic architecture of economically important traits in livestock species (Mckay et al., 2007). Here, the estimated overall LD in the two populations was different (Figure 1A). As expected, the average r2 in LD tended to decrease by increasing marker distance between pairwise SNPs, with a rapidly declining trend being observed over the first 200 kb. Compared with the purebred breed, the distance at which r2 decayed below 0.2 was considerably smaller in the crossbred population. Observed LD declined from 0.67 to 0.20 was ~50 and 170 kb of marker distance in the purebred and crossbred (Figure 1B), respectively. The average r2 between adjacent SNPs across all autosomes was 0.13 ± 0.19 for the purebred and 0.09 ± 0.13 for crossbred populations (Table 1). Furthermore, with r2 > 0.2, about 20.68 and 13.97% pairwise SNPs were found in purebred and crossbred. With r2 > 0.3, about 13.42 and 7.02% were found in purebred and crossbred, respectively.
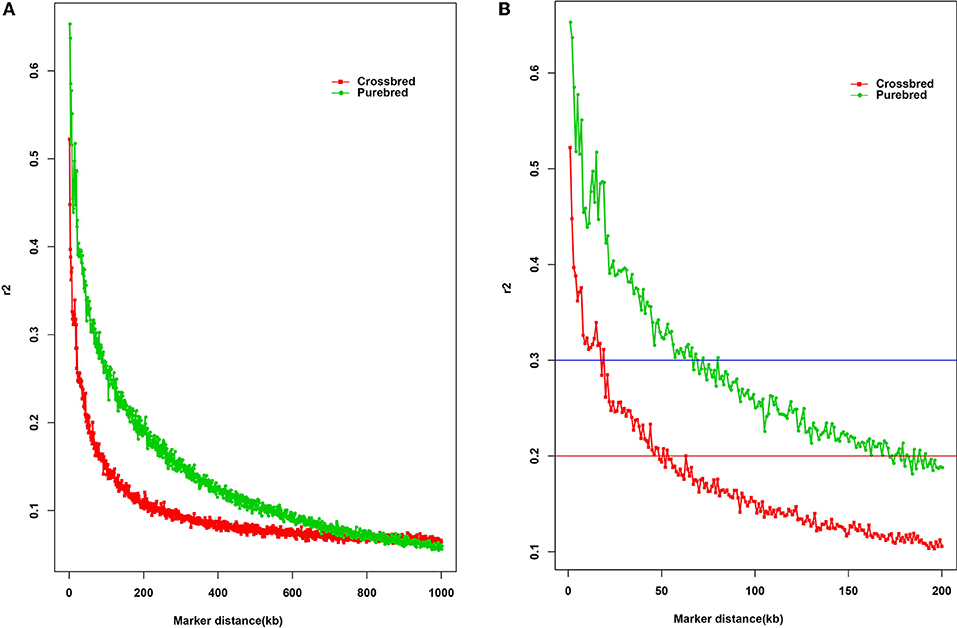
Figure 1. The decay of LD by distance in purebred and crossbred buffalo breeds. The solid square line with red color represents the crossbred; the solid circle line with green color represents the purebred; Red line represents the r2 value of 0.2; Blue line represents the r2 value of 0.3. (A) Plotted for marker distances (up to 1000 kb); (B) Plotted for marker distances (up to 200 kb).
Three different minimum MAF thresholds (0.05, 0.1, and 0.2) were selected to estimate the potential effect of MAF on the extent of LD (Figure 2). Overall, a rapidly declining trend of r2 values was found over short inter-marker distances (< 100 kb), especially the average r2 increased with MAF in the purebred (Figure 2A) and crossbred (Figure 2B) breeds.
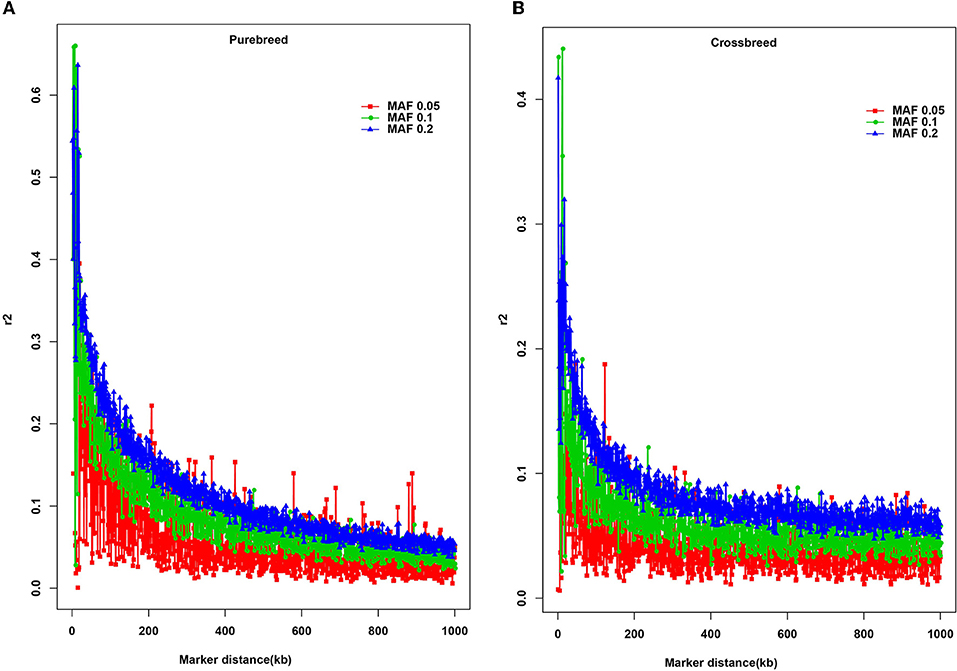
Figure 2. Average r2 estimates at different genetic distances for three different minor allele frequency (MAF) thresholds. The solid square line with red color represents the MAF ≥ 0.05; the solid circle line with green color indicates the MAF ≥ 0.1; the solid triangle line with blue color represents the MAF ≥ 0.2. (A) Average r2 estimates for the purebreed population; (B) Average r2 estimates for the crossbreed population.
Seven different subsamples of purebred were used to evaluate the effect of sample size on LD estimates (Figure 3). This bias was increased with the decrease of subsample size. There was little change of LD estimates when the sample size >45. An overestimation of r2 was found when sample size was as small as 25.
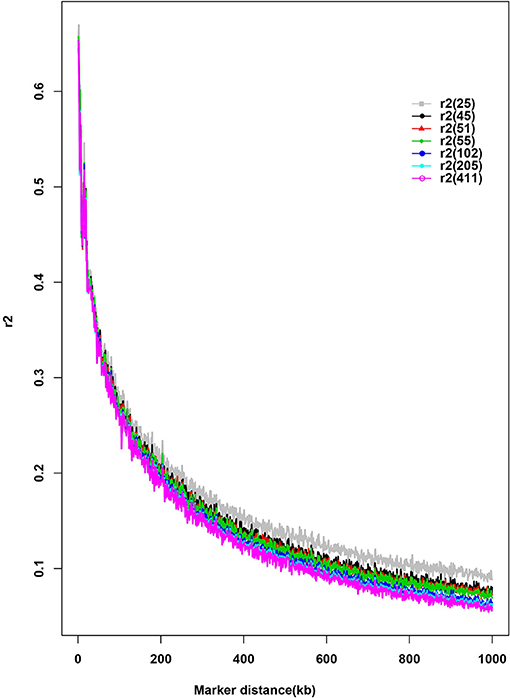
Figure 3. Distribution of average pairwise r2 by sample size and distance. The number in parenthesis in the legend indicates the sample size of each subset.
Persistence of Phase
The statistic r-values were used to estimate the extent of persistence of allelic phase in the studied population shown (Figure 4). Overall, a declining trend was observed in the phase correlations between the breeds with an increase of distances between SNPs. The largest phase correlation (RP, C = 0.47) for the two populations was observed at the distance < 100 kb, whereas the lowest correlation (RP, C = 0.07) was observed at the distance of 900–1,000 kb.
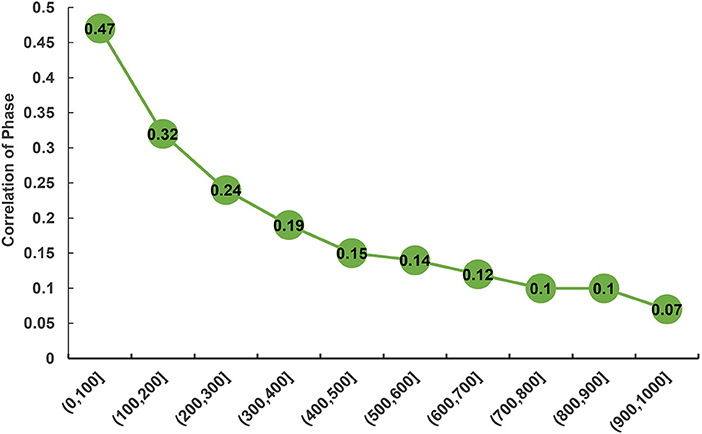
Figure 4. Correlation of phase between purebred and crossbred buffalo populations for SNP pairs at varying distances.
Effective Population Size
Historical and recent effective population size estimates were presented in Figure 5. In total, the historical Ne declined from 1,000 to 100 generations ago across the two studied populations (Figure 5A). The purebred breed had higher estimates of Ne than the crossbred breed at 66 generations ago, and vice versa. A rapid decreasing recent Ne was observed in the crossbred, while the purebred had a slow Ne decline (Figure 5B), and their estimated values were closer to 113 and 387 at 13 generations ago, respectively.
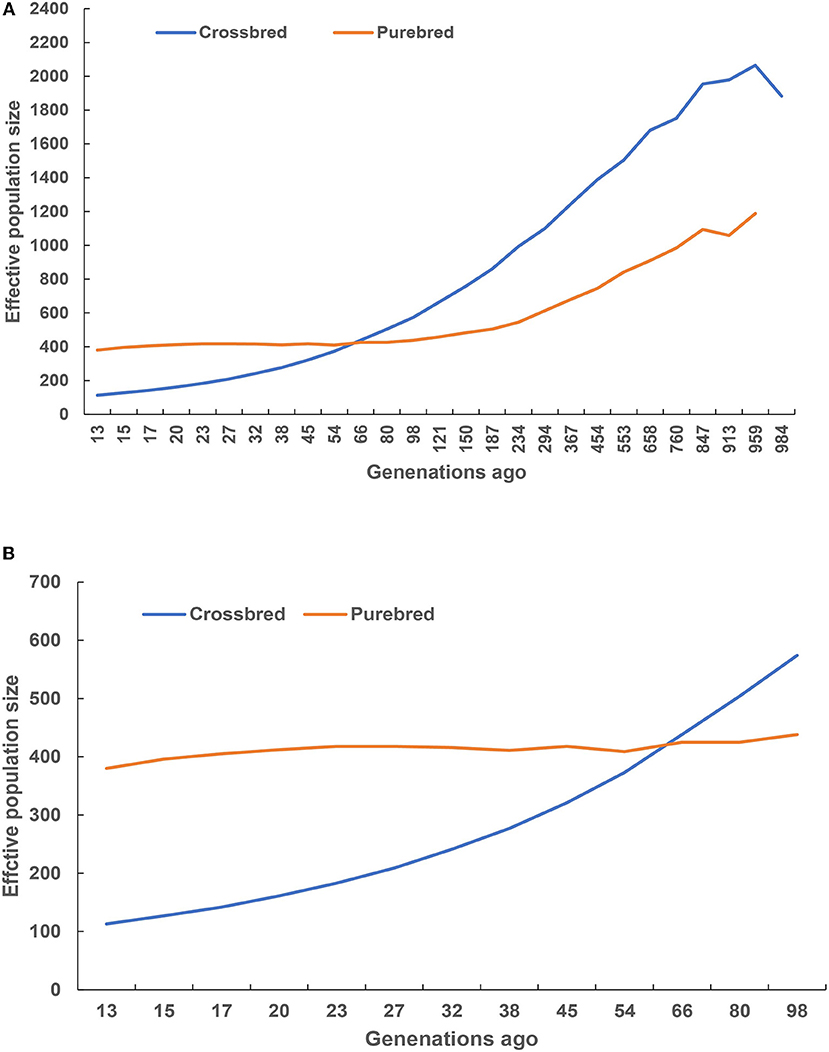
Figure 5. Historical (A) and recent (B) effective population size estimated using linkage disequilibrium.
Discussion
To the extent of our knowledge, this is the first study to characterize the extent of LD, compare the consistency of phase, and estimate the effective population size in the crossbred and purebred buffalo populations. Numerous previous studies described the extent and pattern of LD in different domestic species by using the genome-wide SNP data (Do et al., 2014; Porto-Neto et al., 2014; Al-Mamun et al., 2015), all of which essentially increased the GWAS and GS efficiency and accuracies, and contributed to accelerate the genetic progress in economically important traits. In the present study, we utilized the Axiom® Buffalo SNP genotyping array to estimate the extent of LD, the persistence of phase and Ne between purebred and crossbred buffalo populations. Interestingly, a similar proportion (87.84% for purebred vs. 87.75% for crossbred) of SNPs was generated between the two populations after the QC, whereas compared to crossbred breed, a higher proportion of SNPs with MAF in the range 0.05–0.1 was found in the purebred breed. The average MAF over all autosomes was 0.29 ± 0.13 in purebred and 0.31 ± 0.12 in crossbred populations, which was slightly higher than that of MAF (0.22) in Brazilian buffaloes described by Cardoso et al. (2014). Accumulating evidence has revealed the SNPs with low allele frequencies tend to underestimate the r2 values in LD between SNPs (Qanbari et al., 2010; Espigolan et al., 2013). Therefore, three different MAF thresholds (0.05, 0.1, and 0.2) were selected and utilized to estimate the effect of MAF on the extent of LD. The results showed the average r2 of LD increased with the increase of MAF across the studies breeds, especially a rapidly declining trend of r2 values were detected at short distances (< 100 kb). Similar results were reported in other species, such as cattle (Khatkar et al., 2008) and goat (Mdladla et al., 2016). Hence, the current river buffalo SNP genotyping array can be used for the genetic studies on this species.
Previous evidence showed that small sample size (n ≤ 25) leads to biased estimates of LD (Khatkar et al., 2008). In this regard, Bohmanova et al. (2010) highlighted that a minimal sample size of 55 animals was required for accurate estimation of LD by r2 values. In this study, our data also demonstrated the small samples size (n = 25) resulted in an overestimation of r2. Interestingly, the averages r2 values for the samples with 45 individuals were consistent with that of sample size with 55 animals, implying that samples with at least 45 animals in the current study had no influence on the estimates of r2. Consequently, a lower sample size of crossbred buffalo (n = 45) in the present study did not affect the consistency of r2 values in both breed groups, which is consistent with the previous study by Makina et al. (2015) in four South African Sanga cattle breeds (29 ≤ sample size ≤ 54). Similarly, two different studies with a significant difference in their sample size (817 vs. 24 Thoroughbred horses) reported similar LD decay pattern as r2 values decreased from 0.6 to 0.2 when the distance between SNPs was increased to 0.5 Mb (Wade et al., 2009; Corbin et al., 2010). Therefore, we hypothesize that the sample size in our studied population (n = 45) might not have a significant effect on the r2 values. However, the interpretation of this inference needs to be confirmed by the large sample size of unrelated individuals.
Characterization of the haplotype block structure provides useful parameters to guide the GWAS and GS (Mokry et al., 2014). In our study, the purebred breed (4,557) had more haplotype blocks than that of the crossbred breed (722). Meanwhile, a higher mean block size with 123.08 ± 61.72 kb in the purebred was detected compared to that of the crossbred (82.10 ± 66.96 kb). We believe that these discrepancies are caused by the SNP ascertainment bias due to the procedure to design SNP array and/or the unbalanced number of purebred and crossbred buffaloes. Moreover, the crossbred population had smaller block coverage (59.27 Mb) in haploblocks. Only 4.71% of SNPs formed haploblocks in the crossbred population, compared to 20.04% in the purebred buffaloes. The finding suggested that most SNPs did not form haploblocks in the crossbred populations because of the small extent of LD. Also, these data indicated that the use of high-throughput sequencing approach was suggested to identify specific SNPs for the crossbreed buffaloes, such as Restriction-site associated DNA sequencing (RAD-seq) (Zhai et al., 2015), Specific-Locus Amplified Fragment Sequencing (SLAF-seq) (Li et al., 2017), and genotyping by sequencing (GBS) (De Donato et al., 2013). We inferred that the crossbred population in the present study were 3-way cross buffaloes with the bloodlines from the swamp and river buffaloes, but the current buffalo SNP array only provided the polymorphic SNPs across four river breeds (Mediterranean, Murrah, Jaffarabadi, and Nili-Ravi), resulting in the small haploblock size in crossbred populations.
Some critical average r2 values can be indicative of the GWAS and estimation of genomic breeding value, for example, the average r2 value of 0.3 is indicative of GWAS (Ardlie et al., 2002), while for genomic selection, r2 value of 0.2 can be served as enough to achieve an accuracy of 0.85 for GEBV (Meuwissen et al., 2001). Our study showed that at distance of 200 kb, crossbred buffalo breed showed higher rates of LD decay than the purebred breed (Figure 1B). In other words, the crossbred populations showed a small extent and rapid decay of LD by distance for all autosomes compared with the purebred population. Moreover, observed LD in the crossbred and purebred breeds decreased from 0.67 to 0.30 at ~10 and 60 kb of marker distance, respectively (Figure 1B, blue horizontal line at r2 = 0.3). Mckay et al. (2007) reported that for the whole genome association mapping, it would require 28,700 [2.87 GB/100 kb at LD (r2) = 0.2] fully informative SNPs to saturate the genome at an average resolution of 100 kb based on the bovine genome size (2.87 Gb). Here, our data suggested that a minimum of 47,000 [2.83 Gb/60 kb at LD (r2) = 0.3] SNP markers, calculated based on the buffalo genome size of 2.83 Gb approximately (Williams et al., 2017), would be needed to capture most of the LD information necessary for GWAS in two populations. The LD (r2) dropped to < 0.2 at distances between SNPs of ~50 kb in the crossbred population, whereas this drop in the purebred was observed for much greater distances (~170 kb) (Figure 1B, red horizontal line at r2 = 0.2). A similar result for the extent of LD was found between the crossbred beef cattle and purebred Angus and Charolais cattle (Lu et al., 2012). Our finding also indicated that a minimum of 16,500 SNPs [2.83 Gb/170 kb at LD (r2) = 0.2] is required for the genomic selection analysis in buffaloes. Similarly, Cardoso et al. (2014) observed moderate r2 levels (0.20–0.32) at the marker distances of 10 ~ 70 kb in Brazilian buffaloes using the buffalo 90K SNP genotyping array, which is consistent with that of our data for the purebred population. Alternately, although at least 20.68% of adjacent SNP pairs had an r2 > 0.2 and 13.42% had an r2 > 0.3 in the purebred population, only 7.02% of adjacent SNP pairs of the 90K SNP panel showed an r2 > 0.3 in the crossbred population. Therefore, our data suggested that a higher density SNP array were required for the implementation of GS in the Chinese crossbred buffalos.
Understanding the persistence of LD phase is another essential strategy for GS across breeds or population because SNPs pairs can exhibit the difference of LD phases between two populations (Goddard et al., 2006; Daetwyler et al., 2010). The correlation of the signed r value represents the degree of genetic relationship between two populations (de Roos et al., 2008), and determines the marker density to conduct multi-breed GS (Makina et al., 2015). Our estimates of phase correlation revealed a declining trend with increasing distance between SNPs, with the largest correlation of phase (RP, C = 0.47) observed at the distance of < 100 kb. This finding indicated that the phase might be not actively preserved between breeds. Based on this finding, we assume that to increase the markers density in the array is an alternative solution for increasing the correlation of LD phase, and an adequate representation of each breed needs to be employed in the reference population when considering the application of GS in a multi-breed training population.
The Ne is widely regarded as one of the most critical parameters in both evolutionary and conservation biology (Charlesworth, 2009; Li and Kim, 2015), as it determines the accuracy of genomic selection (Goddard, 2009; Daetwyler et al., 2010). The current study observed the decreased pattern of Ne from 1,000 to 100 generations ago across the two studied population, indicating a reflection of the historical process of domestication and breed formation. Remarkably, the crossbred breed displayed higher Ne estimates after 66 generations ago, suggesting that these animals could have been influenced by the artificial selection. Moreover, a decreasing recent Ne was observed for the purebred and crossbred breeds, and their estimated values were closer to 387 and 113 at 13 generations ago, suggesting that these animals were subjected to strong selection or genetic drift that resulted in decrease population decline. However, the crossbred breeds were hybrid animals from the river and swamp buffalo subspecies, implying that these animals contained the admixture signals from hybrid genomes. In other words, the admixture signals biased estimate of the Ne upward throughout time (Orozco-Terwengel and Bruford, 2014). Therefore, the estimated Ne in the crossbred population was overestimated due to admixture signals. Alternatively, it is well-known that a small Ne means the reduction of genetic variation in the population, thereby hindering the genetic progress (Ni et al., 2012). In particular, Ne of at least 50 to 100 recommended by FAO should be maintained in animal breeding (Sørensen et al., 2005). Meuwissen and Woolliams (1994) stressed that fitness in livestock populations might decrease due to inbreeding depression. The estimated Ne, 13 generations ago for the purebred and crossbred buffaloes in the current study were well above the recommended numbers. However, the Ne slope in Figure 5B suggested that the crossbred population size was consistently decreasing, implying that actions are needed to maintain sufficiently large Ne, such as the reduction of wider use of artificial insemination, introducing new bloodlines from exotic river buffalo, as well as smaller progeny groups for elite sires and an increase in recorded buffalo bull numbers.
Conclusions
In this work, our data reveal the presence of different extents of LD between purebred and crossbred buffalo populations, with purebred having highest levels of LD. Estimated r2 ≥ 0.2 extended up to ~50 kb in crossbred and 170 kb in purebred populations, while average r2 values ≥ 0.3 were respectively observed in the 10 and 60 kb in the crossbred and purebred populations. Furthermore, we observe an initial pattern of decreasing Ne with estimated values closer to 113 for crossbred and 387 for purebred at 13 generations ago, suggesting that the declining trend in the Ne of the Chinese crossbred buffaloes should be avoided, or the genetic variation in the population should be enriched by introducing new bloodlines from exotic river buffalo. Further confirmatory investigations for the crossbred breeds are required on the larger population set.
Data Accessibility
The genotype data used in the present study are available from the Dryad Repository (doi: 10.5061/dryad.310pf05).
Author Contributions
TD, AL, JL, MC, BG, AS, ZW, CZ, GP, and GC collected the buffalo blood samples. TD conceived and carried out the analysis, interpreted the data and wrote the manuscript. TD and LY conceived the study and participated in its design and coordination. GH, TY, SL, HR, XL, and LY reviewed the paper. All authors read and approved the manuscript.
Conflict of Interest Statement
The authors declare that the research was conducted in the absence of any commercial or financial relationships that could be construed as a potential conflict of interest.
Acknowledgments
This project was supported by National Key R&D Program of China (No. 2017YFD0501903), National Natural Science Foundation of China (No. 31772602 and No. 31772604), and the Earmarked Fund for Modern Agro-industry Technology Research System (CARS-36). Moreover, the authors acknowledge the contributions of the two (Italy and Canada) research institutions and all field staff and participants in our research. We also appreciate Angela Christine OKI for the language editing of this paper.
Supplementary Material
The Supplementary Material for this article can be found online at: https://www.frontiersin.org/articles/10.3389/fgene.2018.00688/full#supplementary-material
Figure S1. Population structure of purebred and crossbred buffalo revealed by the principal component analysis. (A) The studied population before quality control filters; (B) the studied population after quality control filters.
Figure S2. Minor allele frequencies for SNPs that passed quality control by breeds.
Table S1. Number of SNPs genotyped and remained after quality control filters.
References
Akdemir, D., Sanchez, J. I., and Jannink, J. L. (2015). Optimization of genomic selection training populations with a genetic algorithm. Genet. Sel. Evol. 47:38. doi: 10.1186/s12711-015-0116-6
Al-Mamun, H. A., Clark, S. A., Kwan, P., and Gondro, C. (2015). Genome-wide linkage disequilibrium and genetic diversity in five populations of Australian domestic sheep. Genet. Sel. Evol. 47:90. doi: 10.1186/s12711-015-0169-6
Ardlie, K. G., Kruglyak, L., and Seielstad, M. (2002). Patterns of linkage disequilibrium in the human genome. Nat. Rev. Genet. 3, 299–309. doi: 10.1038/nrg777
Badke, Y. M., Bates, R. O., Ernst, C. W., Schwab, C., and Steibel, J. P. (2012). Estimation of linkage disequilibrium in four US pig breeds. BMC Genomics 13:24. doi: 10.1186/1471-2164-13-24
Barbato, M., Orozco-Terwengel, P., Tapio, M., and Bruford, M. W. (2015). SNeP: a tool to estimate trends in recent effective population size trajectories using genome-wide SNP data. Front. Genet. 6:109. doi: 10.3389/fgene.2015.00109
Biegelmeyer, P., Gulias-Gomes, C. C., Caetano, A. R., Steibel, J. P., and Cardoso, F. F. (2016). Linkage disequilibrium, persistence of phase and effective population size estimates in Hereford and Braford cattle. BMC Genet. 17:32. doi: 10.1186/s12863-016-0339-8
Bohmanova, J., Sargolzaei, M., and Schenkel, F. S. (2010). Characteristics of linkage disequilibrium in North American Holsteins. BMC Genomics 11:421. doi: 10.1186/1471-2164-11-421
Brito, F. V., Braccini, N. J., Mehdi, S., Cobuci, J. A., and Schenkel, F. S. (2011). Accuracy of genomic selection in simulated populations mimicking the extent of linkage disequilibrium in beef cattle. BMC Genet. 12:80. doi: 10.1186/1471-2156-12-80
Calus, M. P., Meuwissen, T. H., De Roos, A. P., and Veerkamp, R. F. (2008). Accuracy of genomic selection using different methods to define haplotypes. Genetics 178, 553–561. doi: 10.1534/genetics.107.080838
Cañas-Álvarez, J. J., Mouresan, E. F., Varona, L., Diaz, C., Molina, A., Baro, J. A., et al. (2016). Linkage disequilibrium, persistence of phase, and effective population size in Spanish local beef cattle breeds assessed through a high-density single nucleotide polymorphism chip. J. Anim. Sci. 94, 2779–2788. doi: 10.2527/jas.2016-0425
Cardoso, D. F., Borquis, R. R. A., Santos, D. J. A., Hurtado-Lugo, N., Camargo, G. M. D., Scalez, D. C., et al. (2014). “Study of linkage Disequilibrium in Brazilian Milk Buffaloes,” in World Congress on Genetics Applied To Livestock. Production (Vancouver, BC).
Charlesworth, B. (2009). Fundamental concepts in genetics: effective population size and patterns of molecular evolution and variation. Nat. Rev. Genet. 10, 195–205. doi: 10.1038/nrg2526
Corbin, L. J., Blott, S. C., Swinburne, J. E., Vaudin, M., Bishop, S. C., and Woolliams, J. A. (2010). Linkage disequilibrium and historical effective population size in the Thoroughbred horse. Anim. Genet. 41 (Suppl 2), 8–15. doi: 10.1111/j.1365-2052.2010.02092.x
Daetwyler, H. D., Pong-Wong, R., Villanueva, B., and Woolliams, J. A. (2010). The impact of genetic architecture on genome-wide evaluation methods. Genetics 185, 1021–1031. doi: 10.1534/genetics.110.116855
De Donato, M., Peters, S. O., Mitchell, S. E., Hussain, T., and Imumorin, I. G. (2013). Genotyping-by-sequencing (GBS): a novel, efficient and cost-effective genotyping method for cattle using next-generation sequencing. PLoS ONE 8:e62137. doi: 10.1371/journal.pone.0062137
de Roos, A. P., Hayes, B. J., Spelman, R. J., and Goddard, M. E. (2008). Linkage disequilibrium and persistence of phase in Holstein-Friesian, Jersey and Angus cattle. Genetics 179, 1503–1512. doi: 10.1534/genetics.107.084301
Do, K. T., Lee, J. H., Lee, H. K., Kim, J., and Park, K. D. (2014). Estimation of effective population size using single-nucleotide polymorphism (SNP) data in Jeju horse. J. Anim. Sci. Technol. 56:28. doi: 10.1186/2055-0391-56-28
Espigolan, R., Baldi, F., Boligon, A. A., Souza, F. R., Gordo, D. G., Tonussi, R. L., et al. (2013). Study of whole genome linkage disequilibrium in Nellore cattle. BMC Genomics 14:305. doi: 10.1186/1471-2164-14-305
Goddard, M. (2009). Genomic selection: prediction of accuracy and maximisation of long term response. Genetica 136, 245–257. doi: 10.1007/s10709-008-9308-0
Goddard, M. E., Hayes, B., Mcpartlan, H., and Chamberlain, A. J. (2006). “Can the same genetic markers be used in multiple breeds?” in Proceedings of the 8th World Congress on Genetics Applied to Livestock Production (Belo Horizonte), 16–22.
Guryev, V., Smits, B. M. G., Belt, J. V. D., Verheul, M., Hubner, N., and Cuppen, E. (2006). Haplotype block structure is conserved across mammals. PLoS Genet. 2:e121. doi: 10.1371/journal.pgen.0020121
Hayes, B. J., Visscher, P. M., Mcpartlan, H. C., and Goddard, M. E. (2003). Novel multilocus measure of linkage disequilibrium to estimate past effective population size. Genome Res. 13, 635–643. doi: 10.1101/gr.387103
Hill, W. G., and Robertson, A. (1968). Linkage disequilibrium in finite populations. Theor. Appl. Genet. 38, 226–231. doi: 10.1007/BF01245622
Husemann, M., Zachos, F. E., Paxton, R. J., and Habel, J. C. (2016). Effective population size in ecology and evolution. Heredity (Edinb). 117, 191–192. doi: 10.1038/hdy.2016.75
Khatkar, M. S., Nicholas, F. W., Collins, A. R., Zenger, K. R., Cavanagh, J. A., Barris, W., et al. (2008). Extent of genome-wide linkage disequilibrium in Australian Holstein-Friesian cattle based on a high-density SNP panel. BMC Genomics 9:187. doi: 10.1186/1471-2164-9-187
Lei, C. Z., Zhang, W., Chen, H., Lu, F., Liu, R. Y., Yang, X. Y., et al. (2007). Independent maternal origin of Chinese swamp buffalo (Bubalus bubalis). Anim. Genet. 38, 97–102. doi: 10.1111/j.1365-2052.2007.01567.x
Lenz, P. R. N., Beaulieu, J., Mansfield, S. D., Clement, S., Desponts, M., and Bousquet, J. (2017). Factors affecting the accuracy of genomic selection for growth and wood quality traits in an advanced-breeding population of black spruce (Picea mariana). BMC Genomics 18:335. doi: 10.1186/s12864-017-3715-5
Li, Y., and Kim, J. J. (2015). Effective population size and signatures of selection using bovine 50K snp chips in Korean native cattle (Hanwoo). Evol. Bioinform. Online 11, 143–153. doi: 10.4137/EBO.S24359
Li, Z., Wei, S., Li, H., Wu, K., Cai, Z., Li, D., et al. (2017). Genome-wide genetic structure and differentially selected regions among Landrace, Erhualian, and Meishan pigs using specific-locus amplified fragment sequencing. Sci. Rep. 7:10063. doi: 10.1038/s41598-017-09969-6
Liu, H., and Chen, G. B. (2017). A fast genomic selection approach for large genomic data. Theor. Appl. Genet. 130, 1277–1284. doi: 10.1007/s00122-017-2887-3
Lu, D., Sargolzaei, M., Kelly, M., Li, C., Voort, G. V., Wang, Z., et al. (2012). Linkage disequilibrium in Angus, Charolais, and Crossbred beef cattle. Front. Genet. 3:152. doi: 10.3389/fgene.2012.00152
Lynch, M., and Walsh, B. (1997). Genetics and the Analysis of Quantitative Traits. New York, NY: Oxford University Press Inc.
Makina, S. O., Taylor, J. F., Van Marle-Koster, E., Muchadeyi, F. C., Makgahlela, M. L., Macneil, M. D., et al. (2015). Extent of linkage disequilibrium and effective population size in four South African sanga cattle breeds. Front. Genet. 6:337. doi: 10.3389/fgene.2015.00337
Mckay, S. D., Schnabel, R. D., Murdoch, B. M., Matukumalli, L. K., Aerts, J., Coppieters, W., et al. (2007). Whole genome linkage disequilibrium maps in cattle. BMC Genet. 8:74. doi: 10.1186/1471-2156-8-74
Mdladla, K., Dzomba, E. F., Huson, H. J., and Muchadeyi, F. C. (2016). Population genomic structure and linkage disequilibrium analysis of South African goat breeds using genome-wide SNP data. Anim. Genet. 47, 471–482. doi: 10.1111/age.12442
Meuwissen, T. H., Hayes, B. J., and Goddard, M. E. (2001). Prediction of total genetic value using genome-wide dense marker maps. Genetics 157, 1819–1829.
Meuwissen, T. H., and Woolliams, J. A. (1994). Effective sizes of livestock populations to prevent a decline in fitness. Theor. Appl. Genet. 89, 1019–1026. doi: 10.1007/BF00224533
Meuwissen, T. H. E. (2009). Accuracy of breeding values of ‘unrelated' individuals predicted by dense SNP genotyping. Genet. Sel. Evol. 41, 1–9. doi: 10.1186/1297-9686-41-35
Mokry, F. B., Buzanskas, M. E., De Alvarenga Mudadu, M., Do Amaral Grossi, D., Higa, R. H., Ventura, R. V., et al. (2014). Linkage disequilibrium and haplotype block structure in a composite beef cattle breed. BMC Genomics 15 (Suppl. 7):S6. doi: 10.1186/1471-2164-15-S7-S6
Newell, M. A., and Jannink, J. L. (2014). Genomic selection in plant breeding. Methods Mol. Biol. 1145, 117–130. doi: 10.1007/978-1-4939-0446-4_10
Ni, G. Y., Zhang, Z., Jiang, L., Ma, P. P., Zhang, Q., and Ding, X. D. (2012). [Chinese Holstein Cattle effective population size estimated from whole genome linkage disequilibrium]. Yi Chuan 34, 50–58. doi: 10.3724/SP.J.1005.2012.00050
Null, R. C. T. R., Team, R., Null, R. C. T., Core Writing, T., Null, R., Team, R., et al. (2013). R: A language and environment for statistical computing. Computing 14, 12–21.
Ohta, T., and Kimura, M. (1971). Linkage disequilibrium between two segregating nucleotide sites under the steady flux of mutations in a finite population. Genetics 68, 571.
Orozco-Terwengel, P. A., and Bruford, M. W. (2014). Mixed signals from hybrid genomes. Mol. Ecol. 23, 3941–3943. doi: 10.1111/mec.12863
Park, L. (2011). Effective population size of current human population. Genet. Res. (Camb). 93, 105–114. doi: 10.1017/S0016672310000558
Porto-Neto, L. R., Kijas, J. W., and Reverter, A. (2014). The extent of linkage disequilibrium in beef cattle breeds using high-density SNP genotypes. Genet. Sel. Evol. 46:22. doi: 10.1186/1297-9686-46-22
Purcell, S., Neale, B., Todd-Brown, K., Thomas, L., Ferreira, M. A., Bender, D., et al. (2007). PLINK: a tool set for whole-genome association and population-based linkage analyses. Am. J. Hum. Genet. 81, 559–575. doi: 10.1086/519795
Qanbari, S., Pimentel, E. C., Tetens, J., Thaller, G., Lichtner, P., Sharifi, A. R., et al. (2010). The pattern of linkage disequilibrium in German Holstein cattle. Anim. Genet. 41, 346–356. doi: 10.1111/j.1365-2052.2009.02011.x
Solberg, T. R., Sonesson, A. K., Woolliams, J. A., and Meuwissen, T. H. (2008). Genomic selection using different marker types and densities. J. Anim. Sci. 86, 2447–2454. doi: 10.2527/jas.2007-0010
Sørensen, A. C., Sorensen, M. K., and Berg, P. (2005). Inbreeding in Danish dairy cattle breeds. J. Dairy Sci. 88, 1865–1872. doi: 10.3168/jds.S0022-0302(05)72861-7
Sved, J. A. (1971). Linkage disequilibrium and homozygosity of chromosome segments in finite populations. Theor. Popul. Biol. 2, 125–141. doi: 10.1016/0040-5809(71)90011-6
Tenesa, A., Navarro, P., Hayes, B. J., Duffy, D. L., Clarke, G. M., Goddard, M. E., et al. (2007). Recent human effective population size estimated from linkage disequilibrium. Genome Res. 17, 520–526. doi: 10.1101/gr.6023607
Vanraden, P. M. (2008). Efficient methods to compute genomic predictions. J. Dairy Sci. 91, 4414–4423. doi: 10.3168/jds.2007-0980
Wade, C. M., Giulotto, E., Sigurdsson, S., Zoli, M., Gnerre, S., Imsland, F., et al. (2009). Genome sequence, comparative analysis, and population genetics of the domestic horse. Science 326, 865–867. doi: 10.1126/science.1178158
Wang, J., Santiago, E., and Caballero, A. (2016). Prediction and estimation of effective population size. Heredity (Edinb). 117, 193–206. doi: 10.1038/hdy.2016.43
Weller, J. I., Ezra, E., and Ron, M. (2017). Invited review: a perspective on the future of genomic selection in dairy cattle. J. Dairy Sci. 100, 8633–8644. doi: 10.3168/jds.2017-12879
Williams, J. L., Iamartino, D., Pruitt, K. D., Sonstegard, T., Smith, T. P. L., Low, W. Y., et al. (2017). Genome assembly and transcriptome resource for river buffalo, Bubalus bubalis (2n = 50). Gigascience 6:gix088. doi: 10.1093/gigascience/gix088
Yue, X. P., Li, R., Xie, W. M., Xu, P., Chang, T. C., Liu, L., et al. (2013). Phylogeography and Domestication of Chinese Swamp Buffalo. PLoS ONE 8:e56552. doi: 10.1371/journal.pone.0056552
Keywords: buffalo, effective population size, linkage disequilibrium, persistence of phase, purebred population, crossbred population
Citation: Deng T, Liang A, Liu J, Hua G, Ye T, Liu S, Campanile G, Plastow G, Zhang C, Wang Z, Salzano A, Gasparrini B, Cassandro M, Riaz H, Liang X and Yang L (2019) Genome-Wide SNP Data Revealed the Extent of Linkage Disequilibrium, Persistence of Phase and Effective Population Size in Purebred and Crossbred Buffalo Populations. Front. Genet. 9:688. doi: 10.3389/fgene.2018.00688
Received: 03 July 2018; Accepted: 11 December 2018;
Published: 08 January 2019.
Edited by:
Peng Xu, Xiamen University, ChinaReviewed by:
Dan Nonneman, United States Department of Agriculture, United StatesYu Jiang, Northwest A&F University, China
Fábio Pértille, Universityof São Paulo, Brazil
Copyright © 2019 Deng, Liang, Liu, Hua, Ye, Liu, Campanile, Plastow, Zhang, Wang, Salzano, Gasparrini, Cassandro, Riaz, Liang and Yang. This is an open-access article distributed under the terms of the Creative Commons Attribution License (CC BY). The use, distribution or reproduction in other forums is permitted, provided the original author(s) and the copyright owner(s) are credited and that the original publication in this journal is cited, in accordance with accepted academic practice. No use, distribution or reproduction is permitted which does not comply with these terms.
*Correspondence: Liguo Yang, eWFuZ2xpZ3VvMjAwNkBxcS5jb20=
Aixin Liang, bGF4LnBpcGlAbWFpbC5oemF1LmVkdS5jbg==