 Brigitte Reimann1
 Bram G. Janssen1
 Rossella Alfano1
 Akram Ghantous2
 Almudena Espín-Pérez3
 Theo M. de Kok4Nelly D. Saenen1
 Bianca Cox1
 Oliver Robinson5,6
 Marc Chadeau-Hyam5,6,7Joris Penders8
 Zdenko Herceg2
 Paolo Vineis5,6,9
 Tim S. Nawrot1,10
 Michelle Plusquin1,5,6*
- 1Centre for Environmental Sciences, University of Hasselt, Hasselt, Belgium
- 2Epigenetics Group, International Agency for Research on Cancer (IARC), Lyon, France
- 3Department of Biomedical Informatics Research, Stanford University, California, CA, United States
- 4Department of Toxicogenomics, GROW School for Oncology and Developmental Biology, Maastricht University, Maastricht, Netherlands
- 5Department of Epidemiology and Biostatistics, The School of Public Health, Imperial College London, London, United Kingdom
- 6Medical Research Council-Health Protection Agency Centre for Environment and Health, Imperial College London, London, United Kingdom
- 7Institute for Risk Assessment Sciences (IRAS), Division of Environmental Epidemiology, Utrecht University, Utrecht, Netherlands
- 8Laboratory of Clinical Biology, East-Limburg Hospital, Genk, Belgium
- 9Italian Institute for Genomic Medicine (IIGM), Turin, Italy
- 10School of Public Health, Occupational and Environmental Medicine, KU Leuven, Leuven, Belgium
Mitochondrial dysfunction seems to play a key role in the etiology of insulin resistance. At birth, a link has already been established between mitochondrial DNA (mtDNA) content and insulin levels in cord blood. In this study, we explore shared epigenetic mechanisms of the association between mtDNA content and insulin levels, supporting the developmental origins of this link. First, the association between cord blood insulin and mtDNA content in 882 newborns of the ENVIRONAGE birth cohort was assessed. Cord blood mtDNA content was established via qPCR, while cord blood levels of insulin were determined using electrochemiluminescence immunoassays. Then the cord blood DNA methylome and transcriptome were determined in 179 newborns, using the human 450K methylation Illumina and Agilent Whole Human Genome 8 × 60 K microarrays, respectively. Subsequently, we performed an epigenome-wide association study (EWAS) adjusted for different maternal and neonatal variables. Afterward, we focused on the 20 strongest associations based on p-values to assign transcriptomic correlates and allocate corresponding pathways employing the R packages ReactomePA and RDAVIDWebService. On the regional level, we examined differential methylation using the DMRcate and Bumphunter packages in R. Cord blood mtDNA content and insulin were significantly correlated (r = 0.074, p = 0.028), still showing a trend after additional adjustment for maternal and neonatal variables (p = 0.062). We found an overlap of 33 pathways which were in common between the association with cord blood mtDNA content and insulin levels, including pathways of neurodevelopment, histone modification, cytochromes P450 (CYP)-metabolism, and biological aging. We further identified a DMR annotated to Repulsive Guidance Molecule BMP Co-Receptor A (RGMA) linked to cord blood insulin as well as mtDNA content. Metabolic variation in early life represented by neonatal insulin levels and mtDNA content might reflect or accommodate alterations in neurodevelopment, histone modification, CYP-metabolism, and aging, indicating etiological origins in epigenetic programming. Variation in metabolic hormones at birth, reflected by molecular changes, might via these alterations predispose children to metabolic diseases later in life. The results of this study may provide important markers for following targeted studies.
Introduction
According to the “Developmental Origins of Health and Disease” hypothesis, prenatal exposures can result in adverse health conditions later in life by increasing disease susceptibility through epigenetic programming (Barker, 1995). Metabolic factors including elevated insulin levels in early life are generally not regarded as harmful, especially when they are within physiological range. Nevertheless, small alterations may be disadvantageous over time and increase the risk of metabolic syndrome later in life.
In adults, mitochondrial dysfunction seems to play a key role in the etiology of insulin resistance (Petersen et al., 2003; Lowell and Shulman, 2005; Mogensen et al., 2007). Several detrimental environmental influences act through the generation of reactive oxygen species (ROS), which can, directly and indirectly, cause mitochondrial dysfunction (Meyer et al., 2013; Roubicek and Souza-Pinto, 2017). Also, direct interaction of stressors with components of the electron transport chain (ETC) can interfere with the ATP generation. As the baseline production of mitochondrial-generated ROS increases, the ETC itself and even the mitochondrial DNA (mtDNA) are damaged (Yakes and Van Houten, 1997). As the mtDNA primarily encodes for the components of the ETC-complexes, ROS-induced mtDNA damage potentially impairs the proper function of the ETC and in turn triggers further ROS production. Therefore, increased cellular ROS levels can have a self-amplifying effect, leading to energy depletion and mitochondrial dysfunction. One possible mechanism that links mitochondrial dysfunction to insulin resistance might be the alteration of energy-dependent epigenetic processes through changes in the energetic status of the cell. Previous research has already revealed associations between insulin levels and methylation of the mitochondrial transcription factor A (TFAM) (r = -0.49, p < 0.04; Sookoian et al., 2010), and between insulin resistance and mtDNA methylation (4.6-fold higher in insulin-resistant vs. insulin-sensitive subjects, p < 0.05; Zheng et al., 2015), which is indicative for an epigenetic link between both factors in adults.
Moreover, a surplus of glucose and accompanying high insulin levels in mothers with diabetes mellitus type 2 (DMT2) has been related to changes in DNA methylation of genes involved in pancreatic development and insulin secretion, and to an increased risk of diabetes in their adolescent and adult offspring (del Rosario et al., 2014). Although it has previously been shown that neonatal insulin levels are positively associated with cord blood mtDNA content (Vriens et al., 2018), the relationship between these two factors and the role of possible underlying epigenetic mechanisms in newborns is still unclear. It has already been proposed, that prenatal malnutrition-induced ROS may be the origin of mitochondrial dysfunction, leading to the epigenetic programming of an insulin resistant phenotype (Lee et al., 2005).
In this study, we explore shared epigenetic mechanisms between cord blood insulin levels and mtDNA content in order to clarify their underlying link. We first establish a relationship between cord blood insulin levels and mtDNA content in the ENVIRonmental influence ON early AGEing (ENVIRONAGE) birth cohort. Hereafter, we investigate the associations between epigenome-wide DNA methylation and cord blood insulin as well as mtDNA content, by focusing on individual CpG sites along with differentially methylated regional clusters of correlated and genomically proximal CpGs (DMRs). We further identify common pathways between cord blood insulin levels and mtDNA content by correlating the methylome findings with the transcriptome.
Materials and Methods
Study Population
Our study employed 1309 eligible mother-newborn pairs with only singleton newborns participating in the ENVIRONAGE birth cohort, situated in the province of Limburg, Belgium (Janssen et al., 2017). Recruitment took place between 2010 and 2016 at arrival in the delivery ward of the East-Limburg Hospital in Genk, Belgium. Maternal body mass index (BMI) was determined by dividing weight in kilograms by height in meters squared, based on data obtained during the first antenatal consultation. The conception date was assessed by combining data on the first day of the last menstrual period and the first ultrasonographic examination. After delivery, the mothers filled out a questionnaire regarding information about the in-house environment, education, occupation, health status, smoking, and lifestyle habits. The coding of maternal educational levels was carried out according to the following criteria: “low”, in the absence of any diploma; “middle”, in the presence of a high-school diploma; “high” in the presence of a college or university diploma. Maternal smoking status was categorized as “smoking during pregnancy” if the mother had smoked at any time point during pregnancy. Further, a distinction was made between mothers who had their first newborn or their second or more newborn. Newborns’ ethnicity was classified as either European, when two or more grandparents were of European origin, or as non-European when three or more grandparents were of non-European origin. Perinatal parameters such as newborns’ sex and birth date were collected by the hospital personnel after birth. Due to the availability of OMICs, mtDNA content and insulin measurements, the datasets for every research question were studied in a designated set, resulting in different numbers of participants.
Owing to the availability of mtDNA content and insulin measurements and missing data (as reported in detail in Supplementary Table S1), the analysis of associations between cord blood insulin and mtDNA content employed 882 participants. Epigenome-wide methylation status of the CpG sites was retrieved from cord blood samples in a subset of 197 newborns, enrolled between 2014 and 2015 in the framework of the EXPOsOMICS project (FP7; Vineis et al., 2017). The mother-newborn pairs recruited for this study were selected for their complete data on cord blood-insulin, mtDNA content and the applied covariates resulting in a final study sample size of 179 for the association with cord blood insulin and 176 for the association with cord blood mtDNA. Exclusion criteria and numbers due to missing data are reported in Supplementary Table S1.
The present study was conducted according to the principles outlined in the Helsinki Declaration (World Medical Association, 2013) and approved by the Ethical Committee of Hasselt University and the East-Limburg Hospital in Genk, Belgium. Written informed consent was obtained at the delivery ward from all participating mothers.
Cord Blood Sample Collection
Cord blood samples were collected in BD Vacutainer® Lithium Heparin, Plus Plastic K2EDTA Tubes (BD, Franklin Lakes, NJ, United States) immediately after delivery. The collected cord blood was centrifuged (3200 rpm for 15 min), buffy coat and plasma were instantly frozen at –80°C. DNA was extracted from white blood cells of the buffy coat using the QIAamp DNA mini kit (Qiagen, Inc., Venlo, the Netherlands) according to the manufacturer’s instructions. To retrieve RNA, samples were collected in PAXgene tubes (QIAGEN Benelux B.V., Antwerp, Belgium).
Epigenome-Wide Methylation
DNA was extracted and processed at the Epigenetics Group, IARC. Specifically, DNA was bisulfite-converted using the Zymo EZ DNA methylationTM kit (Zymo, Irvine, CA, United States). DNA was then hybridized to Illumina Infinium Human Methylation 450K BeadChip arrays (66) and scanned using the Illumina HiScanSQ system. After background subtraction using Illumina GenomeStudio raw intensity data were submitted to pre-processing, including normalization, using in-house software within the R statistical computing environment. Furthermore, quality control of samples was carried out and failed samples were excluded on the basis of Illumina’s detection p-value greater than 0.01 and bead count lower than 3. For probes using the Infinium II design additional background subtraction and dye bias correction were performed. Methylation levels at each CpG locus were expressed by Beta-values, as defined by the ratio of signal intensity originating from methylated CpGs over the sum of methylated and unmethylated CpGs. Finally, data were trimmed for outliers with values larger than 3 interquartile ranges below the first quartile or above the fourth quartile. CpG sites were annotated using the Bioconductor package IlluminaHumanMethylation450kanno.ilmn12.hg19 in R for the annotation of Illumina’s 450K methylation arrays.
Mitochondrial DNA Content
The quantity and purity ratio (A260/280 and A260/230) of the extracted DNA was assessed by spectrometric analysis using the Nanodrop 1000 spectrophotometer (Isogen, Life Science, Belgium). Until further processing the extracted DNA was stored at -80°C. mtDNA content was assessed by taking the ratio of two mitochondrial gene copy numbers [mitochondrial forward primer from nucleotide 3212/reverse primer from nucleotide 3319 (MTF3212/R3319; Supplementary Table S2) and mitochondrial encoded NADH dehydrogenase 1 (MT-ND1)] to two single-copy nuclear control genes [acidic ribosomal phosphoprotein P0 (RPLP0) and beta-actin (ACTB)] using a quantitative real-time polymerase chain reaction (qPCR) assay. To ensure a uniform DNA input of 5 ng for each qPCR reaction, samples were diluted and checked using the Quant-iTTM PicoGreen® dsDNA Assay Kit (Life Technologies, Europe). The reaction was performed with 7.5 μL master mix, consisting of 5 μL/reaction Fast SYBR® Green I dye 2 × (Applied Biosystems), forward and reverse primer (each 0.3 μL/reaction), and RNase free water (1.9 μL/reaction), which were aliquoted into the wells of a MicroAmp® Fast Optical 384-Well Reaction Plate. To each well 2.5 μL from one of the diluted DNA samples were added to obtain a final volume of 10 μL per reaction. To account for inter-run variability and possible DNA contamination six inter-run calibrators (IRCs) and two no template controls (NTCs) were run together with the samples on each reaction plate. The thermal cycling conditions were as follows: (i) for the activation of the AmpliTaq Gold® DNA-polymerase 20 s at 95°C, (ii) for denaturation 40 cycles of 1 s at 95°C and (iii) for annealing and extension of the PCR products 20 s at 60°C. Melting curve analyses were used at the end of each run to confirm the specificity of the reaction and absence of primer-dimers. Calculations of the cycle threshold (CT) values for the two mitochondrial genes were performed using “qBase” software (Biogazelle, Zwijnaarde, Belgium), which performs a normalization step relative to the nuclear reference genes by applying the ΔΔCT method and also taking the IRCs into account.
Insulin Levels
Umbilical cord blood plasma and maternal plasma insulin levels (pmol/L) were measured by electrochemiluminescence immunoassay using a Modular–E170 (Roche, Basel, Switzerland) immunoanalyser.
Gene Expression
Extraction of total RNA from cord blood was performed according to the manufacturer’s instructions using the miRNeasy mini kit (Qiagen, Venlo, Netherlands). Subsequently, DNase treatment (Qiagen, Venlo, Netherlands) was performed and RNA quantity and purity were determined by spectrophotometric means (Nanodrop 1000, Isogen, Life Science, Belgium). RNA integrity was assessed using the Agilent 2100 Bioanalyzer (Agilent Technologies, Amstelveen, Netherlands). Fluorescent cyanine-3-labeled cRNA was synthesized from 0.2 μg total RNA according to the Agilent one-color Quick-Amp labeling protocol (Agilent Technologies). After hybridization onto Agilent Whole Human Genome 8 × 60 K microarrays signal detection was performed using the Agilent DNA G2505C Microarray Scanner (Agilent Technologies). Preprocessing of raw data was carried out by Agilent Feature Extraction Software (Version 10.7.3.1, Agilent Technologies, Amstelveen, Netherlands) and in-house software within the R statistical computing environment.
Statistics
Relationship Between Cord Blood Insulin Levels and mtDNA Content
To investigate the association between cord blood insulin levels and mtDNA content a multiple linear regression model was applied. The values for mtDNA content and cord blood insulin were log10 transformed to ensure normality of the data. Adjustment for platelet count and possible batch effects on the qPCR reaction was performed by calculating the residuals of the log10 transformed mtDNA content. In a second model, an additional adjustment was performed for newborns’ sex and gestational age, ethnicity, and birth weight as well as maternal smoking status, maternal age, early-pregnancy BMI and education, parity and season of conception. Additionally, the regression coefficients for both models were calculated, for the adjusted model expressed as partial Pearson correlation, using the ppcor package in R (Kim, 2015). Possible collinearity of variables was examined by calculating the variance inflation factor. To examine possible effects of maternal gestational diabetes on the outcome of the analysis we performed a sensitivity analysis by excluding cord blood samples of neonates born to mothers with the condition.
Methylation of Individual CpG Sites
The log10 transformed mtDNA content was denoised for platelet count by calculating the residuals of a model with mtDNA content as the dependent variable and platelet count as the independent variable. These residuals were subsequently used as the independent variable in the following analyses (the multiple linear mixed models). All samples used in the methylation analysis were processed in the same batch for the analysis of mtDNA content. Batch effects caused by the different chips and chip-positions in the methylation analysis were accounted for by treating them as random effects. Additionally, an adjustment for blood cell composition was applied by using the de-convolution approach proposed by Bakulski et al. (2016). The model included newborns’ sex and gestational age, ethnicity, and birthweight as well as maternal smoking status, maternal age, early-pregnancy BMI and education, parity and season of conception. To account for multiple testing, Bonferroni correction method was applied and individual CpGs sites were considered significant below the 5% Bonferroni significance level. To exclude maternal blood contamination in the collected cord blood we additionally analyzed all samples according to a previously described method (Morin et al., 2017). Briefly, methylation levels in a panel of 10 CpG sites were analyzed. If the predefined thresholds of five or more of the 10 CpG sites is exceeded, the sample is regarded as contaminated and dismissed from further analysis. The authors of the method give the Beta-value thresholds for two common normalization methods; SWAN and BMIQ. Because normalization in this study was performed employing an in-house method comparable to BMIQ, thresholds for the latter were applied.
Pathway Analyses
For the pathway analyses, we correlated the significant alterations in DNA methylation with gene expression data, to characterize possible functional consequences. Briefly, the input of the correlations consisted of (i) the 20 highest ranked CpG sites of one of the EWAS (cord blood insulin or mtDNA content), without regard to the direction of association (hyper-, or hypomethylation), and of (ii) the full set of transcripts (n = 29,164) for the same set of subjects. In the analyses with cord blood insulin and mtDNA content 171 and 168 samples, respectively, were available with corresponding transcripts. Batch effects of different hybridization dates on the gene expression values, and of chip and chip position on the Beta-values were corrected by calculating the residuals. CpG–transcript pairs with p-values below the Bonferroni significance level of 0.05/(20 × 29,164) = 8.6e–8 were considered significant. The corresponding EntrezGeneID numbers of the genes allocated to the significant transcript–probe IDs formed the final input for the two over-representation analyses (ORA). They were uploaded into the R Package RDAVIDWebService (version 1.20) (Fresno and Fernández, 2013) which retrieves data from the online pathway analysis tool, DAVID 6.8 (Huang et al., 2007),1 using an application programming interface (API). Furthermore, a second approach was followed by employing functionalities of the R package ReactomePA (Yu and He, 2016), developed for the analysis and visualization of the REACTOME pathway database. In both cases, the identification of enriched pathways was performed against the default background of all genes expressed in Homo sapiens. Pathways were selected with a minimum overlap of five genes with the input list and an EASE score below 0.01, and considered significant based on a Bonferroni 5% significance level. In case resulting pathways/disease-associations contained the same gene-sets only the one with the lowest p-value was retained.
Differentially Methylated Regions
We regressed the associations between insulin levels as well as mtDNA content and DMRs in cord blood. Since none of the various methods for the identification of DMRs has been widely accepted as the gold-standard, two methods, DMRcate and Bumphunter (70, 71) which work under different statistical assumptions were selected for this study. Additional information about both algorithms is provided in the Supplementary Text. The analysis of associations between cord blood insulin and DMRs as well as mtDNA content and DMRs was performed using both procedures and DMRs were considered significant if they reached a minimal false discovery rate (FDR) value (minfdr) of a constituting CpG site < 0.05 for DMRcate, or a family-wise error rate (FWER) value <0.05 for Bumphunter. To ensure comparability between the outcomes the first steps of the pre-processing, before the actual implementation of the specifying algorithm, were applied in parallel for both methods. Missing methylation Beta-values were imputed with values of the k nearest neighbors using a Euclidean metric provided by the Bioconductor package “impute”. Consequently, the retrieved values were logit transformed to the M-value scale for better compliance with the modeling assumptions (Du et al., 2010). Probes already identified as being cross-reactive, mapped to the sex chromosomes or within two nucleotides or closer to single nucleotide polymorphisms were filtered out as previously proposed (Chen et al., 2013). Batch effects due to the use of different chips were corrected using the “correctBatchEffect” function of the Bioconductor package BEclear (Akulenko et al., 2016).
For this study, the default smoothing parameters of DMRcate with bandwidth λ = 1000 bp and scaling factor C = 2 (kernel size = 500 bp) were applied. By derogation from the default settings, the FDR threshold of individual CpG sites in the “cpg.annotate” function was set to 1 in order to receive a CpG output which can be used in the subsequent step to identify DMRs.
Because for Bumphunter in scenarios with more than one covariate the use of the permutation approach is not recommended (71), “bootstrapping” (1000 bootstraps) was performed to assess the accuracy of sample estimates and create null distributions for the candidate regions. To be considered as overall significant, DMRs in this study had to contain at least two differentially methylated CpG sites. To study the overlapping associations between insulin and mtDNA content we investigated the intersection of DMRs with p-value <0.05.
Results
Population Characteristics
Demographic characteristics and perinatal factors of the mother-newborn pairs are reported in Table 1. In our study the vast majority of the newborns were Europeans. The mean (±SD) gestational age was 39.25 weeks and the mean birthweight was around 3.400 g. Mean maternal age was ca. 29 years and mean pregnancy BMI was 24.5 kg/m2. There were 54% of primiparous mothers. Most of the mothers reported not to have smoked during pregnancy and about half of them obtained a college or university degree. None of the mothers in the study had chronic diabetes but 34 of the 882 neonates were born to mothers with gestational diabetes, five of which received insulin treatment. The median (25th–75th percentile) cord blood insulin level measured in all samples (n = 882) was 32.64 pmol/L (18.75–51.68). When analyzed only in neonates born to mothers without gestational diabetes (n = 848), the median cord blood insulin level was unchanged (18.75–50.7), while for neonates born to mothers with gestational diabetes (n = 34) the median value was 37.11 pmol/L (25.29– 65.63). Cord blood mtDNA content in neonates from mothers with gestational diabetes was slightly higher compared to neonates born to mothers without gestational diabetes or the total study population [median 1.03 (0.75–1.45) vs. median 0.96 (0.74–1.27)]. The characteristics of the subsets of this population employed in the analysis of methylation data were comparable and are shown in Supplementary Table S3.
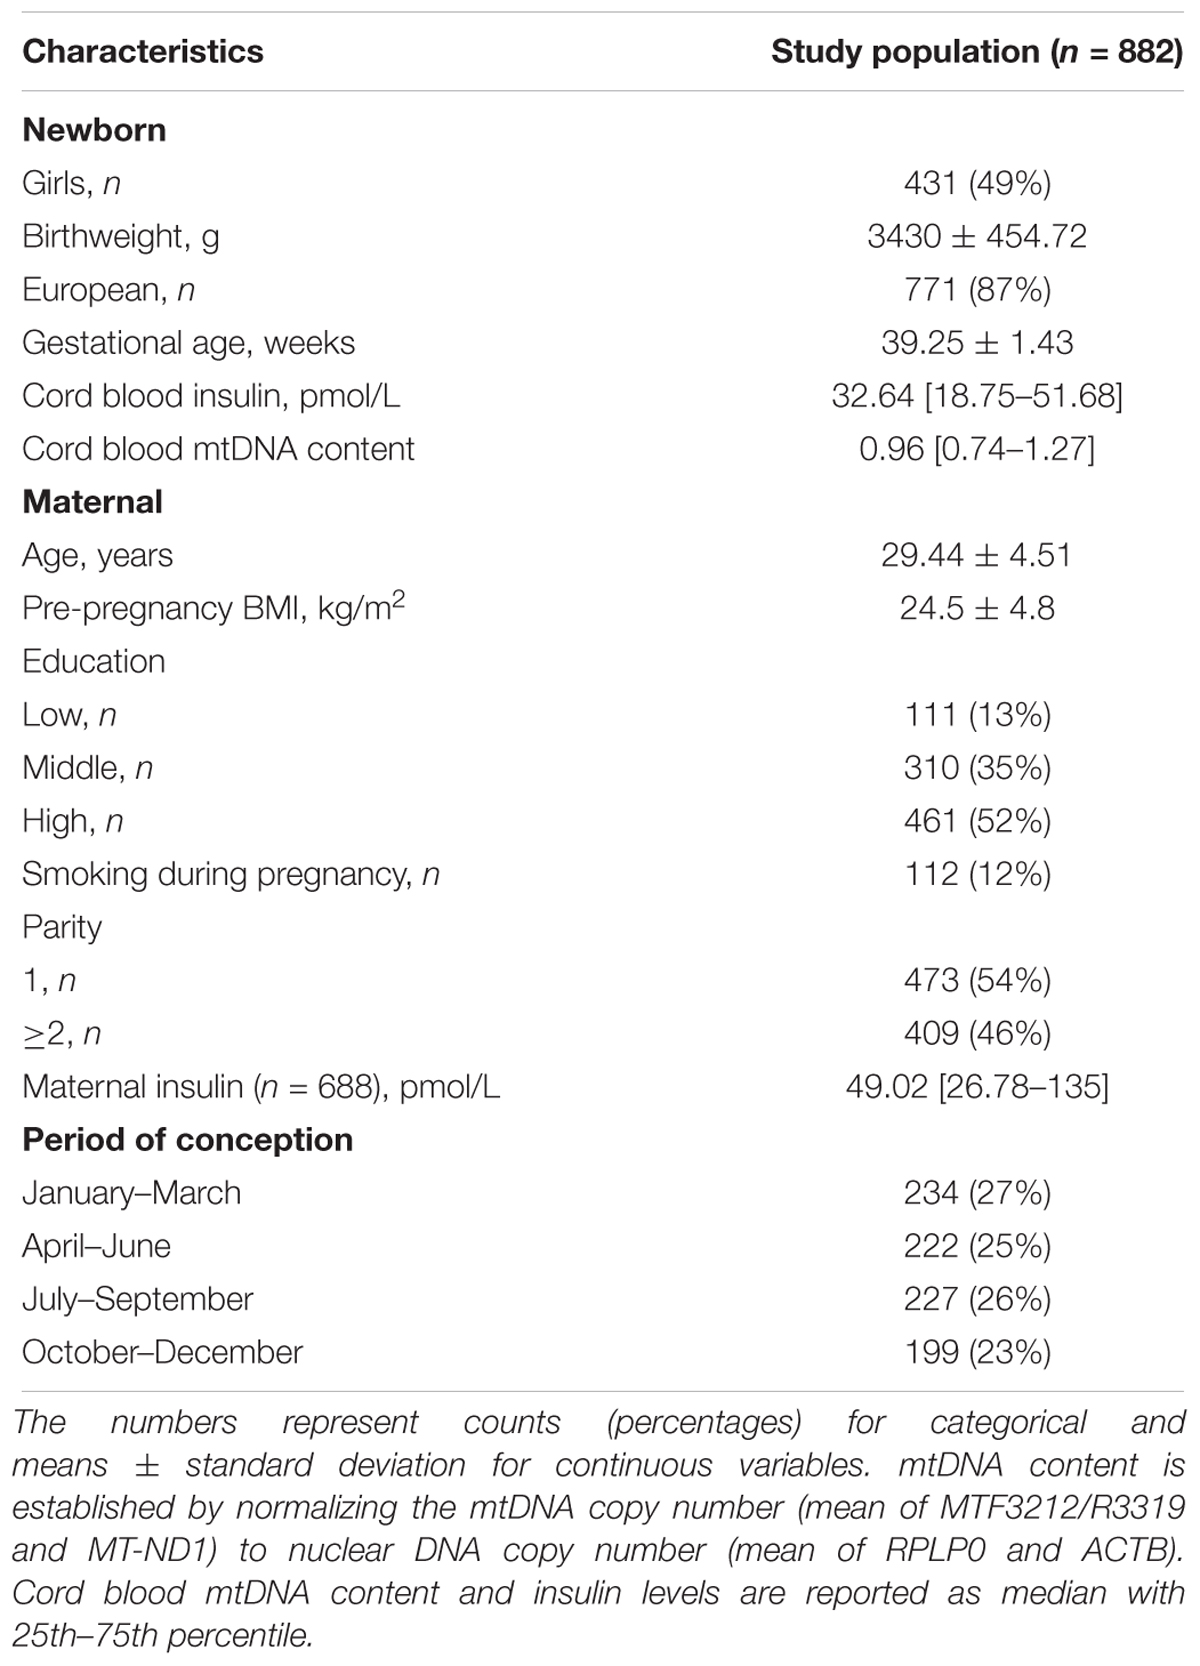
Table 1. Population characteristics and perinatal factors at sampling.
Association Between mtDNA Content and Cord Blood Insulin
Mitochondrial DNA content and cord blood insulin were positively correlated in the unadjusted model [r = 0.074, p = 0.028 (Figure 1)] which translates in the linear regression model into a 3.0% [95% confidence interval (CI): 0.32–5.79%] higher cord blood insulin level for an interquartile range increase in mtDNA content. After additional adjustment for newborns’ sex and gestational age, ethnicity, and birthweight as well as maternal smoking status, maternal age, early-pregnancy BMI and education, parity and season of conception, an interquartile range increase in mtDNA content was associated with a 2.50% (CI: -0.12–5.18%; p = 0.062) higher insulin level in cord blood. Controlling for the before mentioned covariates, the partial correlation coefficient was r = 0.063. In the intersect of n = 167 samples in common for the EWAS with cord blood insulin and mtDNA content the correlation was not significant, showing an 2% (CI: -4.68–8.90%, p = 0.55) increase in cord blood insulin level for an interquartile range elevation in mtDNA content for the unadjusted model and 1.87% (CI: -5.65–9.64%, p = 0.62) for the adjusted model. Sensitivity analysis showed no difference in effect nor significance in the unadjusted model with n = 882 after excluding the 34 neonates of mothers with gestational diabetes (also r = 0.074, p = 0.028). Likewise, in the adjusted model the change in effect after exclusion of the 34 cord blood samples (2.45% vs. 2.5%) and the change in significance (p = 0.069 vs. 0.062) were neglectable. In the same way, no notable changes were observed for the intersect of n = 164 [unadjusted model: 1.92% (CI: -4.77–9.07%, p = 0.58); adjusted model: 1.84% (CI: -5.92–9.85%, p = 0.64)].
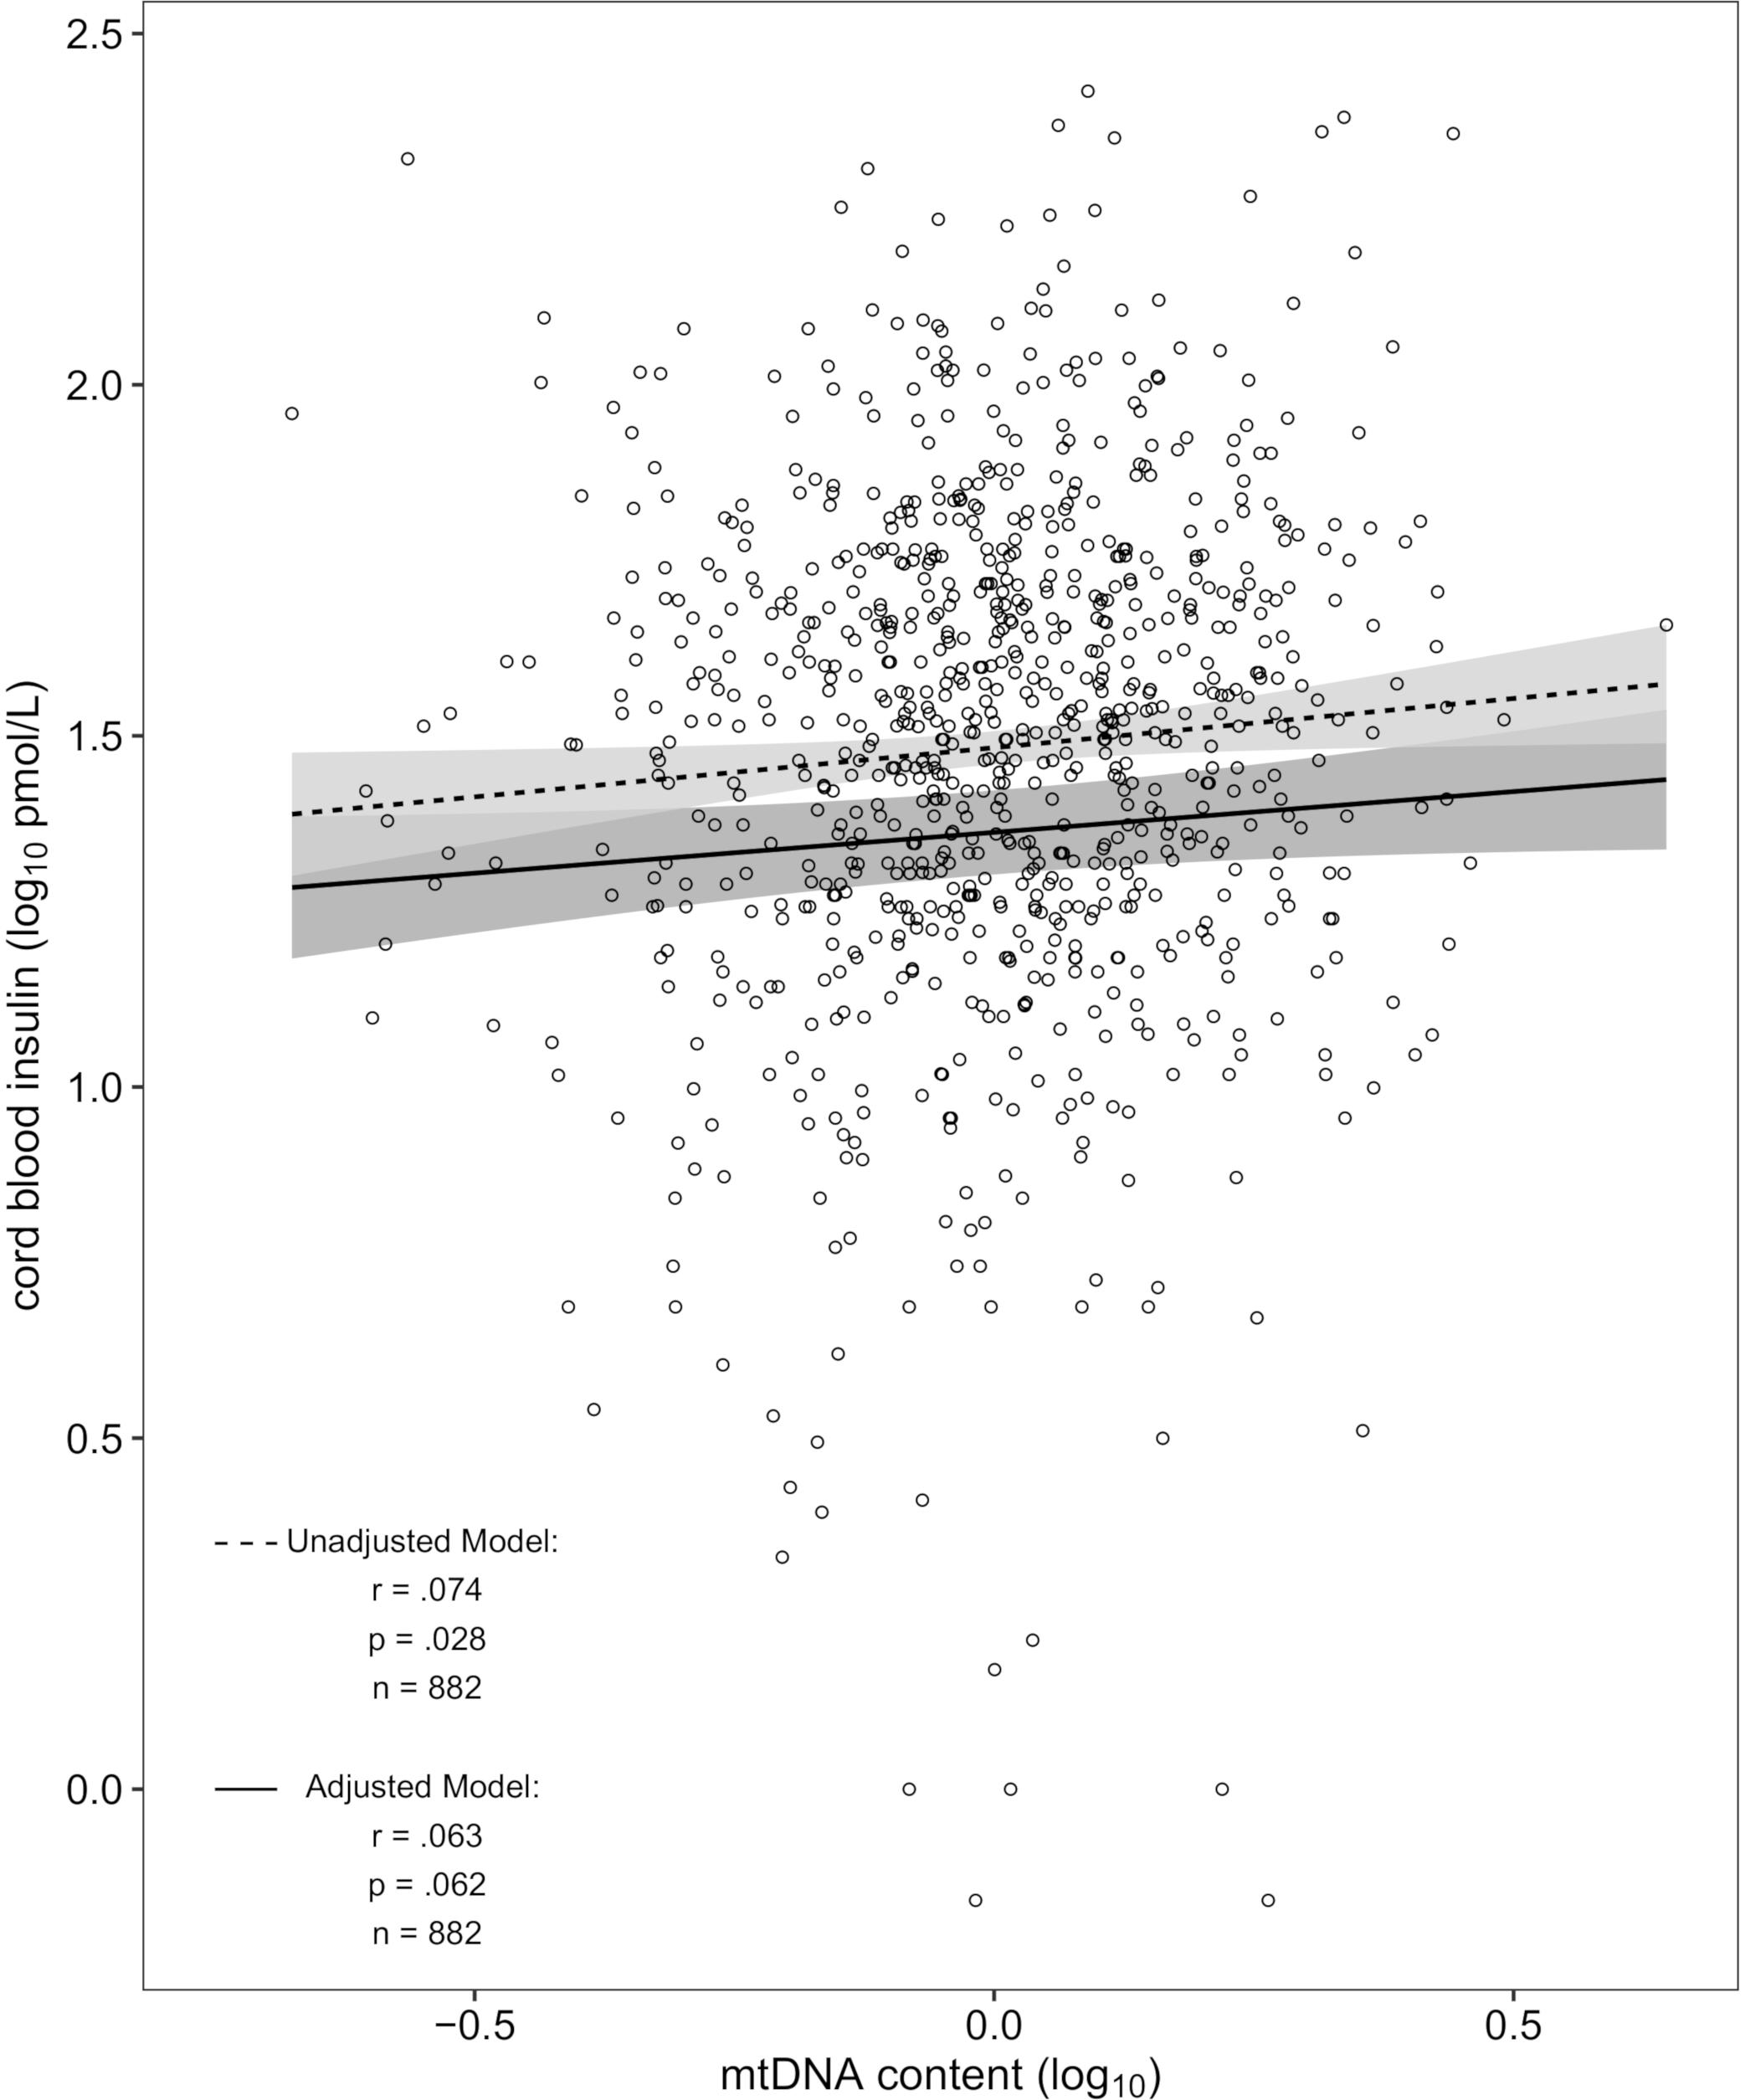
Figure 1. Scatterplot of cord blood mtDNA content vs. insulin in the unadjusted and adjusted model (dashed and solid regression lines respectively). The unadjusted model was denoised for platelet count and batch effect. The adjusted model was additionally corrected for newborns’ sex and gestational age, ethnicity, and birthweight as well as maternal smoking status, maternal age, early-pregnancy BMI and education, parity and season of conception.
Epigenome-Wide Association Study of Cord Blood Insulin and mtDNA Content
None of the cord blood samples from the subsets of n = 179 and n = 176 showed maternal contamination according to the test panel of 10 CpG sites described above. In both subsets, 27 samples exceeded the threshold ranging from minimal two, to maximal four CpG sites, though none of them showed five or more violations of the threshold (Supplementary Figure S1). Neither the EWAS of cord blood insulin nor mtDNA content revealed any differentially methylated CpGs with a p-value below the Bonferroni threshold of 1.3e–7. The CpG site with the highest ß-coefficient and the lowest p-value associated with cord blood insulin (ß = 0.022; p = 2.15e–7) was located on the calcium voltage-gated channel auxiliary subunit alpha2delta 1 (CACNA2D1) gene (Supplementary Table S4). The CpG site with the lowest p-value associated with mtDNA (ß = 0.14; p = 2,88e–6) was annotated to guanine nucleotide binding protein alpha 12 (GNA12) (Supplementary Table S5).
Gene Expression and Pathway Analyses
Within the matrix of 20 × 29,164 = 583,280 CpG-transcript pairs we identified 233 significant pairs (p < 8.6e–8, Bonferroni), corresponding to 201 unique genes, associated with cord blood insulin, and 585 significant pairs (p < 8.6e–8, Bonferroni), corresponding to 281 unique genes, for the association with mtDNA content. The associations of the corresponding CpG-transcript pairs, and therefore the genes, with cord blood insulin and mtDNA content were in both directions, meaning, that hyper-, as well as hypomethylation, and equally transcriptional up-, as well as downregulation, were present. We found 27 enriched pathways/gene-disease-associations for cord blood insulin and 21 for mtDNA content with an overlap of 19 common pathways/gene-disease-associations in the ORA, using RDAVIDWebService (Table 2). The most significant pathway for cord blood insulin was “RMTs methylate histone arginines” and for mtDNA content “Resolution of Sister Chromatid Cohesion”. Among the pathways significant in both associations several were associated with histone modification, mitosis, and G2/M transition. Pathways associated with cord blood insulin only (Supplementary Table S6) were involved in DNA damage and repair, telomeres, and senescence. Pathways associated with mtDNA content (Supplementary Table S7) were additionally designated to “G0 and Early G1” and “Polo-like kinase-mediated events”. With the ReactomePA package, 47 and 38 pathways with a unique set of overlapping genes could be found for the correlation with cord blood insulin and mtDNA content, respectively, of which 33 were in common between both associations (Table 3). The highest ranking pathway according to the Bonferroni-corrected p-value in both associations was “M-Phase” (p = 1.61e–23 and 1.11e–14) which also showed the highest gene ratio (Figure 2). The gene ratio describes the ratio of overlap in input gene set and pathway gene set, over overlap in input gene set and background gene set. For both associations, most of the pathways fell under the Reactome category “Cell Cycle”, followed by “Cellular Responses to External Stimuli”, “Signal Transduction” and “Chromatin Organization” (Figure 3), and were associated with histone modification, neuronal development, and cellular senescence. Pathways exclusively associated with cord blood insulin or mtDNA content found with ReactomePA were comparable to those found with RDAVIDWebService (Supplementary Tables S8, S9).
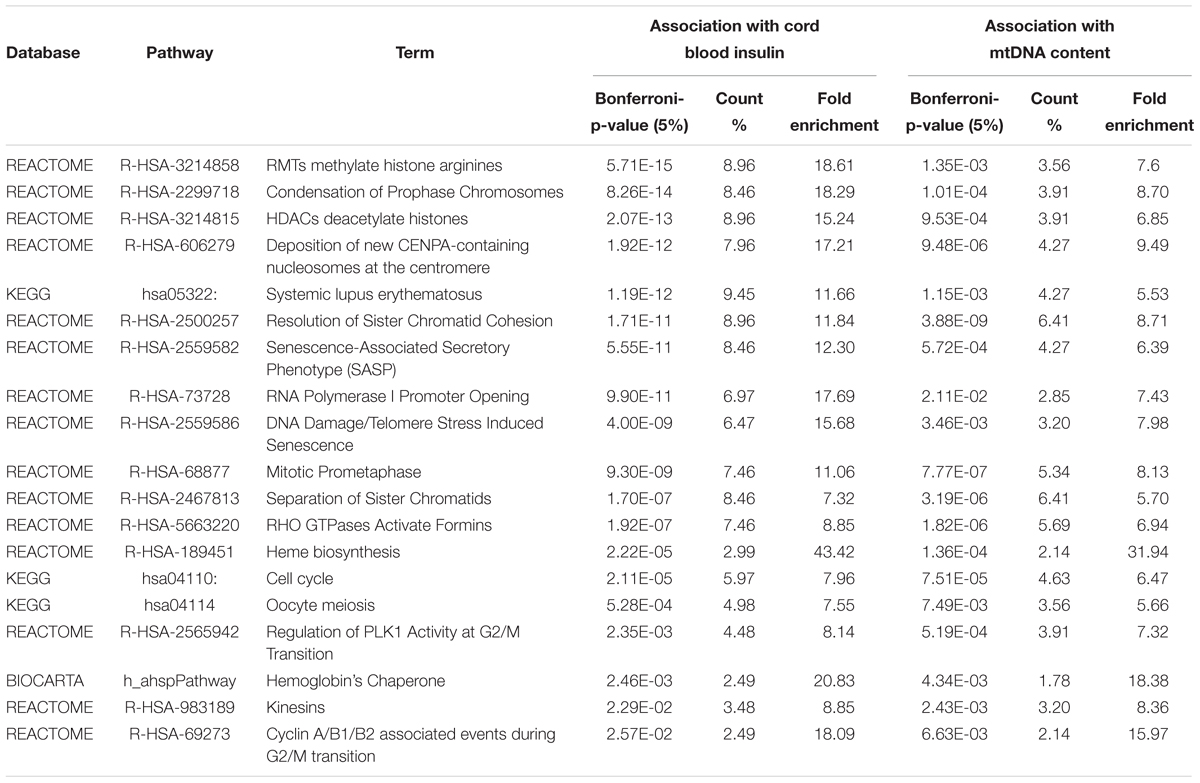
Table 2. Pathways and gene-disease-associations commonly found for the association with cord blood insulin and mtDNA content with RDAVIDWebService.
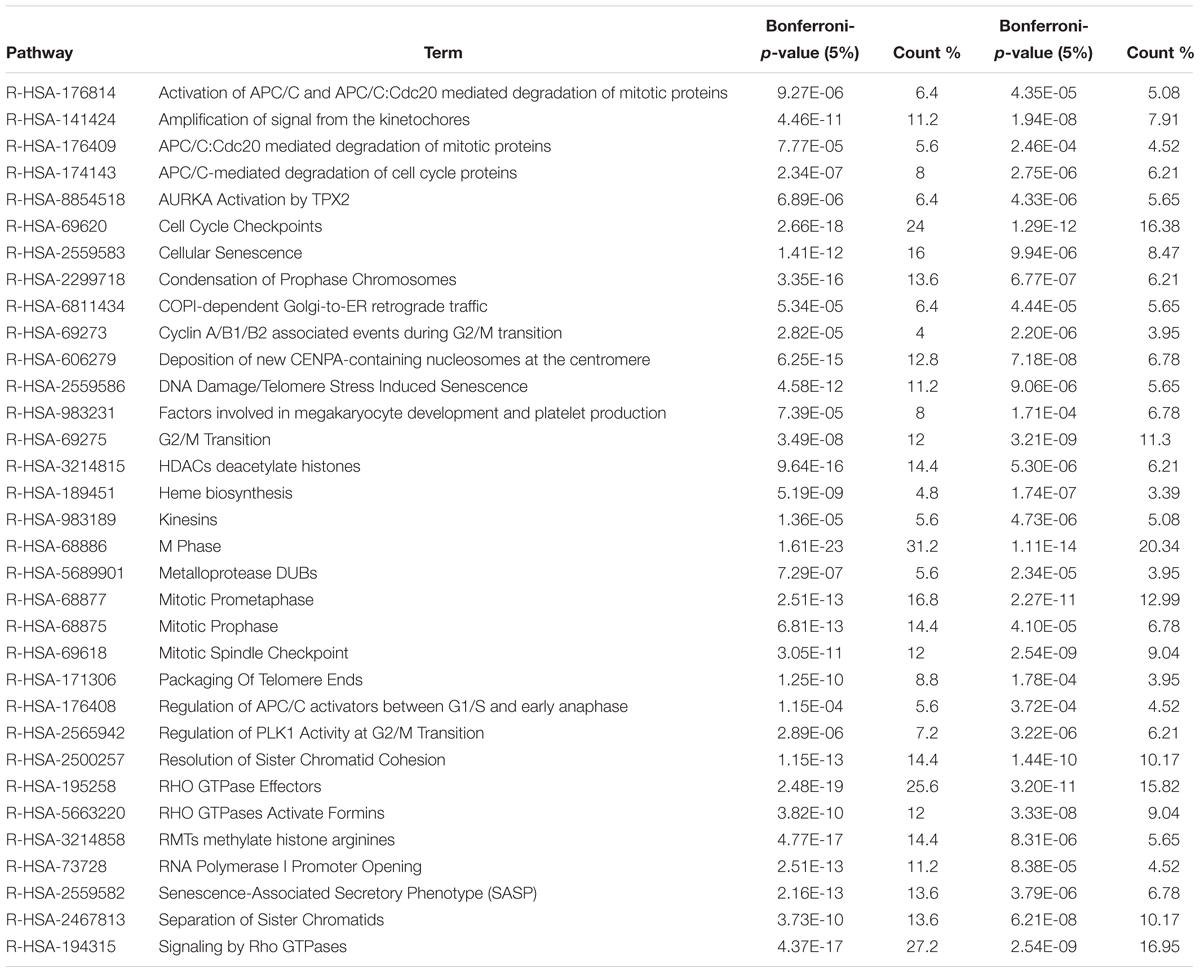
Table 3. Pathways and gene-disease-associations commonly found for the association with cord blood insulin and mtDNA content with ReactomePA.
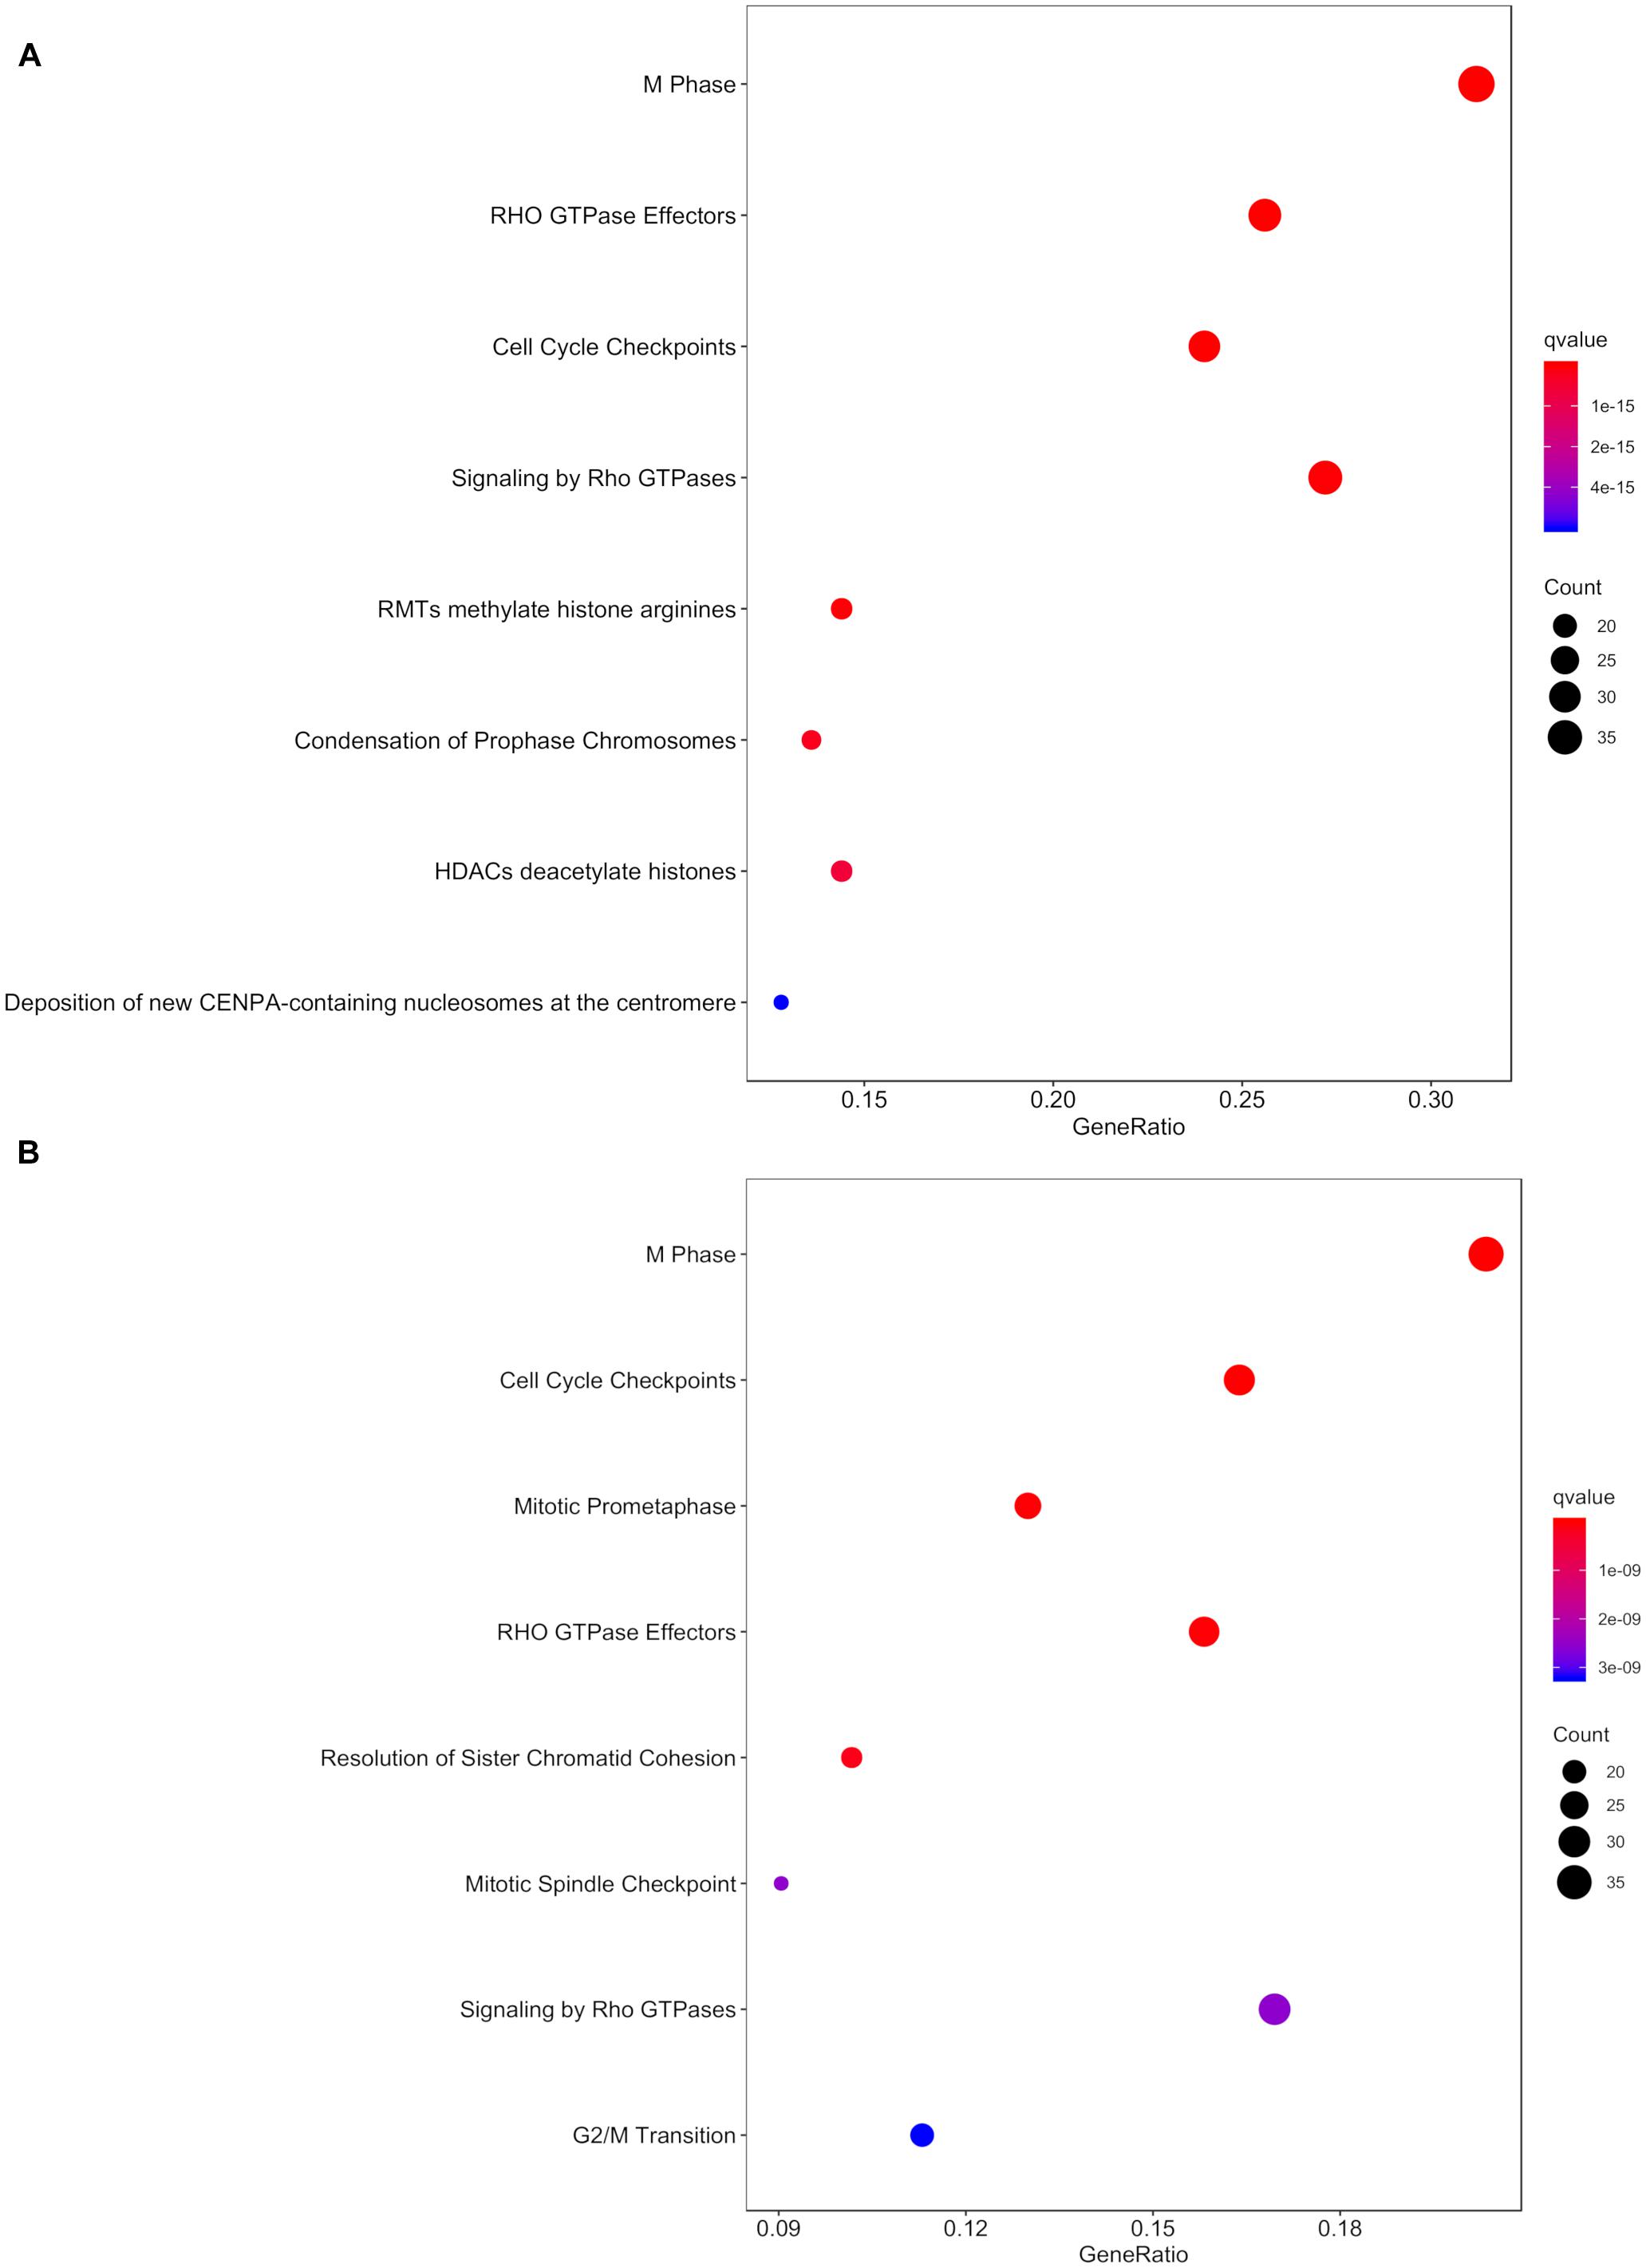
Figure 2. Dot plot with the q- value and count of genes from the input list contained in the resulting pathways for the association with (A) cord blood insulin and (B) mtDNA content in the analysis with ReactomePA.
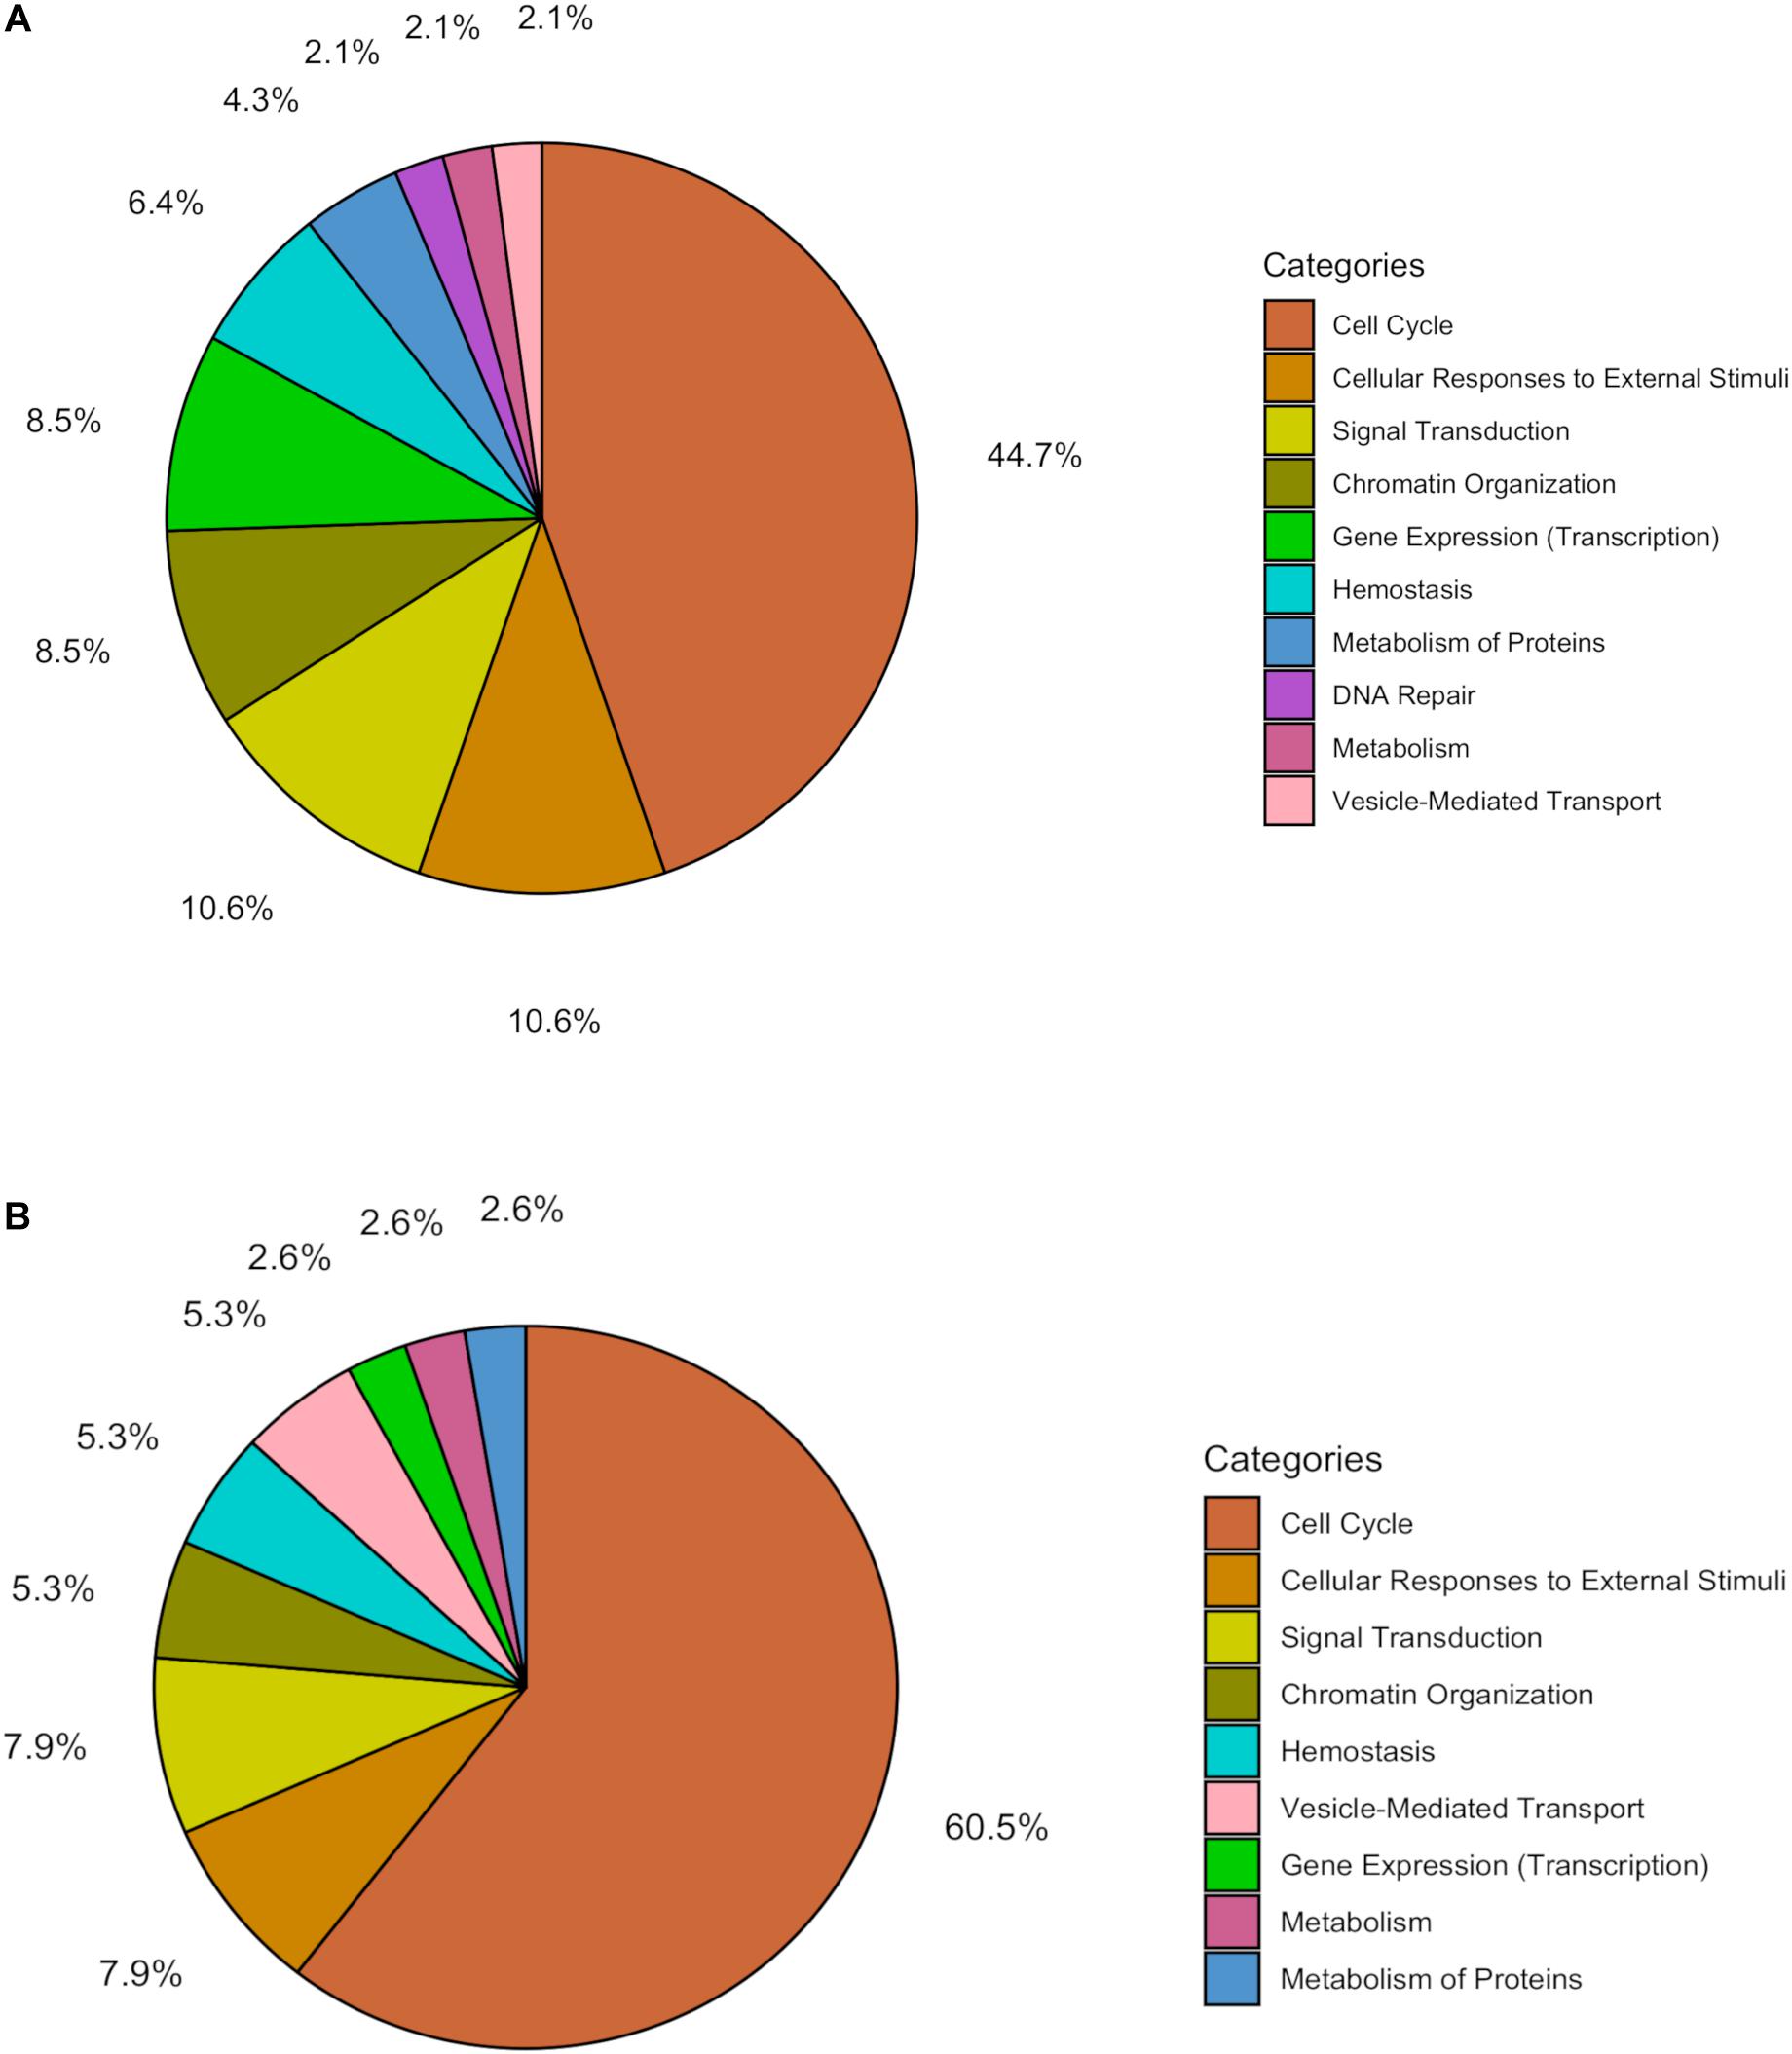
Figure 3. Pie chart showing the percentage of pathways for the association with (A) cord blood insulin and (B) mtDNA content within the different functional pathway categories in the analysis with ReactomePA.
Epigenome-Wide Association Study for the Association of Differentially Methylated Regions With Cord Blood Insulin and mtDNA Content
With DMRcate we identified 20 DMRs all of which were significant on a level of FDR < 0.05 in association with cord blood insulin (Supplementary Table S10). The highest ranked DMR according to the minimal FDR value (minfdr = 4.95e–9) was located at the promoter region of the guanine nucleotide binding protein, alpha stimulating complex locus (GNAS) on position 57426743–57428032 of chromosome 20. The 43 CpG sites constituting this DMR were all located on a CpG island and its north shore with the majority of 36 being hypermethylated. The second highest ranking DMR (minfdr = 1.20e–7) was annotated to the Repulsive Guidance Molecule BMP Co-Receptor A (RGMA) gene, involved in neuronal development, overlapping its 5′ region. All 14 CpG sites were located on a CpG island and hypermethylated with the exception of two. For the association with mtDNA content, we found 34 significant DMRs with a minimal FDR < 0.05 (Supplementary Table S11 for all significant DMRs). The DMR showing the highest significance of association (minfdr = 4.53e–10) was covering an exon of the Tripartite Motif Containing 10 (TRIM10) gene on position 30120031–30124942 of chromosome 6. The majority of 19 of the 37 individual CpG sites constituting the DMR were located in the open sea and hypermethylated although the overall effect was a hypomethylation of the DMR. The second highest ranked DMR (minfdr = 1.16e–7) was annotated to the gene cytochrome P450 family 2 subfamily E member 1 (CYP2E1), overlapping the 5′ region with the individual CpG sites covering a CpG island and its south shore.
Using the Bumphunter algorithm we found no significant DMRs at a FWER < 0.05 for the association with cord blood insulin. Sixty-one DMRs had an uncorrected p-value < 0.05 (Supplementary Table S12) and were employed for further analysis. The highest ranking DMR (p = 3.5e–4) overlapped the 5′ region of the HOXA5 gene. The CpG sites constituting this DMR were located at a CpG island and its north shore showing overall hypermethylation. In association with mtDNA content, one DMR reached significance at the FWER < 0.05 level. This DMR annotated to the gene CYP2E1 (p = 6.39e–5, FWER = 0.04) and located inside an intron was significantly associated with mtDNA content. The corresponding CpG sites were located on a CpG island and its south shore, and all hypermethylated. Sixty-nine DMRs showed a p-value < 0.05 (Supplementary Table S13) and were subsequently applied in further investigation. In both analyses, two genes, Homeobox-A5 (HOXA5) and DRD4 were represented by two different DMRs each. Both DMRs of dopamine receptor D4 (DRD4) were located at a CpG island, one situated at a promoter, the other at an intron, and showed hypomethylation. We found an overlap of 17 genes between the two different associations (Table 4).
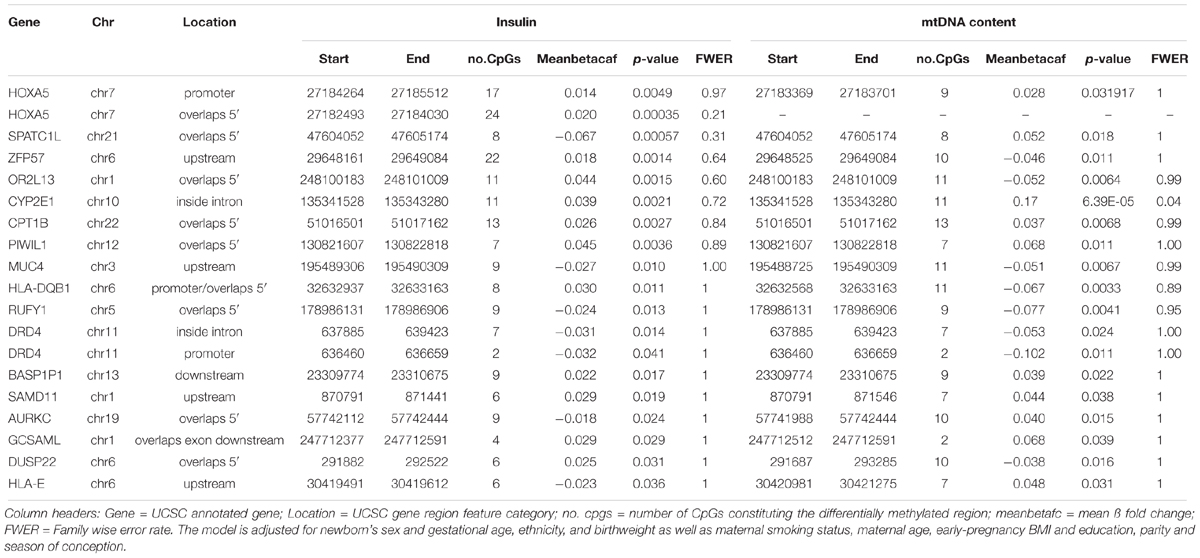
Table 4. Overlap in annotated genes for the analysis of differentially methylated regions in the association with cord blood insulin and mtDNA content identified by the Bumphunter algorithm.
When comparing the overlap of genes between the association with cord blood insulin and mtDNA content resulting from the analysis in DMRcate only the RGMA gene was found for both associations. A matching gene-annotation for RGMA was additionally found with Bumphunter for the association with mtDNA content. This DMR contained the same 12 hypermethylated CpG sites as found with DMRcate for the association with cord blood insulin. Among the 17 genes jointly found for both associations with the Bumphunter algorithm CYP2E1 also appeared in association with mtDNA content and carnitine palmitoyltransferase 1B (CPT1B) in association with cord blood insulin in the results obtained with the DMRcate algorithm.
Discussion
The origins for metabolic disorders may partly be rooted in in utero life (Lee et al., 2005). Here, we provide evidence for associations between cord blood insulin and mtDNA content as well as the involvement of DNA methylation as one potential underlying mechanism. Cord blood insulin levels have not been described in association with insulin resistance in later life yet, and these two parameters are therefore not interchangeable. However, evidence of predictive power of fasting insulin levels in early age with the occurrence of DMT2 later in life could also be indicative of this association in neonates. For example, a 1 SD increase in fasting insulin was associated with a relative risk of 2.04 (95% CI, 1.54–2.70) in a study investigating whether fasting insulin levels in healthy 3- to 6-year-olds are predictive of DMT2 in adulthood (Sabin et al., 2015). Since fasting insulin in children has been acknowledged as an index of insulin resistance in epidemiological studies by an expert panel (Levy-Marchal et al., 2010), it seems reasonable to also employ it as a surrogate marker in neonates.
Our observation of an association between cord blood insulin and mtDNA content in the total study population of n = 882 is in agreement with a previous study (Vriens et al., 2018) which also documented a positive association between cord blood insulin levels and mtDNA content. In contrast, other studies on peripheral blood found an inverse relationship between mtDNA content and insulin resistance in adolescents (Gianotti et al., 2008), in pre-diabetic subjects compared to healthy controls (Lee et al., 1998) and in offspring of DMT2 diabetic patients compared to offspring of non-diabetics (Song et al., 2001). Considering the fact, that this is the second study to find a positive association in cord blood these results may be indicative of the compensatory capacity of mitochondria, a mechanism also observed in response to other factors. We speculate that an initial increase in mtDNA content in relation to insulin during prenatal life might represent compensation for a higher metabolic demand. This is in contrast to the findings in the later course of life because the occurrence of a progressed health condition might finally mitigate the mitochondrial function resulting in lower mtDNA content. An important limitation of this study is the fact that the association between mtDNA and insulin in cord blood was not significant in the subset of n = 167 individuals with data on epigenome-wide methylation which may be due to mitigation of statistical power in the smaller subset. Notwithstanding, the estimated change of beta coefficients between cord blood insulin and mtDNA content was of the same order of magnitude as observed in the large sample (0.09 vs. 0.12). In addition, the omics related signature might entail a more detailed effect of the metabolic changes we observed in the larger database. Furthermore, we identified several additional mechanisms, not directly involved in mitochondrial functioning or insulin metabolism, including neuronal development, histone modification, CYP-metabolism, and biological aging, and showed associations, which have not yet been described in human neonatal studies. Several findings point in the direction of neuronal development and signaling as an important target of insulin as well as mitochondrial (dys-) function during prenatal development. We found that CPT1B, a regulator of the mitochondrial energy metabolism, was associated with mtDNA content and insulin. Beneficial effects on insulin sensitivity were already shown previously, in a mouse genetic model of CPT1B restriction (Kim et al., 2014). Here we found a DMR overlapping the 5′ of a CpG island and its south shore to be hypermethylated in both associations, which points in the direction of transcriptional downregulation. In somatic cells, CpG islands remain largely unmethylated, in order to allow the transcription of active genes (Jones, 2012). While there is a general consensus that methylation in the close proximity of the transcription start site (TSS) blocks transcription initiation (Jones, 2012), methylation in the gene body does not always have this effect but might rather stimulate transcription elongation, as also positive correlations between active transcription and methylation at the gene body have been reported previously (Jones, 1999; Ball et al., 2009; Yang et al., 2014; Arechederra et al., 2018). On the other hand, recent research also revealed hypermethylation of introns to be associated with transcriptional silencing (Anastasiadi et al., 2018), which further complicates the interpretation of methylation patterns in the gene body. Demethylation of specific genes, however, has been associated with an upregulation of gene expression, often in a pathological context (Wilson et al., 2007). Furthermore, we found two different DMRs annotated to DRD4 which encodes the D4 subtype of dopamine receptors for the association with cord blood insulin as well as with mtDNA content using the Bumphunter algorithm. Activation of this receptor exerts a neuroprotective effect by inhibition of oxidative stress-induced cell death via regulation of cGMP-operated Ca2+ channels (Ishige et al., 2001; Shimada et al., 2010). Polymorphisms of this gene are related to various psychiatric and behavioral conditions like schizophrenia, attention deficit hyperactivity disorder and substance abuse (Ptácek et al., 2011). Associations between dopamine receptors and insulin levels have been described before (Scranton and Cincotta, 2010; Defronzo, 2011; Lamos et al., 2016), and antipsychotics, which block dopamine receptors, are linked with insulin resistance and diabetes in psychiatric patients (De Hert et al., 2011; Bobo et al., 2013). Both DMRs, containing different sets of CpG sites, were located at a CpG island, one situated at a promoter, the other at an intron, and showed hypomethylation for both associations, which could be indicative of a transcriptional upregulation. In addition, we identified DMRs annotated to RGMA, which has an important role in neurological development and operates through axon guidance and programmed apoptosis in the developing embryonic neural tube (Matsunaga et al., 2004; Key and Lah, 2012). RGMA is associated with the selective degeneration of dopaminergic neurons in the substantia nigra in a Parkinson’s disease model in mice (Korecka et al., 2017). In our study, the DMR found in association with cord blood insulin showed hypermethylation of the 5′ region at a CpG island, which is generally interpreted as transcriptional downregulation. However, the DMR found in association with mtDNA content, and located upstream in the open sea, was hypomethylated. Since RGMA exerts a repulsive effect on axons by stimulating the Rho-GTPase pathway (Mueller et al., 2006), the validity of this finding was reinforced by the results of the ORA, in which we identified the following three pathways in common between insulin levels and mtDNA content: “RHO GTPase Effectors”, “Signaling by Rho GTPases” and “RHO GTPases Activate Formins”. Proteins of the Rho family and their intracellular effector Rho-associated protein kinase (ROCK) engage in a range of neuronal actions especially during embryonic development with functions in axonal growth, neuronal differentiation, and dendritic spine architecture (Schmandke et al., 2007). In addition, ROCK is a key regulator of insulin by initiating cellular glucose uptake (Huang et al., 2013). Its activation was shown to cause mitochondrial dysfunction by facilitating interactions between Rac1b and cytochrome c (Kang et al., 2017).
Several pathways and DMRs found in association with cord blood insulin as well as mtDNA content showed a connection with the epigenetic mechanism of histone modification. Among these, “RMTs methylate histone arginines” and “HDACs deacetylate histones” could point in the direction of additional epigenetic modifications linking both associations. The DMR analyses revealed an association with ZFP57, a zinc-finger transcription factor expressed during early development and essential for the maintenance of DNA and histone methylation at imprinted control regions (Quenneville et al., 2011; Boonen et al., 2013). The output of the genome is controlled by DNA methylation, histone modification, non-coding RNAs, and chromatin remodeling which interact with each other (Alfano et al., 2018). Our finding might be interpreted as a mechanism of this cooperation.
The DMRs found at CYP2E1 were verified in the analysis with the DMRcate package as well as with Bumphunter. CYP2E1 encodes for a monooxygenase which metabolizes xenobiotics and is induced by ethanol, diabetic conditions, and starvation (Leung and Nieto, 2013). CYP2E1 expression has been reported to be inhibited by insulin, and to be associated with obesity (Moncion et al., 2002; Woodcroft et al., 2002). Increased hepatic CYP2E1 expression has also been suggested as an important cause of ROS overproduction (Aubert et al., 2011). In addition, it has been linked with mitochondrial dysfunction through oxidative damage of key components of the ETC (Bansal et al., 2010). The same DMR was found for both associations to be hypermethylated and located inside an intron on a CpG island and its south shore, which makes it difficult to infer the potential meaning in the context of transcriptional regulation.
The pathway analyses showed differential expression of genes involved in biological aging. These pathways comprised “Senescence-Associated Secretory Phenotype (SASP)” and “DNA Damage/Telomere Stress Induced Senescence” for the analysis with RDAVIDWebService, and additionally “Cellular Senescence” and “Packaging of Telomere Ends” with ReactomePA. Aging is marked by a progressive functional deterioration of cells and tissues over time (Barzilai et al., 2012; Campisi, 2013), which contribute to the etiology of metabolic diseases such as DMT2 and cardiovascular disease (Ford et al., 2002). Impaired mitochondrial quality and activity are important sources of ROS and responsible for increased damage of nuclear, mitochondrial, and telomeric DNA and therefore for cellular senescence (Passos et al., 2007). The mitochondrial energy metabolism has been associated with normal aging as well as age-related diseases (Sun et al., 2016), and also with mitochondrial dysfunction as a hallmark of organismal aging (Petersen et al., 2004). While hyperinsulinemia is a main aspect of the metabolic syndrome, conversely decreased insulin levels in diabetics are linked with accelerated aging (Bartke, 2008). Evidence from studies on caloric restriction though indicates, that suppression of circulating insulin levels decreases the risk of age-related diseases in humans (Fontana et al., 2004). The relationship between insulin levels in early life and aging in humans is therefore not clear.
We acknowledge specific strengths and limitations in the present study. We corrected the results of the multiple linear mixed models in the EWAS for the different blood-cell types, a practice that mitigates undesired effects of intra-sample heterogeneity. Furthermore, we investigated epigenome-wide DNA methylation in association with cord blood insulin and mtDNA content using an untargeted approach. This strategy allows the examination of a vast number of methylation targets in an unbiased manner. On the other hand, the large number of individual tests necessitates the rigorous correction for multiple testing with the risk of missing biologically significant associations especially in the scenario of continuous variables. We acknowledge, that the large number of tests in combination with a modest sample size reduces the power of our study. The downstream analyses of our epigenome-wide study, being overrepresentation analyses (ORA) which lead to common pathways between cord blood mtDNA content and insulin, are focused on the 20 strongest associations, based on p-values. The results provide important markers for following targeted studies. For the analysis on a regional level, with the DMRcate package, we chose eligible DMRs based on the minimal FDR value of constituting CpG sites instead of the Stouffer combined p-value. This approach was also applied in other studies (Solomon et al., 2017; Roberts et al., 2018). A limitation of the performed overrepresentation analyses (ORA) is the fact that it is not possible to retrieve the direction of the effect and therefore distinguish if the reported pathways are down-regulated. On the other hand, these limitations of the study were partially ameliorated by the multilevel exploration of methylation changes, and use of individual CpG sites as well as DMRs which provide increased biological significance to findings (Jaffe et al., 2012). Additionally, the application of two different algorithms for the identification of DMRs added verification to the obtained results. Moreover, by integrating gene-expression data and subsequent pathway analyses we were able to link epigenetic outcomes to biological consequences and thus provide mechanistic insights. A validation by future studies may enforce these hypothesis-generating findings. Although not the scope of this study, internal or external exposures such as air pollution might play a role in cord blood insulin levels (Madhloum et al., 2017) as well as in cord blood mtDNA content (Rosa et al., 2017) and the methylome (Plusquin et al., 2017; Alfano et al., 2018).
In conclusion, in our investigation of epigenome-wide methylation, we identified several previously described as well as novel genes and pathways on multiple levels in relation to both, cord blood insulin and mtDNA content. Possible important targets of insulin as well as mitochondrial (dys-) function during embryogenesis point in the direction of neuronal development, histone modification, CYP-metabolism, and biological aging.
Ethics Statement
This study was carried out in accordance with the recommendations of “Comité voor Medische Ethiek UHasselt” and “Comité Medische Ethiek ZOL” with written informed consent from all subjects. All subjects gave written informed consent in accordance with the Declaration of Helsinki. The protocol was approved by the “Comité voor Medische Ethiek UHasselt” and “Comité Medische Ethiek ZOL”.
Author Contributions
BR, MP, and TN designed the research hypothesis. BR, RA, and MP analyzed the data, interpreted the results, and drafted the article. JP, BJ, and NS performed the laboratory analysis of the samples with regard to cord blood insulin levels and mtDNA content. PV, AEP, TdK, AG, and ZH were responsible for the analyses of DNA methylation and the transcriptome. TN, PV, MC-H, OR, and BC provided critical revision of the manuscript with respect to the content. All authors read and approved the final manuscript.
Funding
The ENVIRONAGE birth cohort is supported by grants from the European Research Council (Grant No. ERC-2012-StG310898), the Flemish Scientific Fund (FWO, Grant No. 1516112N/G.0873.11.N.10), and the STOP project (Grant No. 774548-H2020). The laboratory analysis of epigenome-wide DNA methylation was carried out within the scope of the European Commission Seventh Framework program grant EXPOsOMICS (Grant No. 308610-FP7 to PV, ZH, and AG). ZH and AG and the Epigenetics Group at IARC are supported by grants from the Institut National du Cancer (INCa, Plan Cancer-EVA-INSERM, France). BR was financially supported by the University Research Fund (Bijzonder Onderzoeksfonds Universiteit Hasselt).
Conflict of Interest Statement
The authors declare that the research was conducted in the absence of any commercial or financial relationships that could be construed as a potential conflict of interest.
Acknowledgments
We acknowledge the participating mothers and neonates, as well as the staff of the maternity ward, midwives, and the staff of the clinical laboratory of East-Limburg Hospital in Genk.
Supplementary Material
The Supplementary Material for this article can be found online at: https://www.frontiersin.org/articles/10.3389/fgene.2019.00325/full#supplementary-material
Abbreviations
5hmC, 5-hydroxymethylcytosine; 5′UTR, 5′ untranslated region; ARHGEF10L, Rho guanine nucleotide exchange factor 10-like protein; ATP, adenosine triphosphate; BMI, body mass index; CACNA2D1, calcium voltage-gated channel auxiliary subunit alpha2delta 1; cGMP, cyclic guanosine monophosphate; CPT1B, carnitine palmitoyltransferase 1B; CYP, cytochromes P450; CYP2E1, cytochrome P450 family 2 subfamily E member 1; DMRs, differentially methylated regions; DRD4, dopamine receptor D4; EASE, expression analysis systematic explorer; ENVIRONAGE, ENVIRonmental influence ON AGEing in early life; ETC, electron transport chain; EWAS, epigenome-wide association studies; FDR, false discovery rate; FWER, family-wise error rate; GNA12, guanine nucleotide binding protein alpha 12; HDAC, histone deacetylase; HOXA5, homeobox A5; meanbetafc, mean ß fold change; MHC, human major histocompatibility complex; mtDNA, mitochondrial DNA; nDNA, nuclear DNA; no.cpgs, number of CpGs constituting the differentially methylated region; NTCs, no template controls; qPCR, quantitative (realtime) polymerase chain reaction; RGMa, repulsive guidance molecule a; ROCK, Rho-associated protein kinase; ROS, reactive oxygen species; SASP, senescence-associated secretory phenotype; T2DM, type 2 diabetes; TFAM, mitochondrial transcription factor A; TNDM1, transient neonatal diabetes mellitus type 1; TSS, transcription start site; ZFP57, zinc finger protein 57 homolog.
Footnotes
References
Akulenko, R., Merl, M., and Helms, V. (2016). BEclear: batch effect detection and adjustment in DNA methylation data. PLoS One 11:e0159921. doi: 10.1371/journal.pone.0159921
Alfano, R., Herceg, Z., Nawrot, T. S., Chadeau-Hyam, M., Ghantous, A., and Plusquin, M. (2018). The Impact of Air Pollution on Our Epigenome: How Far Is the Evidence? (A Systematic Review). Curr. Environ. Health Rep. 5, 544–578. doi: 10.1007/s40572-018-0218-8
Anastasiadi, D., Esteve-Codina, A., and Piferrer, F. (2018). Consistent inverse correlation between DNA methylation of the first intron and gene expression across tissues and species. Epigenetics Chromatin 11:37. doi: 10.1186/s13072-018-0205-1
Arechederra, M., Daian, F., Yim, A., Bazai, S. K., Richelme, S., Dono, R., et al. (2018). Hypermethylation of gene body CpG islands predicts high dosage of functional oncogenes in liver cancer. Nat. Commun. 9:3164. doi: 10.1038/s41467-018-05550-5
Aubert, J., Begriche, K., Knockaert, L., Robin, M. A., and Fromenty, B. (2011). Increased expression of cytochrome P450 2E1 in nonalcoholic fatty liver disease: mechanisms and pathophysiological role. Clin. Res. Hepatol. Gastroenterol. 35, 630–637. doi: 10.1016/j.clinre.2011.04.015
Bakulski, K. M., Feinberg, J. I, Andrews, S. V., Yang, J., Brown, S. L., McKenney, S., et al. (2016). DNA methylation of cord blood cell types: applications for mixed cell birth studies. Epigenetics 11, 354–362. doi: 10.1080/15592294.2016.1161875
Ball, M. P., Li, J. B., Gao, Y., Lee, J. H., LeProust, E. M., Park, I. H., et al. (2009). Targeted and genome-scale strategies reveal gene-body methylation signatures in human cells. Nat. Biotechnol. 27, 361–368. doi: 10.1038/nbt.1533
Bansal, S., Liu, C. P., Sepuri, N. B., Anandatheerthavarada, H. K., Selvaraj, V., Hoek, J., et al. (2010). Mitochondria-targeted cytochrome P450 2E1 induces oxidative damage and augments alcohol-mediated oxidative stress. J. Biol. Chem. 285, 24609–24619. doi: 10.1074/jbc.M110.121822
Barker, D. J. (1995). Fetal origins of coronary heart disease. BMJ 311, 171–174. doi: 10.1136/bmj.311.6998.171
Barzilai, N., Huffman, D. M., Muzumdar, R. H., and Bartke, A. (2012). The critical role of metabolic pathways in aging. Diabetes 61, 1315–1322. doi: 10.2337/db11-1300
Bobo, W. V., Cooper, W. O., Stein, C. M., Olfson, M., Graham, D., Daugherty, J., et al. (2013). Antipsychotics and the risk of type 2 diabetes mellitus in children and youth. JAMA Psychiatry 70, 1067–1075. doi: 10.1001/jamapsychiatry.2013.2053
Boonen, S. E., Mackay, D. J., Hahnemann, J. M., Docherty, L., Gronskov, K., Lehmann, A., et al. (2013). Transient neonatal diabetes, ZFP57, and hypomethylation of multiple imprinted loci: a detailed follow-up. Diabetes Care 36, 505–512. doi: 10.2337/dc12-0700
Campisi, J. (2013). Aging, cellular senescence, and cancer. Annu. Rev. Physiol. 75, 685–705. doi: 10.1146/annurev-physiol-030212-183653
Chen, Y. A., Lemire, M., Choufani, S., Butcher, D. T., Grafodatskaya, D., Zanke, B. W., et al. (2013). Discovery of cross-reactive probes and polymorphic CpGs in the Illumina Infinium HumanMethylation450 microarray. Epigenetics 8, 203–209. doi: 10.4161/epi.23470
De Hert, M., Detraux, J., van Winkel, R., Yu, W., and Correll, C. U. (2011). Metabolic and cardiovascular adverse effects associated with antipsychotic drugs. Nat. Rev. Endocrinol. 8, 114–126. doi: 10.1038/nrendo.2011.156
Defronzo, R. A. (2011). Bromocriptine: a sympatholytic, d2-dopamine agonist for the treatment of type 2 diabetes. Diabetes care 34, 789–794. doi: 10.2337/dc11-0064
del Rosario, M. C., Ossowski, V., Knowler, W. C., Bogardus, C., Baier, L. J., and Hanson, R. L. (2014). Potential epigenetic dysregulation of genes associated with mody and type 2 diabetes in humans exposed to a diabetic intrauterine environment: an analysis of genome-wide dna methylation. Metabolism 63, 654–660. doi: 10.1016/j.metabol.2014.01.007
Du, P., Zhang, X., Huang, C.-C., Jafari, N., Kibbe, W. A., Hou, L., et al. (2010). Comparison of Beta-value and M-value methods for quantifying methylation levels by microarray analysis. BMC Bioinformatics 11:587. doi: 10.1186/1471-2105-11-587
Fontana, L., Meyer, T. E., Klein, S., and Holloszy, J. O. (2004). Long-term calorie restriction is highly effective in reducing the risk for atherosclerosis in humans. Proc. Natl. Acad. Sci. U.S.A. 101, 6659–6663. doi: 10.1073/pnas.0308291101
Ford, E. S., Giles, W. H., and Dietz, W. H. (2002). Prevalence of the metabolic syndrome among US adults: findings from the third National Health and Nutrition Examination Survey. Jama 287, 356–359. doi: 10.1001/jama.287.3.356
Fresno, C., and Fernández, E. A. (2013). RDAVIDWebService: a versatile R interface to DAVID. Bioinformatics 29, 2810–2811. doi: 10.1093/bioinformatics/btt487
Gianotti, T. F., Sookoian, S., Dieuzeide, G., Garcia, S. I., Gemma, C., Gonzalez, C. D., et al. (2008). A decreased mitochondrial DNA content is related to insulin resistance in adolescents. Obesity 16, 1591–1595. doi: 10.1038/oby.2008.253
Huang, D. W., Sherman, B. T., Tan, Q., Collins, J. R., Alvord, W. G., Roayaei, J., et al. (2007). The DAVID Gene Functional Classification Tool: a novel biological module-centric algorithm to functionally analyze large gene lists. Genome Biol. 8, R183–R183. doi: 10.1186/gb-2007-8-9-r183
Huang, H., Lee, D. H., Zabolotny, J. M., and Kim, Y. B. (2013). Metabolic actions of Rho-kinase in periphery and brain. Trends Endocrinol. Metab. 24, 506–514. doi: 10.1016/j.tem.2013.06.003
Ishige, K., Chen, Q., Sagara, Y., and Schubert, D. (2001). The activation of dopamine D4 receptors inhibits oxidative stress-induced nerve cell death. J. Neurosci. 21, 6069–6076. doi: 10.1523/JNEUROSCI.21-16-06069.2001
Jaffe, A. E., Murakami, P., Lee, H., Leek, J. T., Fallin, M. D., Feinberg, A. P., et al. (2012). Bump hunting to identify differentially methylated regions in epigenetic epidemiology studies. Int. J. Epidemiol. 41, 200–209. doi: 10.1093/ije/dyr238
Janssen, B. G., Madlhoum, N., Gyselaers, W., Bijnens, E., Clemente, D. B., Cox, B., et al. (2017). Cohort Profile: the ENVIRonmental influence ON early AGEing (ENVIRONAGE): a birth cohort study. Int. J. Epidemiol. 46, 1386–1387. doi: 10.1093/ije/dyw269
Jones, P. A. (1999). The DNA methylation paradox. Trends Genet. 15, 34–37. doi: 10.1016/S0168-9525(98)01636-9
Jones, P. A. (2012). Functions of DNA methylation: islands, start sites, gene bodies and beyond. Nat. Rev. Genet. 13, 484–492. doi: 10.1038/nrg3230
Kang, H. T., Park, J. T., Choi, K., Choi, H. J. C., Jung, C. W., Kim, G. R., et al. (2017). Chemical screening identifies ROCK as a target for recovering mitochondrial function in Hutchinson-Gilford progeria syndrome. Aging Cell 16, 541–550. doi: 10.1111/acel.12584
Key, B., and Lah, G. J. (2012). Repulsive guidance molecule A (RGMa): a molecule for all seasons. Cell Adh. Migr. 6, 85–90. doi: 10.4161/cam.20167
Kim, S. (2015). ppcor: an R package for a fast calculation to semi-partial correlation coefficients. Commun. Stat. Appl. Methods 22, 665–674. doi: 10.5351/CSAM.2015.22.6.665
Kim, T., He, L., Johnson, M. S., Li, Y., Zeng, L., Ding, Y., et al. (2014). Carnitine Palmitoyltransferase 1b deficiency protects mice from diet-induced insulin resistance. J. Diabetes Metab. 5, 361–361. doi: 10.4172/2155-6156.1000361
Korecka, J. A., Moloney, E. B., Eggers, R., Hobo, B., Scheffer, S., Ras-Verloop, N., et al. (2017). Repulsive Guidance Molecule a (RGMa) induces neuropathological and behavioral changes that closely resemble Parkinson’s disease. J. Neurosci. 37, 9361–9379. doi: 10.1523/jneurosci.0084-17.2017
Lamos, E. M., Levitt, D. L., and Munir, K. M. (2016). A review of dopamine agonist therapy in type 2 diabetes and effects on cardio-metabolic parameters. Primary Care Diabetes 10, 60–65. doi: 10.1016/j.pcd.2015.10.008
Lee, H. K., Park, K. S., Cho, Y. M., Lee, Y. Y., and Pak, Y. K. (2005). Mitochondria-based model for fetal origin of adult disease and insulin resistance. Ann. N. Y. Acad. Sci. 1042, 1–18. doi: 10.1196/annals.1338.001
Lee, H. K., Song, J. H., Shin, C. S., Park, D. J., Park, K. S., Lee, K. U., et al. (1998). Decreased mitochondrial DNA content in peripheral blood precedes the development of non-insulin-dependent diabetes mellitus. Diabetes Res. Clin. Pract. 42, 161–167. doi: 10.1016/S0168-8227(98)00110-7
Leung, T.-M., and Nieto, N. (2013). CYP2E1 and oxidant stress in alcoholic and non-alcoholic fatty liver disease. J. Hepatol. 58, 395–398. doi: 10.1016/j.jhep.2012.08.018
Levy-Marchal, C., Arslanian, S., Cutfield, W., Sinaiko, A., Druet, C., Marcovecchio, M. L., et al. (2010). Insulin resistance in children: consensus, perspective, and future directions. J. Clin. Endocrinol. Metab. 95, 5189–5198. doi: 10.1210/jc.2010-1047
Lowell, B. B., and Shulman, G. I. (2005). Mitochondrial dysfunction and type 2 diabetes. Science 307, 384–387. doi: 10.1126/science.1104343
Madhloum, N., Janssen, B. G., Martens, D. S., Saenen, N. D., Bijnens, E., Gyselaers, W., et al. (2017). Cord plasma insulin and in utero exposure to ambient air pollution. Environ. Int. 105, 126–132. doi: 10.1016/j.envint.2017.05.012
Matsunaga, E., Tauszig-Delamasure, S., Monnier, P. P., Mueller, B. K., Strittmatter, S. M., Mehlen, P., et al. (2004). RGM and its receptor neogenin regulate neuronal survival. Nat. Cell Biol. 6, 749–755. doi: 10.1038/ncb1157
Meyer, J. N., Leung, M. C. K., Rooney, J. P., Sendoel, A., Hengartner, M. O., Kisby, G. E., et al. (2013). Mitochondria as a target of environmental toxicants. Toxicol. Sci. 134, 1–17. doi: 10.1093/toxsci/kft102
Mogensen, M., Sahlin, K., Fernstrom, M., Glintborg, D., Vind, B. F., Beck-Nielsen, H., et al. (2007). Mitochondrial respiration is decreased in skeletal muscle of patients with type 2 diabetes. Diabetes 56, 1592–1599. doi: 10.2337/db06-0981
Moncion, A., Truong, N. T., Garrone, A., Beaune, P., Barouki, R., and De Waziers, I. (2002). Identification of a 16-nucleotide sequence that mediates post-transcriptional regulation of rat CYP2E1 by insulin. J. Biol. Chem. 277, 45904–45910. doi: 10.1074/jbc.M207841200
Morin, A. M., Gatev, E., McEwen, L. M., MacIsaac, J. L., Lin, D. T. S., Koen, N., et al. (2017). Maternal blood contamination of collected cord blood can be identified using DNA methylation at three CpGs. Clin. Epigenetics 9:75. doi: 10.1186/s13148-017-0370-2
Mueller, B. K., Yamashita, T., Schaffar, G., and Mueller, R. (2006). The role of repulsive guidance molecules in the embryonic and adult vertebrate central nervous system. Philos. Trans. R. Soc. Lond. B Biol. Sci. 361, 1513–1529. doi: 10.1098/rstb.2006.1888
Passos, J. F., Saretzki, G., and von Zglinicki, T. (2007). DNA damage in telomeres and mitochondria during cellular senescence: is there a connection? Nucleic Acids Res. 35, 7505–7513. doi: 10.1093/nar/gkm893
Petersen, K. F., Befroy, D., Dufour, S., Dziura, J., Ariyan, C., Rothman, D. L., et al. (2003). Mitochondrial dysfunction in the elderly: possible role in insulin resistance. Science 300, 1140–1142. doi: 10.1126/science.1082889
Petersen, K. F., Dufour, S., Befroy, D., Garcia, R., and Shulman, G. I. (2004). Impaired mitochondrial activity in the insulin-resistant offspring of patients with type 2 diabetes. N. Engl. J. Med. 350, 664–671. doi: 10.1056/NEJMoa031314
Plusquin, M., Guida, F., Polidoro, S., Vermeulen, R., Raaschou-Nielsen, O., Campanella, G., et al. (2017). DNA methylation and exposure to ambient air pollution in two prospective cohorts. Environ. Int. 108, 127–136. doi: 10.1016/j.envint.2017.08.006
Ptácek, R., Kuzelová, H., and Stefano, G. B. (2011). Dopamine D4 receptor gene DRD4 and its association with psychiatric disorders. Med. Sci. Monitor 17, RA215–RA220. doi: 10.12659/MSM.881925
Quenneville, S., Verde, G., Corsinotti, A., Kapopoulou, A., Jakobsson, J., Offner, S., et al. (2011). In embryonic stem cells, ZFP57/KAP1 recognize a methylated hexanucleotide to affect chromatin and DNA methylation of imprinting control regions. Mol. cell 44, 361–372. doi: 10.1016/j.molcel.2011.08.032
Roberts, A., Gladish, N., Gatev, E., Jones, M., Chen, Y., MacIsaac, J., et al. (2018). Exposure to childhood abuse is associated with human sperm DNA methylation. Transl. Psychiatry 8:194. doi: 10.1038/s41398-018-0252-1
Rosa, M. J., Just, A. C., Guerra, M. S., Kloog, I., Hsu, H. L., Brennan, K. J., et al. (2017). Identifying sensitive windows for prenatal particulate air pollution exposure and mitochondrial DNA content in cord blood. Environ. Int. 98, 198–203. doi: 10.1016/j.envint.2016.11.007
Roubicek, D. A., and Souza-Pinto, N. C. (2017). Mitochondria and mitochondrial DNA as relevant targets for environmental contaminants. Toxicology 391, 100–108. doi: 10.1016/j.tox.2017.06.012
Sabin, M. A., Magnussen, C. G., Juonala, M., Shield, J. P. H., Kähönen, M., Lehtimäki, T., et al. (2015). Insulin and BMI as predictors of adult type 2 diabetes mellitus. Pediatrics 135, e144–e151. doi: 10.1542/peds.2014-1534
Schmandke, A., Schmandke, A., and Strittmatter, S. M. (2007). ROCK and Rho: biochemistry and neuronal functions of Rho-associated protein kinases. Neuroscientist 13, 454–469. doi: 10.1177/1073858407303611
Scranton, R., and Cincotta, A. (2010). Bromocriptine – unique formulation of a dopamine agonist for the treatment of type 2 diabetes. Expert Opin. Pharmacother. 11, 269–279. doi: 10.1517/14656560903501544
Shimada, S., Hirabayashi, M., Ishige, K., Kosuge, Y., Kihara, T., and Ito, Y. (2010). Activation of dopamine D4 receptors is protective against hypoxia/reoxygenation-induced cell death in HT22 cells. J. Pharmacol. Sci. 114, 217–224. doi: 10.1254/jphs.10134FP
Solomon, O., Yousefi, P., Huen, K., Gunier, R. B., Escudero-Fung, M., Barcellos, L. F., et al. (2017). Prenatal phthalate exposure and altered patterns of DNA methylation in cord blood. Environ. Mol. Mutagen. 58, 398–410. doi: 10.1002/em.22095
Song, J., Oh, J. Y., Sung, Y. A., Pak, Y. K., Park, K. S., and Lee, H. K. (2001). Peripheral blood mitochondrial DNA content is related to insulin sensitivity in offspring of type 2 diabetic patients. Diabetes Care 24, 865–869. doi: 10.2337/diacare.24.5.865
Sookoian, S., Rosselli, M. S., Gemma, C., Burgueno, A. L., Fernandez Gianotti, T., Castano, G. O., et al. (2010). Epigenetic regulation of insulin resistance in nonalcoholic fatty liver disease: impact of liver methylation of the peroxisome proliferator-activated receptor gamma coactivator 1alpha promoter. Hepatology 52, 1992–2000. doi: 10.1002/hep.23927
Sun, N., Youle, R. J., and Finkel, T. (2016). The mitochondrial basis of aging. Mol. Cell 61, 654–666. doi: 10.1016/j.molcel.2016.01.028
Vineis, P., Chadeau-Hyam, M., Gmuender, H., Gulliver, J., Herceg, Z., Kleinjans, J., et al. (2017). The exposome in practice: design of the EXPOsOMICS project. Int. J. Hyg. Environ. Health 220, 142–151. doi: 10.1016/j.ijheh.2016.08.001
Vriens, A., Plusquin, M., Baeyens, W., Bruckers, L., Den Hond, E., Loots, I., et al. (2018). Cord blood leptin and insulin levels in association with mitochondrial DNA content. J. Transl. Med. 16:224. doi: 10.1186/s12967-018-1599-z
Wilson, A. S., Power, B. E., and Molloy, P. L. (2007). DNA hypomethylation and human diseases. Biochim. Biophys. Acta 1775, 138–162. doi: 10.1016/j.bbcan.2006.08.007
Woodcroft, K. J., Hafner, M. S., and Novak, R. F. (2002). Insulin signaling in the transcriptional and posttranscriptional regulation of CYP2E1 expression. Hepatology 35, 263–273. doi: 10.1053/jhep.2002.30691
World Medical Association. (2013). Declaration of Helsinki: ethical principles for medical research involving human subjects. Jama 310, 2191–2194. doi: 10.1001/jama.2013.281053
Yakes, F. M., and Van Houten, B. (1997). Mitochondrial DNA damage is more extensive and persists longer than nuclear DNA damage in human cells following oxidative stress. Proc. Natl. Acad. Sci. U.S.A. 94, 514–519. doi: 10.1073/pnas.94.2.514
Yang, X., Han, H., De Carvalho, D. D., Lay, F. D., Jones, P. A., and Liang, G. (2014). Gene body methylation can alter gene expression and is a therapeutic target in cancer. Cancer Cell 26, 577–590. doi: 10.1016/j.ccr.2014.07.028
Yu, G., and He, Q.-Y. (2016). ReactomePA: an R/Bioconductor package for reactome pathway analysis and visualization. Mol. Biosyst. 12, 477–479. doi: 10.1039/C5MB00663E
Keywords: insulin, mitochondrial DNA content, epigenome-wide methylation, cord blood insulin levels, mitochondrial dysfunction, differentially methylated regions, DMRs, ENVIRONAGE
Citation: Reimann B, Janssen BG, Alfano R, Ghantous A, Espín-Pérez A, de Kok TM, Saenen ND, Cox B, Robinson O, Chadeau-Hyam M, Penders J, Herceg Z, Vineis P, Nawrot TS and Plusquin M (2019) The Cord Blood Insulin and Mitochondrial DNA Content Related Methylome. Front. Genet. 10:325. doi: 10.3389/fgene.2019.00325
Received: 30 November 2018; Accepted: 25 March 2019;
Published: 12 April 2019.
Edited by:
Dana C. Crawford, Case Western Reserve University, United StatesReviewed by:
Olivia J. Veatch, University of Pennsylvania, United StatesKristina Allen-Brady, The University of Utah, United States
Copyright © 2019 Reimann, Janssen, Alfano, Ghantous, Espín-Pérez, de Kok, Saenen, Cox, Robinson, Chadeau-Hyam, Penders, Herceg, Vineis, Nawrot and Plusquin. This is an open-access article distributed under the terms of the Creative Commons Attribution License (CC BY). The use, distribution or reproduction in other forums is permitted, provided the original author(s) and the copyright owner(s) are credited and that the original publication in this journal is cited, in accordance with accepted academic practice. No use, distribution or reproduction is permitted which does not comply with these terms.
*Correspondence: Michelle Plusquin, bWljaGVsbGUucGx1c3F1aW5AdWhhc3NlbHQuYmU=