 Gabriella Farries1
 Kenneth Bryan1
 Charlotte L. McGivney2Paul A. McGettigan1Katie F. Gough1
 John A. Browne1
 David E. MacHugh1,3
 Lisa Michelle Katz2
 Emmeline W. Hill1,4*
- 1UCD School of Agriculture and Food Science, University College Dublin, Dublin, Ireland
- 2UCD School of Veterinary Medicine, University College Dublin, Dublin, Ireland
- 3UCD Conway Institute of Biomolecular and Biomedical Research, University College Dublin, Dublin, Ireland
- 4Research and Development, Plusvital Ltd., Dublin, Ireland
While over ten thousand genetic loci have been associated with phenotypic traits and inherited diseases in genome-wide association studies, in most cases only a relatively small proportion of the trait heritability is explained and biological mechanisms underpinning these traits have not been clearly identified. Expression quantitative trait loci (eQTL) are subsets of genomic loci shown experimentally to influence gene expression. Since gene expression is one of the primary determinants of phenotype, the identification of eQTL may reveal biologically relevant loci and provide functional links between genomic variants, gene expression and ultimately phenotype. Skeletal muscle (gluteus medius) gene expression was quantified by RNA-seq for 111 Thoroughbreds (47 male, 64 female) in race training at a single training establishment sampled at two time-points: at rest (n = 92) and four hours after high-intensity exercise (n = 77); n = 60 were sampled at both time points. Genotypes were generated from the Illumina Equine SNP70 BeadChip. Applying a False Discovery Rate (FDR) corrected P-value threshold (PFDR < 0.05), association tests identified 3,583 cis-eQTL associated with expression of 1,456 genes at rest; 4,992 cis-eQTL associated with the expression of 1,922 genes post-exercise; 1,703 trans-eQTL associated with 563 genes at rest; and 1,219 trans-eQTL associated with 425 genes post-exercise. The gene with the highest cis-eQTL association at both time-points was the endosome-associated-trafficking regulator 1 gene (ENTR1; Rest: PFDR = 3.81 × 10⁻²⁷, Post-exercise: PFDR = 1.66 × 10⁻²⁴), which has a potential role in the transcriptional regulation of the solute carrier family 2 member 1 glucose transporter protein (SLC2A1). Functional analysis of genes with significant eQTL revealed significant enrichment for cofactor metabolic processes. These results suggest heritable variation in genomic elements such as regulatory sequences (e.g. gene promoters, enhancers, silencers), microRNA and transcription factor genes, which are associated with metabolic function and may have roles in determining end-point muscle and athletic performance phenotypes in Thoroughbred horses. The incorporation of the eQTL identified with genome and transcriptome-wide association may reveal useful biological links between genetic variants and their impact on traits of interest, such as elite racing performance and adaptation to training.
Introduction
In the 6,000 years since horses were first domesticated on the Eurasian steppe, there has been strong artificial selection for various athletic traits (Levine, 1999). Selection for athleticism is perhaps most clearly manifested in the Thoroughbred, which has undergone over 300 years of intense selection for speed and racing performance (Willett, 1975; Todd et al., 2018). As a result the Thoroughbred has a highly developed musculature, with a skeletal muscle mass ∼10% greater than other horse breeds (∼55% compared to ∼42%) (Gunn, 1987), accompanied by decreased body fat (Kearns et al., 2002), superior glycogen storage capacity (Votion et al., 2012), increased mitochondrial volume (compared to other mammals) (Kayar et al., 1989) and a high degree of plasticity in skeletal muscle fibre composition (Rivero, 2004).
The response of equine skeletal muscle to training has been well studied (Snow et al., 1985; Snow, 1994). These responses in general increase the oxidative capacity of the muscle, such as fibre type switching from fast-twitch glycolytic fibres to slow-twitch, high-oxidative fibres (Snow, 1994; Serrano et al., 2000), an increase in oxidative phosphorylation (Snow et al., 1985; Votion et al., 2012) and increased mitochondrial volume (Tyler et al., 1998). Training also elicits an increase in skeletal muscle mass (Rivero et al., 1996), mediated through hyperplastic growth as opposed to marked hypertrophy (Rivero et al., 1996; Rivero et al., 2002).
The transcriptional response to exercise and training in skeletal muscle has been studied in the Thoroughbred (McGivney et al., 2009; Eivers et al., 2010; McGivney et al., 2010; Eivers et al., 2012; Bryan et al., 2017). Initially, reverse transcription quantitative real-time polymerase chain reaction (RT-qPCR) was used to quantify expression of 18 candidate genes in response to a standardised exercise test on a high-speed treadmill (Eivers et al., 2010). Significant differential expression of creatine kinase M-type (CKM), cytochrome c oxidase subunit 4I1 (COX4I1), cytochrome c subunit 4I2 (COX4I2), pyruvate dehydrogenase kinase 4 (PDK4), PPARG coactivator 1 alpha (PPARG1A) and solute carrier family 24 member 4 (SLC2A4) four hours post-exercise was detected. PPARG1A is a transcription factor downstream of hypoxia-inducible factor (HIF), activation of PPARG1A via HIF in response to exercise induces downstream adaptations in oxidative phosphorylation (Arany, 2008). The differentially expressed genes were downstream targets of HIF or related to oxidative phosphorylation or muscle substrate use (Kraniou et al., 2006) The availability of a dedicated equine microarray allowed gene expression to be measured across 9,333 expressed sequence tags (ESTs). This technology was then used to examine the changes in gene expression induced by exercise, without a priori knowledge of the genes involved (McGivney et al., 2009). Analysis of the differentially expressed genes showed a functional enrichment of genes involved in insulin signalling, focal adhesion, hypertrophic and apoptotic pathways. Digital gene expression was used to investigate the transcriptional response to a ten-month training protocol (McGivney et al., 2010), identifying functional enrichment of genes relevant to aerobic metabolism. More recently, RNA sequencing (RNA-seq) was used to investigate the response to both exercise and training, and a network biology approach was employed to identify relevant functional modules that highlighted the role of autophagy (Bryan et al., 2017) While these studies provide insight to the genes involved in the transcriptional response to exercise, they do not reveal whether there is variation in the transcriptional response among individuals and how this may influence skeletal muscle function.
Expression quantitative trait loci (eQTL) are genomic variants, typically single nucleotide polymorphism (SNPs), that are associated with variation in RNA transcript abundance. Jansen and Nap (2001) introduced the concept of ‘genetical genomics’ where genomic loci were associated with cellular intermediates, such as transcript abundance, to catalogue functional relevance for non-coding variants. These measurements at a cellular level then act as endophenotypes, which are heritable, intermediate phenotypes This was a particularly important development because the clear majority (>85%) of QTLs detected in genome-wide association studies (GWAS) are located in non-coding regions (Hindorff et al., 2009; Brown et al., 2013).
Cis-eQTL are genetic variants that alter gene expression in an allele-specific manner and are typically located in gene regulatory regions (Wittkopp, 2005; Westra and Franke, 2014). Identification of true cis-eQTL requires aligning reads to their chromosome of origin; consequently, many studies have by convention defined any eQTLs within 1 Mb of the transcription start site (TSS) of the gene they act on as cis. Conversely, trans-eQTL act in a less direct manner, altering the expression of a secondary genome product—for example, a transcription factor or a microRNA—that regulates expression of a distant gene elsewhere in the genome (Wittkopp, 2005).
The study of eQTL in skeletal muscle to-date has been largely to investigate functional variants in the pathogenesis of type II diabetes (T2D) in humans (Mason et al., 2011; Keildson et al., 2014b; Sajuthi et al., 2016). While GWAS for T2D have identified loci associated with disease risk, these studies have not provided information on the function of these variants or the mechanism by which they contribute to disease. Keildson et al. (2014b) performed an eQTL investigation using skeletal muscle biopsies from 104 human subjects and identified an association between the rs4547172 SNP and muscle phosphofructokinase gene (PFKM) expression. Furthermore, the study found that increased expression of PFKM was associated with increased resting plasma insulin (an endophenotype) and T2D (an end-point phenotype). This example shows that an eQTL approach can identify functional links between genomic variants, gene expression, endophenotypes, and ultimately, disease.
Variation in human gene expression has been found to be highly heritable (Monks et al., 2004; Stranger et al., 2007; Wright et al., 2014). Given the influence of gene expression on phenotype, detection of heritable variation in skeletal muscle gene expression may provide insight into genomic loci contributing to variation in exercise and performance related phenotypes.
In this study, we hypothesised that there is heritable variation in the Thoroughbred skeletal muscle transcriptional response to exercise and training, and that this variation may have implications for athletic performance.
Methods
Ethics Statement
University College Dublin Animal Research Ethics Committee approval (AREC-P-12-55-Hill), a licence from the Department of Health (B100/3525), and informed owner consent were obtained.
Cohort
Skeletal muscle biopsy samples (gluteus medius) were collected from 111 horses (47 male, 64 female) born between 2011 and 2012. All horses were based at a single training yard, under the supervision of a single trainer and under similar management and feeding regimes. The 111 horses used for the study were produced from 19 different sires and 94 different dams.
Biopsies were collected at two time points: untrained at rest (UR) and untrained four hours post-exercise (UE). Of the 111 horses, 60 were sampled at both time points. In total 92 UR samples and 77 UE samples were collected. The horses were defined as untrained because they had completed ≤ four sprint exercise bouts (e.g., work days) prior to sampling. The number of prior work days and days of submaximal prior training prior to sampling were recorded. Horses were defined as untrained in order to integrate results with those of Bryan et al. (2017), where the untrained cohort had performed only 1−2 work days prior to sampling, and the trained cohort had completed a mean of 15.1 work days prior to sampling (SD = 9.1).
Exercise Test
The exercise stimulus was an intense sprint bout of exercise (work day) undertaken as part of normal training. The training regime for horses is submaximal training at canter six times per week, with work days being introduced and replacing one to two submaximal bouts per week. On a work day horses were initially walked on an automated horse walker for 30–60 min, followed by 5–10 min of walking in hand. Under saddle there was an initial warm-up period of 300 m walk and 700 m of trot and slow canter down the incline of the track. The work day was performed on a 1,500 m all-weather woodchip gallop track, with the final 800 m straight set on a 2.7% incline. The sprint portion of the exercise bout consisted of the horses galloping at high intensity for 800-1,000 m up the incline of the gallop. In a larger cohort of horses (n = 294) from the same training establishment, the work day was characterised using concurrent global positioning system (GPS) and heart rate monitoring (Farries et al., 2019). From 2,900 GPS recordings the mean peak speed was 16.36 m/s (range: 14.23−17.63 m/s). Of these 2,900 recordings 1,056 had simultaneous heart rate recordings, with a mean peak heart rate of 219 beats per minute (range: 182−237).
For 34/77 UE horses, whole blood was collected at rest and five minutes post-exercise into fluoride oxalate tubes. Samples were centrifuged, and plasma lactate concentrations measured on-site using a YSI2300 STAT PLUS auto analyser (YSI UK Ltd, Hampshire, UK). These measurements were used to validate the intensity of the exercise test performed.
Biopsy Sampling
Percutaneous needle muscle biopsies (approximately 300 mg) were obtained from the ventral compartment of the middle gluteal muscle using the method described by Valette et al. (1999). All UR samples were collected between 7:30 am and 11:30 am. UE samples were taken four hours after completion of the exercise test, as this has previously been shown to be a timepoint where the greatest change in gene expression in response to acute exercise was observed (McGivney et al., 2009; Eivers et al., 2010). Muscle samples were stored in RNAlater (Thermo Fisher, Massachusetts, USA) for 24 hours at 4°C then stored at −20°C prior to RNA extraction.
RNA Extraction and Quality Control
Total RNA was extracted from approximately 70 mg tissue using a protocol combining TRIzol reagent (Thermo Fisher), DNase I treatment (Qiagen, Hilden, Germany) and an RNeasy Mini-Kit (Qiagen). RNA was quantified using a Nano Drop ND1000 spectrophotometer V 3.5.27 (Thermo Fisher). RNA quality was assessed using the RNA integrity number (RIN) on an Agilent Bioanalyser with the RNA 6000 Nano LabChip kit6 (Agilent, Cork, Ireland).
RNA Sequencing
Indexed, strand-specific Illumina sequencing libraries were prepared using the TruSeq Stranded mRNA Library Preparation Kit LT (Illumina, San Diego, CA, USA). Libraries were pooled with 18–20 indexed libraries per pool and sequenced on an Illumina HiSeq 2500 using a Rapid Run flow cell and reagents to generate 100 bp paired-end reads. Each pool was sequenced across both lanes of the flow cell (dual lane loading). Demultiplexed sequence data was then converted to FASTQ format. Sequencing was performed by the Research Technology Support Facility, Michigan State University.
RNA-Seq Data Workflow
Quality control of the sequence reads was performed using FastQC [version: 0.11.5] (Andrews, 2010). STAR aligner [version: 2.5.2b] (Dobin et al., 2013) was used to map reads to the Equine reference genome EquCab2 (Ensembl release 62). After mapping, featureCounts [version: 1.5.0] was used to assign reads to genes (Liao et al., 2014). Data for each sample from each sequencing lane was then merged where concordance was >99% between lanes. Count data was parsed using a custom script, then small non-coding RNA were filtered using BiomaRt (Durinck et al., 2009). Assessment of the count data and multidimensional scaling were performed using edgeR (Robinson et al., 2010). Results of the multidimensional scaling were visualised using ggplot2 (Wickham, 2009). Count data was quantile normalised using preprocessCore [version: 1.40.0] (Bolstad, 2017) within the R environment [version: 3.5.1] (R Core Team, 2017), and the log2 of quantile-normalised count data calculated.
Genotyping
Genomic DNA was extracted from whole blood using the Maxwell 16 automated DNA purification system (Promega, Madison, WI, USA). Horses were genotyped on the Illumina Equine SNP70 BeadChip (Illumina). A genetic versus phenotypic sex check was performed. SNPs with a genotyping rate of <95%, and individuals with a genotyping rate <95% were excluded. SNPs with a minor allele frequency (MAF) < 0.10 were removed. Using these quality-controlled SNPs, identity by state (IBS) distances between individuals were calculated using the ‘genome’ function in PLINK [version 1.09] (Chang et al., 2015). The remaining 43,988 SNPs were then pruned based on pairwise linkage disequilibrium (LD) using a sliding window with an LD threshold of r2 > 0.7, a window size of 50, and a step of 5 in PLINK. A set of 15,995 SNPs were used for the eQTL analysis. Pruning was undertaken due to the large spanning of LD within the Thoroughbred, with previous work validating the use of <15,000 SNPs to capture the majority of genetic variation (Corbin et al., 2014; Schaefer et al., 2017).
eQTL Analysis
eQTL were determined using a linear model within matrixEQTL [version: 2.1.1] (Shabalin, 2012); including sex and age at sampling (days) as covariates. As samples had been included in two separate sample pools which were sequenced separately, the sequencing batch for each sample was also included as a covariate. Tests of association were corrected using the Benjamini-Hochberg procedure (Benjamini and Hochberg, 1995) and eQTL with a corrected P-value (PFDR) < 0.05 were catalogued for UR and UE samples separately. eQTL located within 1 Mb of the transcription start site (TSS) of the gene they were associated were designated as cis, and those located >1Mb from the TSS were designated trans, in keeping with human eQTL studies (Lonsdale et al., 2013). Significant results were then compared against genes previously identified in the skeletal muscle transcriptional response to acute, high-intensity exercise (a work day; 3,241 genes) and transcriptional response to a six-month period of training (3,405 genes) (Bryan et al., 2017).
Functional Enrichment Analysis
Genes with significant eQTL were investigated for enrichment of biological processes using gene ontology (GO) categories (Ashburner et al., 2000) with the clusterProfiler package [version: 3.10.1] (Yu et al., 2012) within the R environment. Equine Ensembl IDs were mapped to annotated human orthologs, retrieved from the BioMart database (Kasprzyk, 2011) and GO enrichment performed using the annotation from the human genome annotation package org.Hs.eg.db [version: 2.12.0] (Carlson, 2019). The background gene set was the complement of genes expressed in skeletal muscle identified in this study (13,384 genes; 12,707 mapped to human orthologs). A threshold for significant enrichment was set at <0.05 after adjustment using the Benjamini-Hochberg procedure (PFDR) (Benjamini and Hochberg, 1995). The number of genes assigned to each Biological Process (Gene count) and proportion of genes associated with that cluster out of all the genes expressed (Gene ratio) were also reported. Results were visualised using the clusterProfiler package (Yu et al., 2012).
Results
Cohort
UR horses had a mean age of 611.7 days (range: 513–787 days), UE horses had a mean age of 757.5 days (range: 617–1,283 days). Dates of commencing preparatory training were available for 90 of the UR horses; 21 of the UR horses were sampled prior to breaking, 69 were sampled after breaking with a mean of 41.5 days after commencing preparatory training (range: 5-154 days) (Table 1). UE horses were sampled on average 156.6 days after commencing preparatory training (range: 31–307). UR horses had an average of 41.5 days submaximal training (range: 5–154) and UE had on average 48.6 (range: 19–152) (Table 1). UR horses had completed a mean of 0.3 work days (range: 0–4), UE horses completed a mean of 0.5 WDs prior to sampling (range: 0–3) (Table 2). A subset of 34 of the UE horses had a mean peak post-exercise plasma lactate concentration of 28.2 mmol/L, and a mean resting plasma concentration of 0.4 mmol/L. All RNA samples used for RNA-seq had a RIN greater than 7.0, the UR cohort had a mean RIN of 8.0 (range: 7.2−9.3) and the UE cohort had a mean RIN of 8.1 (range: 7.0−9.3). Multi-dimensional scaling was used to visually inspect the count data, showing separation of untrained resting and untrained post-exercise samples (Figure S1).
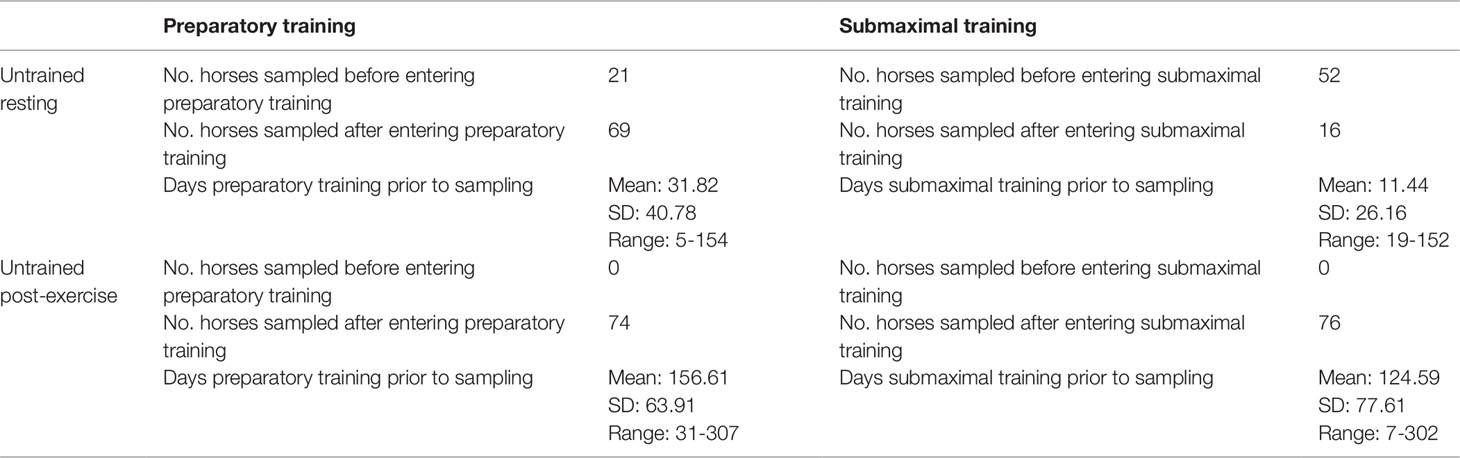
Table 1 Description of prior training completed by horses in the untrained resting and untrained post-exercise cohorts.
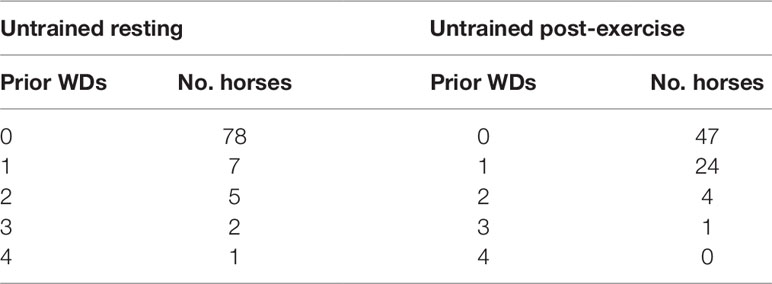
Table 2 Number of prior high-intensity sprint bouts (work days, WDs) completed prior to sampling for horses within untrained resting and untrained post-exercise cohorts.
Analysis of the genetic relatedness of the cohort showed the mean IBS distance between individuals was 0.69 and ranged from 0.64−0.85 (SD = 0.03). Of the 19 sires represented in the cohort, the top six sires in terms of number of progent represented had 39, 23, 14, 10, 6, and 4 progeny. There were two sires with two progeny and the remaining ten sires had one offspring each. There were 12 full siblings in the cohort and 34 half-siblings by dam.
eQTL Discovery
Using the full complement of 13,384 genes, 3,582 cis-eQTL and 1,703 trans-eQTL were detected in UR samples (PFDR < 0.05). The 3,582 cis-eQTL were associated with expression of 1,456 genes. The gene with the strongest cis-eQTL (BIEC2-707785) in UR horses was the endosome associated trafficking regulator 1 gene (ENTR1; PFDR = 3.81 × 10⁻²⁷) (Figure S2, Table 3). GO enrichment analysis of the cis regulated genes in UR samples showed that the most significantly enriched Biological Process was ‘GO:0006805 xenobiotic metabolic process ‘ (PFDR = 3.02 × 10⁻⁷, Gene Ratio = 33/1,614). ‘GO:0051186 cofactor metabolic process’ (PFDR = 1.42 × 10⁻⁴) was also significantly enriched and had the largest Gene Ratio (105/1,614) (Figure 1, Table S1).
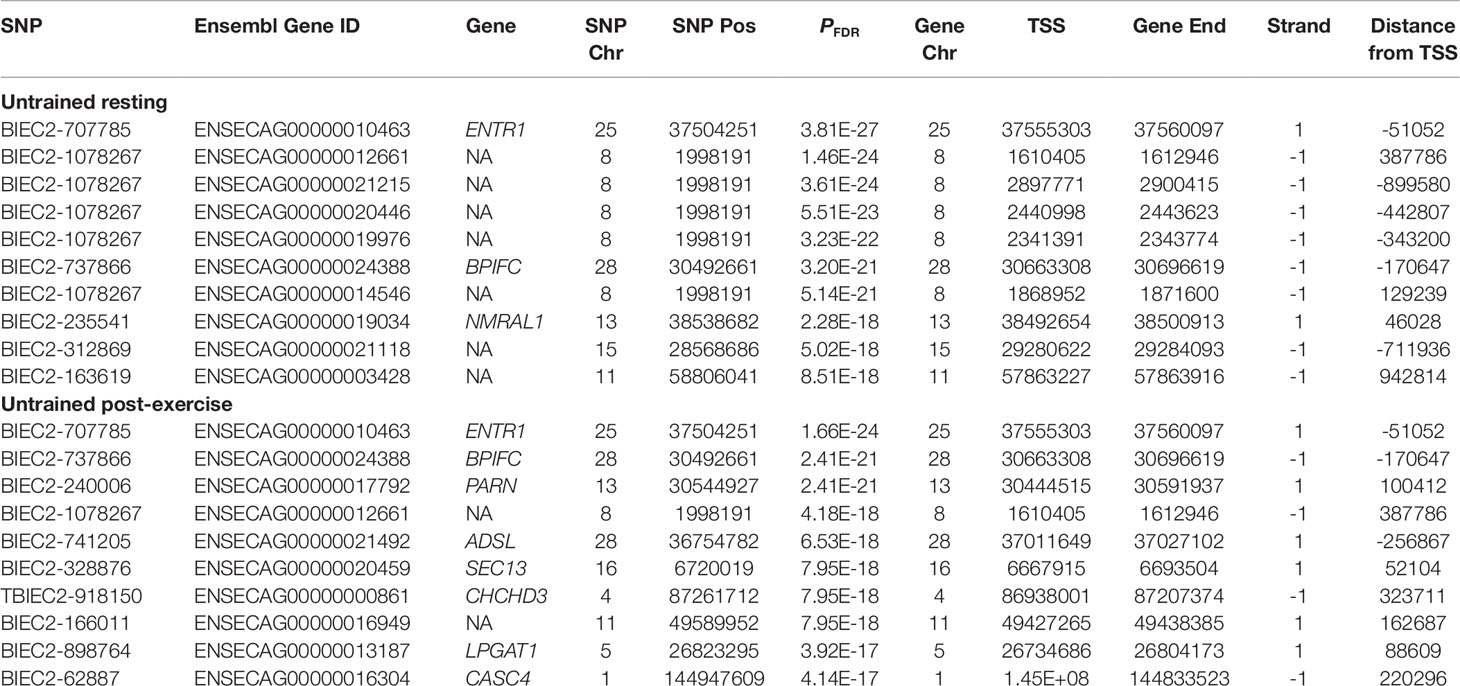
Table 3 Top 10 genes by strongest cis-eQTL association.
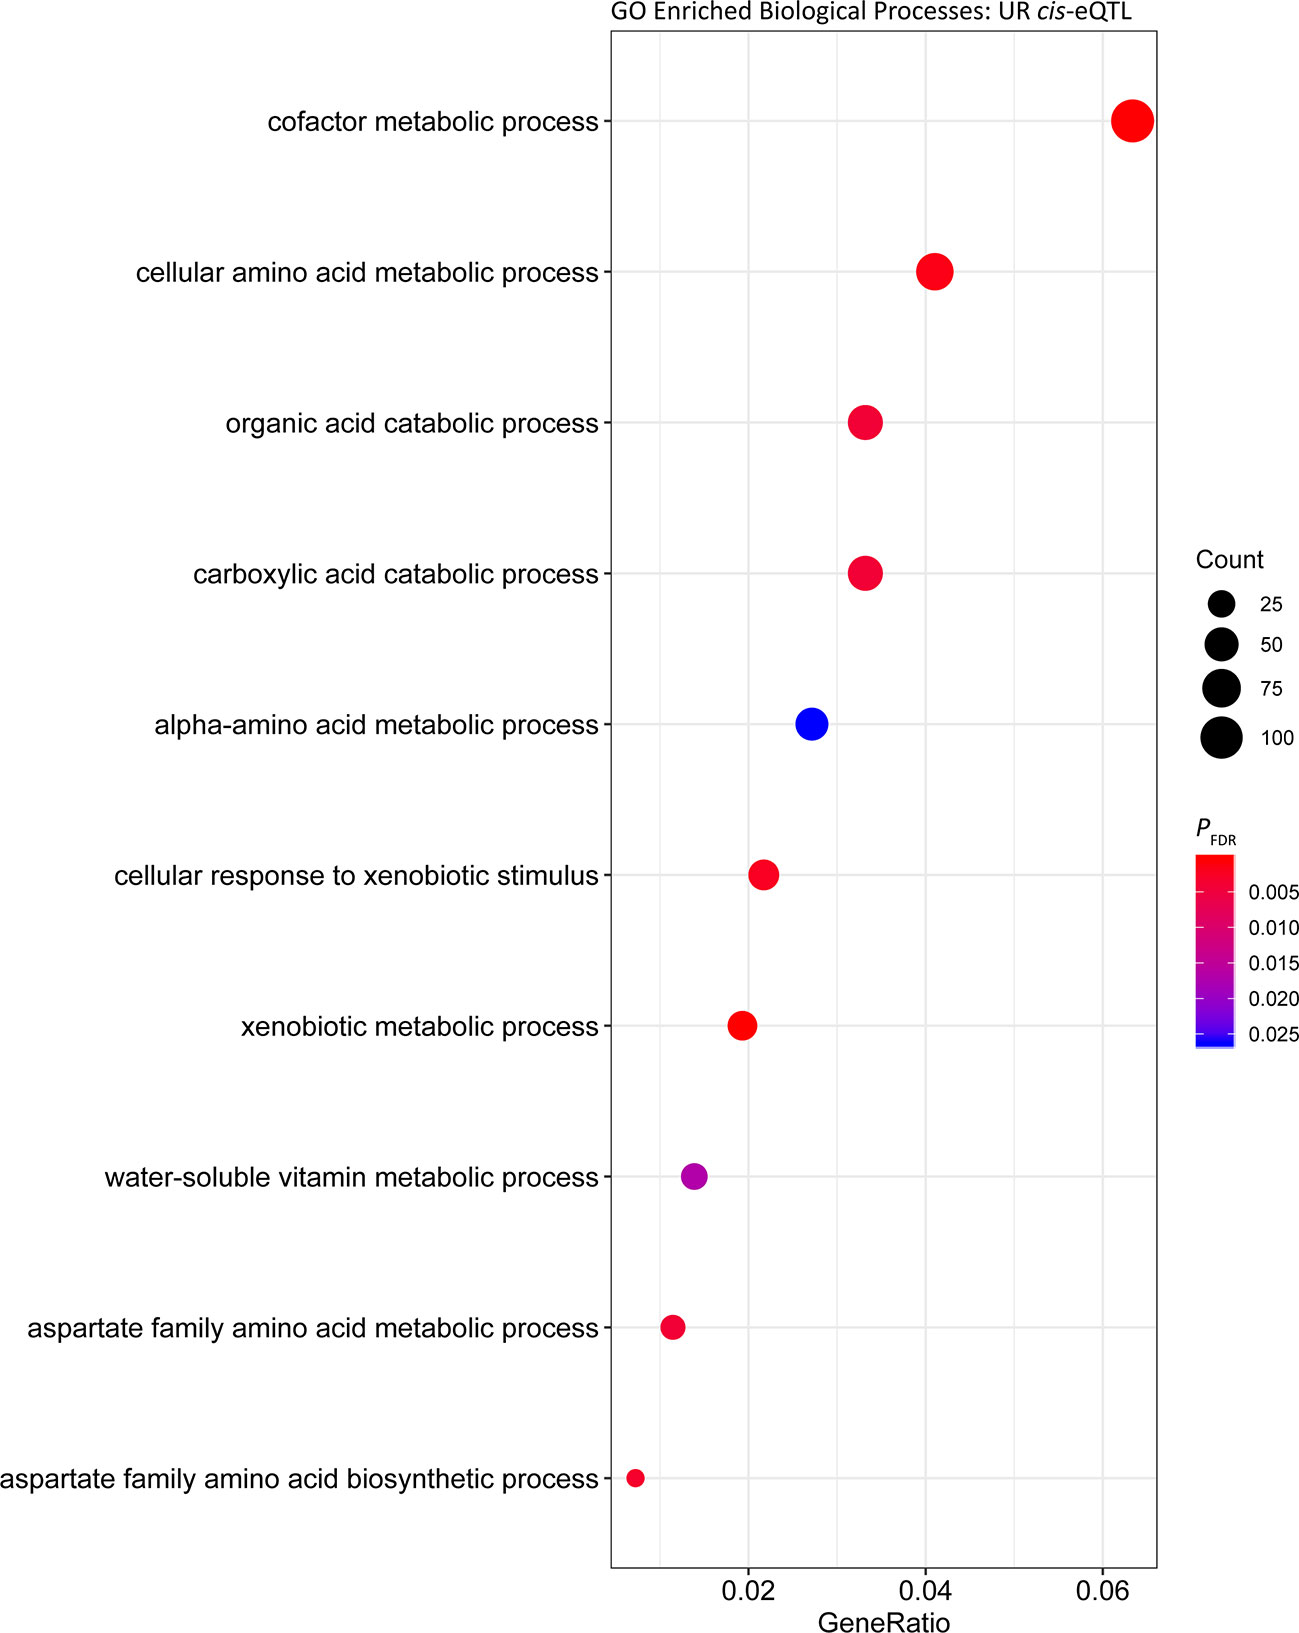
Figure 1 Gene ontology enrichment of biological processes for genes under cis regulation in the untrained resting cohort.
In the UR cohort 1,219 trans-eQTL were associated with 425 genes. The majority 70.39% (858) were located on the same chromosome as the associated gene, and 29.61% (361) were associated with genes located on different chromosomes. The most significant trans-eQTL was BIEC2-526896 on ECA20 and expression of the DEAH-box helicase 16 gene (DHX16) also located on ECA20 1.49 Mb downstream from BIEC2-526896 (PFDR = 3.50 × 10⁻¹⁷) (Table 4). Functional analysis of the trans eGenes showed enrichment of ‘interferon-gamma-mediated signalling’ (PFDR = 6.06 × 10⁻⁴, Gene Ratio = 13/340) (Figure 2, Table S2). The functional categories with the highest Gene Ratios were ‘cofactor metabolic process’ (PFDR = 0.01, Gene Ratio = 29/340) and ‘monocarboxylic acid metabolic process’ (PFDR = 0.02, Gene Ratio = 29/340) (Figure 2, Table S2).
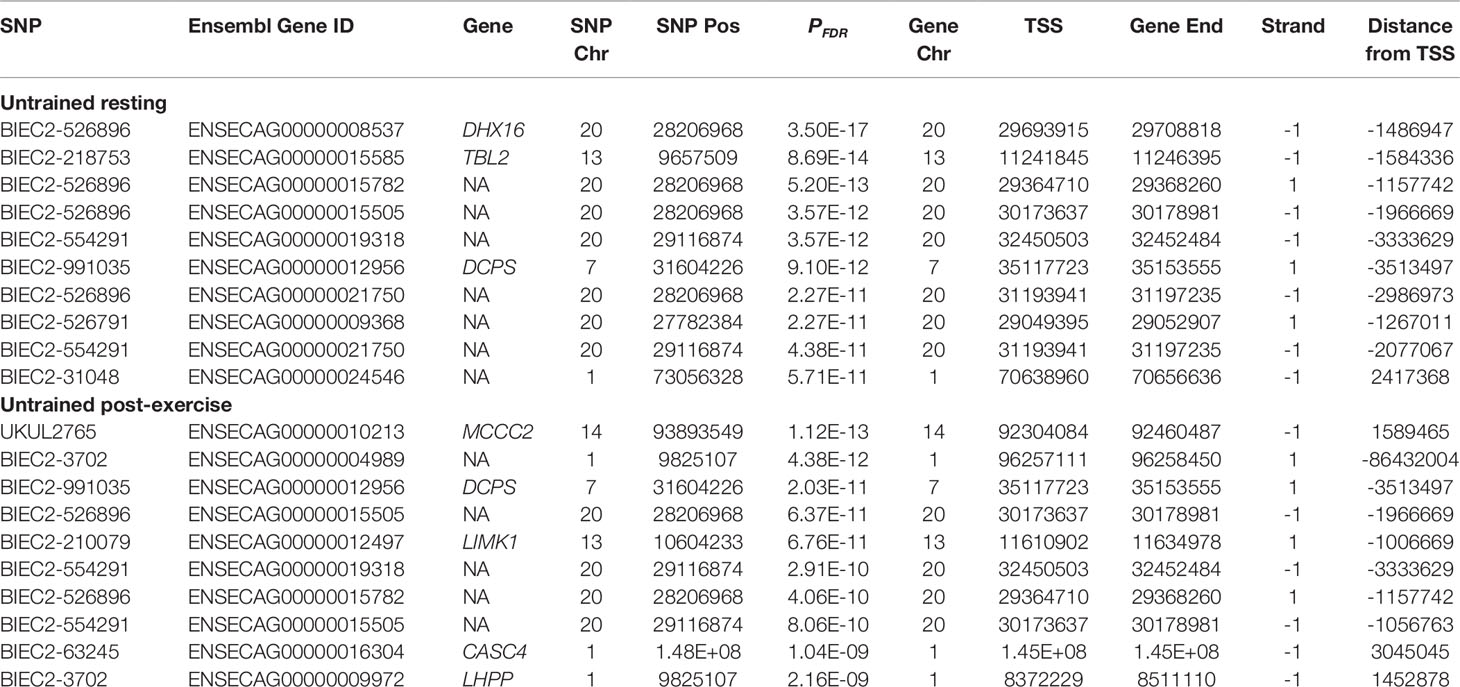
Table 4 top ten genes by strongest trans-eQTL association.
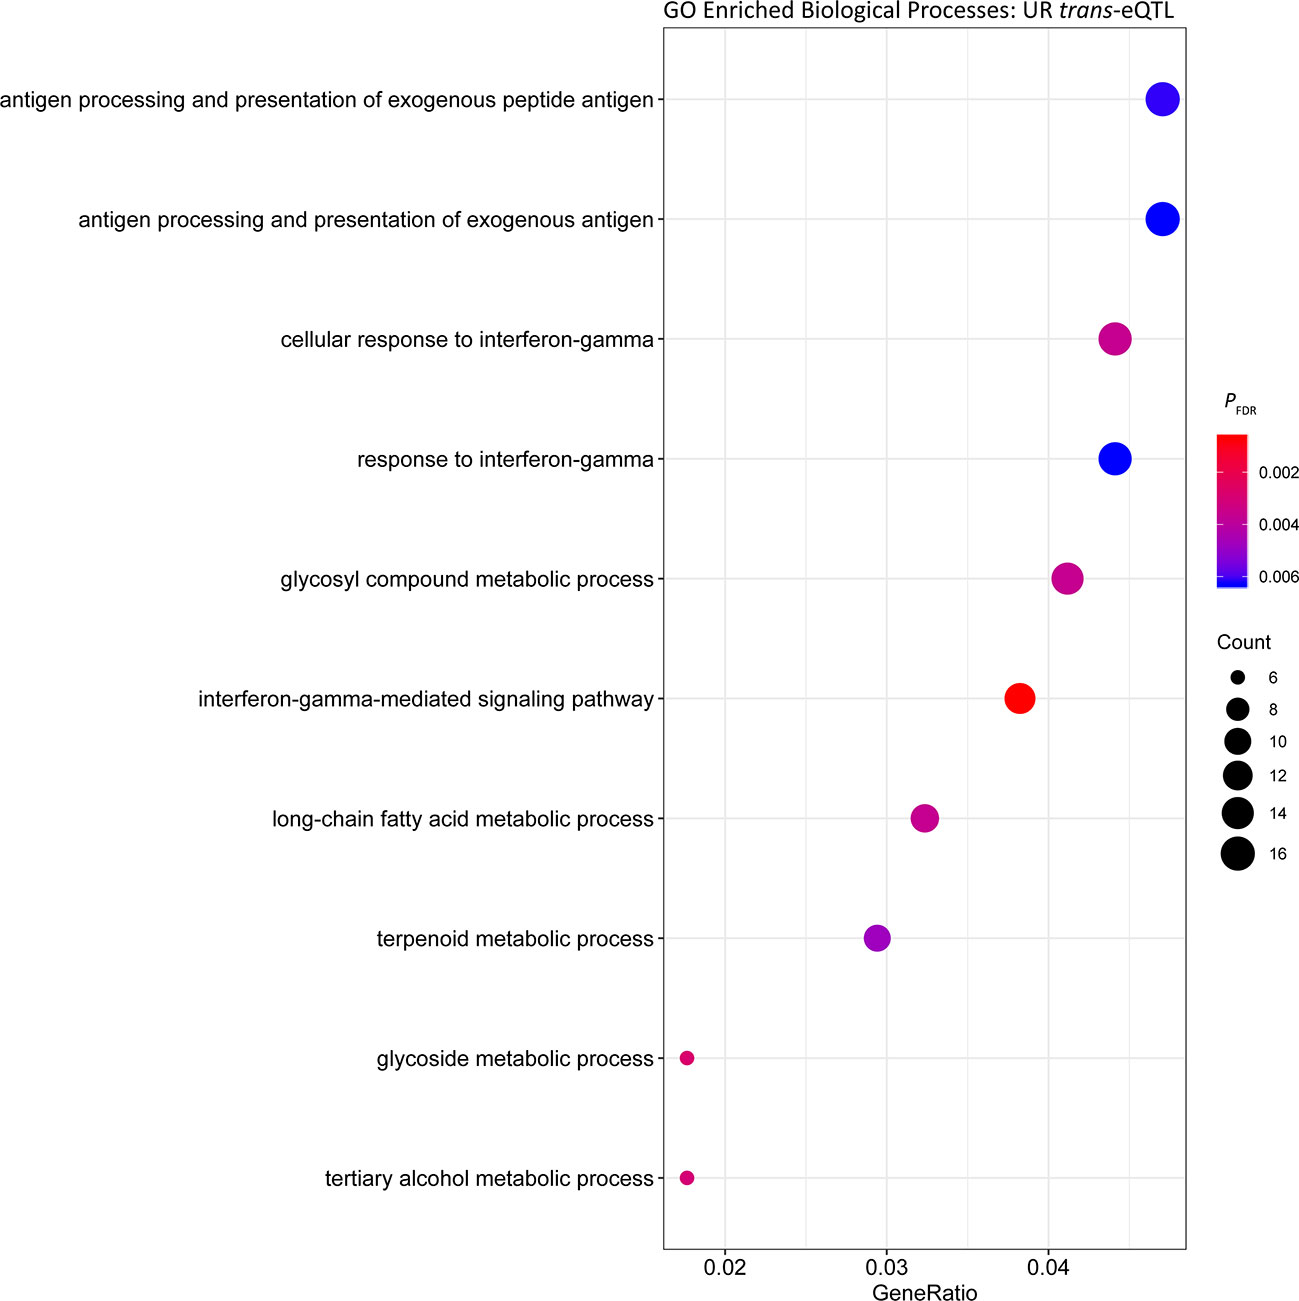
Figure 2 Gene ontology enrichment of biological processes for genes under trans regulation in the untrained resting cohort.
In the UE cohort 4,992 cis-eQTL were associated with the expression of 1,922 genes. The most significant cis-eQTL was BIEC2-707785 on ECA25 and ENTR1 (PFDR = 1.66 × 10⁻²⁴) (Figure S3), as was the case in the UR cohort (Table 3). The strongest trans-eQTL association was between BIEC2-165011 on ECA11 and transcript ENSECAG00000016949 (PFDR = 1.12 × 10⁻¹³) (Table 4). Similar to UR samples, the majority (75.45%; 544) of trans-eQTL were located on the same chromosome and 24.55% (177) were on different chromosomes.
Analysis of the cis regulated genes in UE samples showed that similar to the UR cohort, the most significantly enriched Biological Process was ‘cofactor metabolic process’ (PFDR = 6.40 × 10⁻⁷, Gene Ratio = 112/1,579) (Figure 3, Table S3). Comparable results were obtained for enrichment of Biological Processes among putative trans regulated genes, with ‘cofactor metabolic process’ the most significantly enriched (Figure 4; PFDR = 5.06 × 10⁻⁷, Gene Ratio = 33/235).
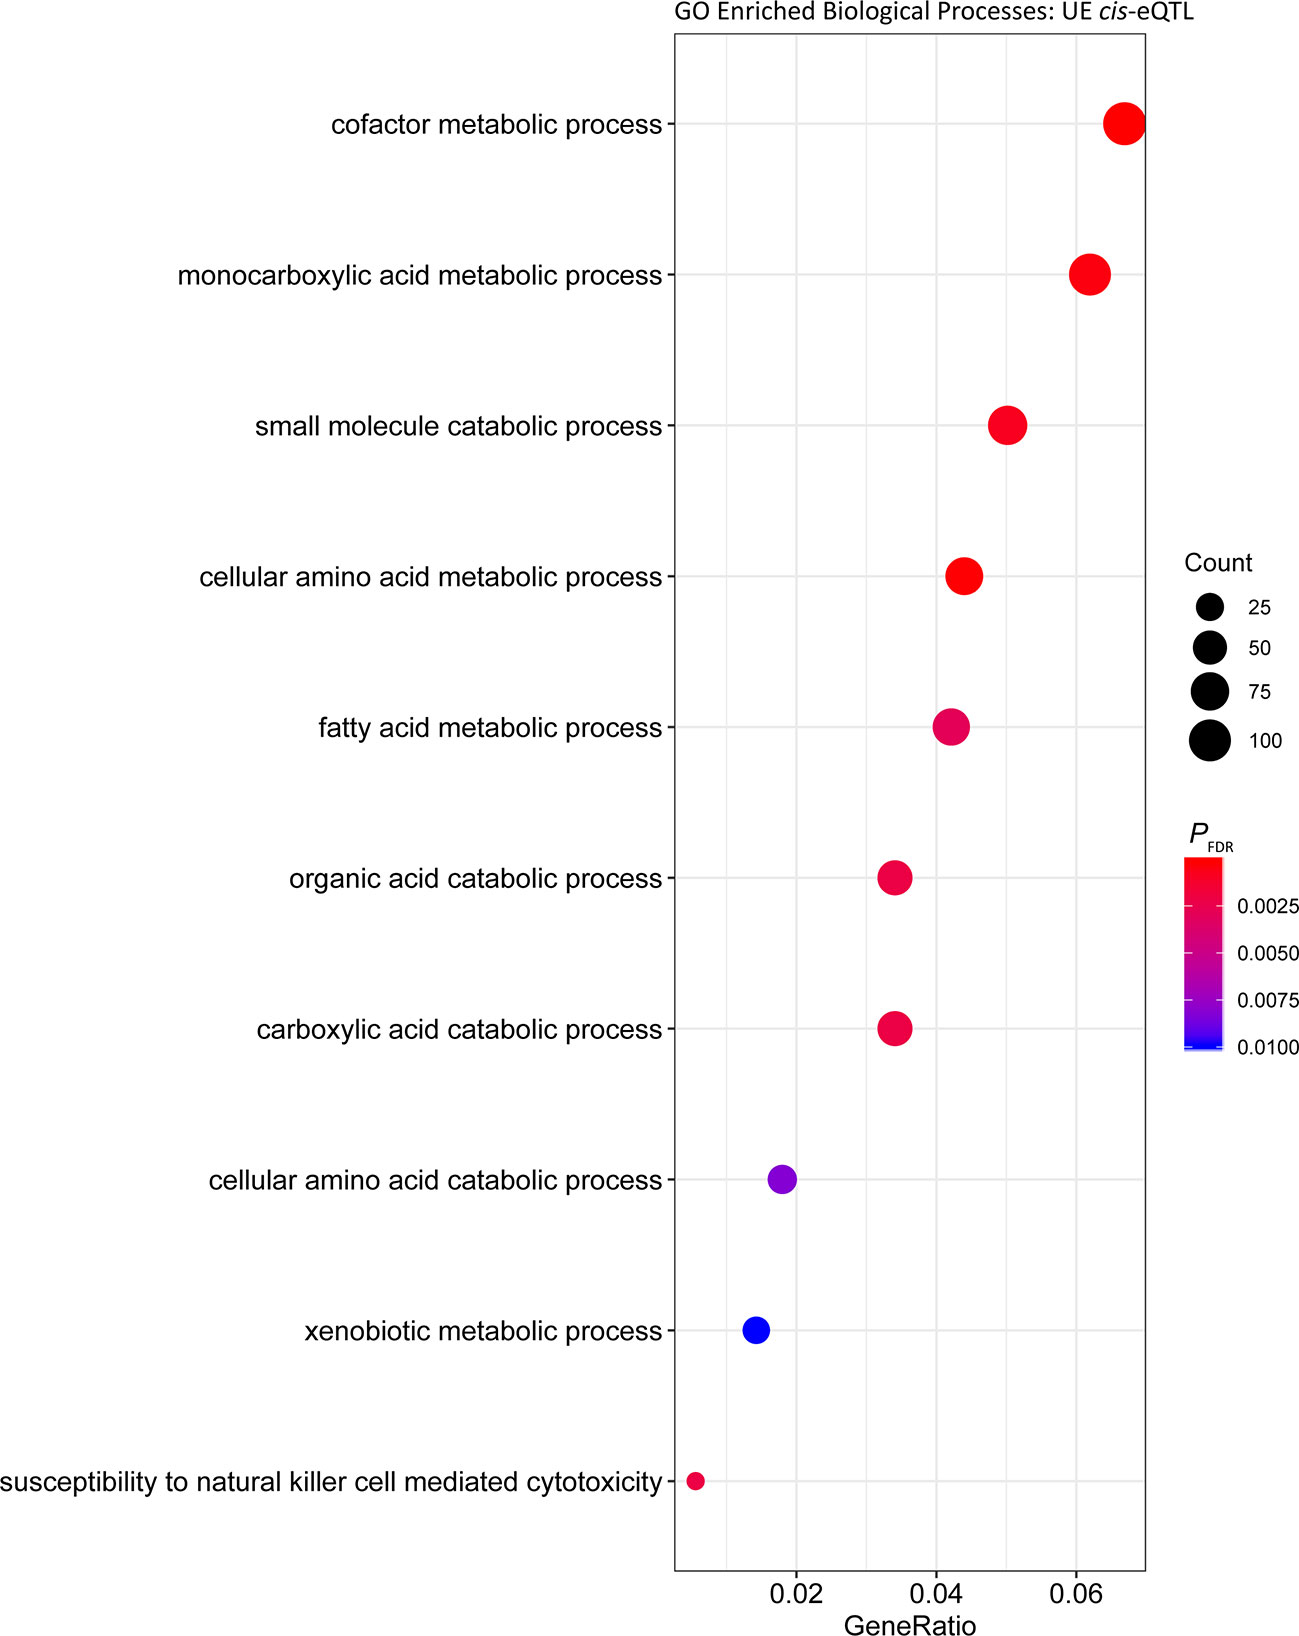
Figure 3 Gene ontology enrichment of biological processes for genes under cis regulation in the post-exercise cohort.
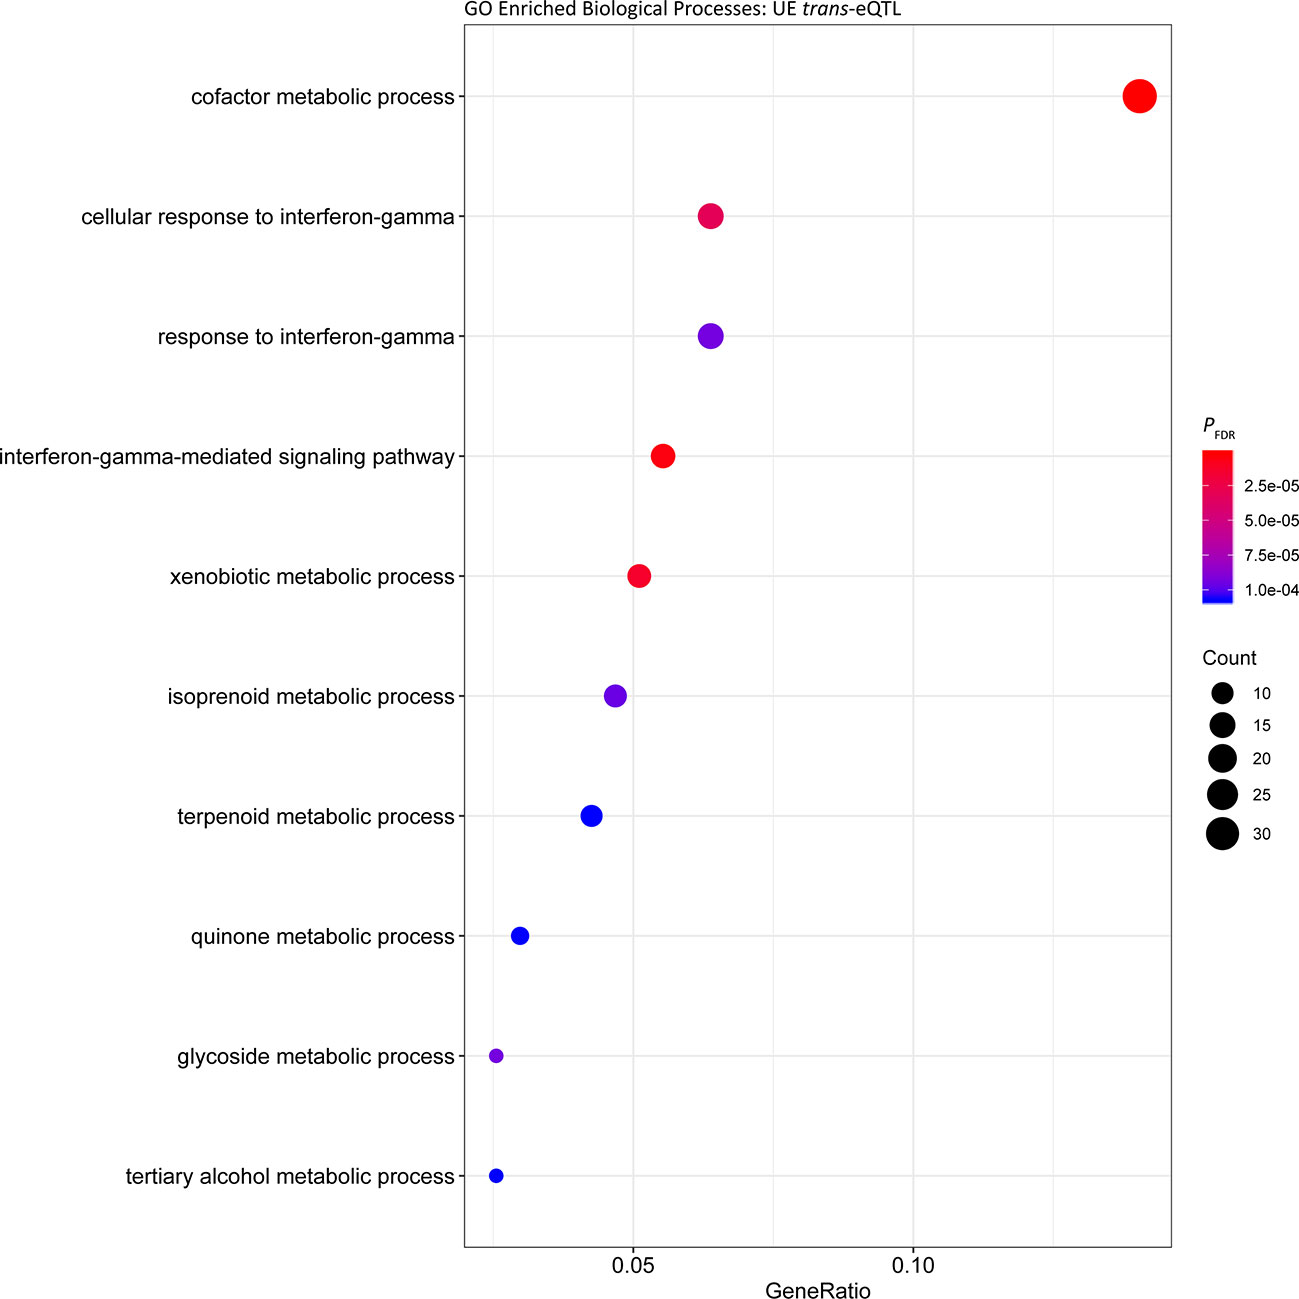
Figure 4 Gene ontology enrichment of biological processes for genes under trans regulation in the post-exercise cohort.
Genetic Regulation of Exercise Relevant Genes
The total set of genes with expression changes associated with eQTLs (i.e. eGenes) were queried against genes that we have reported from the same dataset to be differentially expressed post-exercise in a sample of 39 Thoroughbreds (Bryan et al., 2017). Of the 3,582 UR cis-eQTL, 913 were associated with genes differentially expressed in response to exercise. The most significant association was between BIEC2-285235 and the CCR4-NOT transcription complex subunit 11 gene (CNOT11; PFDR = 3.00 × 10⁻¹⁵) (Table 5). Of the 1,703 UR trans-eQTL, 144 were associated with exercise relevant genes. The most significant trans-eQTL was between BIEC2-1061469 and the TAL bHLH transcription factor 2 gene (TAL2; PFDR = 3.03 × 10⁻¹⁰) (Table 6).
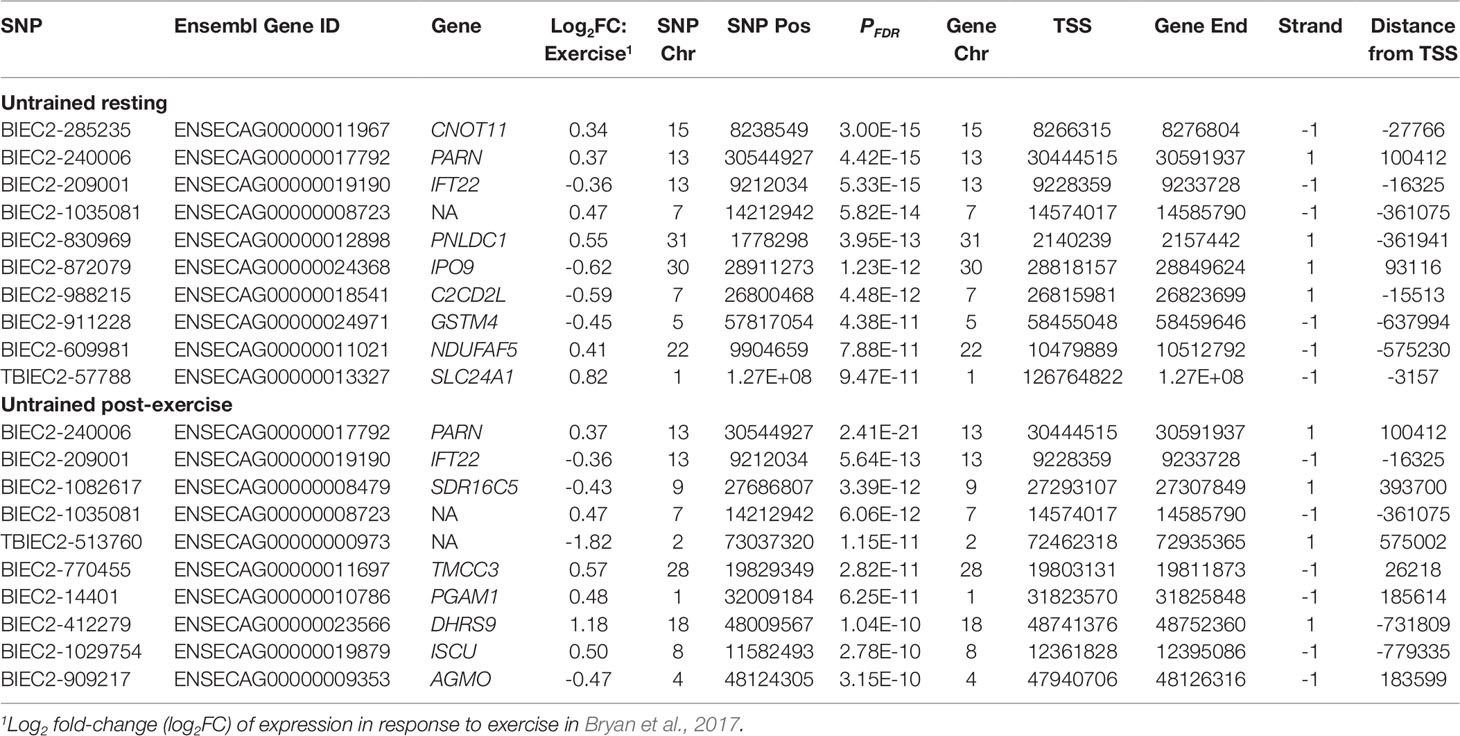
Table 5 top ten cis-eQTL identified in genes differentially expressed in response to exercise.
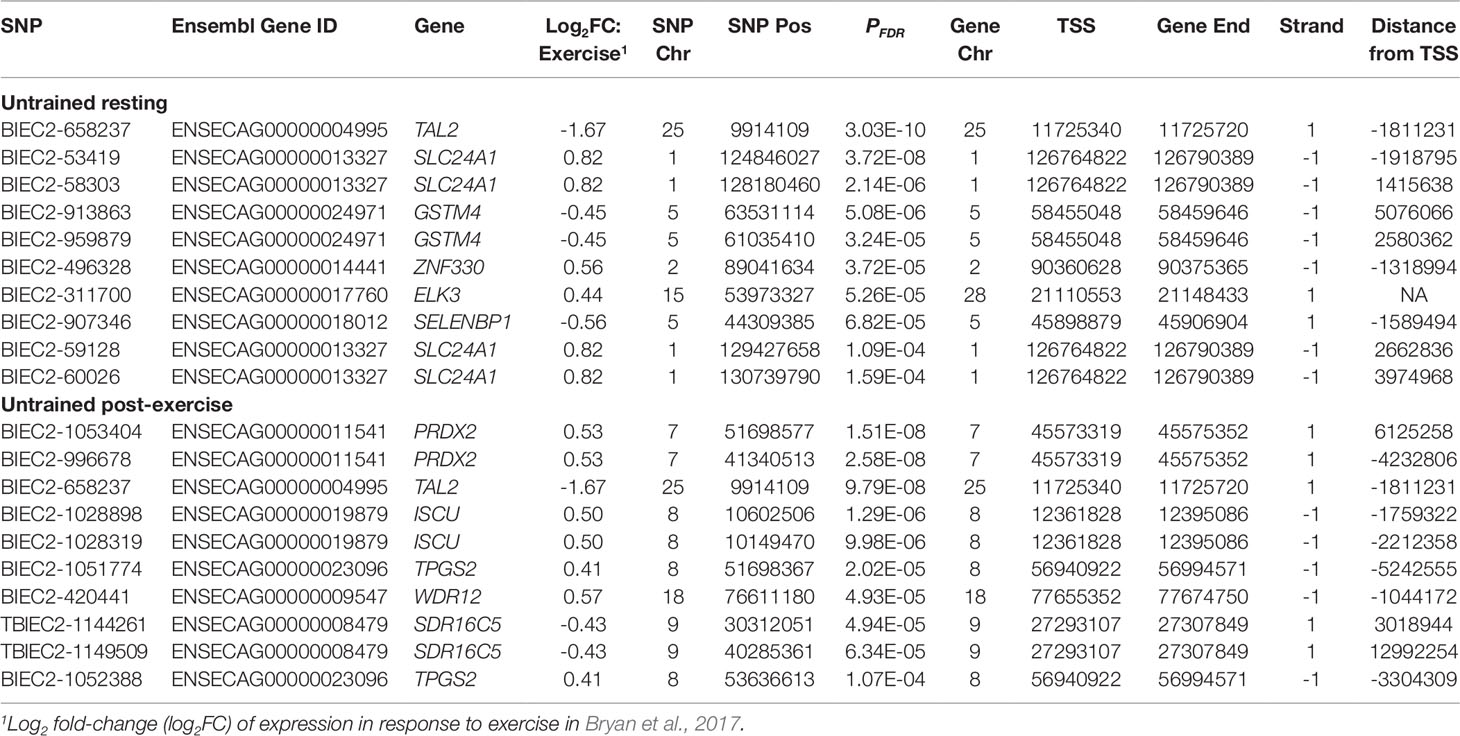
Table 6 top ten trans-eQTL identified in genes differentially expressed in response to exercise.
Within the UE cohort 4,992 cis-eQTL were identified, 1,132 of which were associated with genes differentially expressed post-exercise. The strongest association was between BIEC2-240006 and the polyA-specific ribonuclease gene (PARN; PFDR = 2.41 × 10⁻²¹) (Table 5). Of the UR trans-eQTL, 121 eQTL were associated with eGenes in the transcriptional exercise response. The strongest trans-eQTL in the UE cohort was BIEC2-1053404, associated with expression of the peroxiredoxin 2 gene (PRDX2; PFDR = 1.51 × 10⁻⁸) (Table 6).
Genetic Regulation of Training Relevant Genes
Using 3,405 genes that were differentially expressed in response to training in a sample of 39 Thoroughbreds (Bryan et al, 2017), we examined our results based on eQTL associated with genes within this transcriptional response. Within the UR cohort, 609 of the 3,582 cis-eQTL were associated with training response genes. The strongest association was between BIEC2-1061469 and the spindle and expression of the kinetochore associated complex subunit 1 gene (SKA1; PFDR = 9.80 × 10⁻¹⁸) (Table 7). Of the 1,703 UR trans-eQTL, 145 were associated with training response genes. The most significant association was between BIEC2-658237 and TAL2 (PFDR = 3.03 × 10⁻¹⁰) (Table 8).
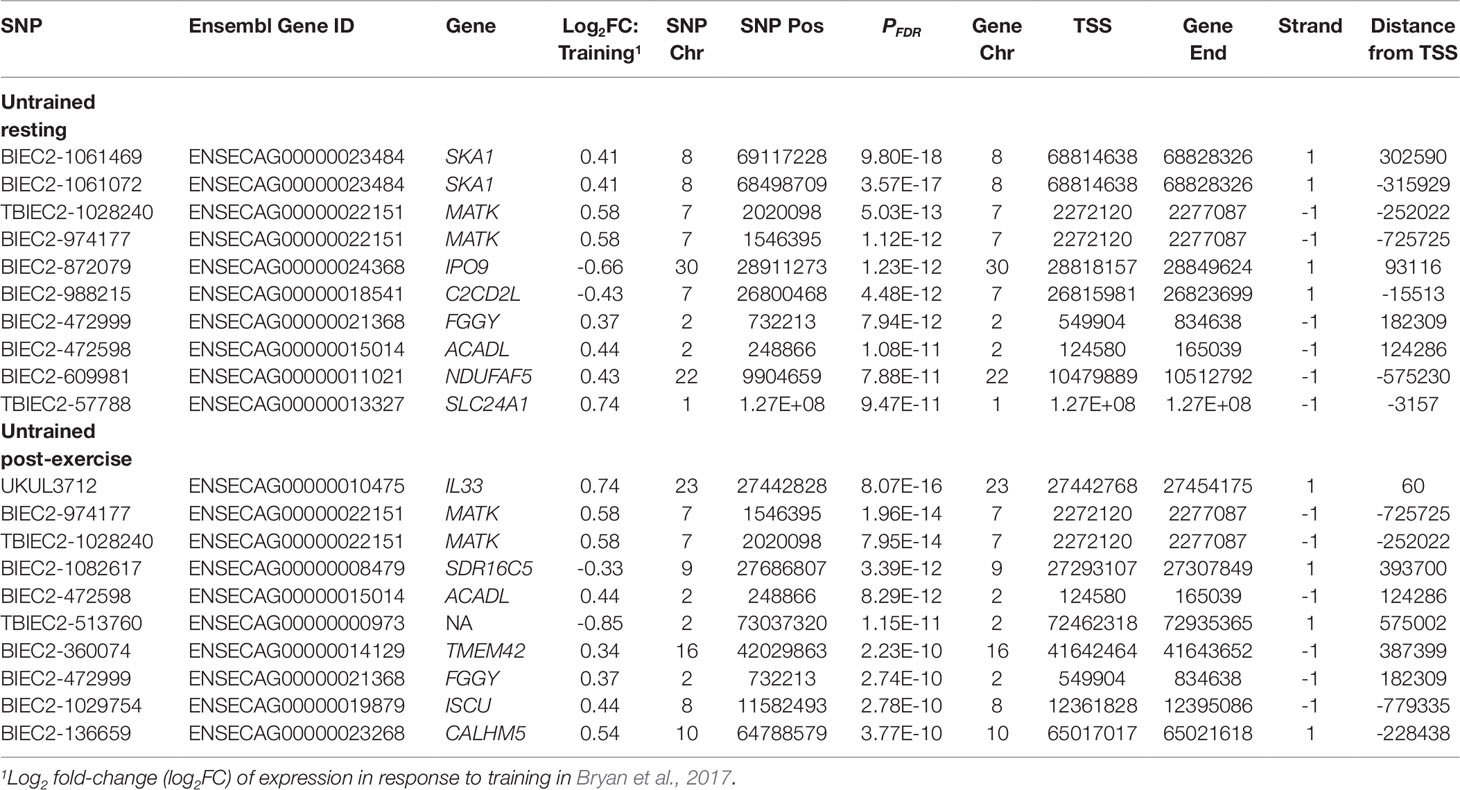
Table 7 top cis-eQTL identified in genes differentially expressed in response to training.
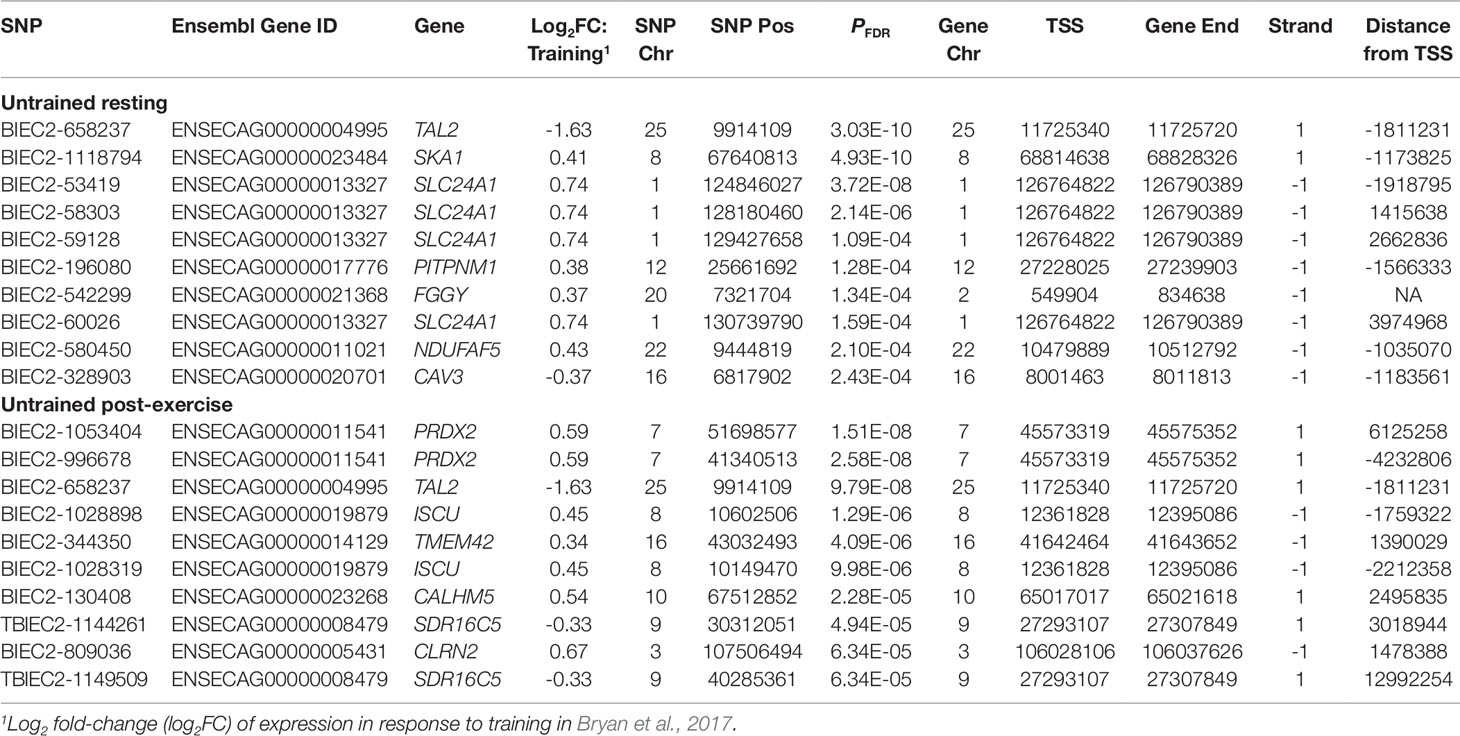
Table 8 top trans-eQTL identified in genes differentially expressed in response to training.
Within the UE cohort 766 of the 4,992 cis-eQTL were associated with training response genes. The most significant cis-eQTL association was between UKUL3712 and the interleukin 33 gene (IL33; PFDR = 8.07 × 10⁻¹⁶) (Table 7). Of the 1,219 UE trans-eQTL 90 were associated with genes relevant to training. As with the exercise relevant genes, the strongest UE trans-eQTL was between BIEC2-1053404 and PRDX2 (PFDR = 1.51 × 10⁻⁸) (Table 8).
Discussion
Using a systems genetics approach we have integrated RNA-seq and genome-wide SNP data for a large cohort of Thoroughbred horses in active race training that were maintained in a single environment. This strategy has allowed us to detect significant cis and trans eQTL in equine skeletal muscle that are likely to be relevant to an exercise phenotype, adaptation to training, an important and valuable trait in the racing Thoroughbred. A total of 4,992 cis-eQTL associated with the expression of 1,922 distinct genes were identified in the UR cohort; and 4,886 cis-eQTL associated with the expression of 1,875 genes were identified in the UE cohort. Fewer trans-eQTL were detected (UR: 1,703; UE: 1,219), which is consistent with previous studies, and likely due to the greater statistical power required to identify trans-eQTL (Westra and Franke, 2014).
The gene with the most significant association with a cis-eQTL in the UR and UE cohorts was ENTR1 (Table 3, UR: PFDR = 3.81 × 10⁻²⁷, UE: PFDR = 1.66 × 10⁻²⁴). The ENTR1 protein is involved in cellular transport of cargo proteins from the endosome to the Golgi apparatus or for degradation in the lysosome (McGough et al., 2014) and has been suggested to play a role in cytokinesis (Hagemann et al., 2013). In a study where ENTR1 protein expression was blocked by RNA interference, there was a decrease in solute carrier family 2 member 1 glucose transporter protein (SLC2A1; previously known as GLUT1) (McGough et al., 2014). When examining whether this was due to increased SLC2A1 degradation, there was no evidence of increased transport of SLC2A1 to the lysosome. It was hypothesised that the decrease in SLC2A1 was mediated through regulation of transcription by ENTR1. SLC2A1 is responsible for approximately 30−40% of the glucose uptake in skeletal muscle, with the remainder transported through GLUT4 (Zisman et al., 2000; Rudich et al., 2003). As opposed to GLUT4 which is primarily expressed in skeletal muscle, SLC2A1 is widely expressed and is highly expressed on erythrocyte membranes (Krook et al., 2004). The control of SLC2A1 by ENTR1 in the context of the equine athlete is intriguing to speculate since SLC2A1 is expressed within equine lamellar tissue, and its expression is increased in hyperinsulinemia, therefore may play a role in the pathophysiology of equine laminitis (Campolo et al., 2016). SLC2A1 is also differentially expressed in response to hypoxia, this has also been shown in equine chondrocytes in vitro after exposure to cobalt chloride (to mimic hypoxia) and in chondrocytes from osteoarthritis cases (Peansukmanee et al., 2009).
The most significant trans association in the UR cohort was between BIEC2-526896 and expression of the DEAH-box helicase 16 gene (DHX16) (Table 4). DHX16 is an RNA helicase and is involved in regulation of translation and pre-mRNA splicing (Gencheva et al., 2010; Putiri and Pelegri, 2011). The gene located closest to BIEC2-526896 is the olfactory receptor family 12 subfamily D member 3 gene (OR12D3) with the TSS located 96.5 kb from the SNP. However, the zinc finger protein 311 gene (ZNF311) also relatively close to BIEC2-526896 (792.5 kb)(Consortium, 2017). ZNF311 has previously been associated with telomere length in heterozygous ataxia-talengiectasia mutated (ATM) gene patients (Renault et al., 2017). As a member of the a krueppel c2h2-type zinc-finger protein family it is likely a transcription factor and has been associated with Biological Processes such as ‘regulation of transcription, DNA templated’ and ‘regulation of transcription by RNA polymerase II’(Consortium, 2017). The trans association between BIEC2-526896 and DHX16 expression may therefore be mediated via the gene regulatory function of ZNF311.
The most significant trans-eQTL in the UE cohort was UKUL2765 and expression of the methylcrotonoyl-CoA carboxylase 2 gene (MCCC2) (Table 4). MCCC2 encodes a subunit of 3-methylcrotonyl-CoA carboxylase (MCC), an enzyme which catabolises leucine (Stadler et al., 2005). Mutations within MCCC2 have been found to result in MCC deficiency, which has varying implications for patients from no symptoms at all to death in early infancy (Fonseca et al., 2016). To date studies have yet to discern mutations which result in more or less severe disease phenotypes (Gallardo et al., 2001; Stadler et al., 2006). In terms of muscle physiology, MCCC2 has been shown to be highly expressed in skeletal muscle of the red seabream fish (Pagrus major), which is likely due to high levels of protein metabolism within skeletal muscle (Abe et al., 2004). The TSS of the jumonji domain containing 4 gene (JMJD4) is located 71 bp from UKUL2765. The JMJD4 protein catalyses the hydroxylation of translation termination factor eRF1 lysine 63, which in turn enables the correct termination of translation and maintenance of translational fidelity (Feng et al., 2014). It is possible that the variation proximal to JMJD4 is influencing expression of JMJD4, in turn altering expression of MCCC2. However, from the data available only one significant cis-eQTL for JMJD4 was detected in the UR cohort and this was BIEC2-277622 located 257.8 kb downstream of the TSS (PFDR = 6.58 × 10⁻⁵). Therefore it is not clear if UKUL2765 is tagging variation influencing JMJD4 expression and mediating its influence on MCCC2 through JMJD4.
Examination of eGenes previously shown to be involved in the skeletal muscle transcriptional response to exercise and training demonstrated that TAL2 exhibited the most significant trans-eQTL in the UR cohort (BIEC2-658237; Table 6) and that this trans-eQTL was also highly significant in the UE cohort (PFDR = 9.80 × 10⁻⁸; Table 4). TAL2 encodes a basic-helix-loop-helix transcription factor (Xia et al., 1991; Langlands et al., 1997). Deletion of TAL2 in mice has been shown to cause severe disruption of the development of the central nervous system, with new-born mice dying shortly post-partum (Bucher et al., 2000). TAL2 has been shown to be vital for the development of gamma-aminobutyric acid (GABA, inhibitory neurotransmitter) signalling neurons in the developing midbrain, showing highly regulated and coordinated expression (Achim et al., 2013). When expression of TAL2 was inhibited, neurons more closely resembled an excitatory glutamatergic phenotype (Achim et al., 2013). In terms of application in racing performance, GABA has previously been used as a calming agent in Thoroughbred racehorses, although it was banned from use in 2012. The GABA type A receptor associated protein like 1 gene (GABARAPL1) was also identified as a key regulator in the skeletal muscle transcriptional response to exercise (Bryan et al., 2017). In addition, we have previously reported functional enrichment of pathways related to neurodegenerative disorders in the transcriptional response to exercise (Bryan et al., 2017). Given the role of TAL2 in GABAergic neuronal fate, this suggests a potential role for TAL2 in the coordination of the response to exercise. These results suggest that the role of genes associated with neuronal differentiation and disease in the context of muscle and exercise warrants further investigation.
To identify common biological functions within genes identified under cis or trans regulation, enrichment analysis of Biological Processes among the gene sets was performed. Among the cis eGenes detected in both the UR and UE cohort, as well as trans eGenes in the UR cohort there was significant enrichment of cofactor metabolic processes (GO:0051186, Tables S1, S3, and S4). Cofactor metabolic process is defined as chemical reactions and pathways requiring the activity of an inorganic cofactor, such as an ion, or an organic coenzyme for the activity of an enzyme or other functional protein. Genes within this cluster were related to metabolism and substrate utilisation, including vitamin and mineral binding and synthesis such as: selenium (selenium binding protein 1 gene, SELENBP1; and selenoprotein T gene, SELENOT), molybdenum (molybdenum cofactor sulfurase gene, MOCOS) and thiamine (thiamine triphosphatase gene, THTPA). Consequently, variation in the expression of genes associated with nutrient binding may lead to variation in the ability of horses to utilise such nutrients. In this regard, abundance of selenoprotein gene transcripts has been used to identify dietary requirements for selenium in rats and turkeys (Barnes et al., 2009; Taylor and Sunde, 2017). Given the inter-animal variation in expression observed for genes relevant to substrate binding, it may be possible to use this information to evaluate nutrient requirements for individual horses, or whether expression of these genes can be modulated through diet.
Many of these genes have also been shown to have functions relevant to exercise, and variation within the expression of these genes may underpin variation in athletic performance. For example, the selenium binding protein 1 gene (SELENBP1) is significantly downregulated in response to exercise (log2FC = −0.56; PFDR = 3.71 × 10⁻¹¹) (Bryan et al., 2017). In both normal and cancerous human cells SELENBP1 has been shown to be highly variable in expression (Yang and Sytkowski, 1998). Functionally, the SELENBP1 protein has been shown to be involved in many cellular processes including detoxification (Ishii et al., 1996), cytoskeletal outgrowth (Miyaguchi, 2004) and regulation of reduction and oxidation within the cell (Jamba et al., 1997). SELENBP1 was found be differentially expressed in blood in response to administration of human recombinant erythropoietin in human endurance athletes (Durussel et al., 2016; Wang et al., 2017), suggesting a potential role in haematopoiesis and its regulation. In the UE cohort; the DDB1 and CUL4 associated factor 12 (DCAF12) and guanosine monophosphate reductase (GMPR) genes both exhibited significant cis-eQTL (DCAF12: PFDR = 0.02; GMPR: PFDR = 4.17 × 10⁻³). These genes, in addition to SELENBP1, were also shown by Wang et al. (2017) to be differentially expressed in blood in response to human recombinant erythropoietin. Variation in the expression of these genes may therefore potentially underpin variation in haematological phenotypes in horses, which may in turn influence traits relevant to aerobic capacity. It is also noteworthy that selenium deficiency has been associated with significant myopathy (White muscle disease) (Lofstedt, 1997; Delesalle et al., 2017) and reduced exercise tolerance in horses (Brady et al., 1978; Avellini et al., 1999). In addition, selenoproteins have been shown to be involved in several metabolic pathways and the response to oxidative stress in muscle (Rederstorff et al., 2006). These findings suggest an important role for selenium, and its associated biochemical machinery, in the correct functioning of skeletal muscle and muscle metabolism. This highlights the importance of selenium in the context of exercise and provides a potential role for variation in expression of genes relevant to selenium metabolism in determining metabolic function within the muscle.
The cofactor metabolic process cluster also contained genes relevant to mitochondrial function and oxidative phosphorylation. These included genes within the coenzyme Q synthesis pathway: coenzyme Q3 hydroxylase (COQ3), coenzyme Q7 (COQ7) and coenzyme Q8A (COQ8A). The coenzyme Q complex is a critical component of the electron transport chain during oxidative phosphorylation, moving electrons from complexes I and II to complex III (Lenaz, 1985; Turunen et al., 2004; Stefely and Pagliarini, 2017). COQ7 and COQ8A are required for coenzyme Q biosynthesis (Mollet et al., 2008; Stefely et al., 2016). Human patients with COQ8A mutations suffered seizures and other neurological symptoms and showed reduced coenzyme Q within skeletal muscle (Jacobsen et al.; Mollet et al., 2008). An eQTL for COQ8A in skeletal muscle has already been identified in horses, with a 227 bp SINE insertion in the promotor region of MSTN (g.66495326_66495327ins227) on ECA18 associated with increased expression of COQ8A (previously known as ADCK3) in Thoroughbreds (Rooney et al., 2017). However it should be noted that this increase in COQ8A expression did not appear to accompany an COQ8A protein abundance, with no difference in COQ8A protein abundance across genotypes (Rooney et al., 2017). This may be due to COQ8A having a regulatory role in coenzyme Q biosynthesis (Acosta et al., 2016). Electron transport chain complex activity assays, as well as assays using the exogenous application of ubiquinone, suggested a difference in the abundance of coenzyme Q across genotypes at this locus (Rooney et al., 2017). Suggesting variation at this SINE insertion is associated with COQ8A expression as well as coenzyme Q abundance. Therefore eQTL in the current study associated with COQ8A(Figure S4), and indeed other genes within the coenzyme Q biosynthetic pathway, may result in variation in synthesis of the coenzyme Q complex and have downstream implications for mitochondrial function.
We have for the first time systematically catalogued eQTL in equine skeletal muscle, both at rest and post-exercise. Previous investigations of eQTL in skeletal muscle have focussed primarily on human T2D (Sharma et al., 2011; Keildson et al., 2014a; Sajuthi et al., 2016; Langefeld et al., 2018) and meat quality traits in production animals (Ponsuksili et al., 2015; Gonzalez-Prendes et al., 2017; Pampouille et al., 2018; Gonzalez-Prendes et al., 2019; Velez-Irizarry et al., 2019). Our investigation of eQTL in the context of skeletal muscle and exercise present some of the only work to-date in this area (Kelly et al., 2014). Our work utilised linear models to detect associations between SNPs and gene expression as quantified by RNA-seq. It should be noted at this point that there are potential biases introduced in terms of the high number of related individuals within the cohort, future work could utilise more sophisticated techniques such as allele specific expression, where transcripts are mapped back to the maternal and paternal chromosomes and the expression of the maternal and paternal transcripts can be compared (Chamberlain et al., 2015). This would be particularly useful in our cohort given the high number of offspring by a small number of sires. Within the cohort there is also some variation in the amount of training prior to sampling, this was kept to a minimum by our sampling criteria. However, extending the study to incorporate trained horses and utilise variation in prior training by modelling the transcriptional training response could provide information on regulation of the training responsive transcriptome.
Our current results provide novel information concerning the regulation of gene expression in horses and can provide a framework for interpreting future GWAS of athletic and performance traits in Thoroughbreds. In terms of future applications of these results, the identification of quantitative trait transcripts (QTT) for athletic traits characterised in our cohort could be used to detect associations between a SNP, variation in expression of a QTT and a trait of interest. Thus giving a fuller picture of genetic variation contributing to traits of interest. An example may be detecting loci and QTT involved in the response to exercise and training, which has previously been shown to be highly heritable in humans (Timmons et al., 2010; Bouchard et al., 2011). The use of systems genetics approaches that integrate differential gene expression with genome variation represent an excellent strategy for dissecting the genetic architecture of complex anatomical and physiological traits.
Data Availability Statement
The RNA-seq datasets analyzed for this study can be found in EBI ArrayExpress https://www.ebi.ac.uk/arrayexpress/experiments/E-MTAB-5447/. SNP datasets will not be made publicly available as the data were generated from privately owned horses, with a legal commitment to confidentiality. Researchers may request access to the data and consideration will be given to individuals following the conclusion of a confidentiality agreement. Requests should be made to the UCD Technology Transfer Office (https://www.ucd.ie/innovation/knowledge-transfer/).
Ethics Statement
University College Dublin Animal Research Ethics Committee approval (AREC-P-12-55-Hill), a licence from the Department of Health (B100/3525) and informed owner consent were obtained.
Author Contributions
GF performed computations and functional analyses. KB and PM assisted in analysis and pipeline development. CM, KG and GF performed biopsy sample collections. JB and GF prepared RNA. GF wrote the manuscript in close consultation with EH, LK and DM. All authors were involved in study design, implementation of the research and preparation of the manuscript.
Funding
This research was funded by Science Foundation Ireland (SFI/11/PI/1166 and 18/TIDA/6019).
Conflict of Interest
EH was employed by Plusvital Ltd. Plusvital Ltd had no role, financial or otherwise, in the research.EH, DM and LK are named inventors on multiple international patents relating to the application of variation in the prediction of race distance performance; none of which is relevant to the data/results reported in this manuscript.
The remaining authors declare that the research was conducted in the absence of any commercial or financial relationships that could be construed as a potential conflict of interest.
Acknowledgments
We would like to thank J.S. Bolger for access to his horses, and staff at Glebe House stables for their assistance, particularly B. O’Connor and P. O’Donovan. This research was conducted with the financial support of Science Foundation Ireland (grant no. SFI/11/PI/1166 and 18/TIDA/6019).
Supplementary Material
The Supplementary Material for this article can be found online at: https://www.frontiersin.org/articles/10.3389/fgene.2019.01215/full#supplementary-material
Figure S1 | Principal component analysis of quantile-normalised log counts of RNA-seq transcripts and coloured by sample type: untrained resting or untrained post-exercise.
Figure S2 | Boxplot of ENTR1 expression (log2 quantile-normalised counts) across BIEC2-707785 genotypes in untrained resting samples.
Figure S3 | Boxplot of ENTR1 expression (log2 quantile-normalised counts) across BIEC2-707785 genotypes in untrained post-exercise samples.
Figure S4 | Boxplot of COQ8A expression (log2 quantile-normalised counts) across BIEC2-417075 genotypes in untrained post-exercise samples.
References
Abe, S., Chamnan, C., Miyamoto, K., Minamino, Y., Nouda, M. (2004).Isolation and identification of 3-methylcrotonyl coenzyme A carboxylase cDNAs and pyruvate carboxylase, and their expression in red seabream (Pagrus major) organs. Mar. Biotechnol. (N. Y.) 6 (6), 527–540. doi: 10.1007/s10126-004-4203-x
Achim, K., Peltopuro, P., Lahti, L., Tsai, H. H., Zachariah, A., Astrand, M., et al. (2013). The role of Tal2 and Tal1 in the differentiation of midbrain GABAergic neuron precursors. Biol. Open 2 (10), 990–997. doi: 10.1242/bio.20135041
Acosta, M. J., Vazquez Fonseca, L., Desbats, M. A., Cerqua, C., Zordan, R., Trevisson, E., et al. (2016). Coenzyme Q biosynthesis in health and disease. Biochim. Biophys. Acta (BBA) - Bioenerg. 1857 (8), 1079–1085. doi: 10.1016/j.bbabio.2016.03.036
Arany, Z. (2008). PGC-1 coactivators and skeletal muscle adaptations in health and disease. Curr. Opin. Genet. Dev. 18 (5), 426–434. doi: 10.1016/j.gde.2008.07.018
Ashburner, M., Ball, C. A., Blake, J. A., Botstein, D., Butler, H., Cherry, J. M., et al. (2000). Gene Ontology: tool for the unification of biology. Nat. Genet. 25 (1), 25–29. doi: 10.1038/75556
Avellini, L., Chiaradia, E., Gaiti, A. (1999). Effect of exercise training, selenium and vitamin E on some free radical scavengers in horses (Equus caballus). Comp. Biochem. Physiol. B Biochem. Mol. Biol. 123 (2), 147–154. doi: 10.1016/s0305-0491(99)00045-0
Barnes, K. M., Evenson, J. K., Raines, A. M., Sunde, R. A. (2009). Transcript analysis of the selenoproteome indicates that dietary selenium requirements of rats based on selenium-regulated selenoprotein mRNA levels are uniformly less than those based on glutathione peroxidase activity. J. Nutr. 139 (2), 199–206. doi: 10.3945/jn.108.098624
Benjamini, Y., Hochberg, Y. (1995). Controlling the false discovery rate: a practical and powerful approach to multiple testing. J. R. Stat. Soc. Ser. B (Methodological) 57 (1), 289–300. doi: 10.2307/2346101
Bolstad, B. (2017). PreprocessCore: a collection of pre-processing functions in R package version, (https://github.com/bmbolstad/preprocessCore).
Bouchard, C., Sarzynski, M. A., Rice, T. K., Kraus, W. E., Church, T. S., Sung, Y. J., et al. (2011). Genomic predictors of the maximal O-2 uptake response to standardized exercise training programs. J. Appl. Physiol. 110 (5), 1160–1170. doi: 10.1152/japplphysiol.00973.2010
Brady, P. S., Ku, P. K., Ullrey, D. E. (1978). Lack of effect of selenium supplementation on the response of the equine erythrocyte glutathione system and plasma enzymes to exercise. J. Anim. Sci. 47 (2), 492–496. doi: 10.2527/jas1978.472492x
Brown, C. D., Mangravite, L. M., Engelhardt, B. E. (2013). Integrative modeling of eQTLs and cis-regulatory elements suggests mechanisms underlying cell type specificity of eQTLs. PloS Genet. 9 (8), e1003649. doi: 10.1371/journal.pgen.1003649
Bryan, K., McGivney, B. A., Farries, G., McGettigan, P. A., McGivney, C. L., Gough, K. F., et al. (2017). Equine skeletal muscle adaptations to exercise and training: evidence of differential regulation of autophagosomal and mitochondrial components. BMC Genomics 18 (1), 595. doi: 10.1186/s12864-017-4007-9
Bucher, K., Sofroniew, M. V., Pannell, R., Impey, H., Smith, A. J., Torres, E. M., et al. (2000). The T cell oncogene Tal2 is necessary for normal development of the mouse brain. Dev. Biol. 227 (2), 533–544. doi: 10.1006/dbio.2000.9920
Campolo, A., de Laat, M. A., Keith, L., Gruntmeir, K. J., Lacombe, V. A. (2016).Prolonged hyperinsulinemia affects metabolic signal transduction markers in a tissue specific manner. Domest. Anim. Endocrinol. 55, 41–45. doi: 10.1016/j.domaniend.2015.11.001
Chamberlain, A. J., Vander Jagt, C. J., Hayes, B. J., Khansefid, M., Marett, L. C., Millen, C. A., et al. (2015). Extensive variation between tissues in allele specific expression in an outbred mammal. BMC Genomics 16, 993. doi: 10.1186/s12864-015-2174-0
Chang, C. C., Chow, C. C., Tellier, L. C., Vattikuti, S., Purcell, S. M., Lee, J. J. (2015). Second-generation PLINK: rising to the challenge of larger and richer datasets. Gigascience 4, 7. doi: 10.1186/s13742-015-0047-8
Consortium, U. (2017). UniProt: the universal protein knowledgebase. Nucleic Acids Res. 45 (D1), D158–d169. doi: 10.1093/nar/gkw1099
Corbin, L. J., Kranis, A., Blott, S. C., Swinburne, J. E., Vaudin, M., Bishop, S. C., et al. (2014). The utility of low-density genotyping for imputation in the Thoroughbred horse. Genet. Sel. Evol. 46, 9. doi: 10.1186/1297-9686-46-9
Delesalle, C., de Bruijn, M., Wilmink, S., Vandendriessche, H., Mol, G., Boshuizen, B., et al. (2017). White muscle disease in foals: focus on selenium soil content. A case series. BMC Vet. Res. 13 (1), 121–121. doi: 10.1186/s12917-017-1040-5
Dobin, A., Davis, C. A., Schlesinger, F., Drenkow, J., Zaleski, C., Jha, S., et al. (2013). STAR: ultrafast universal RNA-seq aligner. Bioinformatics 29 (1), 15–21. doi: 10.1093/bioinformatics/bts635
Durinck, S., Spellman, P. T., Birney, E., Huber, W. (2009). Mapping identifiers for the integration of genomic datasets with the R/Bioconductor package biomaRt. Nat. Protoc. 4 (8), 1184–1191. doi: 10.1038/nprot.2009.97
Durussel, J., Haile, D. W., Mooses, K., Daskalaki, E., Beattie, W., Mooses, M., et al. (2016). Blood transcriptional signature of recombinant human erythropoietin administration and implications for antidoping strategies. Physiol. Genomics 48 (3), 202–209. doi: 10.1152/physiolgenomics.00108.2015
Eivers, S. S., McGivney, B. A., Fonseca, R. G., MacHugh, D. E., Menson, K., Park, S. D., et al. (2010). Alterations in oxidative gene expression in equine skeletal muscle following exercise and training. Physiol. Genomics 40 (2), 83–93. doi: 10.1152/physiolgenomics.00041.2009
Eivers, S. S., McGivney, B. A., Gu, J., MacHugh, D. E., Katz, L. M., Hill, E. W. (2012). PGC-1 alpha encoded by the PPARGC1A gene regulates oxidative energy metabolism in equine skeletal muscle during exercise. Anim. Genet. 43 (2), 153–162. doi: 10.1111/j.1365-2052.2011.02238.x
Farries, G., Gough, K. F., Parnell, A. C., McGivney, B. A., McGivney, C. L., McGettigan, P. A., et al. (2019). Analysis of genetic variation contributing to measured speed in Thoroughbreds identifies genomic regions involved in the transcriptional response to exercise. Anim. Genet. 50, 670–685. doi: 10.1111/age.12848
Feng, T., Yamamoto, A., Wilkins, S. E., Sokolova, E., Yates, L. A., Munzel, M., et al. (2014). Optimal translational termination requires C4 lysyl hydroxylation of eRF1. Mol. Cell 53 (4), 645–654. doi: 10.1016/j.molcel.2013.12.028
Fonseca, H., Azevedo, L., Serrano, C., Sousa, C., Marcao, A., Vilarinho, L. (2016). 3-Methylcrotonyl-CoA carboxylase deficiency: Mutational spectrum derived from comprehensive newborn screening. Gene 594 (2), 203–210. doi: 10.1016/j.gene.2016.09.003
Gallardo, M. E., Desviat, L. R., Rodríguez, J. M., Esparza-Gordillo, J., Pérez-Cerdá, C., Pérez, B., et al. (2001). The molecular basis of 3-methylcrotonylglycinuria, a disorder of leucine catabolism. Am. J. Hum. Genet. 68 (2), 334–346. doi: 10.1086/318202
Gencheva, M., Lin, T. Y., Wu, X., Yang, L., Richard, C., Jones, M., et al. (2010).Nuclear retention of unspliced pre-mRNAs by mutant DHX16/hPRP2, a spliceosomal DEAH-box protein. J. Biol. Chem. 285 (46), 35624–35632. doi: 10.1074/jbc.M110.122309
Gonzalez-Prendes, R., Quintanilla, R., Amills, M. (2017). Investigating the genetic regulation of the expression of 63 lipid metabolism genes in the pig skeletal muscle. Anim. Genet. 48 (5), 606–610. doi: 10.1111/age.12586
Gonzalez-Prendes, R., Marmol-Sanchez, E., Quintanilla, R., Castello, A., Zidi, A., Ramayo-Caldas, Y. (2019). About the existence of common determinants of gene expression in the porcine liver and skeletal muscle. BMC Genomics 20 (1), 518. doi: 10.1186/s12864-019-5889-5
Gunn, H. M. (1987). Muscle, bone and fat proportions and muscle distribution of thoroughbreds and other horses in Equine exercise physiology 2: Proceedings of the second international conference on equine exercise physiology. Eds.Gillespie, J. R., Robinson, N. E. (San Diego, California), 253–264. August 7-11, 1986.
Hagemann, N., Ackermann, N., Christmann, J., Brier, S., Yu, F., Erdmann, K. S. (2013). The serologically defined colon cancer antigen-3 interacts with the protein tyrosine phosphatase PTPN13 and is involved in the regulation of cytokinesis. Oncogene 32 (39), 4602–4613. doi: 10.1038/onc.2012.485
Hindorff, L. A., Sethupathy, P., Junkins, H. A., Ramos, E. M., Mehta, J. P., Collins, F. S., et al. (2009). Potential etiologic and functional implications of genome-wide association loci for human diseases and traits. Proc. Natl. Acad. Sci. U.S.A. 106 (23), 9362–9367. doi: 10.1073/pnas.0903103106
Ishii, Y., Hatsumura, M., Ishida, T., Ariyoshi, N., Oguri, K. (1996). Significant induction of a 54-kDa protein in rat liver with homologous alignment to mouse selenium binding protein by a coplanar polychlorinated biphenyl, 3,4,5,3’,4’-pentachlorobiphenyl and 3-methylcholanthrene. Toxicol. Lett. 87 (1), 1–9. doi: 10.1016/0378-4274(96)03668-5
Jacobsen, J. C., Whitford, W., Swan, B., Taylor, J., Love, D. R., Hill, R., et al. Compound Heterozygous Inheritance of Mutations in Coenzyme Q8A Results in Autosomal Recessive Cerebellar Ataxia and Coenzyme Q10 Deficiency in a Female Sib-Pair. Berlin, Heidelberg:Springer Berlin Heidelberg, 1–6. doi: 10.1007/8904_2017_73
Jamba, L., Nehru, B., Bansal, M. P. (1997). Redox modulation of selenium binding proteins by cadmium exposures in mice. Mol. Cell Biochem. 177 (1-2), 169–175. doi: 10.1023/a:1006869623864
Jansen, R. C., Nap, J. P. (2001). Genetical genomics: the added value from segregation. Trends Genet. 17 (7), 388–391. doi: 10.1016/s0168-9525(01)02310-1
Kasprzyk, A. (2011). BioMart: driving a paradigm change in biological data management. Database 2011, bar049. doi: 10.1093/database/bar049
Kayar, S. R., Hoppeler, H., Lindstedt, S. L., Claassen, H., Jones, J. H., Essengustavsson, B., et al. (1989). Total muscle mitochondrial volume in relation to aerobic capacity of horses and steers. Pflugers Archiv-European J. Physiol. 413 (4), 343–347. doi: 10.1007/bf00584481
Kearns, C. F., McKeever, K. H., Abe, T. (2002). Overview of horse body composition and muscle architecture: Implications for performance. Vet. J. 164 (3), 224–234. doi: 10.1053/tvjl.2001.0702
Keildson, S., Fadista, J., Ladenvall, C., Hedman, A. K., Elgzyri, T., Small, K. S., et al. (2014a). Expression of phosphofructokinase in skeletal muscle is influenced by genetic variation and associated with insulin sensitivity. Diabetes 63 (3), 1154–1165. doi: 10.2337/db13-1301
Keildson, S., Fadista, J., Ladenvall, C., Hedman, A. K., Elgzyri, T., Small, K. S., et al. (2014b). Expression of phosphofructokinase in skeletal muscle is influenced by genetic variation and associated with insulin sensitivity. Diabetes 63 (3), 1154–1165.
Kelly, S. A., Nehrenberg, D. L., Hua, K., Garland, T., Jr., Pomp, D. (2014).Quantitative genomics of voluntary exercise in mice: transcriptional analysis and mapping of expression QTL in muscle. Physiol. Genomics 46 (16), 593–601. doi: 10.1152/physiolgenomics.00023.2014
Kraniou, G. N., Cameron-Smith, D., Hargreaves, M. (2006). Acute exercise and GLUT4 expression in human skeletal muscle: influence of exercise intensity. J. Appl. Physiol. (1985) 101 (3), 934–937. doi: 10.1152/japplphysiol.01489.2005
Krook, A., Wallberg-Henriksson, H., Zierath, J. R. (2004). Sending the signal: molecular mechanisms regulating glucose uptake. Med. Sci. Sports Exerc. 36 (7), 1212–1217. doi: 10.1249/01.mss.0000132387.25853.3b
Langefeld, C. D., Comeau, M. E., Sharma, N. K., Bowden, D. W., Freedman, B. I., Das, S. K. (2018). Transcriptional regulatory mechanisms in adipose and muscle tissue associated with composite glucometabolic phenotypes. Obesity (Silver Spring) 26 (3), 559–569. doi: 10.1002/oby.22113
Langlands, K., Yin, X., Anand, G., Prochownik, E. V. (1997). Differential interactions of Id proteins with basic-helix-loop-helix transcription factors. J. Biol. Chem. 272 (32), 19785–19793. doi: 10.1074/jbc.272.32.19785
Lenaz, G. ed. (1985). Coenzyme Q: Biochemistry, Bioenergetics, and Clinical Applications of Ubiquinone. John Wiley and Sons Incorporated.
Levine, M. (1999). The origins of horse husbandry on the eurasian steppe in Late prehistoric exploitation of the eurasian steppe. Eds. Levine, M., Rassamakin, Y., Kislenko, A., Tatarintseva, N. (Cambridge:McDonald Institute for Archaeological Research), 5–58.
Liao, Y., Smyth, G. K., Shi, W. (2014). featureCounts: an efficient general purpose program for assigning sequence reads to genomic features. Bioinformatics 30 (7), 923–930. doi: 10.1093/bioinformatics/btt656
Lofstedt, J. (1997).White muscle disease of foals. Vet. Clin. North Am. Equine Pract. 13 (1), 169–185. doi: 10.1016/s0749-0739(17)30262-6
Lonsdale, J., Thomas, J., Salvatore, M., Phillips, R., Lo, E., Shad, S., et al. (2013). The Genotype-Tissue Expression (GTEx) project. Nat. Genet. 45 (6), 580–585. doi: 10.1038/ng.2653
Mason, C. C., Hanson, R. L., Ossowski, V., Bian, L., Baier, L. J., Krakoff, J., et al. (2011). Bimodal distribution of RNA expression levels in human skeletal muscle tissue. BMC Genomics 12. doi: 10.1186/1471-2164-12-98
McGivney, B. A., Eivers, S. S., MacHugh, D. E., MacLeod, J. N., O’Gorman, G. M., Park, S. D., et al. (2009). Transcriptional adaptations following exercise in thoroughbred horse skeletal muscle highlights molecular mechanisms that lead to muscle hypertrophy. BMC Genomics 10, 638. doi: 10.1186/1471-2164-10-638
McGivney, B. A., McGettigan, P. A., Browne, J. A., Evans, A. C., Fonseca, R. G., Loftus, B. J., et al. (2010). Characterization of the equine skeletal muscle transcriptome identifies novel functional responses to exercise training. BMC Genomics 11, 398. doi: 10.1186/1471-2164-11-398
McGough, I. J., Steinberg, F., Gallon, M., Yatsu, A., Ohbayashi, N., Heesom, K. J., et al. (2014). Identification of molecular heterogeneity in SNX27–retromer-mediated endosome-to-plasma-membrane recycling. J. Cell Sci. 127 (22), 4940–4953. doi: 10.1242/jcs.156299
Miyaguchi, K. (2004). Localization of selenium-binding protein at the tips of rapidly extending protrusions. Histochem. Cell Biol. 121 (5), 371–376. doi: 10.1007/s00418-004-0623-y
Mollet, J., Delahodde, A., Serre, V., Chretien, D., Schlemmer, D., Lombes, A., et al. (2008). CABC1 Gene Mutations Cause Ubiquinone Deficiency with Cerebellar Ataxia and Seizures. Am. J. Hum. Genet. 82 (3), 623–630. doi: 10.1016/j.ajhg.2007.12.022
Monks, S. A., Leonardson, A., Zhu, H., Cundiff, P., Pietrusiak, P., Edwards, S., et al. (2004). Genetic inheritance of gene expression in human cell lines. Am. J. Hum. Genet. 75 (6), 1094–1105. doi: 10.1086/426461
Pampouille, E., Berri, C., Boitard, S., Hennequet-Antier, C., Beauclercq, S. A., Godet, E., et al. (2018). Mapping QTL for white striping in relation to breast muscle yield and meat quality traits in broiler chickens. BMC Genomics 19 (1), 202. doi: 10.1186/s12864-018-4598-9
Peansukmanee, S., Vaughan-Thomas, A., Carter, S. D., Clegg, P. D., Taylor, S., Redmond, C., et al. (2009). Effects of hypoxia on glucose transport in primary equine chondrocytes in vitro and evidence of reduced GLUT1 gene expression in pathologic cartilage in vivo. J. Orthopaedic Res. 27 (4), 529–535. doi: 10.1002/jor.20772
Ponsuksili, S., Siengdee, P., Du, Y., Trakooljul, N., Murani, E., Schwerin, M. (2015). Identification of common regulators of genes in co-expression networks affecting muscle and meat properties. PloS One 10 (4), e0123678. doi: 10.1371/journal.pone.0123678
Putiri, E., Pelegri, F. (2011). The zebrafish maternal-effect gene mission impossible encodes the DEAH-box helicase Dhx16 and is essential for the expression of downstream endodermal genes. Dev. Biol. 353 (2), 275–289. doi: 10.1016/j.ydbio.2011.03.001
R Core Team (2017). R: A language and environment for statistical computing. Vienna, Austria:R Foundation for Statistical Computing.
Rederstorff, M., Krol, A., Lescure, A. (2006). Understanding the importance of selenium and selenoproteins in muscle function. Cell. Mol. Life Sci. 63 (1), 52–59. doi: 10.1007/s00018-005-5313-y
Renault, A.-L., Mebirouk, N., Cavaciuti, E., Le Gal, D., Lecarpentier, J., Enghien, C. D., et al. (2017). Telomere length, ATM mutation status and cancer risk in Ataxia-Telangiectasia families. Carcinogenesis 38 (10), 994–1003. doi: 10.1093/carcin/bgx074
Rivero, J. L., Talmadge, R. J., Edgerton, V. R. (1996). Correlation between myofibrillar ATPase activity and myosin heavy chain composition in equine skeletal muscle and the influence of training. Anat. Rec. 246 (2), 195–207. doi: 10.1002/(sici)1097-0185(199610)246:2<195::aid-ar6>3.0.co;2-0
Rivero, J. L., Sporleder, H. P., Quiroz-Rothe, E., Vervuert, I., Coenen, M., Harmeyer, J. (2002). Oral L-carnitine combined with training promotes changes in skeletal muscle. Equine Vet. J. Suppl. (34), 269–274. doi: 10.1111/j.2042-3306.2002.tb05431.x
Rivero, J. L. (2004). Muscle morphology heterogeneity: control, significance for performance and responses to training, in Emerging Equine Science. Eds.Alliston, J. C., Ede, S., Hemmings, A., Hyslop, A., Longland, J., Moreton, A., Moore-Colyer, H.(Nottingham:Nottingham University Press), 11–27. doi: 10.1017/S0263967X00041197
Robinson, M. D., McCarthy, D. J., Smyth, G. K. (2010). edgeR: a Bioconductor package for differential expression analysis of digital gene expression data. Bioinformatics 26 (1), 139–140. doi: 10.1093/bioinformatics/btp616
Rooney, M. F., Porter, R. K., Katz, L. M., Hill, E. W. (2017). Skeletal muscle mitochondrial bioenergetics and associations with myostatin genotypes in the Thoroughbred horse. PloS One 12 (11), e0186247. doi: 10.1371/journal.pone.0186247
Rudich, A., Konrad, D., Torok, D., Ben-Romano, R., Huang, C., Niu, W., et al. (2003). Indinavir uncovers different contributions of GLUT4 and GLUT1 towards glucose uptake in muscle and fat cells and tissues. Diabetologia 46 (5), 649–658. doi: 10.1007/s00125-003-1080-1
Sajuthi, S. P., Sharma, N. K., Chou, J. W., Palmer, N. D., McWilliams, D. R., Beal, J., et al. (2016). Mapping adipose and muscle tissue expression quantitative trait loci in African Americans to identify genes for type 2 diabetes and obesity. Hum. Genet. 135 (8), 869–880. doi: 10.1007/s00439-016-1680-8
Schaefer, R. J., Schubert, M., Bailey, E., Bannasch, D. L., Barrey, E., Bar-Gal, G. K., et al. (2017). Developing a 670k genotyping array to tag ∼2M SNPs across 24 horse breeds. BMC Genomics 18 (1), 565. doi: 10.1186/s12864-017-3943-8
Serrano, A. L., Quiroz-Rothe, E., Rivero, J.-L. L. (2000). Early and long-term changes of equine skeletal muscle in response to endurance training and detraining. Pflügers Archiv. 441 (2), 263–274. doi: 10.1007/s004240000408
Shabalin, A. A. (2012). Matrix eQTL: ultra fast eQTL analysis via large matrix operations. Bioinformatics 28 (10), 1353–1358. doi: 10.1093/bioinformatics/bts163
Sharma, N. K., Langberg, K. A., Mondal, A. K., Elbein, S. C., Das, S. K. (2011). Type 2 diabetes (T2D) associated polymorphisms regulate expression of adjacent transcripts in transformed lymphocytes, adipose, and muscle from Caucasian and African-American subjects. J. Clin. Endocrinol. Metab. 96 (2), E394–E403. doi: 10.1210/jc.2010-1754
Snow, D. H., Harris, R. C., Gash, S. P. (1985). Metabolic response of equine muscle to intermittent maximal exercise. J. Appl. Physiol. (1985) 58 (5), 1689–1697. doi: 10.1152/jappl.1985.58.5.1689
Snow, D.H.a.V. SJ. (1994). Muscle anatomy, physiology and adaptations to exercise and training in The athletic horse: principles and practice of equine sports medicine. Ed. Hodgson, D. R. R. (Philadelphia:Saunders), 145–179.
Stadler, S. C., Polanetz, R., Meier, S., Mayerhofer, P. U., Herrmann, J. M., Anslinger, K., et al. (2005). Mitochondrial targeting signals and mature peptides of 3-methylcrotonyl-CoA carboxylase. Biochem. Biophys. Res. Commun. 334 (3), 939–946. doi: 10.1016/j.bbrc.2005.06.190
Stadler, S. C., Polanetz, R., Maier, E. M., Heidenreich, S. C., Niederer, B., Mayerhofer, P. U., et al. (2006). Newborn screening for 3-methylcrotonyl-CoA carboxylase deficiency: population heterogeneity of MCCA and MCCB mutations and impact on risk assessment. Hum. Mutat. 27 (8), 748–759. doi: 10.1002/humu.20349
Stefely, J. A., Pagliarini, D. J. (2017). Biochemistry of mitochondrial coenzyme Q biosynthesis. Trends In Biochem. Sci. 42 (10), 824–843. doi: 10.1016/j.tibs.2017.06.008
Stefely, J. A., Licitra, F., Laredj, L., Reidenbach, A. G., Kemmerer, Z. A., Grangeray, A., et al. (2016). Cerebellar ataxia and coenzyme Q deficiency through loss of unorthodox kinase activity. Mol. Cell 63 (4), 608–620. doi: 10.1016/j.molcel.2016.06.030
Stranger, B. E., Nica, A. C., Forrest, M. S., Dimas, A., Bird, C. P., Beazley, C., et al. (2007). Population genomics of human gene expression. Nat. Genet. 39 (10), 1217–1224. doi: 10.1038/ng2142
Taylor, R. M., Sunde, R. A. (2017). Selenium requirements based on muscle and kidney selenoprotein enzyme activity and transcript expression in the turkey poult (Meleagris gallopavo). PloS One 12 (11), e0189001. doi: 10.1371/journal.pone.0189001
Timmons, J. A., Knudsen, S., Rankinen, T., Koch, L. G., Sarzynski, M., Jensen, T., et al. (2010). Using molecular classification to predict gains in maximal aerobic capacity following endurance exercise training in humans. J. Appl. Physiol. 108 (6), 1487–1496. doi: 10.1152/japplphysiol.01295.2009
Todd, E. T., Ho, S. Y. W., Thomson, P. C., Ang, R. A., Velie, B. D., Hamilton, N. A. (2018). Founder-specific inbreeding depression affects racing performance in Thoroughbred horses. Sci. Rep. 8 (1), 6167. doi: 10.1038/s41598-018-24663-x
Turunen, M., Olsson, J., Dallner, G. (2004). Metabolism and function of coenzyme Q. Biochim. Biophys. Acta (BBA) - Biomembr. 1660 (1), 171–199. doi: 10.1016/j.bbamem.2003.11.012
Tyler, C. M., Golland, L. C., Evans, D. L., Hodgson, D. R., Rose, R. J. (1998).Skeletal muscle adaptations to prolonged training, overtraining and detraining in horses. Pflugers Arch. 436 (3), 391–397. doi: 10.1007/s004240050648
Valette, J. P., Barrey, E., Jouglin, M., Courouce, A., Auvinet, B., Flaux, B. (1999).Standardisation of muscular biopsy of gluteus medius in French trotters. Equine Vet. J. Suppl. (30), 342–344. doi: 10.1111/j.2042-3306.1999.tb05246.x
Velez-Irizarry, D., Casiro, S., Daza, K. R., Bates, R. O., Raney, N. E., Steibel, J. P., et al. (2019). Genetic control of longissimus dorsi muscle gene expression variation and joint analysis with phenotypic quantitative trait loci in pigs. BMC Genomics 20 (1), 3. doi: 10.1186/s12864-018-5386-2
Votion, D. M., Gnaiger, E., Lemieux, H., Mouithys-Mickalad, A., Serteyn, D. (2012). Physical Fitness and Mitochondrial Respiratory Capacity in Horse Skeletal Muscle. PloS One 7 (4). doi: 10.1371/journal.pone.0034890
Wang, G., Durussel, J., Shurlock, J., Mooses, M., Fuku, N., Bruinvels, G., et al. (2017). Validation of whole-blood transcriptome signature during microdose recombinant human erythropoietin (rHuEpo) administration. BMC Genomics 18 (Suppl 8), 817. doi: 10.1186/s12864-017-4191-7
Westra, H. J., Franke, L. (2014). From genome to function by studying eQTLs. Biochim. Biophys. Acta 1842 (10), 1896–1902. doi: 10.1016/j.bbadis.2014.04.024
Wittkopp, P. J. (2005). Genomic sources of regulatory variation in cis and in trans. Cell Mol. Life Sci. 62 (16), 1779–1783. doi: 10.1007/s00018-005-5064-9
Wright, F. A., Sullivan, P. F., Brooks, A. I., Zou, F., Sun, W., Xia, K., et al. (2014).Heritability and genomics of gene expression in peripheral blood. Nat. Genet. 46 (5), 430–437. doi: 10.1038/ng.2951
Xia, Y., Brown, L., Yang, C. Y., Tsan, J. T., Siciliano, M. J., Espinosa, R., et al. (1991).TAL2, a helix-loop-helix gene activated by the formatting translocation in human T-cell leukemia. Proc. Natl. Acad. Sci. 88 (24), 11416–11420. doi: 10.1073/pnas.88.24.11416
Yang, M., Sytkowski, A. J. (1998). Differential expression and androgen regulation of the human selenium-binding protein gene hSP56 in prostate cancer cells. Cancer Res. 58 (14), 3150–3153.
Yu, G., Wang, L.-G., Han, Y., He, Q.-Y. (2012). clusterProfiler: an R package for comparing biological themes among gene clusters. OMICS: J. Integr. Biol. 16 (5), 284–287. doi: 10.1089/omi.2011.0118
Keywords: expression quantitative trait loci, gene expression, RNA sequencing, horse, exercise, aerobic metabolism
Citation: Farries G, Bryan K, McGivney CL, McGettigan PA, Gough KF, Browne JA, MacHugh DE, Katz LM and Hill EW (2019) Expression Quantitative Trait Loci in Equine Skeletal Muscle Reveals Heritable Variation in Metabolism and the Training Responsive Transcriptome. Front. Genet. 10:1215. doi: 10.3389/fgene.2019.01215
Received: 09 July 2019; Accepted: 04 November 2019;
Published: 26 November 2019.
Edited by:
Fabyano Fonseca Silva, Universidade Federal de Viçosa, BrazilReviewed by:
Eric Barrey, INRA UMR1313 Genetique Animale et Biologie Integrative, FranceYame Fabres Robaina Sancler-Silva, Universidade Federal de Viçosa, Brazil
Copyright © 2019 Farries, Bryan, McGivney, McGettigan, Gough, Browne, MacHugh, Katz and Hill. This is an open-access article distributed under the terms of the Creative Commons Attribution License (CC BY). The use, distribution or reproduction in other forums is permitted, provided the original author(s) and the copyright owner(s) are credited and that the original publication in this journal is cited, in accordance with accepted academic practice. No use, distribution or reproduction is permitted which does not comply with these terms.
*Correspondence: Emmeline W. Hill, ZW1tZWxpbmUuaGlsbEB1Y2QuaWU=