 Yifeng Ding
 Ji Wang
 Shuizhen Zhou
 Linmei Zhang
 Lifei Yu
 Yi Wang
- Department of Neurology, Children’s Hospital of Fudan University, Shanghai, China
Tuberous sclerosis complex (TSC) is a genetic condition characterized by the occurrence of hamartomatous wounds stemming from the dysfunction of the mammalian target of rapamycin (mTOR) pathway. We investigated the clinical phenotypes and genetic variants in 243 unrelated probands and their families in China. Exome sequencing, targeted sequencing or multiplex ligation-dependent probe amplification (MLPA) was performed in 174 children with TSC, among whom 31 (17.82%) patients/families were identified as having pathogenic or likely pathogenic variants in the TSC1 gene, 120 (68.97%) as having pathogenic or likely pathogenic variants in the TSC2 gene and 23 (13.21%) as having no pathogenic or likely pathogenic variants identified (NMI). In the 31 patients with pathogenic or likely pathogenic TSC1 variants, 10 novel variants were detected among 26 different variants. In all 120 patients with TSC2 variants, 39 novel variants were found among a total of 107 different variants. We compared the phenotypes of the individuals with TSC1 pathogenic variants, TSC2 pathogenic variants and NMI. Patients with TSC2 variants were first diagnosed at a younger age (p = 0.003) and had more retinal hamartomas (p = 0.003) and facial angiofibromas (p = 0.027) (age ≥ 3 years) than individuals with TSC1 variants. Compared with individuals with TSC1/TSC2 pathogenic variants, NMI individuals had fewer cortical tubers (p = 0.003). Compared with individuals with TSC1 pathogenic variants, NMI patients had more retinal hamartomas (p = 0.035), and compared with individuals with TSC2 pathogenic variants, they had less epilepsy (p = 0.003) and fewer subependymal nodules (SENs) (p = 0.004).
Introduction
As an autosomal dominant disease, tuberous sclerosis complex (TSC, OMIM #191100, #613254) is characterized by a wide range of disease severities involving hamartomatous tumors in multiple organs. The incidence of TSC is 1 in 6,000–10,000 live births, and it affects nearly 2 million individuals worldwide (Curatolo et al., 2008; Peron and Northrup, 2018). TSC is the result of mutations in either the TSC1 (OMIM #605284) or TSC2 (OMIM #191092) gene, triggering the hyperactivation of the mechanistic target of rapamycin (mTOR) signaling pathway, and subsequent cell proliferation deregulation (Cheadle et al., 2000; Crino et al., 2006; Henske et al., 2016; Franz and Krueger, 2018).
In this study, we combined the latest TSC gene testing with the clinical data of patients to evaluate the phenotype-genotype correlation.
Materials and Methods
Patients
A retrospective chart review was carried out at the Children’s Hospital of Fudan University. The review included children (age < 16 years) with TSC seen between August 2013 and July 2018. In total, 243 unrelated probands met the clinical diagnostic criteria for TSC (Northrup and Krueger, 2013). Exome sequencing or targeted sequencing was performed in 174 probands and their families. Our research was carried out in accordance with the Declaration of Helsinki and was approved by the Ethics Committee of the Fudan University Children’s Hospital. Signed informed consent was provided by the patients’ parents.
Clinical Data
We studied the clinical information obtained from the medical records and phone calls with the families, including information on each patient’s birth history, family history, age at seizure inception, seizure forms, treatments, neurological development, central nervous system manifestations, renal disease, cutaneous manifestations, and tuberous sclerosis-associated neuropsychiatric disorders (TAND).
Genetic Analysis
Extraction of genomic DNA from whole blood of patients and their patients was performed using the Agilent (Santa Clara, CA, United States) SureSelectXT Human All Exon 50 Mb kit according to the manufacturer’s instructions. TSC1 and TSC2 variants were detected in individuals by clinical exome sequencing (emphasis on 2742 genes) or whole-exome sequencing (WES). Our databank and public databases (the exome aggregation consortium, the 1000 Genome Project, and dbSNP137 reported in the UCSC Genome Browser) were utilized for variant screening. Candidate variants were verified using Sanger sequencing. Detection of significant deletions/repeats in TSC1 and TSC2 was performed using multiplexed-dependent probe amplification (MLPA) (MRC-Holland, Probemix TSC2 P046, Probemix TSC1 P124) following the manufacturer’s instructions. The variants were considered to be pathogenic on the basis of the following (Richards et al., 2015; Yang et al., 2018): (1) this variant would likely explain the indication for TSC and may be responsible for the clinical manifestation; (2) there is a null variant (non-sense, frameshift, canonical ± 1 or 2 splice sites, initiation codon, single or multiexon deletion) in the TSC1/TSC2 gene causing a loss of function (LOF); or the same amino acid change as a previously established pathogenic variant regardless of nucleotide change is a known mechanism of TSC; and (3) the mutation is inherited from the affected parents or is de novo (both maternity and paternity confirmed) in the proband with a negative TSC family history.
Statistical Analysis
Continuous variables are expressed as medians and ranges or as the means and standard deviations (SDs), while categorical data are presented as percentages and numbers where appropriate. TSC individuals were classified into the following three groups according to the results of the molecular analyses: variants in TSC1, variants in TSC2, and NMI. Then, we compared the clinical characteristics among the three groups using the Kruskal-Wallis tests for continuous variables and Fisher’s exact tests for categorical data. P values < 0.05 were considered statistically significant. Analyses were performed using Stata 15.11.
Results
Cohort Characteristics
We identified and enrolled 174 unrelated patients with a definite clinical diagnosis of TSC. There were 88 (50.57%) females and 86 (49.43%) males. The median age at first presentation was 24.35 months (interquartile range: 9.56–68.83 months), and the median duration of follow-up was 28.81 months (interquartile range: 14.09–51.35 months). Thirty-one patients (17 males and 14 females; median age at first presentation: 34.79 months) had variants in the TSC1 gene; 120 (58 males and 62 females; mean age at first presentation: 21.70 months) had variants in TSC2 (TSC2: TSC1 = 7.06:1); and 23 (11 males and 12 females; mean age at first presentation: 19.15 months) had NMI.
Clinical Outcomes
Phenotype data regarding the major and minor diagnostic criteria for TSC and neurobehavioral features were collected from 174 affected individuals who met the criteria for a definite diagnosis of TSC. There are myriad neurologic sequelae of TSC, including neurodevelopmental disorders, epilepsy, and intellectual impairment, as well as many structural lesions. The most common manifestation leading to a diagnosis of TSC was the presence of epilepsy (140/174, 80.46%). During the follow-up period, a total of 148/174 (85.06%) patients suffered from epilepsy (TSC1:TSC2: NMI = 24:109:15), with 65.54% of those patients manifesting epilepsy within the first year of life. The seizure manifestations were variable, and 27.70% of patients presented with more than one seizure type. In our cohort, 44.59% (66/148) of the patients had infantile spasms, 52.03% (77/148) had focal seizures, and 33.11% (49/148) had another type of seizure. On average, patients were treated with ≥2 AEDs (median: 2; range: 0–7).
Compared with the general population, patients with TSC are at higher risk of developing neuropsychiatric disorders (de Vries et al., 2018). According to DSM-5, we defined all patients with IQ < 70 as intellectual disability (ID) patients, which accounted for 65.52% (114/174) of the population, including those with mild ID (IQ 51–70) and moderate ID (IQ 36–50), who accounted for 50% (87/174), and those with severe ID (IQ 20–35) and profound ID (IQ < 20), who accounted for 15.52% (27/174). In 97.70% (170/174) of the patients in this cohort, brain imaging abnormalities were found. Cortical tubers were found in up to 93.68% (163/174) of the patients and were located throughout all regions of the cortex and superficial white matter, especially the frontal lobe. As a major clinical feature of TSC, subependymal nodules (SENs) were found in up to 91.95% (160/174) of the patients, especially in the ependymal lining of the lateral ventricles. SEGA was diagnosed in 9/174 (5.17%) of the patients.
Retinal astrocytic hamartomas were detected in 38.89% (35/90) of the patients and were nearly universally benign.
In our cohort, 43.68% (76/174), 95.40% (166/174), 32.76% (57/174) and 3.05% (5/164) of TSC patients had facial angiofibromas, hypomelanotic macules, shagreen patches, and periungual fibroma, respectively. The presence of multiple facial angiofibromas in adolescence is characteristic of TSC.
Moreover, we found 61 patients with cardiac rhabdomyoma (35.06%) and 9 patients with liver hamartoma (5.17%).
Genetic Analysis
In our study, 133 pathogenic or likely pathogenic variants were identified. Of these, 36.84% (49/133) were novel. Among all of the variants, most TSC1 variants were truncating mutations, including non-sense mutations (38.71%) and frame shifts (29.03%), and most of the variants were located in crucial regions (N-terminal protein interaction domain and tuberin interaction coiled-coil domain). Most TSC2 variants were missense mutations (24.17%), non-sense mutations (25.00%) and frame shifts (22.50%), and most of the variants were located in crucial regions (N-terminal hamartin interaction GTPase activation protein domain) (Table 1).
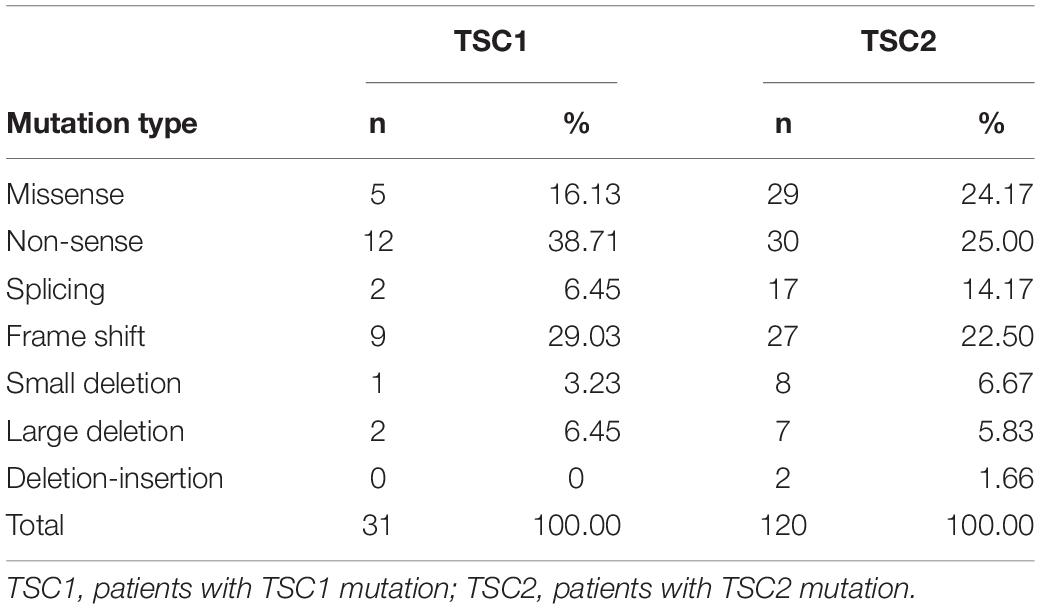
Table 1. Description of the types of mutations detected (n = 151).
A total of 31 patients (17.82%) had pathogenic variants or likely pathogenic variants of TSC1, 120 (68.97%) had pathogenic variants or likely pathogenic variants of TSC2, and 23 (13.21%) had NMI. In the TSC1 group, we found 10 (39.29%) novel variants and 16 (60.71%) known variants. In our cohort, exon 15 of the TSC1 gene had a relatively high probability of mutation (15/31, 48.39%). In the TSC2 group, 39 novel pathogenic or likely pathogenic variants (36.45%) and 68 known variants (63.55%) were found. Among the 42 exons in the TSC2 gene, exon 34 (13/120, 10.83%) and exon 41 (17/120, 14.17%) of the TSC2 gene had relatively high mutational probabilities (Supplementary Table 1).
Genotype-Phenotype Correlations in Patients With TSC
The main features of the three groups (TSC1, TSC2, and NMI) were compared in 174 patients who underwent complete genetic testing (point mutations and deletions/repetitions), as shown in Table 2. Compared with individuals with TSC1 pathogenic variants, individuals with TSC2 pathogenic variants were first diagnosed at a younger age (p = 0.003) and had more retinal hamartomas (p = 0.003) and facial angiofibromas (p = 0.027) (age ≥ 3 years). Compared with individuals with TSC1/TSC2 pathogenic or likely pathogenic variants, NMI individuals had fewer cortical tubers (p = 0.003). Compared with individuals with TSC1 pathogenic of likely pathogenic variants, NMI individuals had more retinal hamartomas (p = 0.035), and compared with individuals with TSC2 pathogenic of likely pathogenic variants, NMI individuals were less likely to have epilepsy (p = 0.003) and had fewer SENs (p = 0.004).
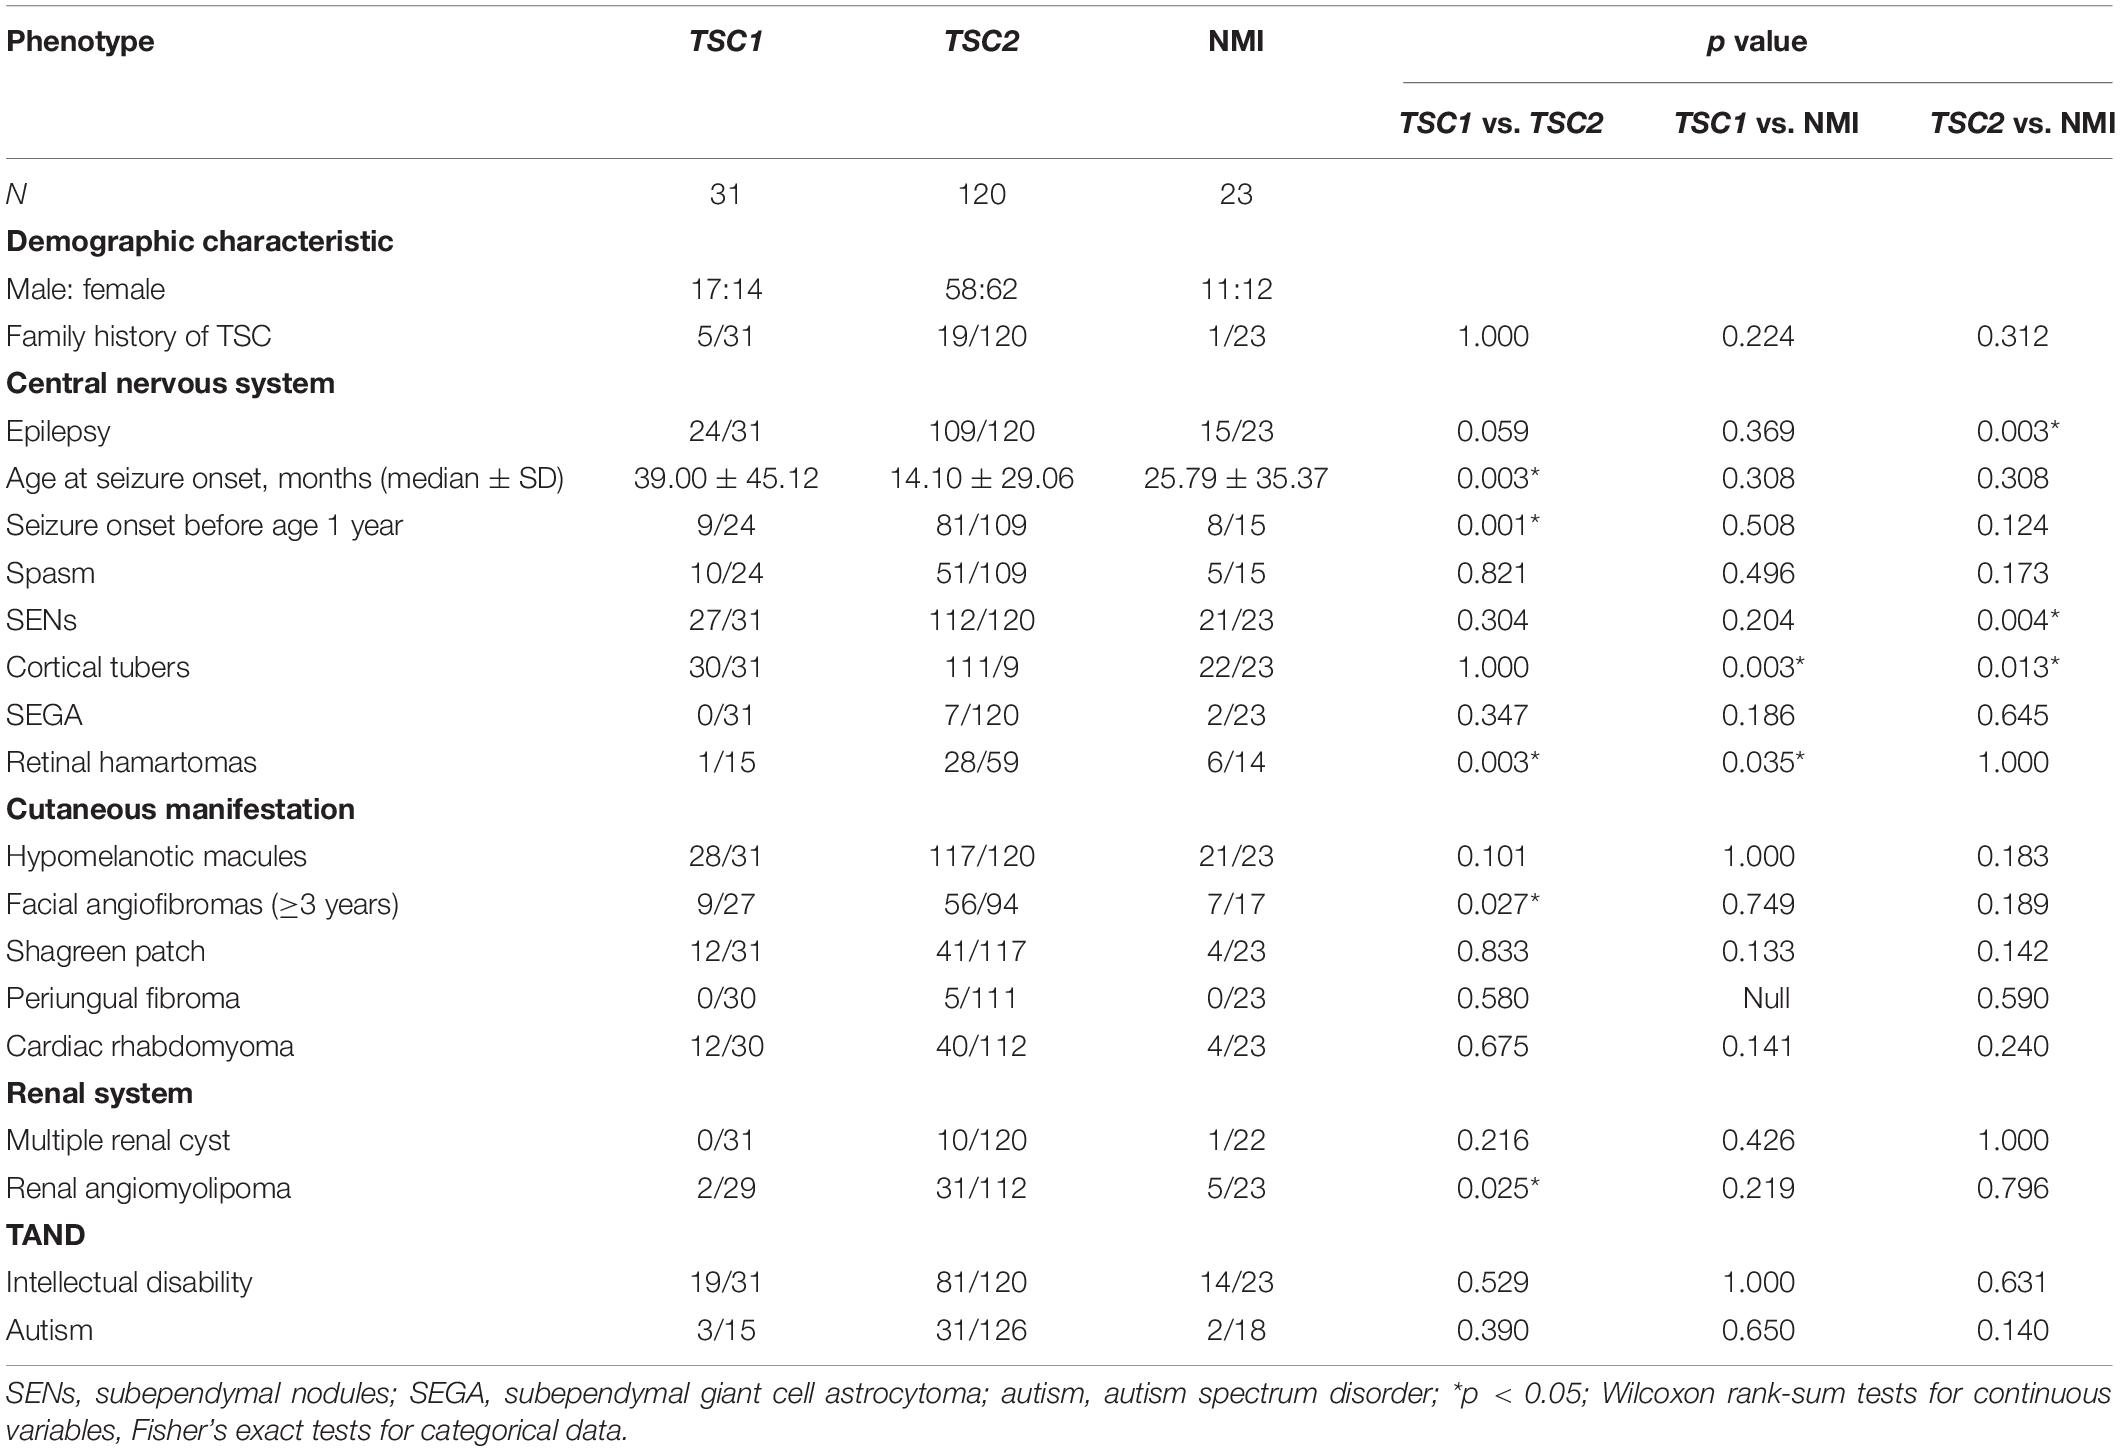
Table 2. Comparison of clinical manifestations among TSC1, TSC2, and NMI patients.
After comparing multiple clinical phenotypes in individuals with different TSC1/TSC2 mutation types, we found no significant differences in CNS, cutaneous manifestations, cardiac rhabdomyoma, renal system disorders, or TAND (Table 3).
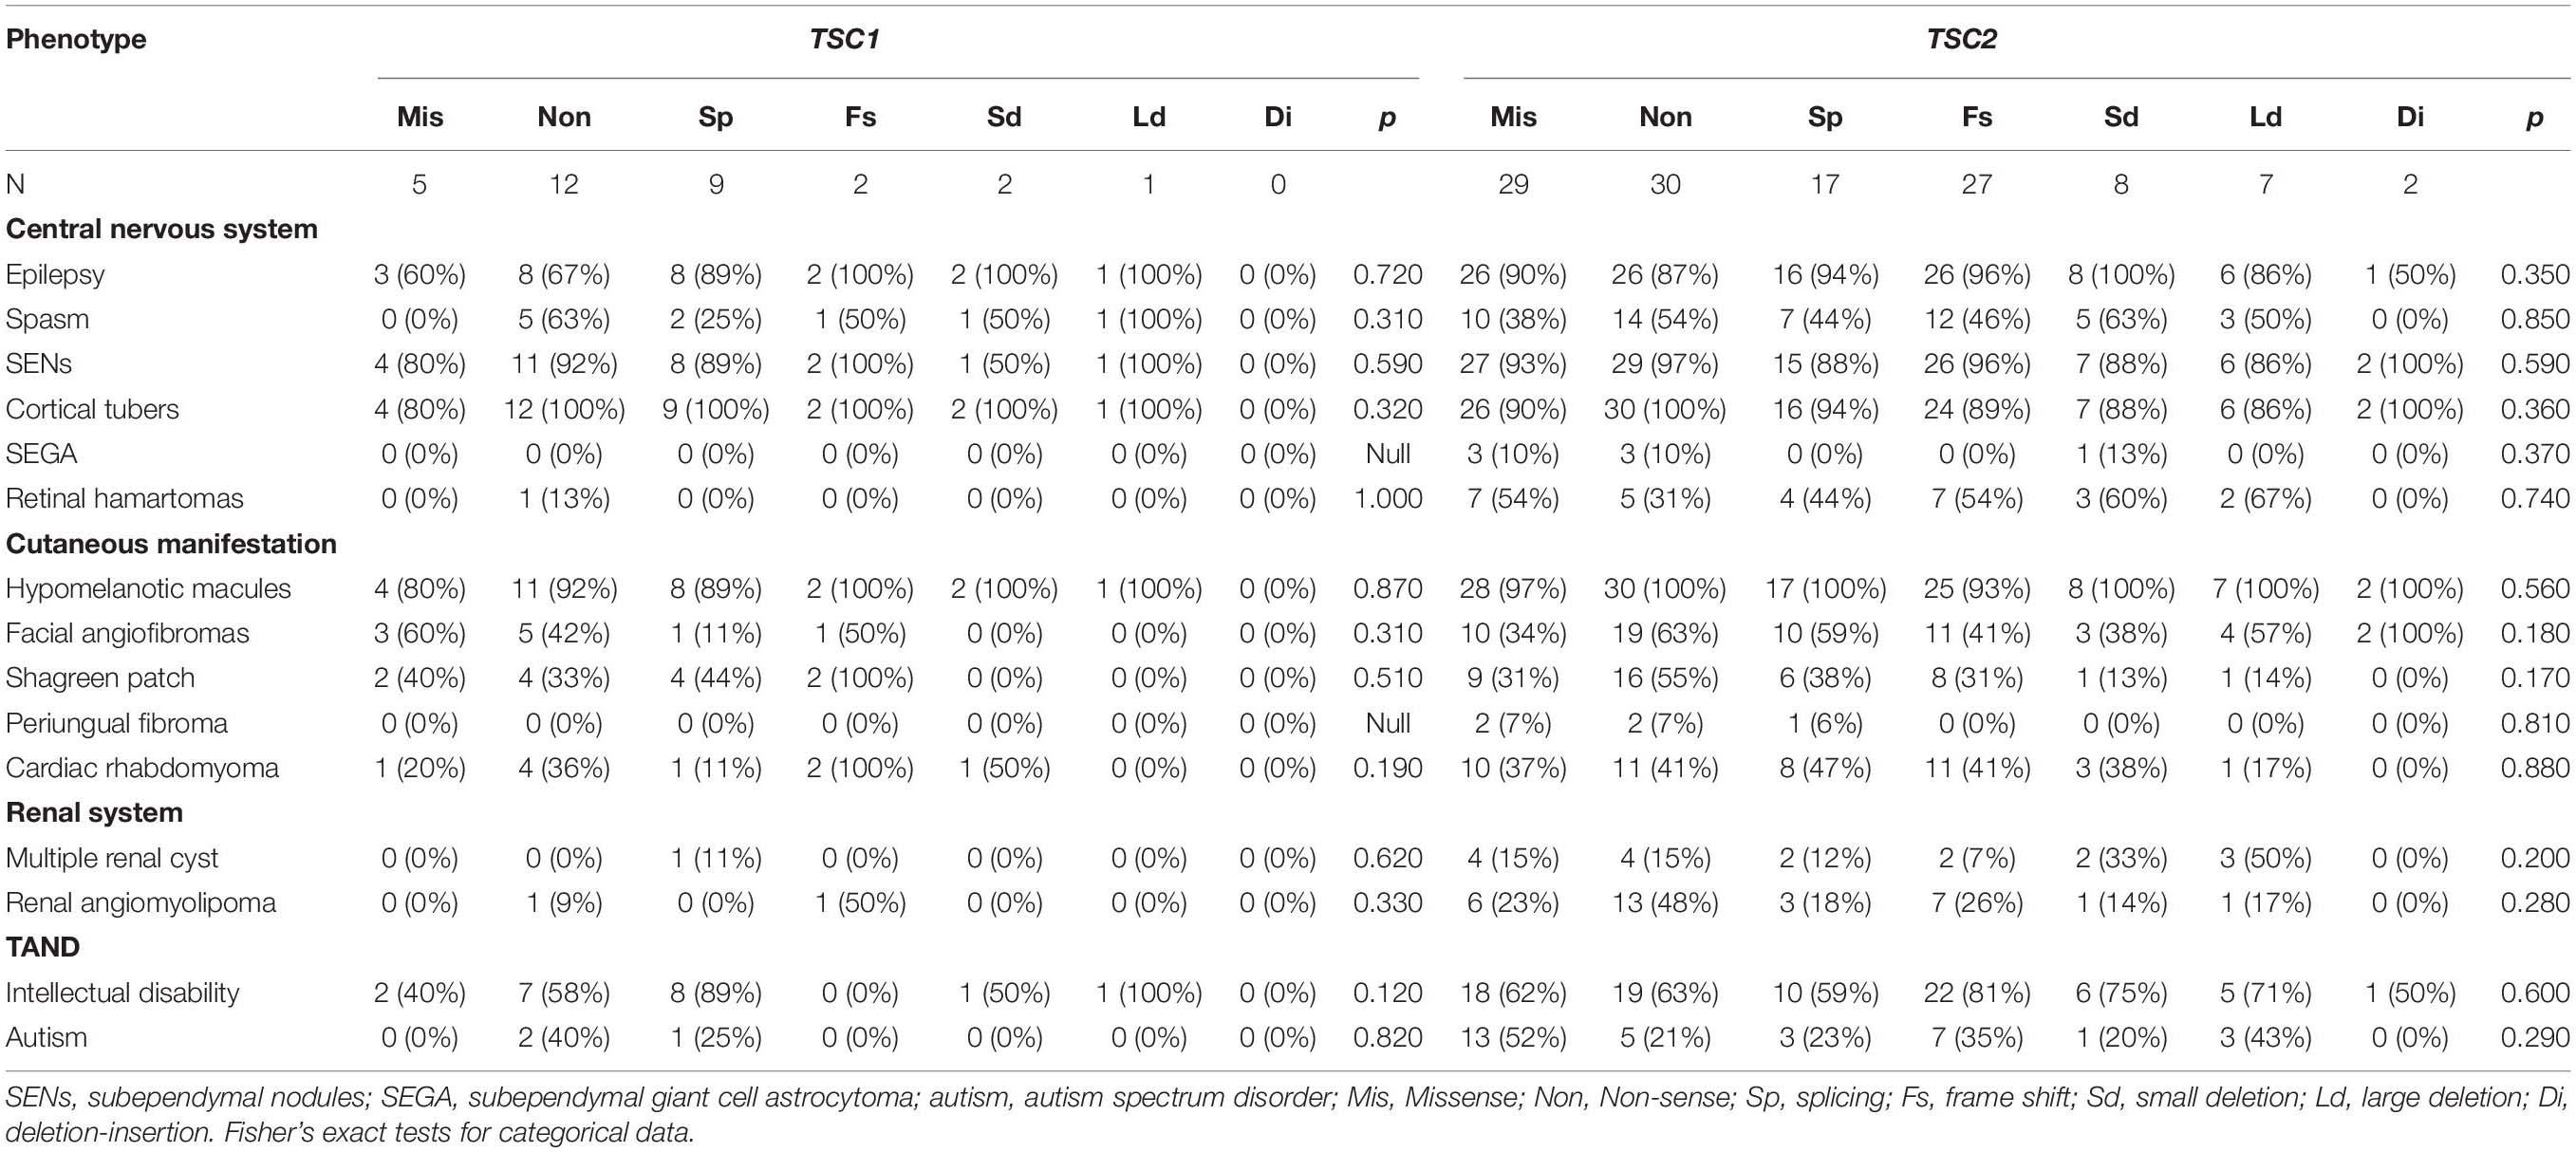
Table 3. Clinical manifestations of different mutation types in TSC1 and TSC2 genes.
Discussion
Tuberous sclerosis is a hereditary multisystem disease characterized by hamartomas in multiple organs, including the skin, brain, liver, kidneys, heart and eyes. After the discovery of the involvement of the TSC1 and TSC2 genes in TSC in 1997 and 1993, respectively, the genetic basis of the disease was studied to better understand its clinical manifestations. Unfortunately, despite the continuous development of new molecular detection techniques, understanding the complex clinical manifestations of TSC that predict the observed individual clinical phenotypes is still challenging. TSC1 and TSC2 encode hamartin and tuberin, respectively, which form heterodimers that act synergistically to regulate cell growth and proliferation (Plank et al., 1998; van Slegtenhorst et al., 1998; Han and Sahin, 2011). TSC1 and TSC2 variants are thought to result in a loss of function, leading to multiple organ hamartias and hamartomas (Au et al., 2004). In our cohort, all patients fulfilled the current diagnostic criteria for TSC. In total, 42.86% (6/14) of the TSC1 variants were located in crucial regions (N-terminal protein interaction domain and tuberin interaction coiled-coil domain), and 51.35% (19/37) of the TSC2 variants were located in crucial regions (N-terminal hamartin interaction GTPase activation protein domain). We compared the correlation between the clinical features obtained in our cohort with the different mutation types found in previous studies (Dabora et al., 2001; Sancak et al., 2005; Au et al., 2007; Yang et al., 2017).
As shown in Table 1, patients with TSC2 variants were identified at a younger age (p = 0.003) and showed more retinal hamartomas and facial angiofibromas compared with patients with TSC1 variants (age ≥ 3 years) (p = 0.027). NMI patients had fewer cortical tubers (p = 0.003) compared to patients with TSC1/TSC2 variants. Compared with patients with TSC1 variants, NMI patients exhibited more retinal hamartomas (p = 0.035), were less likely to have epilepsy (p = 0.003), and had fewer cortical tubers (p = 0.013) and SENs (p = 0.004) than patients with TSC2 variants.
As shown in Table 4, the frequency of ID (65.52% vs. 46.47∼82.41%), seizures (85.06% vs. 74.77∼96.58%) and SENs (91.95% vs. 83.39∼91.71%) in our cohort was consistent with that of previous studies. Compared with the cohorts in previous reports, our cohort may have more cortical tubers (93.68% vs. 83.97∼89.74%), retinal hamartomas (39.77% vs. 23.96∼37.68%) and hypomelanotic macules (95.40% vs. 89.10∼94.87%). Compared with reports from other countries, our TSC patients were more similar to those in the reports of Yang et al. Compared with patients in reports from other countries, our patients were less likely to develop SEGA (5.17∼9.40% vs. 11.06∼30.00%), facial angiofibromas (26.50∼43.68% vs. 60.06∼84.54%), shagreen patches (19.66∼33.33% vs. 38.94∼53.57%), multiple renal cysts (6.32∼14.53% vs. 24.79∼42.03%), and renal angiomyolipomas (23.01∼28.21% vs. 41.89∼54.11%), possibly due to the younger age of our cohort.
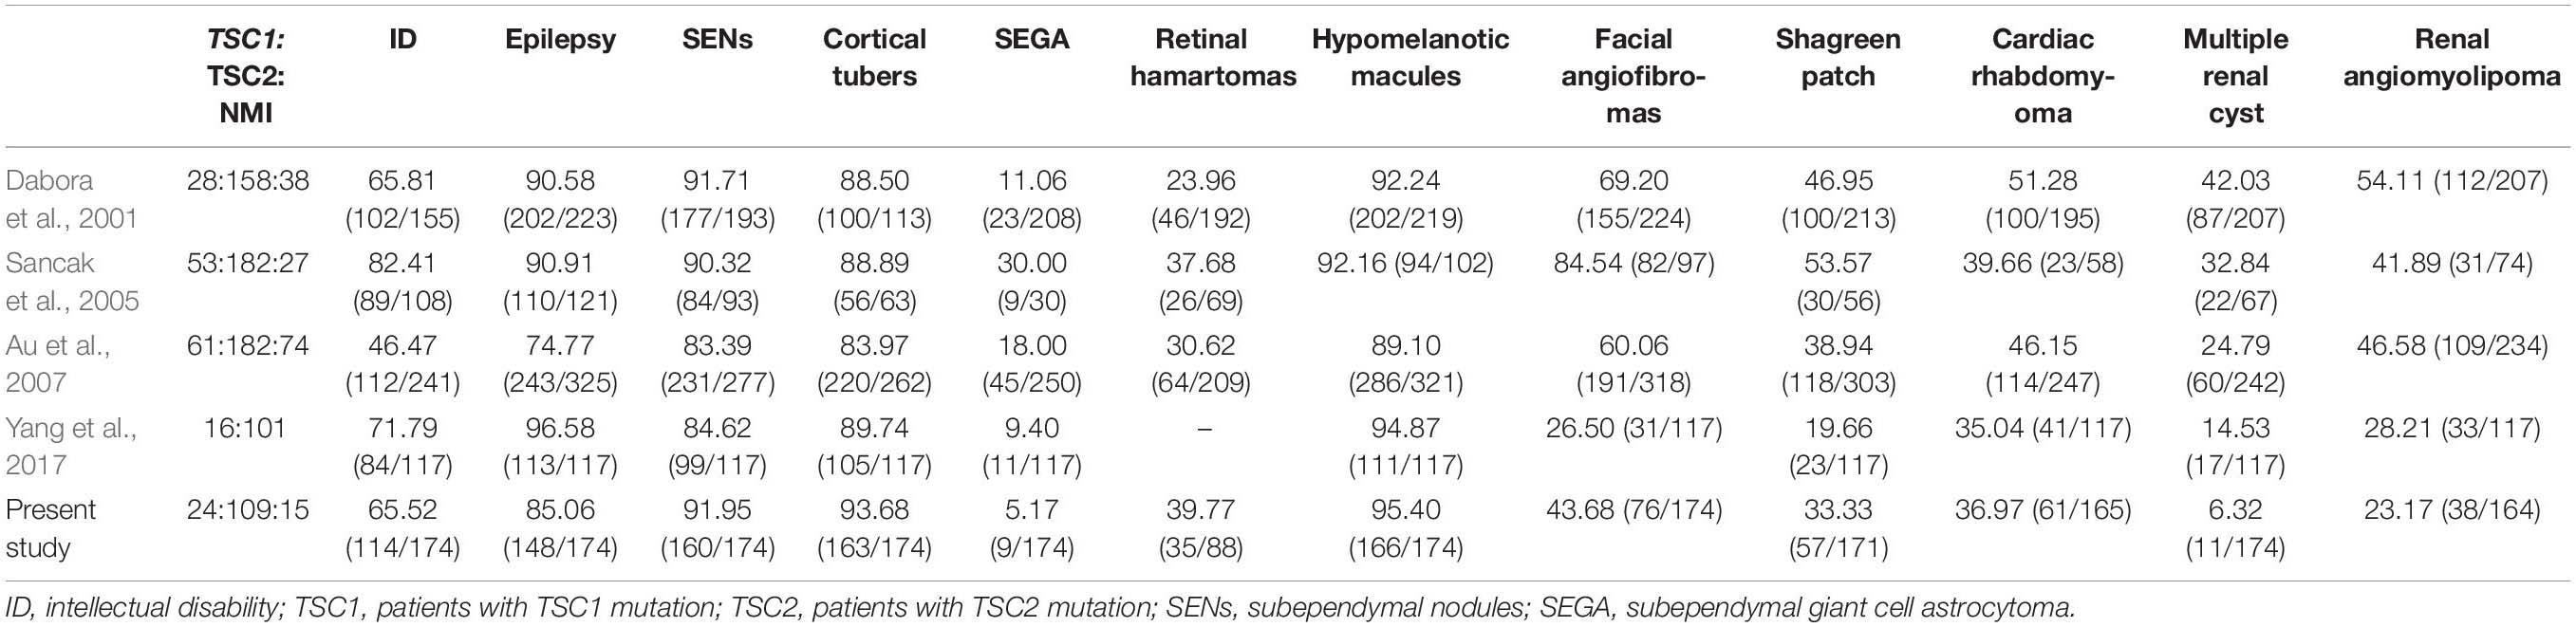
Table 4. Frequencies of major clinical characteristics in TSC patients in previous and current studies.
This study has some limitations. Exome sequencing, targeted sequencing or MLPA was performed in 174 children. However, we have not performed further deep-depth sequencing of the 23 clinically confirmed NMI cases, nor have we sequenced tissue samples (such as brain tissue, etc.). The cases of somatic mosaicism are not yet clear. Assuming a somatic mosaicism detection rate of 5% (Kozlowski et al., 2007) and given that no mutation was identified in TSC1 or TSC2 by the sequence analyses in 13.21% of individuals with TSC, we conclude that fewer than 1% of persons with TSC have somatic mosaicism for a TSC1 or TSC2 mutation. Improving sequencing depth and collecting more tissue samples will lead to better somatic mosaicism detection.
As reported by Yang et al. (2017) despite these general associations, there is significant clinical variability among TSC patients, even within the same family. In our clinical experience, severe and mild cases can occur in patients with different genotypes; therefore, it is challenging to predict the clinical phenotype of TSC patients based on their genotype. Therefore, we recommend that clinicians use caution when counseling patients. For patients who receive a genetic diagnosis early in life, their genotypes should never be used to predict clinical outcomes unless there is an accurate genotype-phenotype correlation.
Conclusion
TSC1 or TSC2 variants are key causes of TSC. The overall mutation rate of the TSC patients in our cohort was approximately 86–87%. TSC exhibits variability in clinical findings, with TSC2 variants producing a more severe phenotype than that observed in patients with TSC1 variants or NMI. Compared with TSC1 patients and NMI patients, those with TSC2 variants have a greater chance of developing renal abnormalities, intracranial lesions, and skin diseases, and their age at the onset of epilepsy is younger.
Data Availability Statement
The genotyping data generated for this study can be found in the LOVD database (https://databases.lovd.nl/shared/variants?search_owned_by_=%3D%22Yifeng%20Ding%22), with associated accession numbers ranging from #0000642979 to #0000643105, #0000642877, #0000642883, #0000642972, #0000642973, #0000642974, and #0000642976. The whole exome sequencing data cannot be made publicly available because it is not allowed according to the national requirements about human genetic resource of research: The Regulations of the People’s Republic of China on the Management of Human Genetic Resources (http://www.moj.gov.cn/government_public/content/2019-06/10/593_236557.html). Requests to access the datasets should be directed to corresponding author.
Ethics Statement
Our research was carried out in accordance with the Declaration of Helsinki and was approved by the Ethics Committee of the Fudan University Children’s Hospital. Written informed consent to participate in this study was provided by the participants’ legal guardian/next of kin.
Author Contributions
YD and YW designed the research. YD, JW, SZ, YZ, LZ, and LY performed the collection and analysis of data. YW wrote the manuscript and approved the submitted version.
Funding
This research was funded by the Key Research Project of the Ministry of Science and Technology of China (Grant No. 2016YFC0904400).
Conflict of Interest
The authors declare that the research was conducted in the absence of any commercial or financial relationships that could be construed as a potential conflict of interest.
Acknowledgments
We thank the many wonderful families affected by tuberous sclerosis who participated in this research because it would not have been possible without their help. We also thank Dr. Bing-bing Wu for help with the genetic analysis.
Supplementary Material
The Supplementary Material for this article can be found online at: https://www.frontiersin.org/articles/10.3389/fgene.2020.00204/full#supplementary-material
Abbreviations
MLPA, multiplex ligation-dependent probe amplification; mTOR, mammalian target of rapamycin; NMI, no variants identified; SDs, standard deviations; SENs, subependymal nodules; TAND, tuberous sclerosis-associated neuropsychiatric disorders; TSC, tuberous sclerosis complex; WES, whole-exome sequencing.
Footnotes
References
Au, K. S., Williams, A. T., Gambello, M. J., and Northrup, H. (2004). Molecular genetic basis of tuberous sclerosis complex: from bench to bedside. J. Child Neurol. 19, 699–709. doi: 10.1177/08830738040190091101
Au, K. S., Williams, A. T., Roach, E. S., Batchelor, L., Sparagana, S. P., Delgado, M. R., et al. (2007). Genotype/phenotype correlation in 325 individuals referred for a diagnosis of tuberous sclerosis complex in the United States. Genet. Med. 9, 88–100. doi: 10.1097/gim.0b013e31803068c7
Cheadle, J. P., Reeve, M. P., Sampson, J. R., and Kwiatkowski, D. J. (2000). Molecular genetic advances in tuberous sclerosis. Hum. Genet. 107, 97–114. doi: 10.1007/s004390000348
Crino, P. B., Nathanson, K. L., and Henske, E. P. (2006). The tuberous sclerosis complex. N. Engl. J. Med. 355, 1345–1356. doi: 10.1056/NEJMra055323
Curatolo, P., Bombardieri, R., and Jozwiak, S. (2008). Tuberous sclerosis. Lancet 372, 657–668. doi: 10.1016/S0140-6736(08)61279-9
Dabora, S. L., Jozwiak, S., Franz, D. N., Roberts, P. S., Nieto, A., Chung, J., et al. (2001). Mutational analysis in a cohort of 224 tuberous sclerosis patients indicates increased severity of TSC2, compared with TSC1, disease in multiple organs. Am. J. Hum. Genet. 68, 64–80. doi: 10.1086/316951
de Vries, P. J., Belousova, E., Benedik, M. P., Carter, T., Cottin, V., Curatolo, P., et al. (2018). TSC-associated neuropsychiatric disorders (TAND): findings from the TOSCA natural history study. Orphanet J. Rare Dis. 13:157. doi: 10.1186/s13023-018-0901-8
Franz, D. N., and Krueger, D. A. (2018). mTOR inhibitor therapy as a disease modifying therapy for tuberous sclerosis complex. Am. J. Med. Genet. C Semin. Med. Genet. 178, 365–373. doi: 10.1002/ajmg.c.31655
Han, J. M., and Sahin, M. (2011). TSC1/TSC2 signaling in the CNS. FEBS Lett. 585, 973–980. doi: 10.1016/j.febslet.2011.02.001
Henske, E. P., Jóźwiak, S., Kingswood, J. C., Sampson, J. R., and Thiele, E. A. (2016). Tuberous sclerosis complex. Nat. Rev. Dis. Primers 2:16035. doi: 10.1038/nrdp.2016.35
Kozlowski, P., Roberts, P., Dabora, S., Franz, D., Bissler, J., Northrup, H., et al. (2007). Identification of 54 large deletions/duplications in TSC1 and TSC2 using MLPA, and genotype-phenotype correlations. Hum. Genet. 121, 389–400. doi: 10.1007/s00439-006-0308-9
Northrup, H., and Krueger, D. A. (2013). Tuberous sclerosis complex diagnostic criteria update: recommendations of the 2012 international tuberous sclerosis complex consensus conference. Pediatr. Neurol. 49, 243–254. doi: 10.1016/j.pediatrneurol.2013.08.001
Peron, A., and Northrup, H. (2018). Tuberous sclerosis complex. Am. J. Med. Genet. C Semin. Med. Genet. 178, 274–277. doi: 10.1002/ajmg.c.31657
Plank, T. L., Yeung, R. S., and Henske, E. P. (1998). Hamartin, the product of the tuberous sclerosis 1 (TSC1) gene, interacts with tuberin and appears to be localized to cytoplasmic vesicles. Cancer Res. 58, 4766–4770.
Richards, S., Aziz, N., Bale, S., Bick, D., Das, S., Gastier-Foster, J., et al. (2015). Standards and guidelines for the interpretation of sequence variants: a joint consensus recommendation of the American College of Medical genetics and genomics and the association for molecular pathology. Genet. Med. 17, 405–424. doi: 10.1038/gim.2015.30
Sancak, O., Nellist, M., Goedbloed, M., Elfferich, P., Wouters, C., Maat-Kievit, A., et al. (2005). Mutational analysis of the TSC1 and TSC2 genes in a diagnostic setting: genotype–phenotype correlations and comparison of diagnostic DNA techniques in Tuberous Sclerosis Complex. Eur. J. Hum. Genet. 13, 731–741. doi: 10.1038/sj.ejhg.5201402
van Slegtenhorst, M., Nellist, M., Nagelkerken, B., Cheadle, J., Snell, R., van den Ouweland, A., et al. (1998). Interaction between hamartin and tuberin, the TSC1 and TSC2 gene products. Hum. Mol. Genet. 7, 1053–1057. doi: 10.1093/hmg/7.6.1053
Yang, G., Shi, Z. N., Meng, Y., Shi, X. Y., Pang, L. Y., Ma, S. F., et al. (2017). Phenotypic and genotypic characterization of Chinese children diagnosed with tuberous sclerosis complex. Clin. Genet. 91, 764–768. doi: 10.1111/cge.12920
Keywords: tuberous sclerosis complex, genotype, phenotype, children, Chinese
Citation: Ding Y, Wang J, Zhou S, Zhou Y, Zhang L, Yu L and Wang Y (2020) Genotype and Phenotype Analysis of Chinese Children With Tuberous Sclerosis Complex: A Pediatric Cohort Study. Front. Genet. 11:204. doi: 10.3389/fgene.2020.00204
Received: 24 September 2019; Accepted: 21 February 2020;
Published: 10 March 2020.
Edited by:
Merlin G. Butler, University of Kansas Medical Center, United StatesReviewed by:
Paolo Curatolo, University of Rome Tor Vergata, ItalyGemma Louise Carvill, Northwestern University, United States
Copyright © 2020 Ding, Wang, Zhou, Zhou, Zhang, Yu and Wang. This is an open-access article distributed under the terms of the Creative Commons Attribution License (CC BY). The use, distribution or reproduction in other forums is permitted, provided the original author(s) and the copyright owner(s) are credited and that the original publication in this journal is cited, in accordance with accepted academic practice. No use, distribution or reproduction is permitted which does not comply with these terms.
*Correspondence: Yi Wang, eWl3YW5nQHNobXUuZWR1LmNu