 Chenglong Zhu1†
 Wenjie Xu1†
 Jianchuan Li2†Chang Liu1Mingliang Hu1Yuan Yuan1Ke Yuan1Yijiuling Zhang1Xingzhi Song1Jin Han1*
 Xinxin Cui1*
- 1School of Ecology and Environment, Northwestern Polytechnical University, Xi'an, China
- 2Department of Animal Resources, Tibet Plateau Institute of Biology, Lhasa, China
Introduction
Species in the bear genus are well-known for their adaptation to various environments; examples are the polar bear from the Arctic (Thiemann et al., 2008), the sun bear from rainforests (Linkie et al., 2007), and the Tibetan black bear, which inhabits the Qinghai-Tibet Plateau (QTP) (Liu, 2004). The QTP is known as the “Third Pole” since it is the largest and highest plateau in the world, with an average altitude of 4,500 m above sea level. Like the polar regions, the environment of the QTP is inimical to living organisms due to the low temperature and low level of oxygen. Large mammals, such as humans and taurine cattle, usually suffer from severe pulmonary hypertension when inhabiting high altitudes (Wu et al., 2007). Previous studies on indigenous species of the QTP have found many adaptive changes in the genes and pathways related to hypoxia responses, oxygen transport, etc. (Qiu et al., 2012). However, when bears arrived on the QTP and how they have been able to survive and thrive there remains largely unknown.
The Tibetan black bear (Ursus thibetanus thibetanus) is a subspecies of the Asiatic black bear (Ursus thibetanus) and is one of the four known bear species living on the QTP (Lan et al., 2017). Tibetan black bears are typical forest animals. They are omnivorous but feed mainly on plants. Their sense of smell and hearing are very sensitive. Most Tibetan black bears rely on hibernation to survive the cold and lack of food in winter (Liu, 2004). In recent years, due to the expansion of human activity and poaching, the Tibetan black bear has experienced a rapid population reduction. It is now classified as a vulnerable species by the International Union for Conservation of Nature (IUCN).
Here, we report a high-quality genome assembly for the Tibetan black bear based on 10 × genomic sequencing technology. This assembly and associated resources will serve as an important genetic resource for specialize, species protection, and the evolution of the bear genus.
Data
The 10 × genomic sequencing technology was applied in this project. After filtering out the redundant and low-quality reads, a total of 270 Gb bases were used for the following analysis (Table 1 and Table S1). The draft genome has a size of 2.37 Gb, which is close to the estimated genome size of 2.36 Gb (Table 1, Figure 1A, Table S2). We aligned the sequenced reads with the reference genome and found that most bases (98.42%) were covered by more than 20 reads (Figure 1B). The genome assembly had the longest scaffold of 78,658,804 bp and scaffold N50 and contig N50 sizes of 26.80 Mb and 145.97 Kb, respectively (Table S2). The longest 27 and 107 scaffolds occupied 50% and 90% of all sequences, suggesting a high level of continuity.Using the mammalian gene set, BUSCO integrity assessment gave a value of 95.9% (Table S3), indicating a high level of completeness.
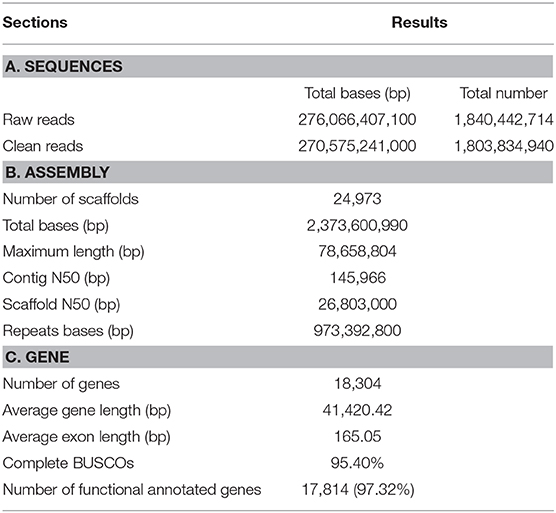
Table 1. Summary information of genome assembly and gene annotation.
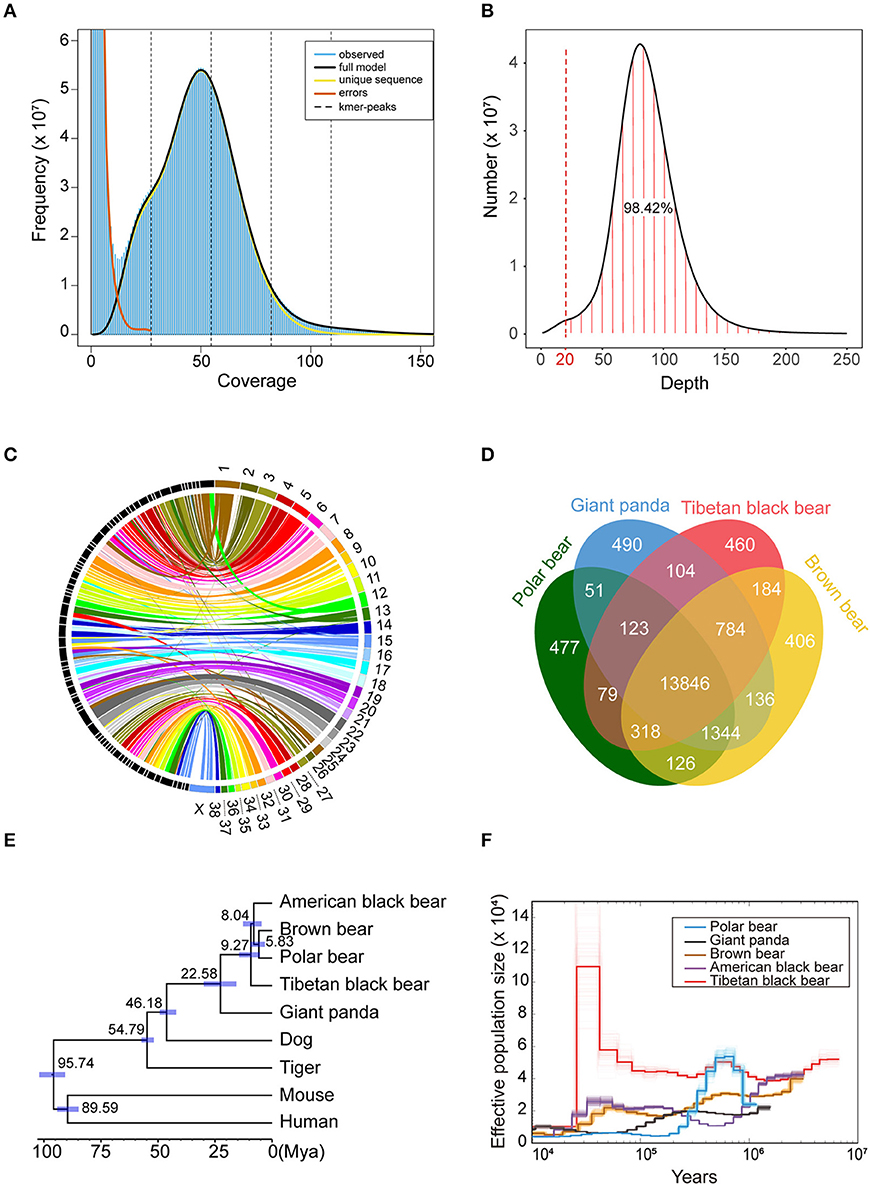
Figure 1. Comparative genomics of Tibetan black bear. (A) The input file of GenomeScope was generated by Jellyfish v2.2.6 with a k-mer size of 39. The estimated heterozygosity of the Tibetan black bear was 0.358%, and the estimated genome size was 2.36 Gb. (B) Distribution of sequencing depth across the whole genome assembly. A total of 98.42% of the genome sites have more than 20 coverage depths. (C) Conversation of syntenic relationships between the Tibetan black bear and dog chromosomes. The colored part on the right side of the picture refers to the chromosome sets of the dog genome, and the black part on the left side refers to the longest 74 scaffolds of the Tibetan black bear genome. The middle lines refer the collinearity of homology between the two species. (D) A Venn plot of the orthologous genes families found by OrthoFinder of four Ursidae species (Polar bear, Giant panda, Tibetan black bear, and Brown bear). (E) Phylogenetic relationships, and divergence time of nine species. The phylogenetic tree was derived from RAxML analysis, with all nodes having a bootstrap support value 100. Divergence times were estimated using MCMCtree in PAML package and are shown with 95% confidence intervals (blue bar). (F) Demographic history of five bear species based on PSMC software with 100 bootstraps.
To further check the quality of this genome assembly, we aligned the Tibetan black bear genome with the dog (Canis lupus familiaris) genome (Figure 1C), which was the closest species with a chromosome-level assembly currently available. We found that some scaffolds from the Tibetan black bear genome essentially matched the dog genome at the chromosome level; for example, Scaffold00001, Scaffold00008, and Scaffold00021 corresponded to chr22, chr23, and chr31 of the dog genome assembly, respectively. We also observed evidence for several potential chromosome rearrangement events in the Tibetan black bear, including chr13 and chr28 in the dog, which appeared to lie together in the Tibetan black bear genome (Table S4).
About 41.01% of the genome assembly was estimated to be repetitive sequences, a value similar to those in the panda and dog, and LINEs occupied the largest percentage (25.02%) of repeat regions (Table S5). Using a combination of de novo prediction and homologous prediction, we found a total of 18,304 protein-coding genes (Table 1); of these, a total of 17,814 (97.32%) genes were found to have functional annotation in at least one of the databases mentioned above (Table S6). We compared our gene set with those from other species with respect to average gene length, average CDS length, average exon number, average exon length, and average intron length; all results were comparable to those from other species (Table S7). The BUSCO results also indicated the completeness of our gene set, with a BUSCO value of 95.4% (complete = 95.4%, single = 94.0%, duplicated = 1.4%, fragmented = 2.6%, missed = 2.0%, genes = 4,104).
We compared the gene sets of the Tibetan black bear, panda, polar bear, and brown bear and identified a total of 18,927 gene families. Within them, we found 460 species-specific genes in the Tibetan black bear, which was similar to the numbers in other bear species (Figure 1D). Using 5,229 1:1 orthologous genes between nine species, we reconstructed their phylogenetic relationships (Figure 1E). The Tibetan black bear was found to be an outgroup relative to the American black bear, the brown bear, and the polar bear, indicating a paraphyletic relationship for the black bear species, which is in concordance with a previous study (Kumar et al., 2017). The divergence time between the Tibetan black bear and the common ancestor of the polar bear, brown bear, and American black bear was estimated to take place at 9.27 million years ago (Figure 1E). Here, we found that the population history of the polar bear and American black bear was consistent with the previous research (Miller et al., 2012). Interestingly, we found that Tibetan black bear once experienced a significant population growth compared to other bear species after 100,000 years ago (Figure 1F).
Materials and Methods
Sample Collection, Library Construction, and Sequencing
We obtained muscle samples from a naturally dying female Tibetan black bear in the Lang county of Tibet, which has an average elevation of about 3,000 m, in 2018. The samples were thoroughly ground, and high molecular weight DNA was isolated using a RecoverEase DNA Isolation Kit (Agilent, PN 720203, San Clara, USA) with minor modifications to the manufacturer's protocol. We then followed the standard process for construction of a Chromium library. The 150 bp pair-end DNA nanospheres used for sequencing were prepared according to a previously published protocol (Drmanac et al., 2010), and the standard cyclic amplification procedure was performed on a NovaSeq 6000. The final raw sequencing file was converted to fastq format using the Supernova v2.0.0 software package (Weisenfeld et al., 2017) with default parameters for subsequent analysis (Figure S1).
Genome Size Estimation and Genome Assembly
To predict the size of the Tibetan black bear genome, we firstly used Jellyfish v2.2.6 (Marçais and Kingsford, 2011) to count the kmer frequency with a kmer size of 39. GenomeScope web tools (parameters: Kmer length 39, Read length 150) (Vurture et al., 2017) were employed to predict the genome size, and the resulting value was around 2.36 Gb. The draft genome was assembled by the Supernova v2.0.0 software using the recommended pipeline (parameters: mkoutput -style = pseudohap - minsize = 500). Burrows-Wheeler Aligner (BWA, v0.7.15) (Li and Durbin, 2009) was used to confirm the single-base accuracy of the draft assembly with default parameters. A Benchmarking Universal Single-Copy Orthologs (BUSCO, v3.0.2) (Simao et al., 2015) analysis was applied to evaluate the completeness of the gene set in our draft genome with the library “mammalia_odb9”.
Conversation of Syntenic Relationship With Dog Genome
To validate the completeness of our assembly, we compared our scaffolds to the dog chromosome set (GCF_000002285.3)1. Specifically, those 74 Tibetan black bear scaffolds at least 10 Mbp in length (total length ~1.92 Gb) were aligned to the dog chromosomes using LAST v942 (parameters: -E0.05) (Kielbasa et al., 2011). The best one-to-one sequence alignment for each was identified and extracted with a length of at least 10 Kb. The start and end positions of the 74 matching scaffolds that fit these criteria were then used to generate a CIRCOS plot (http://circos.ca/, accessed at Mar. 18, 2018) (Krzywinski et al., 2009), which showed regions of collinearity as well as rearrangements.
Genome Annotation
A combined approach using de novo and homology-based prediction was carried out to annotate our draft genome (Wang et al., 2019). RepeatModeler v1.0.8 (http://www.repeatmasker.org/RepeatModeler, accessed at Jan. 31, 2015) was used to construct the de novo repeat library, and RepeatMasker v3.3.0 (Tarailo-Graovac and Chen, 2009) was employed to produce a homolog-based repeat library with default parameters. Tandem Repeats Finder v4.07 (Benson, 1999) was used to search for tandem repeat elements (parameters: 2 7 7 80 10 50 500 -d -h -ngs).
A soft-masked genome was prepared using RepeatMasker. We firstly used Augustus v3.2.1 (parameters: -species=human) (Stanke et al., 2008), GeneID v1.4.4 (parameters: -3 -P human3isoU12.param) (Alioto et al., 2018), and GlimmerHMM v3.0.3 (parameters: default) (Majoros et al., 2004) software to generate a de novo structure gene library. We then combined protein-coding genes from five species—human (Homo sapiens, GCF_000001405.38)2, dog (Canis lupus familiaris, GCF_000002285.3), giant panda (Ailuropoda melanoleuca, GCF_000004335.2)3, mouse (Mus musculus, GCA_000001635.8)4, and polar bear (Ursus maritimus, GCF_000687225.1)5—to perform homology-based gene structure prediction. To begin with, proteins from all five species were aligned with our draft genome using tBLASTN (Altschul et al., 1990) to get the rough positions of homologous genes. More accurate identification of their positions was carried out by exonerate v2.2 (parameters: -model protein2genome -percent 50 -softmasktarget T) (Slater and Birney, 2005). Finally, EVidenceModeler v1.1.1 (Haas et al., 2008) was executed to integrate homologs and de novo predicted genes with default parameters. Afterwards, we filtered out short low-quality genes encoding no more than 50 amino acids and genes exhibiting premature termination.
Gene function annotation was performed using InterProScan v5.30-69.0 (Jones et al., 2014) to search for domains or motifs in public databases [InterPro (Mulder and Apweiler, 2007), Gene Ontology (Ashburner et al., 2000), Pfam, SUPERFAMILY, and Panther] and KAAS web tools (Moriya et al., 2007) to search in the Kyoto Encyclopedia of Genes and Genomes database (KEGG) (Kanehisa and Goto, 2000).
Reconstruction of Phylogenetic Relationships
The gene sets from nine species—human, mouse, dog, giant panda, polar bear, tiger (Panthera tigris, GCF_000464555.1)6, brown bear (Ursus arctos, GCF_003584765.1)7, American black bear (Ursus americanus, GCA_003344425.1)8 (Srivastava et al., 2019), and Tibetan black bear—were used for gene clustering. We identified clusters for all protein-coding genes using OrthoFinder v2.3.4 (Emms and Kelly, 2015) with default parameters. A Venn plot of four Ursidae species was constructed using the OrthoVenn2 webserver (Xu et al., 2019).
One-to-one orthologous gene families were detected based on the gene clusters from these nine species using the result of OrthoFinder. To reconstruct the phylogenetic relationships among these animals, multiple alignments of the genes within each single-copy gene family were performed using MUSCLE 3.8.31 (Edgar, 2004), and then the Perl script pan2nal.pl (Suyama et al., 2006) was used to convert amino acid alignment to codon alignment. Only 4-fold-degenerate sites were extracted in order to reconstruct a precise phylogenetic tree. After alignment with ClustalW2 (parameters: -CONVERT -TYPE=DNA) (McWilliam et al., 2013), the phylogenetic analysis was performed in RAXML 8.2.4 (parameters: -m GTRGAMMA -f a -x 12345 -N 100 -p 12345) (Stamatakis, 2014) for each alignment. Divergence time estimations were determined using MCMCTree (part of the PAML package) (Yang, 2007) with a correlated rate clock model. The calibration time was obtained from www.timetree.org (accessed at May 30, 2019), which gave human/mouse, human/dog, dog/tiger, and dog/brown bear divergence times as 85–97, 91–101, 51–56, and 42–48 million years ago (Mya), respectively. The analysis was run twice to make sure that the result was reliable.
Population History
Pairwise sequential Markovian coalescent (PSMC) analysis (Li and Durbin, 2011), based on a hidden Markov model, was used to estimate the history of effective population sizes based on genome-wide heterozygous sequence data. The BWA-MEM algorithm (BWA v0.7.15) (Li, 2013) was used to align the clean genome sequence reads to the reference genome with default parameters. Then, by using a combination of SAMtools/BCFtools (Li et al., 2009) with PSMC recommend parameters, we obtained the consensus diploid sequences. Finally, PSMC software was run with 100 bootstraps to generate the effective population history plot. We also downloaded polar bear (SRR942298)9, giant panda (SRR504890)10, American black bear (SRR518723)11, and brown bear (SRR935621)12 resequencing data from NCBI. The same pipeline was run. The generation time and substitution rate were 11 years and 1.82e-8 per site per generation, respectively (Benazzo et al., 2017).
Data Availability Statement
The whole genome sequencing data were submitted to the NCBI Sequence Read Archive (SRA) database with accession number SRP22444413 and Bioproject accession PRJNA573607. The assembled draft genome of Tibetan black bear has been deposited at GenBank with accession WEIE00000000. The annotation files of Tibetan black bear have been published 9 10 11 12 13 on Figshare repository with https://doi.org/10.6084/m9.figshare.11787252.v1.
Ethics Statement
Ethical review and approval was not required for the animal study because The Tibetan black bear that died of natural causes was not applicable for animal ethic. Usage of the tissue samples in our study was approved by the government of China.
Author Contributions
XC and JH designed and supervised the project. JL, MH, YZ, and KY prepared the samples. CZ, WX, CL, XS, and YY analyzed the data. CZ, WX, and JL wrote the manuscript with other authors' help and XC and JH revised the manuscript. All authors read and approved the final manuscript.
Funding
This study was supported by Research Funds for Interdisciplinary subject, NWPU (19SH030408).
Conflict of Interest
The authors declare that the research was conducted in the absence of any commercial or financial relationships that could be construed as a potential conflict of interest
Supplementary Material
The Supplementary Material for this article can be found online at: https://www.frontiersin.org/articles/10.3389/fgene.2020.00231/full#supplementary-material
Footnotes
1. ^NCBI Assembly, https://www.ncbi.nlm.nih.gov/assembly/GCF_000002285.3 (2011).
2. ^NCBI Assembly, https://www.ncbi.nlm.nih.gov/assembly/GCF_000001405.38 (2017).
3. ^NCBI Assembly, https://www.ncbi.nlm.nih.gov/assembly/GCF_000004335.2 (2009).
4. ^NCBI Assembly, https://www.ncbi.nlm.nih.gov/assembly/GCA_000001635.8 (2017).
5. ^NCBI Assembly, https://www.ncbi.nlm.nih.gov/assembly/GCF_000687225.1/ (2014).
6. ^NCBI Assembly, https://www.ncbi.nlm.nih.gov/assembly/GCF_000464555.1 (2013).
7. ^NCBI Assembly, https://www.ncbi.nlm.nih.gov/assembly/GCF_003584765.1 (2018).
8. ^NCBI Assembly, https://www.ncbi.nlm.nih.gov/assembly/GCA_003344425.1 (2018).
9. ^NCBI Sequence Read Archive, https://www.ncbi.nlm.nih.gov/sra/SRR942298 (2015).
10. ^NCBI Sequence Read Archive, https://www.ncbi.nlm.nih.gov/sra/SRR504890 (2012).
11. ^NCBI Sequence Read Archive, https://www.ncbi.nlm.nih.gov/sra/SRR518723 (2015).
12. ^NCBI Sequence Read Archive, https://www.ncbi.nlm.nih.gov/sra/SRR935621 (2015).
13. ^NCBI Sequence Read Archive, http://identifiers.org/ncbi/insdc.sra:SRP224444 (2019).
References
Alioto, T., Blanco, E., Parra, G., and Guigo, R. (2018). Using geneid to identify genes. Curr. Protoc. Bioinformatics 64:e56. doi: 10.1002/cpbi.56
Altschul, S. F., Gish, W., Miller, W., Myers, E. W., and Lipman, D. J. (1990). Basic local alignment search tool. J. Mol. Biol. 215, 403–410. doi: 10.1016/s0022-2836(05)80360-2
Ashburner, M., Ball, C. A., Blake, J. A., Botstein, D., Butler, H., Cherry, J. M., et al. (2000). Gene ontology: tool for the unification of biology. The Gene Ontology Consortium. Nat. Genet. 25, 25–29. doi: 10.1038/75556
Benazzo, A., Trucchi, E., Cahill, J. A., Maisano Delser, P., Mona, S., Fumagalli, M., et al. (2017). Survival and divergence in a small group: the extraordinary genomic history of the endangered Apennine brown bear stragglers. Proc. Natl. Acad. Sci. U.S.A. 114, E9589–E9597. doi: 10.1073/pnas.1707279114
Benson, G. (1999). Tandem repeats finder: a program to analyze DNA sequences. Nucleic Acids Res. 27, 573–580. doi: 10.1093/nar/27.2.573
Drmanac, R., Sparks, A. B., Callow, M. J., Halpern, A. L., Burns, N. L., Kermani, B. G., et al. (2010). Human genome sequencing using unchained base reads on self-assembling DNA nanoarrays. Science 327, 78–81. doi: 10.1126/science.1181498
Edgar, R. C. (2004). MUSCLE: multiple sequence alignment with high accuracy and high throughput. Nucleic Acids Res. 32, 1792–1797. doi: 10.1093/nar/gkh340
Emms, D. M., and Kelly, S. (2015). OrthoFinder: solving fundamental biases in whole genome comparisons dramatically improves orthogroup inference accuracy. Genome Biol. 16:157. doi: 10.1186/s13059-015-0721-2
Haas, B. J., Salzberg, S. L., Zhu, W., Pertea, M., Allen, J. E., Orvis, J., et al. (2008). Automated eukaryotic gene structure annotation using EVidenceModeler and the Program to Assemble Spliced Alignments. Genome Biol. 9:R7. doi: 10.1186/gb-2008-9-1-r7
Jones, P., Binns, D., Chang, H. Y., Fraser, M., Li, W., McAnulla, C., et al. (2014). InterProScan 5: genome-scale protein function classification. Bioinformatics 30, 1236–1240. doi: 10.1093/bioinformatics/btu031
Kanehisa, M., and Goto, S. (2000). KEGG: kyoto encyclopedia of genes and genomes. Nucleic Acids Res. 28, 27–30. doi: 10.1093/nar/28.1.27
Kielbasa, S. M., Wan, R., Sato, K., Horton, P., and Frith, M. C. (2011). Adaptive seeds tame genomic sequence comparison. Genome Res. 21, 487–493. doi: 10.1101/gr.113985.110
Krzywinski, M., Schein, J., Birol, I., Connors, J., Gascoyne, R., Horsman, D., et al. (2009). Circos: an information aesthetic for comparative genomics. Genome Res. 19, 1639–1645. doi: 10.1101/gr.092759.109
Kumar, V., Lammers, F., Bidon, T., Pfenninger, M., Kolter, L., Nilsson, M. A., et al. (2017). The evolutionary history of bears is characterized by gene flow across species. Sci. Rep. 7:46487. doi: 10.1038/srep46487
Lan, T., Gill, S., Bellemain, E., Bischof, R., Nawaz, M. A., and Lindqvist, C. (2017). Evolutionary history of enigmatic bears in the Tibetan Plateau-Himalaya region and the identity of the yeti. Proc. Biol. Sci. 284:1868. doi: 10.1098/rspb.2017.1804
Li, H. (2013). Aligning sequence reads, clone sequences and assembly contigs with BWA-MEM. arXiv preprint arXiv:13033997.
Li, H., and Durbin, R. (2009). Fast and accurate short read alignment with Burrows-Wheeler transform. Bioinformatics 25, 1754–1760. doi: 10.1093/bioinformatics/btp324
Li, H., and Durbin, R. (2011). Inference of human population history from individual whole-genome sequences. Nature 475, 493–496. doi: 10.1038/nature10231
Li, H., Handsaker, B., Wysoker, A., Fennell, T., Ruan, J., Homer, N., et al. (2009). The Sequence Alignment/Map format and SAMtools. Bioinformatics 25, 2078–2079. doi: 10.1093/bioinformatics/btp352
Linkie, M., Dinata, Y., Nugroho, A., and Haidir, I. A. (2007). Estimating occupancy of a data deficient mammalian species living in tropical rainforests: sun bears in the Kerinci Seblat region, Sumatra. Biol. Conserv. 137, 20–27. doi: 10.1016/j.biocon.2007.01.016
Liu, W. (2004). Study on the ecology and resources of Tibetan black bears. Tibet Sci. Techn. 8, 21–25.
Majoros, W. H., Pertea, M., and Salzberg, S. L. (2004). TigrScan and GlimmerHMM: two open source ab initio eukaryotic gene-finders. Bioinformatics 20, 2878–2879. doi: 10.1093/bioinformatics/bth315
Marçais, G., and Kingsford, C. (2011). A fast, lock-free approach for efficient parallel counting of occurrences of k-mers. Bioinformatics 27, 764–770. doi: 10.1093/bioinformatics/btr011
McWilliam, H., Li, W., Uludag, M., Squizzato, S., Park, Y. M., Buso, N., et al. (2013). Analysis tool web services from the EMBL-EBI. Nucleic Acids Res. 41, W597–W600. doi: 10.1093/nar/gkt376
Miller, W., Schuster, S. C., Welch, A. J., Ratan, A., Bedoya-Reina, O. C., Zhao, F., et al. (2012). Polar and brown bear genomes reveal ancient admixture and demographic footprints of past climate change. Proc. Natl. Acad. Sci. U.S.A. 109, E2382–2390. doi: 10.1073/pnas.1210506109
Moriya, Y., Itoh, M., Okuda, S., Yoshizawa, A. C., and Kanehisa, M. (2007). KAAS: an automatic genome annotation and pathway reconstruction server. Nucleic Acids Res. 35, W182–W185. doi: 10.1093/nar/gkm321
Mulder, N., and Apweiler, R. (2007). InterPro and InterProScan: tools for protein sequence classification and comparison. Methods Mol. Biol. 396, 59–70. doi: 10.1007/978-1-59745-515-2_5
Qiu, Q., Zhang, G., Ma, T., Qian, W., Wang, J., Ye, Z., et al. (2012). The yak genome and adaptation to life at high altitude. Nat. Genet. 44, 946–949. doi: 10.1038/ng.2343
Simao, F. A., Waterhouse, R. M., Ioannidis, P., Kriventseva, E. V., and Zdobnov, E. M. (2015). BUSCO: assessing genome assembly and annotation completeness with single-copy orthologs. Bioinformatics 31, 3210–3212. doi: 10.1093/bioinformatics/btv351
Slater, G. S., and Birney, E. (2005). Automated generation of heuristics for biological sequence comparison. BMC Bioinformatics 6:31. doi: 10.1186/1471-2105-6-31
Srivastava, A., Kumar Sarsani, V., Fiddes, I., Sheehan, S. M., Seger, R. L., Barter, M. E., et al. (2019). Genome assembly and gene expression in the American black bear provides new insights into the renal response to hibernation. DNA Res. 26, 37–44. doi: 10.1093/dnares/dsy036
Stamatakis, A. (2014). RAxML version 8: a tool for phylogenetic analysis and post-analysis of large phylogenies. Bioinformatics 30, 1312–1313. doi: 10.1093/bioinformatics/btu033
Stanke, M., Diekhans, M., Baertsch, R., and Haussler, D. (2008). Using native and syntenically mapped cDNA alignments to improve de novo gene finding. Bioinformatics 24, 637–644. doi: 10.1093/bioinformatics/btn013
Suyama, M., Torrents, D., and Bork, P. (2006). PAL2NAL: robust conversion of protein sequence alignments into the corresponding codon alignments. Nucleic Acids Res. 34, W609–W612. doi: 10.1093/nar/gkl315
Tarailo-Graovac, M., and Chen, N. (2009). Using RepeatMasker to identify repetitive elements in genomic sequences. Curr. Protoc. Bioinformatics Chapter 4, Unit 4.10. doi: 10.1002/0471250953.bi0410s25
Thiemann, G. W., Iverson, S. J., and Stirling, I. (2008). Polar bear diets and Arctic marine food webs: insights from fatty acid analysis. Ecol. Monogr. 78, 591–613. doi: 10.1890/07-1050.1
Vurture, G. W., Sedlazeck, F. J., Nattestad, M., Underwood, C. J., Fang, H., Gurtowski, J., et al. (2017). GenomeScope: fast reference-free genome profiling from short reads. Bioinformatics 33, 2202–2204. doi: 10.1093/bioinformatics/btx153
Wang, X., Xu, W., Wei, L., Zhu, C., He, C., Song, H., et al. (2019). Nanopore sequencing and de novo assembly of a black-shelled Pacific oyster (Crassostrea gigas) genome. Front. Genet. 10:1211. doi: 10.3389/fgene.2019.01211
Weisenfeld, N. I., Kumar, V., Shah, P., Church, D. M., and Jaffe, D. B. (2017). Direct determination of diploid genome sequences. Genome Res. 27, 757–767. doi: 10.1101/gr.214874.116
Wu, T. Y., Ding, S. Q., Liu, J. L., Yu, M. T., Jia, J. H., Chai, Z. C., et al. (2007). Who should not go high: chronic disease and work at altitude during construction of the Qinghai-Tibet railroad. High Alt. Med. Biol. 8, 88–107. doi: 10.1089/ham.2007.1015
Xu, L., Dong, Z., Fang, L., Luo, Y., Wei, Z., Guo, H., et al. (2019). OrthoVenn2: a web server for whole-genome comparison and annotation of orthologous clusters across multiple species. Nucleic Acids Res. 47, W52–W58. doi: 10.1093/nar/gkz333
Keywords: Tibetan black bear, 10× genomic sequencing, genome assembly, annotation, evolution
Citation: Zhu C, Xu W, Li J, Liu C, Hu M, Yuan Y, Yuan K, Zhang Y, Song X, Han J and Cui X (2020) Draft Genome Assembly for the Tibetan Black Bear (Ursus thibetanus thibetanus). Front. Genet. 11:231. doi: 10.3389/fgene.2020.00231
Received: 15 November 2019; Accepted: 26 February 2020;
Published: 02 April 2020.
Edited by:
Youri I. Pavlov, University of Nebraska Medical Center, United StatesReviewed by:
Alan Archibald, University of Edinburgh, United KingdomPrashanth N. Suravajhala, Birla Institute of Scientific Research, India
Xuanxuan Xing, The Ohio State University, United States
Copyright © 2020 Zhu, Xu, Li, Liu, Hu, Yuan, Yuan, Zhang, Song, Han and Cui. This is an open-access article distributed under the terms of the Creative Commons Attribution License (CC BY). The use, distribution or reproduction in other forums is permitted, provided the original author(s) and the copyright owner(s) are credited and that the original publication in this journal is cited, in accordance with accepted academic practice. No use, distribution or reproduction is permitted which does not comply with these terms.
*Correspondence: Jin Han, aGFuamluQG53cHUuZWR1LmNu; Xinxin Cui, ZWx2YWN4eEAxNjMuY29t
†These authors have contributed equally to this work