 Jun-Jie Wang1
 Teng Zhang2Qiu-Ming Chen1
 Rui-Qian Zhang3Lan Li3Shun-Feng Cheng3
 Wei Shen3*
 Chu-Zhao Lei1*
- 1Key Laboratory of Animal Genetics, Breeding and Reproduction of Shaanxi Province, College of Animal Science and Technology, Northwest A&F University, Yangling, China
- 2State Key Laboratory of Reproductive Regulation and Breeding of Grassland Livestock, College of Life Sciences, Inner Mongolia University, Hohhot, China
- 3Key Laboratory of Animal Reproduction and Germplasm Enhancement in Universities of Shandong, College of Life Sciences, Qingdao Agricultural University, Qingdao, China
Litter size (LS), an important economic trait in livestock, is so complicate that involves many aspects of reproduction, the underlying mechanism of which particularly in goat has always been scanty. To uncover the genetic basis of LS, the genomic sequence of Jining Gray goat groups (one famous breed for high prolificacy in China) with LS 1, 2, and 3 for firstborn was analyzed, obtaining 563.67 Gb sequence data and a total of 31,864,651 high-quality single nucleotide polymorphisms loci were identified. Particularly, the increased heterozygosity in higher LS groups, and large continuous homozygous segments associated with lower LS group had been uncovered. Through an integrated analysis of three popular methods for detecting selective sweeps (Fst, nucleotide diversity, and Tajima’s D statistic), 111 selected regions and 42 genes associated with LS were scanned genome wide. The candidate genes with highest selective signatures included KIT, KCNH7, and KMT2E in LS2 and PAK1, PRKAA1, and SMAD9 in LS3 group, respectively. Meanwhile, functional terms of programmed cell death involved in cell development and regulation of insulin receptor signaling pathway were mostly enriched with 42 candidate genes, which also included reproduction related terms of steroid metabolic process and cellular response to hormone stimulus. In conclusion, our study identified novel candidate genes involving in regulation of LS in goat, which expand our understanding of genetic fundament of reproductive ability, and the novel insights regarding to LS would be potentially applied to improve reproductive performance.
Introduction
Goat (Capra hircus), one of the most important livestock animals, has been domesticated from wild goat near Fertile Crescent in Middle East around 10,000 years ago (Naderi et al., 2008; Daly et al., 2018). Accompanied by the migration activity of human, the goat exhibited the strong adaptability to diverse environments, and gradually spread all over the world (Benjelloun et al., 2015). To meet human demand, many functional traits, such as dairy, meat, cashmere yield, and reproductive performance, all underwent a long period of natural selection and artificial intervention, ultimately, some specialized goat breeds with high performance of production were generated, which provided abundant genetic resources for modern domesticated goat.
Litter size (LS, numbers of lambing per ewe) is such a complex trait, which involves multiple biological process, including hormone secretion, follicular growth, ovulation, fertilization, embryo implantation, placenta and fetal development, and so on (Feng et al., 2015; Xu et al., 2018). Among which, the ovulation rate and LS are most important (Fogarty, 2009). Previously, more attentions have been attracted in reproductive trait study of sheep, four major prolificacy (that is LS) genes have been identified, that are bone morphogenetic protein receptor 1B (BMPR1B, FecB), bone morphogenetic protein 15 (BMP15, FecX), growth differentiation factor 9 (GDF9, FecG), and beta-1,4-N-acetyl-galactosaminyl transferase 2 (B4GALNT2, FecL) (Polley et al., 2010; Drouilhet et al., 2013; Våge et al., 2013; Abdoli et al., 2016). In particular, it has been proved an extra ovulation increased per estrus for one copy of BMP15 (0.4) and BMPR-1B (1.5) mutation (Davis, 2005; Abdoli et al., 2016; Talebi et al., 2018). Actually, the mutations of GDF9 and BMP15 genes had been verified to be strongly associated with LS trait in sheep (Demars et al., 2013; Våge et al., 2013). Recently, one research of genome-wide association studies (GWAS) in sheep had focused on LS trait, the high- and low-prolificacy sheep breeds were applied to explore the significant variants associated with LS, it revealed amount of candidate single nucleotide polymorphisms (SNPs), including BMPR1B, FBN1, and MMP2 in Wadi sheep, SMAD1 and CTNNB1 in Hu sheep, NCOA1 in Icelandic sheep, FLT1, NF1, PTGS2, and PLCB3 in Finn sheep, ESR2 in Romanov sheep, and ESR1, ETS1, FLI1, SPP1, and MMP15 in Texel sheep (Xu et al., 2018).
Currently, the genetic research on the characteristics of goat is lagging, and the limited information of LS trait in goat mostly derived from reports of sheep, that major in BMPR1B, BMP15, and GDF9 (An et al., 2015a, b; Ahlawat et al., 2016). Besides, there were few association analysis of single gene, for example, the SNPs of POU class 1 homeobox 1 (POU1F1) and KISS1 genes, insertion/deletion (indel) variants of lysine demethylase 6A (KDM6A) and β-Type platelet-derived growth factor receptor (PDGFRB), and transcript variants of catenin beta 1 (CTNNB1) had been reported to be associated with goat LS trait (An et al., 2013; Cui et al., 2018; Zhang X. et al., 2018; Yang et al., 2019; Zhu et al., 2019). Meanwhile, the genome-wide research on goat is also very lacking, only fewer reports showed some novel mutation sites affecting goat reproduction by whole-genome sequence (Guan et al., 2016; Lai et al., 2016). According to Guan et al. (2016), the reproduction-related genes regard to neurohypophysial hormone activity, including PAIP2B, CCDC64, and EPB41L5, had been identified. Also, Lai et al. (2016) revealed a series of candidate genes for fecundity (number of lambs) in Laoshan dairy goats, such as synonymous mutation: MAP3K12, DNMT3B, and SMAD2 and non-synonymous mutation: SETDB2 and CDH26. Moreover, PSEN2 gene, that locates at surrounding transcription start sites, was suggested to be related to goat fecundity, PRP1 and PRP6 genes were discovered to be linked to reproductive hormone with copy number variation (CNV) analysis (Zhang R.-Q. et al., 2018; Zhang et al., 2019).
Jining Gray goat, living in Shandong province of China, is one of the most outstanding local breeds in the world, because of its high fertility performance and it has shorter sexual maturity than other breeds (Miao et al., 2016; Su et al., 2018), thus the breed is the optimal animal model for detection of selection signatures associated with reproductive ability in goat. Several reports have investigated the reproductive performance focused on Jining Gray goat from different aspects (Chu et al., 2011; Shi et al., 2015; Miao et al., 2016; Su et al., 2018), but the variant research in genome-wide has not been reported. Actually, as one kind of low heritability traits in livestock, LS has been hard to improve with traditional selection. Presently, the technologies of genomic selection (GS) in livestock have become the most promising power to improve the traits with low heritability (Cm Dekkers, 2012; Jonas and Koning, 2015). Despite of under development, the implementation of GS in livestock has been effective for increasing the accuracy of estimated breeding values (EBVs), by using the genome-wide SNP in breeding programs, it shortens generation intervals and is more economical (VanRaden et al., 2009; Pryce and Daetwyler, 2012). Regard to this, the effective genetic variants associated with breeds advantage genotypes have to be uncovered, especially in goat.
To elucidate the genetic fundament of LS in goat, 40 Jining Gray goats, with LS of 1 (20 individuals), 2 (14 individuals), and 3 (6 individuals) for firstborn, were performed with the whole-genome sequence at ∼10× coverage in this study. In the result, amounts of whole-genome variants, including SNPs and indel, had been discovered. Meanwhile, the selective sweeps of different LS groups were contributed to screen the regions with strong signatures of selection, and the most candidate genes had been identified within Jining Gray goat population, that provided abundant candidate loci for reproduction improvement in domestic goat.
Materials and Methods
Ethics Statement
All goats in this study were keep feeding in Caoxian Zhengdao Jining Gray goat’ farm in Heze, Shandong, China. The experiment procedures were approved by the Ethics Committee of Northwest A&F University.
Animals
The selected goats were 2∼3 years old female individuals, and the natural mating was arranged with normal reproductive male goats. And the LS information was derived from record of Caoxian Zhengdao Jining Gray goat farm. Total 40 Jining Gray goats were divided into three groups with LS of 1 (20 individuals), 2 (14 individuals), and 3 (6 individuals) for firstborn.
Samples Collection, DNA Extraction, and Whole-Genome Sequence
Ear tissues of selected goats were collected in farm, transferred in sterile centrifuge tube, and stored in library at −80°C. For sequence, the samples were transferred with dry ice to the Beijing Novogene Bioinformatics Technology Co., Ltd. The DNA sample of each individual was extracted and measured following standard experimental procedures to guarantee their quantity. Subsequently, the DNA samples were interrupted randomly to produce fragments of 350 bp, and the library was constructed with a series of steps of end repair, ployA tailed, purification, PCR amplification, and so on. The whole-genomic sequence with paired-end 150 bp strategy was performed by the Illumina NovaSeq 6000 platform (Illumina Inc., San Diego, CA, United States).
Genomic Data Processing and Variants Calling
With the sequence data from company, the Trimmomatic software (version 0.38) (Bolger et al., 2014) was applied to remove adaptors and low-quality reads, and FastQC reports (version 0.11.6) (Andrews, 2010) were generated to check data quality (for statistics information, see Supplementary Table S2). Through BWA software (version 0.7.17) (Li and Durbin, 2009), the clean data were aligned to goat reference genome1 (ARS1) (Bickhart et al., 2017), and the bam and sorted bam files were generated with samtools (version 1.9) (Li et al., 2009). Then, the Genome Analysis Toolkit (GATK, version 4.1.3.0) (McKenna et al., 2010) pipeline was executed with diverse modules for variants calling: briefly, it was prepared with duplicates fix of sorted bam files, then “HaplotypeCaller” module produced the raw variants of gVCF files, and “CombineGVCFs” was carried to merge all raw results as one gVCF file, then “GenotypeGVCFs” module had been operated to consolidate the calling variants to generate VCF file (including SNPs and indels). Finally, the preliminary SNPs and indels were produced with the VCF file by “SelectVariants” mode.
Quality Control and Annotation for Detected SNPs
To guarantee the quality, the raw SNPs were filtered by a series of thresholds with “VariantFiltration” mode of GATK. That is: “QD (Quality score by depth) >2.0 & MQ (Mapping quality score) >40.0 & FS (Phred-scaled p-value using Fisher’s exact test) <60.0 & ReadPosRankSum (Rank Sum Test for relative positioning of reference and alternative alleles within reads) > −8.0 & MQRankSum (Rank sum test for mapping quality of reference and alternative within reads) > −12.5,” which had been widely used to generate the high-quality SNPs for subsequent analysis. To identify the variants function, ANNOVAR software was utilized to annotate the filtered SNPs (version 2018-04-16) (Wang et al., 2010). The SNPs were displayed with circos plot with shinyCircos2 (Yu Y. et al., 2017) and density plot by CMplot package3 in R environment (v 3.6.0).
Population Genetics and LD Analysis
For principal component analysis (PCA), the software of plink (v1.90b4) (Purcell et al., 2007) was performed to prepare the input file (.bed, .bim, .fam) and conduct simple filtering (–geno 0.05), with autosomal SNPs of 95% genotyping rate, gcta64 (v 1.26.0) (Yang et al., 2011) was applied to calculate genetic relationship matrix (–make-grm) and principal component (–pca). And plot was generated with python in local. The neighbor-joining (NJ) phylogenetic tree was constructed by MEGA (v 10.0.5) (Saitou and Nei, 1987; Kumar et al., 2018) software based on the genetic distance-matrix calculating by plink and plotted with iTOL (v 4.4.2) (Letunic and Bork, 2019). Also, the linkage disequilibrium (LD) decay of r2 (a measure of LD, that is squared coefficient of correlation (r) between loci) was carried out with PopLDdecay with general parameter (Zhang C. et al., 2018).
Runs of Homozygosity
The runs of homozygosity (ROH) value was estimated with autosomal SNPs of each individual by plink (v1.90b4). In our research, six criteria were set to define a ROH: a window size of 50 SNPs for scanning; the minimum length of ROH was 200 kb; the required minimum density was 50 kb/SNP; the maximum gap between consecutive homozygous SNPs was 500 kb length; a scanning ROH can contain at most one heterozygous and five missing genotypes; threshold of all scanning windows containing SNP was 0.05. As for assessment, ROH were divided into five categories based on length: 0–0.5 Mb, 0.5–1 Mb, 1–2 Mb, 2–4 Mb, and >4 Mb. All the parameter setting and classification for assessment had referenced other published reports (Peripolli et al., 2017; Onzima et al., 2018; Xu et al., 2019).
Detection of Selective Signatures
In preliminary, the values of pairwise Fst, heterozygosity, allele frequency, nucleotide diversity and Tajima’s D were calculated by vcftools with parameter of “--weir-fst-pop,” “--het,” “--freq,” “--window-pi,” and “--TajimaD” (v 0.1.16) (Danecek et al., 2011). For heterozygosity rate, it was calculated by the formula of (N_SITES-O(HOM))/N_SITES, O(HOM) represents the observed number of homozygous sites of each individual, N_SITES is the total number sites of each individual. With comparisons between diverse LS groups, the selective sweeps analysis was performed according the genetic differentiation (Fst), nucleotide diversity, and Tajima’s D values, which were computed with 100 kb window size and 50 kb step size. And the per window Fst was standardized to Z-transformed Fst [Z(Fst)] based on the formula of “per window Z(Fst) = (per window Fst − mean Fst of all windows)/standard deviation of all windows Fst.” The threshold of Z(Fst) value = 5 was applied to detect the selective regions. Moreover, the highly selected regions were supported by Tajima’s D values of different LS groups and pairwise nucleotide diversity (π). Manhattan plots of Z(Fst) value for comparisons between groups were made with the R package: qqman (Turner, 2014).
Functional Annotation for Candidate Genes
To uncover the biological functions of candidate genes, we performed the Gene Ontology (GO) and Kyoto Encyclopedia of Genes and Genomes (KEGG) enrichment analysis with Metascape (Zhou et al., 2019), a web-based portal for functional enrichment.4 Due to the inadequate database of enrichment analysis in goat, the goat gene symbol IDs were converted into mouse homologous gene symbol IDs through Ensembl website.
Results
Sequence and Variants Detection of Jining Gray Goat
In the present study, we sequenced 40 Jining Gray goats, which were divided into three groups with LS values of 1, 2, and 3 for firstborn. The total 563.67 Gb raw data was generated with average sequence depth >8 of each individual sample (Supplementary Tables S1, S2), and mean depth of LS groups mainly ranged from 9 to 11 (Supplementary Figure S1A). With high mapping rate (over 99%) to reference genome, we called 32,072,110 SNPs, after filtered, we got 31,864,651 SNPs with high quality (Table 1). Among which, the substitution mutations with largest number were C > T and G > A, secondly, A > G and T > C followed (Table 1). Moreover, the densities of SNPs and indels spreading on chromosomes were displayed with circos plot (Figure 1A), which indicated the maximum density of SNPs and indels occurred on chromosomes 18 and 23, respectively.
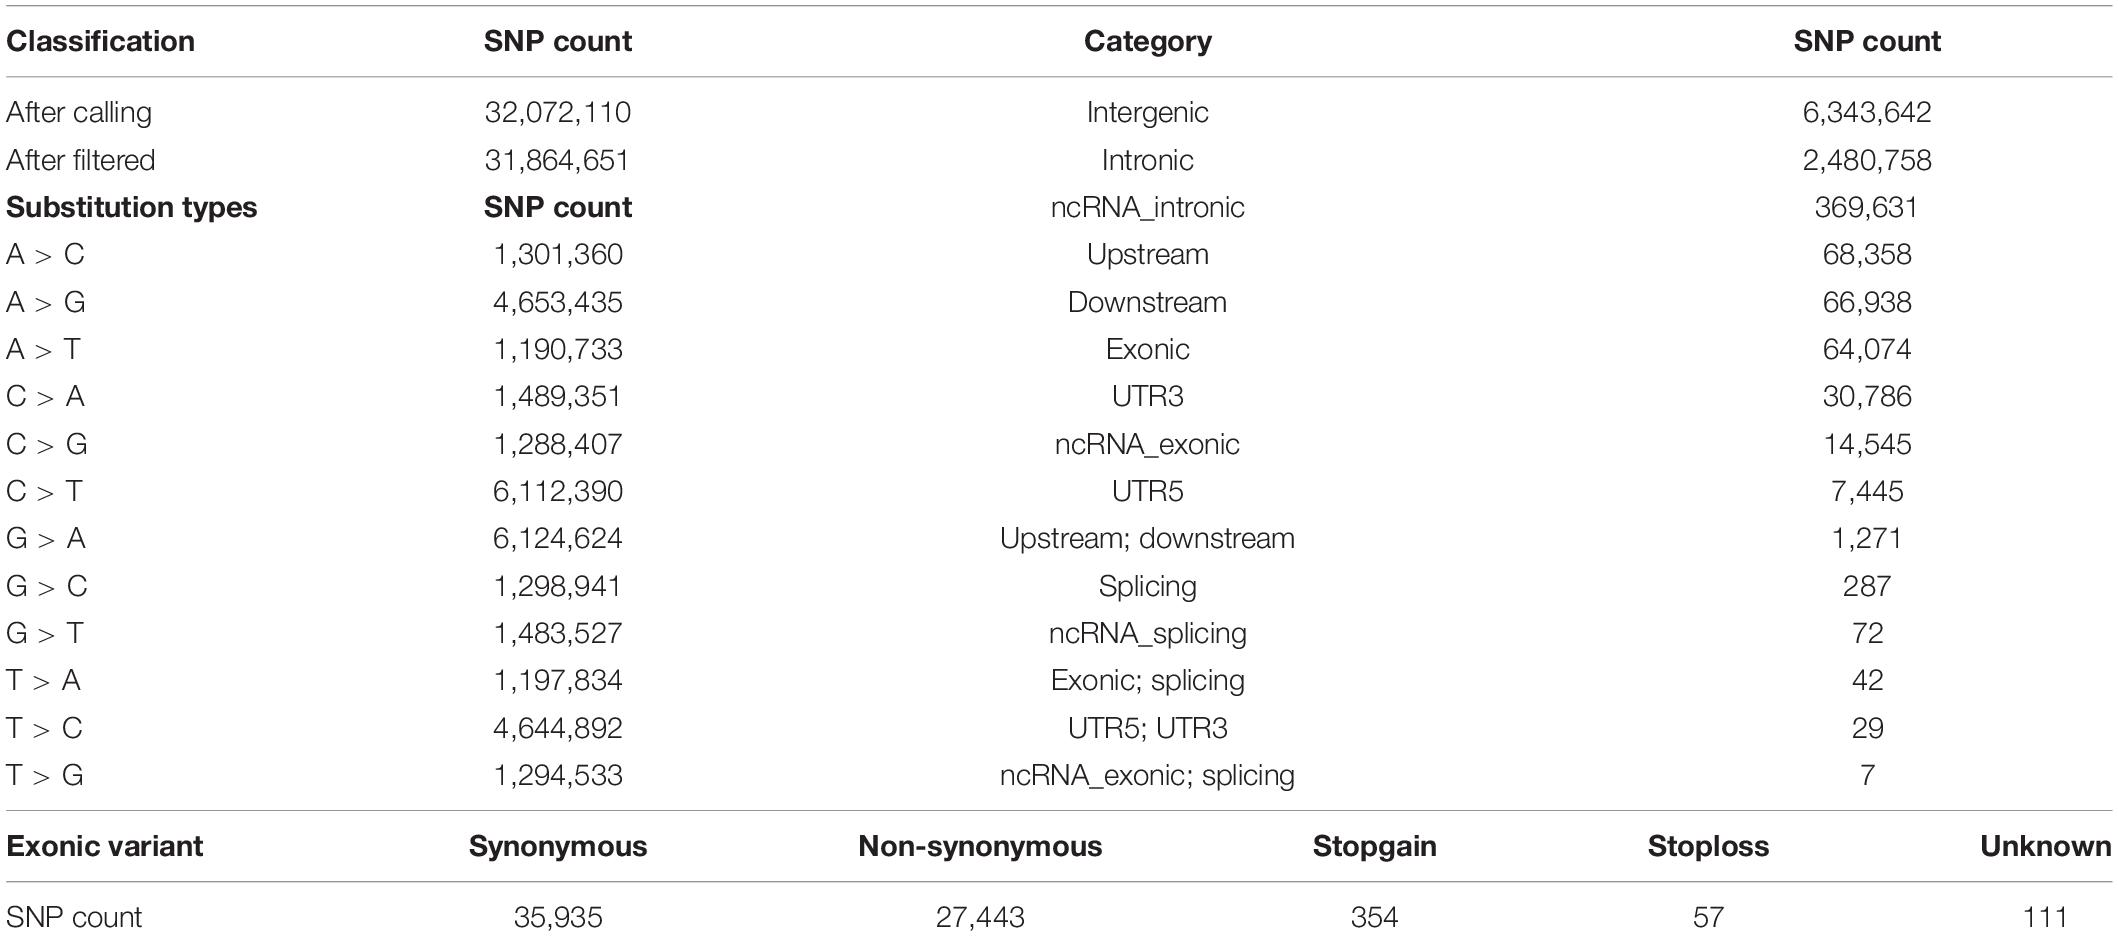
Table 1. SNP statistical information of Jining Gray goat.
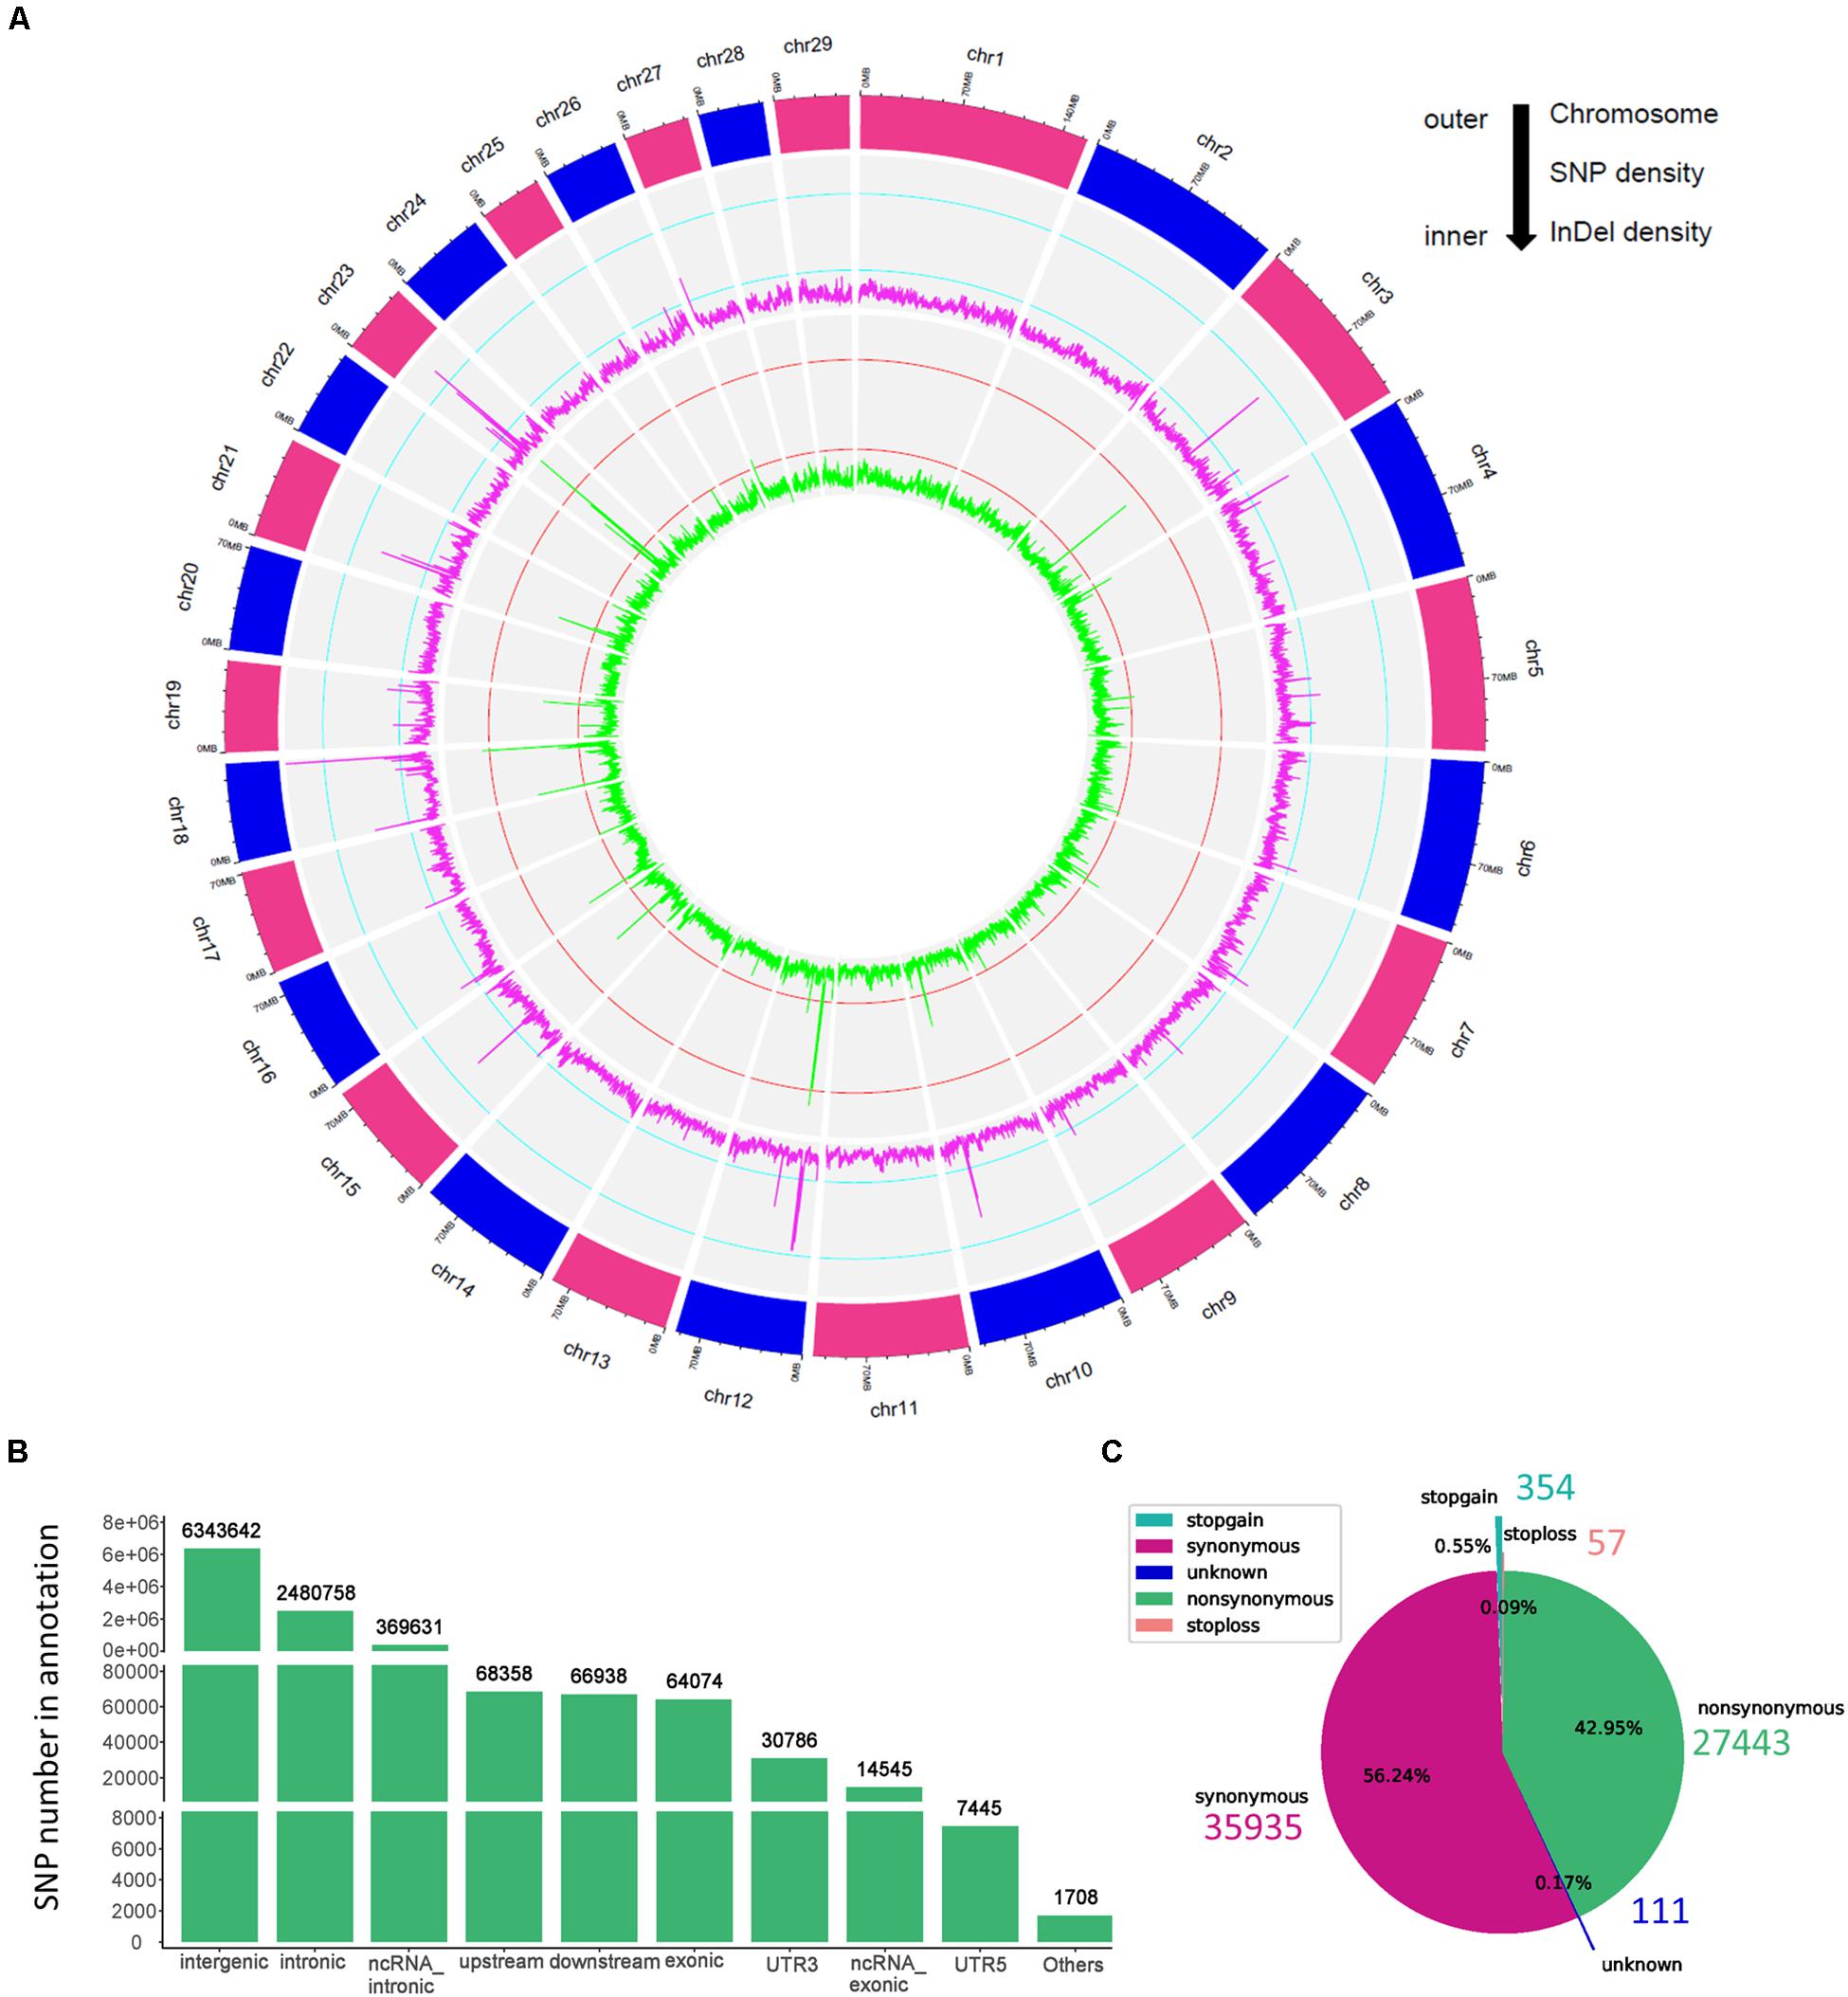
Figure 1. The genomic variants identified and annotated in Jining Gray goat. (A) Circos plot of variants density after filtration. The density of variants was calculated in each 100 kb step size. From outer to inner, the outermost circos depicts each chromosome, the middle displayed the SNP density per window (magenta), and the internal circos meant the indel density per window (green). The cyan and red lines in secondary and third cycle was indicated the 0.25 and 0.75 stack height, respectively. (B) Genomic annotation of SNPs according to ANNOVAR. “Others” contained a few other categories of “upstream; downstream,” “splicing,” “ncRNA_splicing,” “exonic; splicing,” “UTR5; UTR3,” and “ncRNA_exonic; splicing.” (C) The pie plot of annotated SNPs at exonic regions.
Moreover, the high-quality SNPs in autosome reached 28,926,281 Supplementary Figure S1B), and the SNPs number within 1 Mb window size was mainly around 8,000 and high-density SNPs (more than 16,000 in each window) largely distributed at the ends of chromosomes (Supplementary Figure S1C). With annotation, we got 9,447,885 SNPs variant results (29.65% of total) and 8,878,492 at autosome (Supplementary Figure S1B), which meant about two-thirds were novel SNPs in goat. These SNPs were partitioned into intergenic (6,343,642; 67.14%), intronic (2,480,758; 26.26%), exonic (64,074; 0.68%) and other gene regulatory regions (Figure 1B and Table 1). For SNPs in exonic regions, it showed the overwhelming majorities were synonymous and non-synonymous, and others including stopgain, stoploss, and unknown were <1% (Figure 1C and Table 1).
Divergent Genetic Differentiation of Jining Gray Goat LS Groups
To disclose the genetic differences between groups with different LS values, the SNPs of diverse LS groups were investigated. As showed in Figure 2A, there were more SNPs in LS2 than LS1 group, and LS3 group was medium. Similarly, the heterozygous/homozygous (het/hom) ratios in LS2 and LS3 were a little bit higher than that of LS1 group (Figure 2B), as well as the heterozygosity rates of different groups (Figure 2C). ROH analysis further revealed large ROHs of >4 Mb were most associated with lower LS group (Figure 2D), that supported the increase of heterozygosity rates in high LS groups. Moreover, we performed PCA based on SNPs in autosomes (Figure 2E), indicating these samples had no obvious structure regarding the LS groups, which was consistent with the NJ tree result (Supplementary Figure S2A). Further, the LD analysis with LD decay of r2 showed there was no apparent difference among the three LS groups (Supplementary Figure S2B), which was likely because these individuals come from the same large population.
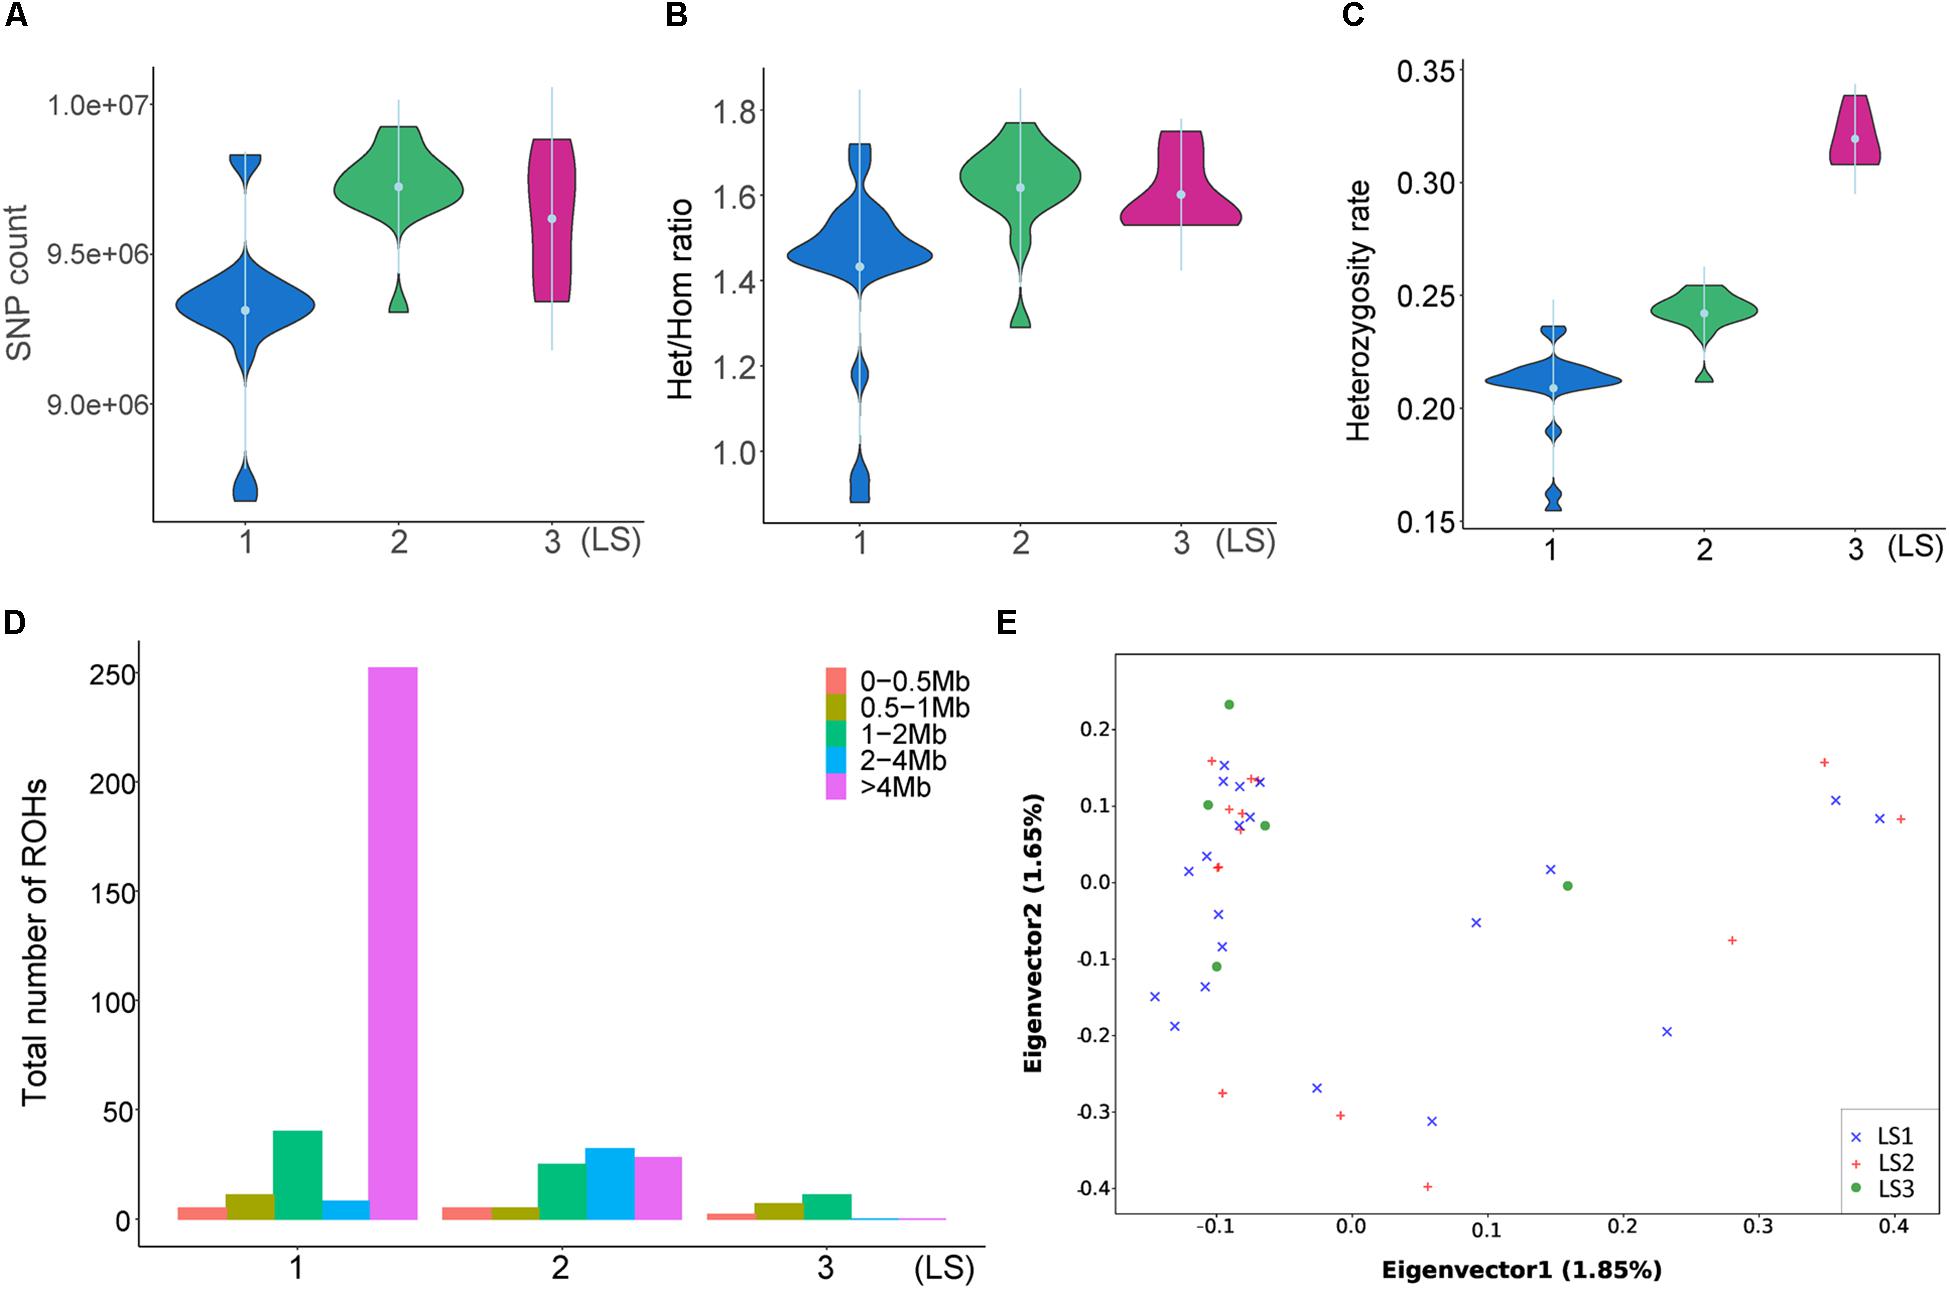
Figure 2. Divergent genetic differentiation of Jining Gray goat groups associated with LS. (A) SNPs number and Het/Hom ratio (B) of LS1, LS2, and LS3 groups. (C) Heterozygosity analysis of LS1, LS2, and LS3 groups. (D) Spectrum of ROH length of diverse LS groups. (E) Principal component analysis (PCA) of LS1, LS2, and LS3 groups.
Signatures of Selection With Sweeps Analysis
To detect signatures of selection associated with LS, the genetic differentiation was estimated with the fixation index (Fst) in groups of Jining Gray goat (Supplementary Table S3). Firstly, genome-wide SNPs in autosome were utilized to calculate Fst value of LS2 vs LS1 groups, which was performed with 100 kb window size and 50 kb step size. As previous reports, the regions with high Z-transformed Fst values [Z(Fst) > 5] were concentrated (Axelsson et al., 2013; Gou et al., 2014). Here, total 67 windows [Z(Fst) > 5] had been strongly selected (Figure 3A), where KCNH7, KMT2E, and KIT genes located, other genes, consist of CNOT9, SULT4A1, and SERPINB10, underwent subordinate selection (Table 2 and Supplementary Table S4). Especially, there were some novel genes in goat, part of which were generated with the homologous in mouse, i.e., Akr1c21 and Serpinb2 (Figure 3A). Genes, KIT, KCNH7, and CNOT9, were verified with Tajima’s D values and π (pairwise LS2 vs LS1) (Figure 3B). Allele frequencies for these loci are shown in Supplementary Figure S2C. Moreover, the non-coding region of KIT and KCNH7 also possessed many mutations (Supplementary Figures S3A,B). Among, KIT gene was most likely the candidate gene in LS2 group of Jining Gray goat.
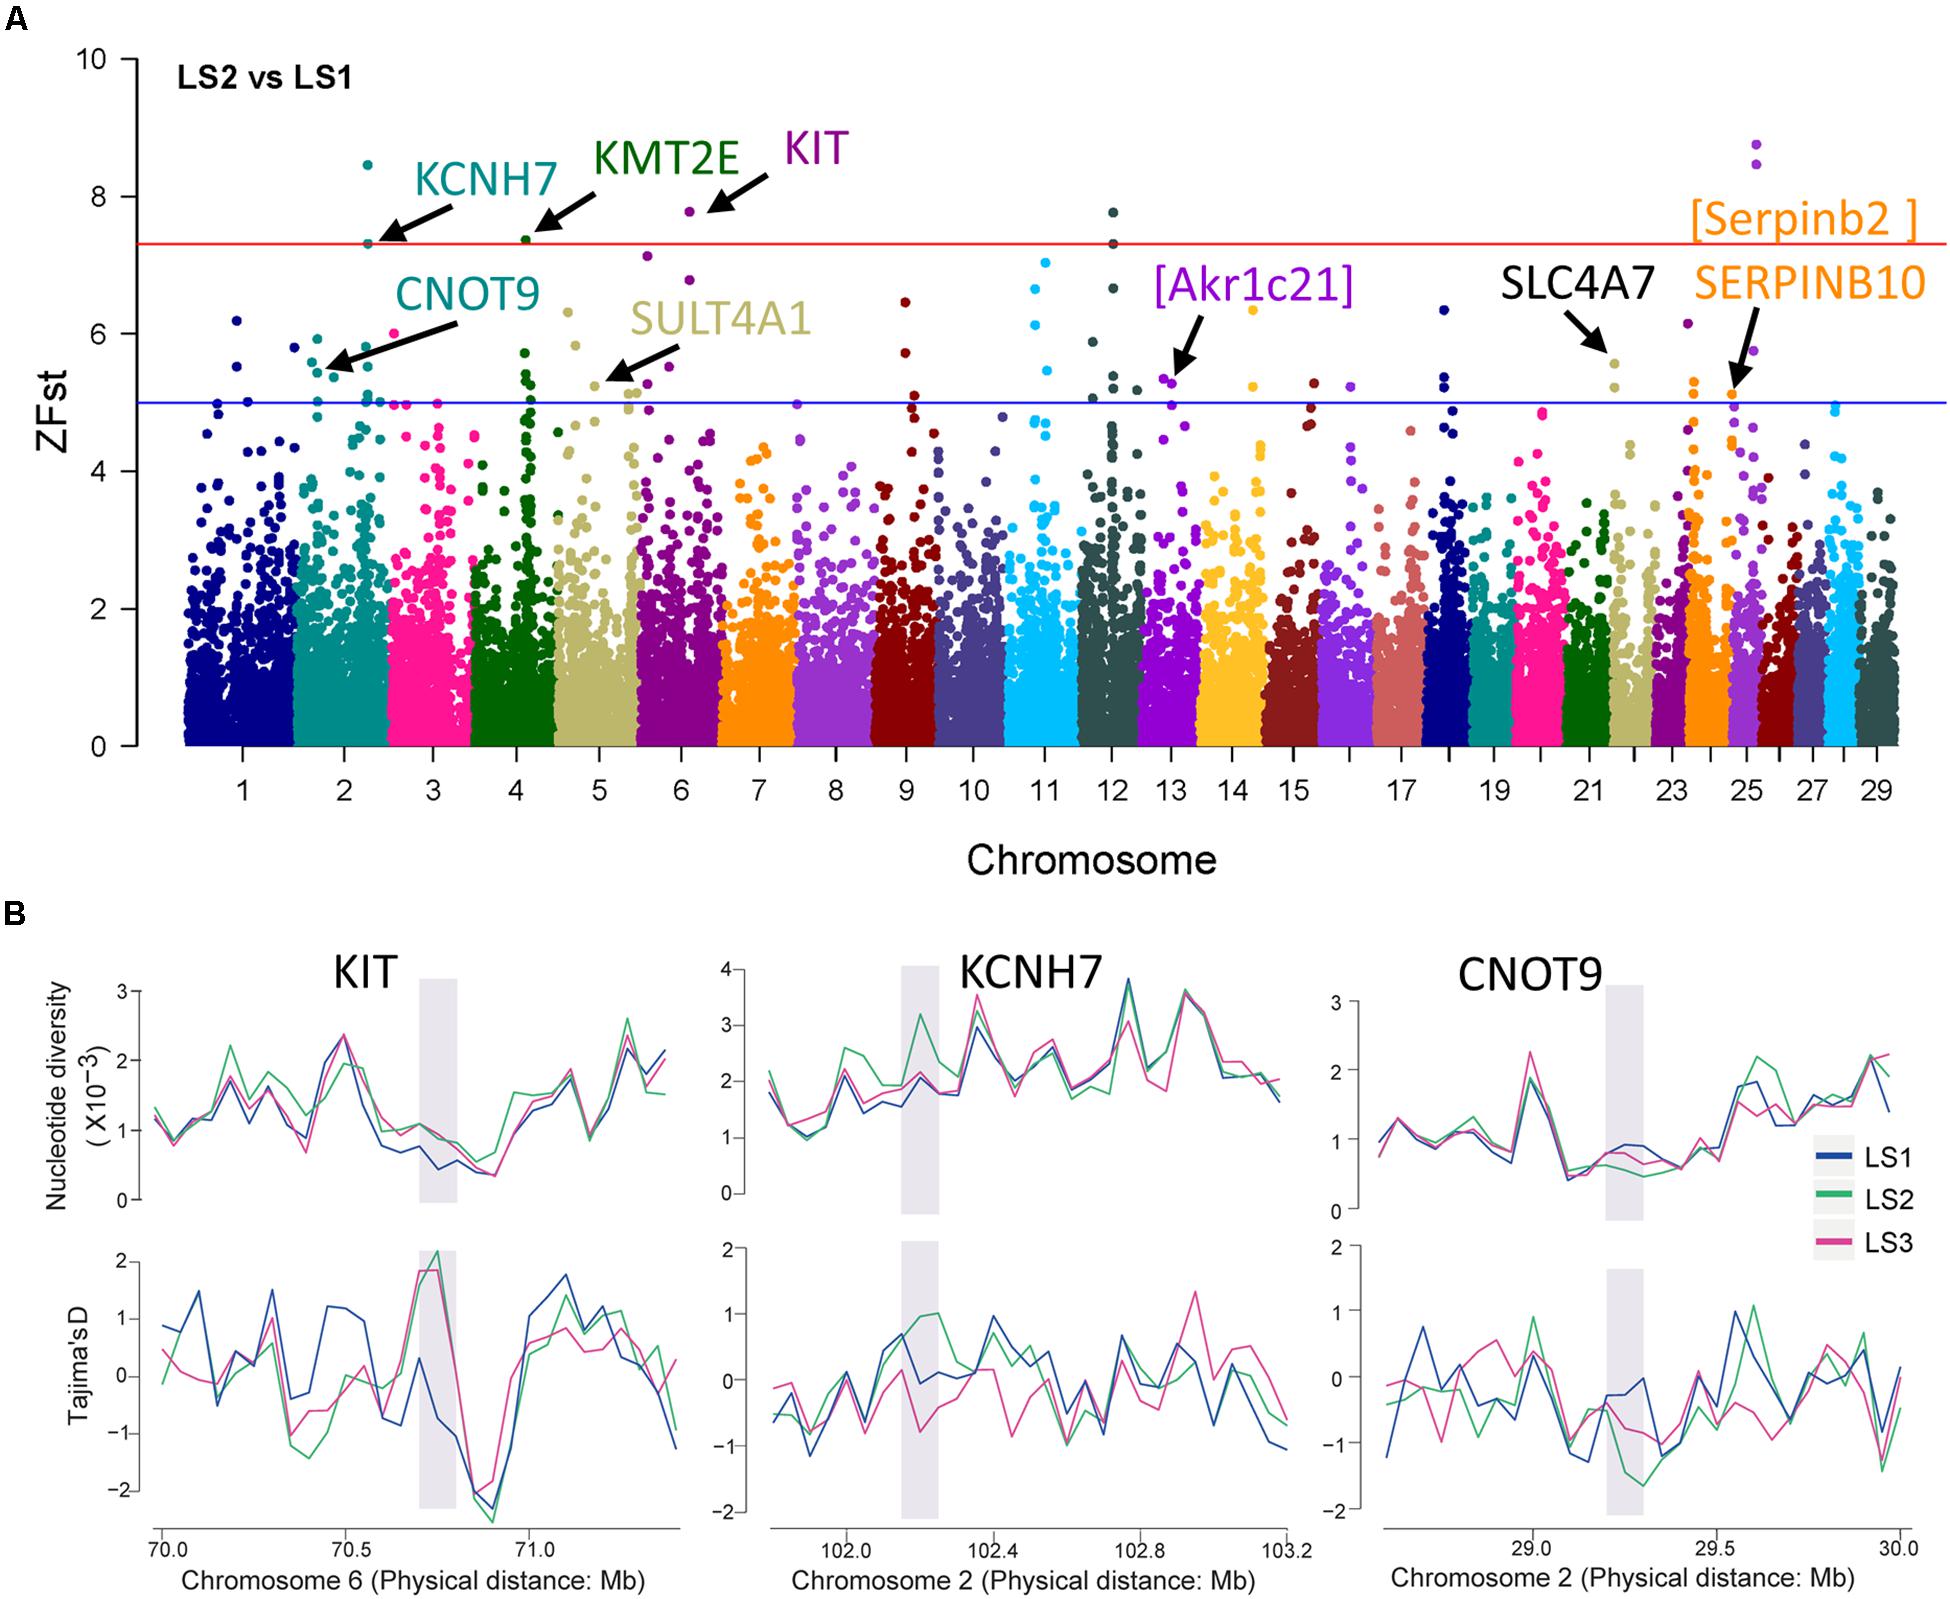
Figure 3. Selective sweep of Jining Gray goat groups with LS2 vs LS1. (A) Mahattan Plot of Z(Fst) values of LS2 vs LS1 group. The blue line is “suggestiveline,” –log10(1e – 05), red line is “genomewideline,” –log10(5e – 08). (B) Distribution of Tajima’s D values and π in LS1, LS2, and LS3 groups at selective regions. The selective regions were marked with gray shadow.
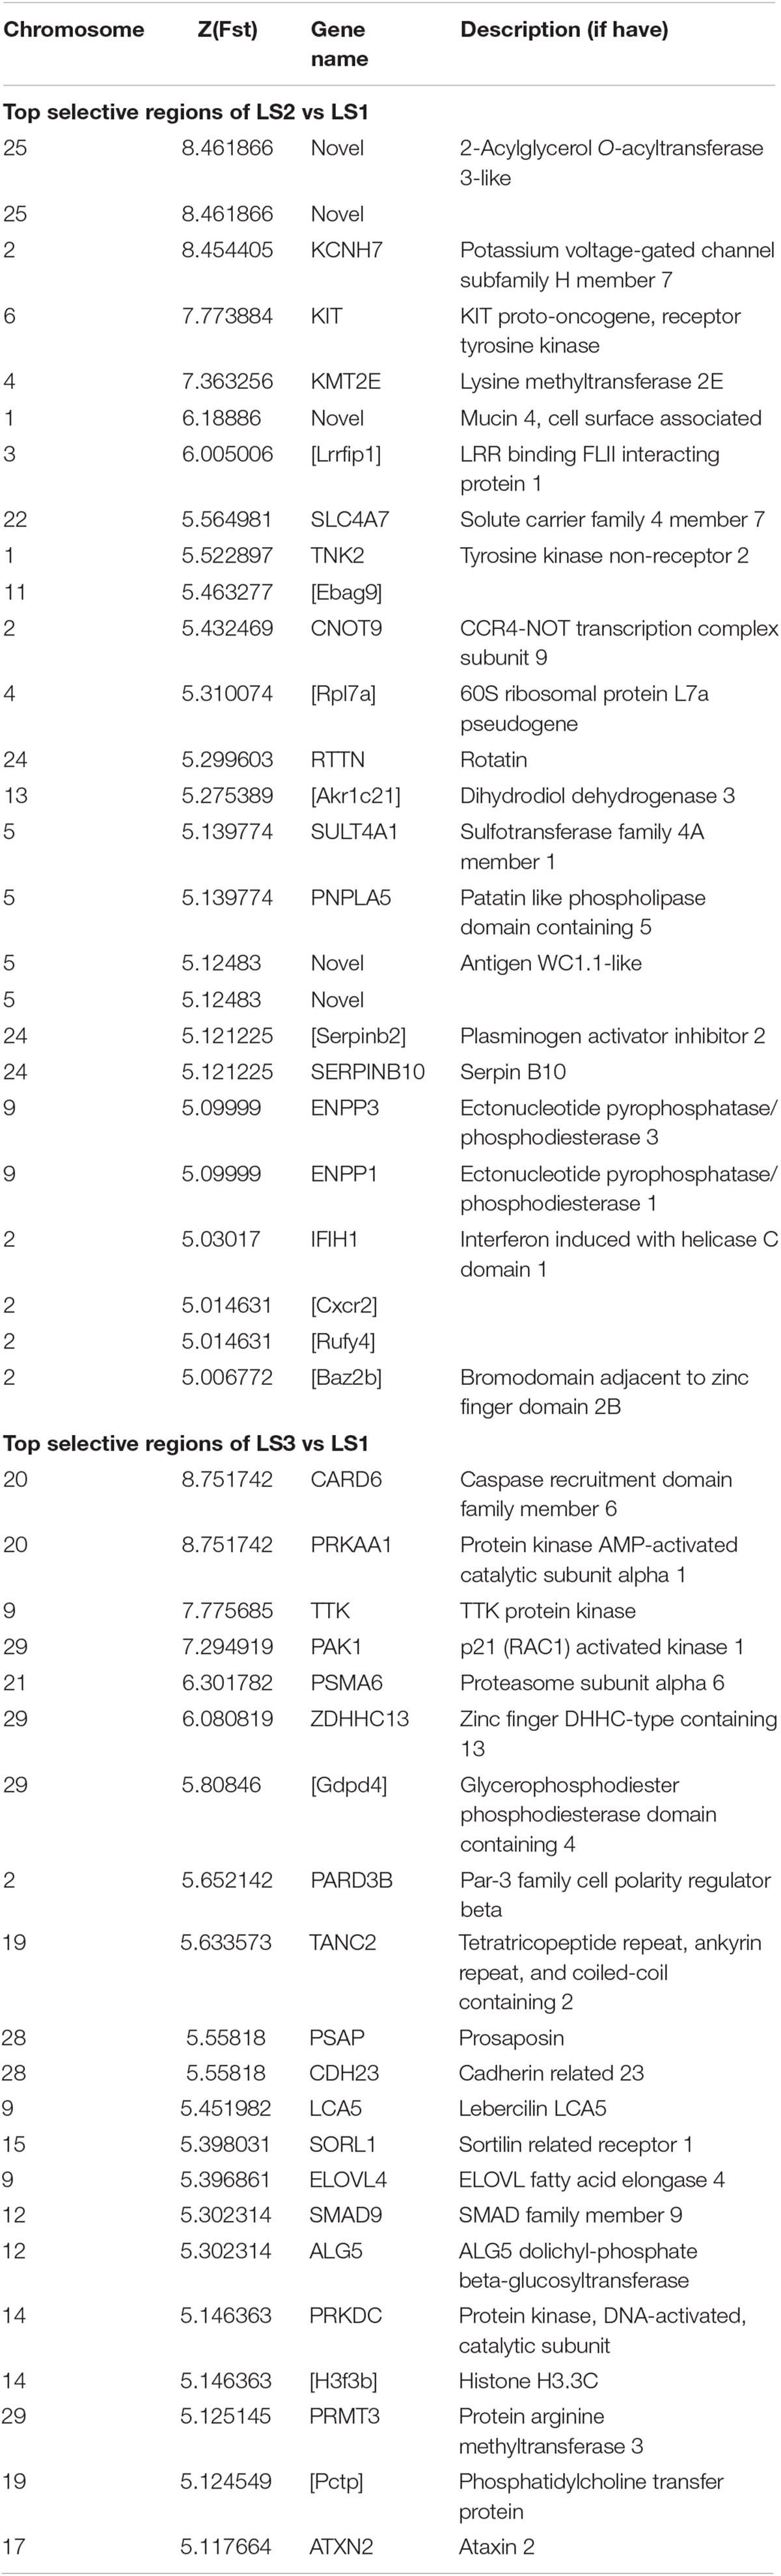
Table 2. Gene located in selective regions of LS2 vs LS1 and LS3 vs LS1 with Z(Fst) > 5.
Further, the selective sweep analysis also was executed in LS3 vs LS1 groups (Figure 4A and Table 2). Here, we obtained 44 regions with highest Z(Fst) value above the genome-wide line (Supplementary Table S3), which located at chromosome 9, 20, and 29, and the selection genes of SMAD9, CARD6 and PRKAA1, and PAK1 were annotated, respectively. Also, the genes at a sub-optimal level included PARD3B, SORL1, and PSMA6 (Table 2 and Supplementary Table S4), especially. Several novel LS genes in goat were mapped in mouse orthologs genes, such as Pctp and Gdpd4. Moreover, these genes in selective regions of LS3 group, PAK1 and Gdpd4, CARD6 and PRKAA1, and PSMA6, were partly confirmed by Tajima’s D and π values compare to LS1 group (Figure 4B), that also had been reflected by the changes of allele frequency at mutation loci (Supplementary Figure S2D). In addition, we discovered that PAK1 gene had several mutations in non-coding region (Supplementary Figure S3C). These results indicted PAK1 was mostly candidate gene in LS3 group of Jining Gray goat.
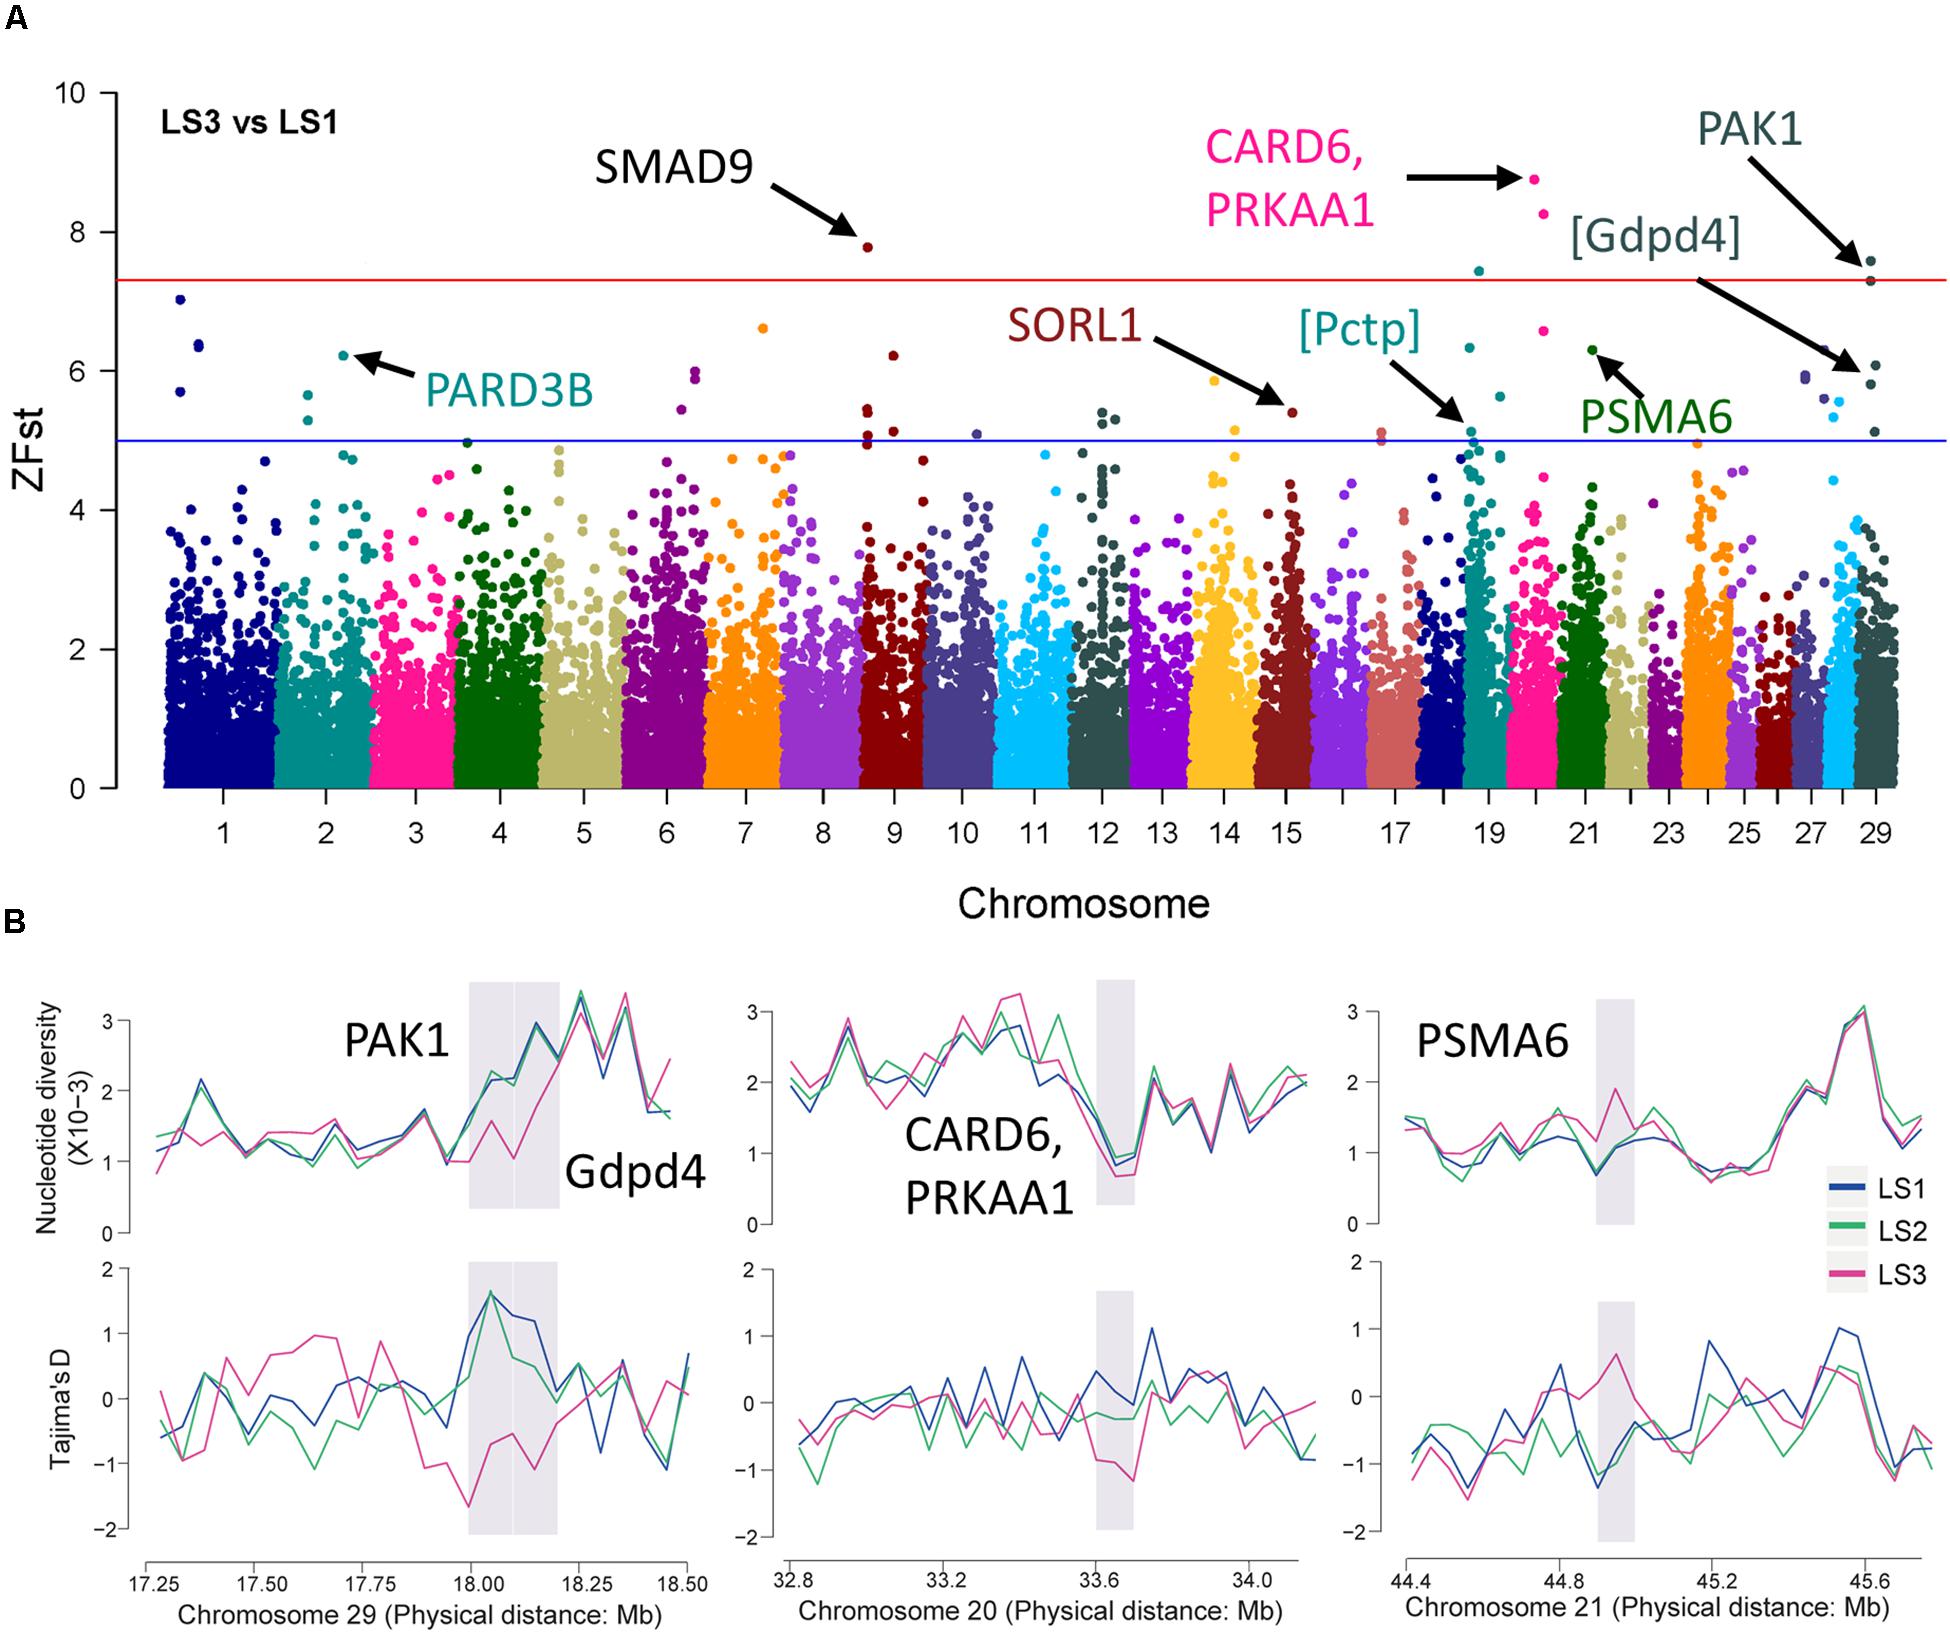
Figure 4. Selective sweep of Jining Gray goat groups with LS3 vs LS1. (A) Mahattan Plot of Z(Fst) values of LS3 vs LS1 groups. The blue line is “suggestiveline,” –log10(1e – 05), red line is “genomewideline,” –log10(5e – 08). (B) Distribution of Tajima’s D values and π in LS1, LS2, and LS3 groups at selective regions. The selective regions were marked with gray shadow.
Functional Enrichment of Candidate Genes
To disclose the function of candidate genes associated with LS trait, the GO enrichment analysis of annotated genes in regions with Z(Fst) > 5 both LS2 vs LS1 and LS3 vs LS1 groups was performed (Table 3). The most top of non-redundant enrichment GO terms were “programmed cell death involved in cell development” and “regulation of insulin receptor signaling pathway” (Figure 5A). Of note, enrichment map of all GO lists showed “steroid metabolic process,” “cellular response to hormone stimulus,” and “developmental process involved in reproduction” were also enriched with more gene hits (marked with numbers) (Figure 5B and Supplementary Table S5), all these processes were likely evidenced the genotype of the high LS of firstborn in Jining Gray goat. Meanwhile, the enriched pathway of “tight junction” might also serve as other important roles in high LS (Figure 5C and Table 4).
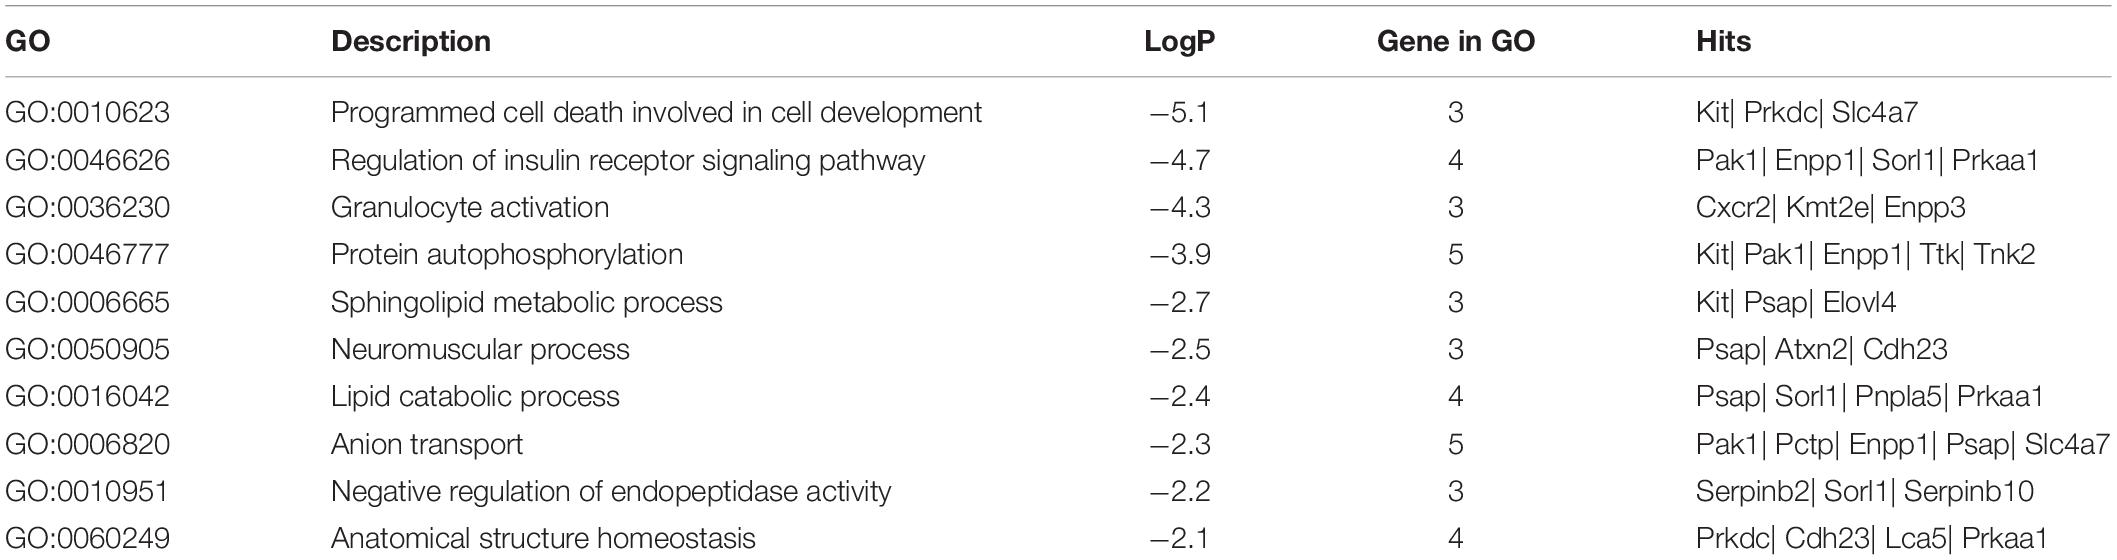
Table 3. Top non-redundant enriched GO terms of candidate genes.
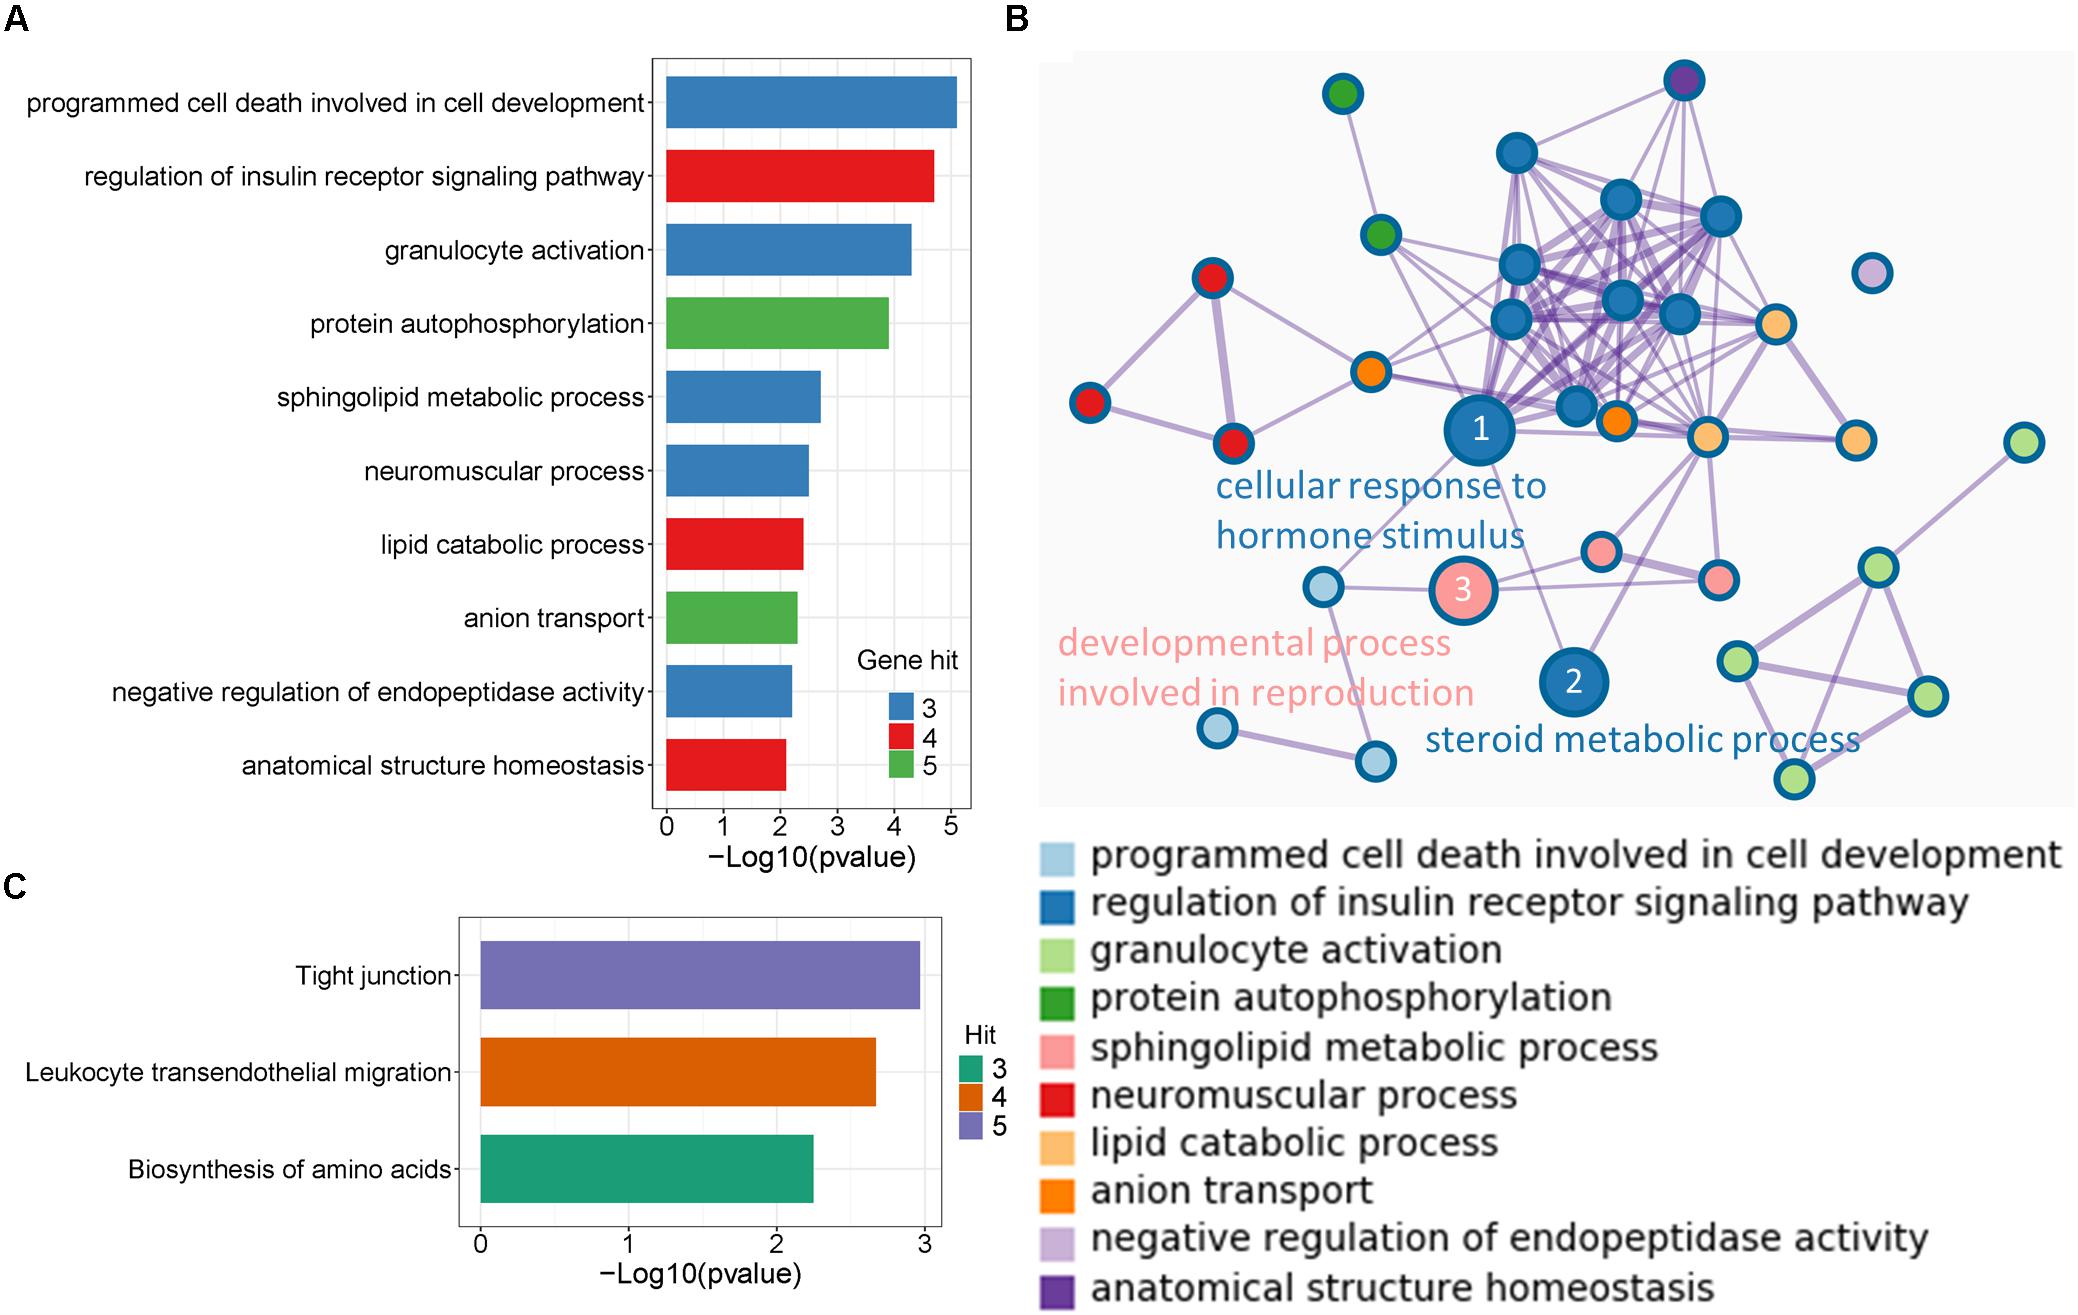
Figure 5. Enrichment analysis of candidate genes. (A) The top non-redundant go enrichment clusters of genes in selected region both of LS2 vs LS1 and LS3 vs LS1 groups. Per cluster use a discrete color scale to represent statistical significance. (B) Metascape enrichment network showing the intra-cluster and inter-cluster similarities of enriched go terms. Node size is reflected by gene hits in the go term. (C) Enriched KEGG pathway of candidate genes.
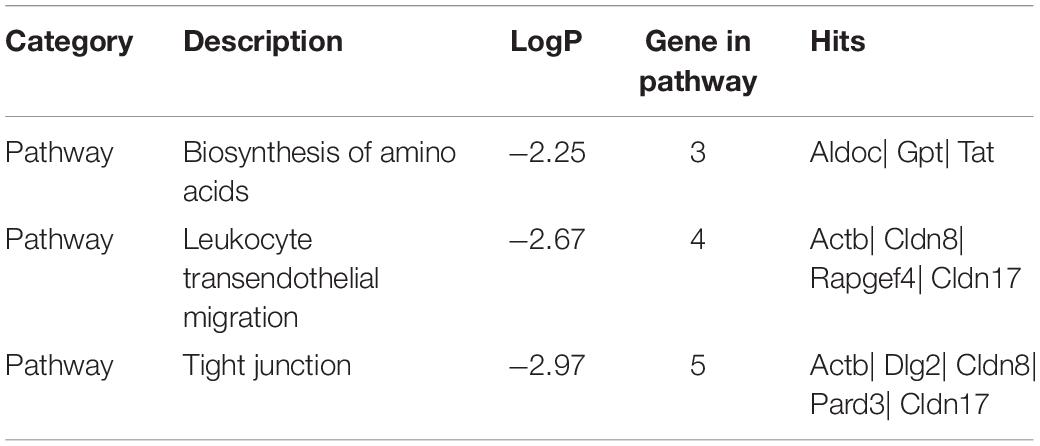
Table 4. Enriched KEGG pathways of candidate genes.
Discussion
In this study, we provided the comprehensive evidence of genetic background of high fecundity in goat. Briefly, the whole-genomic sequence was performed with groups of Jining Gray goat (one famous Chinese local breed with mean LS 2.94) with LS 1, 2, and 3 for first-born and we got a plenty of genome-wide variants. Most of genomic SNPs in Jining Gray goat were identified for the first time in our study. Importantly, signatures of selection among LS groups were uncovered with selective sweeps of Fst, π, and Tajima’s D. We identified 42 candidate genes associated with LS trait, which was likely contribute for GS in goat to improve the reproductive performance.
As previously reported, follicular maturation and ovulation rate are the most important factors affecting LS, increasing the possibility of higher fertilized rate and bigger litters (Fogarty, 2009). It has been suggested that the members of transforming growth factor-β (TGF-β) superfamily, including BMPR-1B, BMP15, and GDF9, affected the ovulation and LS (Demars et al., 2013). Also, numerous studies had explored the polymorphisms of these genes in sheep and goat breeds (Ahlawat et al., 2016; Talebi et al., 2018). Here, we identified large amounts of SNPs in Jining Gray goat, and more than half were novel sites, all the abundant variants extended genetic resource in goat for fecundity traits associated research. Of note, there were no distinct grouped patterns in PCA and NJ tree results, as well as LD decay analysis, which might cause by the similar genetic background within population. Recently, ROH in animals present adamant evidence of individual relatedness, inbreeding, and also selection pressure (Peripolli et al., 2017; Ceballos et al., 2018). Our results showed that large continuous homozygous segments were mostly associated with lower LS group, which displayed consistent with increase of heterozygosity rate in higher LS groups, these results indicated the difference of heterozygosity in diverse LS groups was likely related to fitness and inbreeding.
For genomic research, it has been established that GWAS is the most powerful tools for detecting the genetics basis of complex traits (McCarthy et al., 2008; Stranger et al., 2011). Accordingly, an adequate statistical power of GWAS require a much larger sample size, and the proper case-control design is relative necessary (Hong and Park, 2012). However, these very strict requirements of the large sample size and detailed genealogy information prevent us to carry out the similar study in goat, regard to their availability. At the same time, the threshold character of LS trait had been reported as previously (Konstantinov et al., 1994; Pérez-Enciso et al., 1995; Janssens et al., 2004), and the extreme phenotypic study design is also much more powerful to detect the variants associated trait selection (Peloso et al., 2016), thus, the sweeps analysis of pairwise value between LS groups were conducted.
In our study, a total of 42 candidate genes associated with LS trait were identified by selective sweeps of three groups within Jining Gray goat. In LS2 group, the genes of KCNH7, KMT2E, and KIT possessed most strong selective signatures. KIT, is known to be involved in oocyte growth and follicular development in mammals, deficient of KIT would lead amounts of oocytes lost (Moniruzzaman et al., 2007), and evidence showed mutations of KIT or KITLG blocked the interaction of oocyte and granulosa cell, and caused female infertile (Horie et al., 1991; Driancourt et al., 2000; Thomas et al., 2008). Moreover, KITLG has been previously identified to be associated with LS trait in goat (An et al., 2015a, b), such evidence suggested KIT may be the most promising gene for large LS. Another, KCNH7 also had been found to be significantly associated with animal reproductive traits (Fan et al., 2017). Besides, KMT2E, termed as MLL5, had been demonstrated to be required for normal spermatogenesis, its knockout mouse showed a post meiotic phenotype and infertile (Heuser et al., 2009; Yap et al., 2011).
Besides, in LS3 group, the genes of SMAD9, CARD6, PRKAA1, and PAK1 possessed most strong selective signatures. Among which, SMAD9 (also known as SMAD8), a member of the SMAD family, involved signal transduction of TGF-β superfamily and inhibited BMP activity (Chang et al., 2002; Tsukamoto et al., 2014), it had already been suggested to control follicular selection via balancing luteinizing hormone receptor (LHR) transcription (Yu D. et al., 2017). Similarly, SMAD2 in goat and SMAD1 in sheep also were detected to be associated with LS trait (Lai et al., 2016; Xu et al., 2018). In addition, PAK1, a serine/threonine kinase, had been reported to mediate estradiol-negative feedback actions in the reproductive axis, which seems to play important roles in non-classical estrogen receptor α (ERα) signaling (Zhao et al., 2009). PRKAA1, protein kinase AMP-activated catalytic subunit alpha 1, served as an energy sensor that maintains energy homeostasis (Kahn et al., 2005; Krishan et al., 2014). And another gene, PARD3B with lower selection intensity here, had been identified with goat productive traits in another report (Guan et al., 2016).
Especially, our results suggested regions detected with Fst were not supported by Tajima’s D or π. These contradictory results may be caused by differences in the underlying theory among methods. Firstly, Fst, is developed for population differentiation, it compares the variance of allele frequencies within and between populations, and is suggestive of directional selection (Holsinger and Weir, 2009). Another, Tajima’s D is calculated based on frequency spectrum, when selection occurs, a population wide reduction in the genetic diversity follows, and many surrounding sites near the selected variant segregate at low frequencies, then the frequency spectrum shifts back to baseline over thousands of generations (Tajima, 1989). Conversely, population differentiation-based approaches (that is Fst) can detect more types of selection, including classic sweeps, sweeps on standing variants, and negative selection (Vitti et al., 2013). Thus, we believed the result of Fst was potentially acceptable, although they might be not suggested by other values at secondary level of significance. Moreover, the inconsistencies between results of LS2 vs LS1 and LS3 vs LS1 attracted more attentions. Here we may hypothesize the LS trait is not only quantitative, but also a threshold trait, it means different major genes and more minor genes when LS increase. In our result, there were no shared candidate genes between in LS2 and LS3 groups, it seemed to indicate the character of threshold trait of LS, in particular, the allele frequency of PAK1 steadily increased from LS 1 to 3, which suggested a quantitative trait of LS, although it only showed strong selective signal in LS3 group. However, the underlying mechanism needs further investigation.
Further, the functional enrichment analysis suggested the processes of programmed cell death involved in cell development, cellular response to hormone stimulus, steroid metabolic process and regulation of insulin receptor signaling pathway might play important roles in the regulation of LS trait. Notably, the steroid production is critical for body development and function through steroid hormones, consist of androgen, estradiol, progesterone, glucocorticoid, and aldosterone (Jamnongjit and Hammes, 2006; Ruiz-Cortés, 2012). There were six genes enriched in steroid metabolic process (Supplementary Table S5), KIT and PRKAA1 both with high selective signals that exhibited reproduction or energy-related regulation. In another aspect, programmed cell death plays a fundamental role in animal development, and plays a prominent role in development of fetal ovaries and postnatal ovarian cycle (Pru and Tilly, 2001; Fuchs and Steller, 2011). Moreover, the insulin signal that interacted with steroid metabolic process and cellular response to hormone stimulus was believed to be closely connected with folliculogenesis and ovarian function (Kezele et al., 2002; Dupont and Scaramuzzi, 2016).
Collectively, this research identified numerous novel variants in Jining Gray goat. Some candidate genes showed strongest differentiation signals, such as KIT, PAK1, PRKKA1, SMAD9, KCNH7, and KMT2E. Especially, KIT and PAK1 genes are mostly suggested to be applied to improve the reproductive performance of goats. Meanwhile, the steroid metabolic process and cellular hormone response enriched most genes at selective regions, which would help to explain the difference of LS trait in Jining Gray goat. With regard to application, we believe two steps should be considered: (1) GWAS with large sample size in goat to verify the accuracy of candidate genes; (2) establishment of the core breeding population based on genetic marker genes and reference population expansion. Accordingly, GS is a promising development in livestock breeding programs (Jonas and Koning, 2015), whose implementation of is based on the genome-wide markers of interested trait to conduct genomic EBVs, with daughter assessment, the selected individuals are arranged to reference population. Above of all, our findings will increase the genetic cognition of goat LS trait, contribute to understand the changes of genomic phenotypes under the adaption and artificial breeding process, which would benefit the improvement of reproduction performance in goat.
Data Availability Statement
The genome sequence data of 40 Jining Gray goats in this research had been submitted in NCBI Sequence Read Archive (SRA) under BioProject No. PRJNA560446.
Ethics Statement
The animal study was reviewed and approved by the Northwest A&F University. Written informed consent was obtained from the owners for the participation of their animals in this study.
Author Contributions
J-JW, TZ, Q-MC, R-QZ, LL, and S-FC conducted the experiments. J-JW, TZ, and Q-MC analyzed the data. J-JW, WS, and C-ZL wrote the manuscript. WS and C-ZL designed the manuscript. All authors revised the manuscript and approved the final manuscript.
Funding
This work was supported by the Science and Technology Fund Planning Projects of Qingdao City (17-3-3-48-nsh), the opening project of State Key Laboratory of Reproductive Regulation and Breeding of Grassland Livestock (30500-518390204), and Taishan Scholar Construction Foundation of Shandong Province (ts20190946) of China.
Conflict of Interest
The authors declare that the research was conducted in the absence of any commercial or financial relationships that could be construed as a potential conflict of interest.
Supplementary Material
The Supplementary Material for this article can be found online at: https://www.frontiersin.org/articles/10.3389/fgene.2020.00286/full#supplementary-material
FIGURE S1 | Genomic sequence and variants statistics. (A) Mean depth of sequence in LS1, LS2, and LS3 groups. (B) Statistics of SNP number in filtration and annotation. (C) The number of SNPs within 1 Mb window size at autosome.
FIGURE S2 | Structure analysis, LD decay, and allele frequency of different LS groups. (A) Circle diagram of NJ tree of all samples. The green panel labeled the LS2 group, and magenta panel labeled LS3 group. (B) LD decay plot of LS1, LS2, and LS3 groups. r2 was calculated with same sample size of different groups (individual = 6). (C,D) Allele frequency of mutation loci of candidate genes for LS2 vs LS1 (C) and LS3 vs LS1 (D).
FIGURE S3 | Structure of protein coding region of most candidate genes from Ensembl website. (A) Protein coding regions (left) and genomic mutation count (right) of KIT gene. (B) Protein coding regions (left) and genomic mutation count (right) of KCNH7 gene. (C) Protein coding regions (left) and genomic mutation count (right) of PAK1 gene.
TABLE S1 | Statistics of reads depth and overage of each sample.
TABLE S2 | Number of reads in quality control and mapping statistics.
TABLE S3 | The selected regions in LS2 and LS3.
TABLE S4 | Mutation loci of candidate genes in both LS2 vs LS1 and LS3 vs LS1.
TABLE S5 | All GO lists of candidate genes.
Footnotes
- ^ ftp://ftp.ensembl.org/pub/release-95/fasta/capra_hircus/dna/Capra_hircus.ARS1.dna.toplevel.fa.gz
- ^ https://github.com/venyao/shinyCircos.git
- ^ https://github.com/YinLiLin/R-CMplot
- ^ http://metascape.org/gp/index.html
References
Abdoli, R., Zamani, P., Mirhoseini, S., Ghavi Hossein-Zadeh, N., and Nadri, S. (2016). A review on prolificacy genes in sheep. Reprod. Domest. Anim. 51, 631–637. doi: 10.1111/rda.12733
Ahlawat, S., Sharma, R., Roy, M., Mandakmale, S., Prakash, V., and Tantia, M. (2016). Genotyping of novel SNPs in BMPR1B, BMP15, and GDF9 genes for association with prolificacy in seven Indian goat breeds. Anim. Biotechnol. 27, 199–207. doi: 10.1080/10495398.2016.1167706
An, X., Hou, J., Gao, T., Lei, Y., Song, Y., Wang, J., et al. (2015a). Association analysis between variants in KITLG gene and litter size in goats. Gene 558, 126–130. doi: 10.1016/j.gene.2014.12.058
An, X., Hou, J., Lei, Y., Gao, T., Song, Y., Wang, J., et al. (2015b). Two mutations in the 5-flanking region of the KITLG gene are associated with litter size of dairy goats. Anim. Genet. 46, 308–311. doi: 10.1111/age.12277
An, X., Ma, T., Hou, J., Fang, F., Han, P., Yan, Y., et al. (2013). Association analysis between variants in KISS1 gene and litter size in goats. BMC Genet. 14:63. doi: 10.1186/1471-2156-14-63
Andrews, S. (2010). FastQC: a Quality Control Tool for High Throughput Sequence Data. Cambridge: Babraham Institute.
Axelsson, E., Ratnakumar, A., Arendt, M.-L., Maqbool, K., Webster, M. T., Perloski, M., et al. (2013). The genomic signature of dog domestication reveals adaptation to a starch-rich diet. Nature 495, 360–364. doi: 10.1038/nature11837
Benjelloun, B., Alberto, F. J., Streeter, I., Boyer, F., Coissac, E., Stucki, S., et al. (2015). Characterizing neutral genomic diversity and selection signatures in indigenous populations of Moroccan goats (Capra hircus) using WGS data. Front. Genet. 6:107. doi: 10.3389/fgene.2015.00107
Bickhart, D. M., Rosen, B. D., Koren, S., Sayre, B. L., Hastie, A. R., Chan, S., et al. (2017). Single-molecule sequencing and chromatin conformation capture enable de novo reference assembly of the domestic goat genome. Nature Genet. 49, 643–650. doi: 10.1038/ng.3802
Bolger, A. M., Lohse, M., and Usadel, B. (2014). Trimmomatic: a flexible trimmer for Illumina sequence data. Bioinformatics 30, 2114–2120. doi: 10.1093/bioinformatics/btu170
Ceballos, F. C., Joshi, P. K., Clark, D. W., Ramsay, M., and Wilson, J. F. (2018). Runs of homozygosity: windows into population history and trait architecture. Nat. Rev. Genet. 19, 220–234. doi: 10.1038/nrg.2017.109
Chang, H., Brown, C. W., and Matzuk, M. M. (2002). Genetic analysis of the mammalian transforming growth factor-β superfamily. Endocr. Rev. 23, 787–823. doi: 10.1210/er.2002-0003
Chu, M., Lu, L., Feng, T., Di, R., Cao, G., Wang, P., et al. (2011). Polymorphism of bone morphogenetic protein 4 gene and its relationship with litter size of Jining Grey goats. Mol. Biol. Rep. 38, 4315–4320. doi: 10.1007/s11033-010-0556-6
Cm Dekkers, J. (2012). Application of genomics tools to animal breeding. Curr. Genomics 13, 207–212. doi: 10.2174/138920212800543057
Cui, Y., Yan, H., Wang, K., Xu, H., Zhang, X., Zhu, H., et al. (2018). Insertion/deletion within the KDM6A gene is significantly associated with litter size in goat. Front. Genet. 9:91. doi: 10.3389/fgene.2018.00091
Daly, K. G., Delser, P. M., Mullin, V. E., Scheu, A., Mattiangeli, V., Teasdale, M. D., et al. (2018). Ancient goat genomes reveal mosaic domestication in the Fertile Crescent. Science 361, 85–88. doi: 10.1126/science.aas9411
Danecek, P., Auton, A., Abecasis, G., Albers, C. A., Banks, E., Depristo, M. A., et al. (2011). The variant call format and VCFtools. Bioinformatics 27, 2156–2158. doi: 10.1093/bioinformatics/btr330
Davis, G. H. (2005). Major genes affecting ovulation rate in sheep. Genet. Sel. Evol. 37, (Suppl. 1), S11–S23.
Demars, J., Fabre, S., Sarry, J., Rossetti, R., Gilbert, H., Persani, L., et al. (2013). Genome-wide association studies identify two novel BMP15 mutations responsible for an atypical hyperprolificacy phenotype in sheep. PLoS Genet. 9:e1003482. doi: 10.1371/journal.pgen.1003482
Driancourt, M.-A., Reynaud, K., Cortvrindt, R., and Smitz, J. (2000). Roles of KIT and KIT LIGAND in ovarian function. Rev. Reprod. 5, 143–152. doi: 10.1530/ror.0.0050143
Drouilhet, L., Mansanet, C., Sarry, J., Tabet, K., Bardou, P., Woloszyn, F., et al. (2013). The highly prolific phenotype of Lacaune sheep is associated with an ectopic expression of the B4GALNT2 gene within the ovary. PLoS Genet. 9:e1003809. doi: 10.1371/journal.pgen.1003809
Dupont, J., and Scaramuzzi, R. J. (2016). Insulin signalling and glucose transport in the ovary and ovarian function during the ovarian cycle. Biochem. J. 473, 1483–1501. doi: 10.1042/BCJ20160124
Fan, Q., Wu, P., Dai, G., Zhang, G., Zhang, T., Xue, Q., et al. (2017). Identification of 19 loci for reproductive traits in a local Chinese chicken by genome-wide study. Genet. Mol. Res. 16:gmr16019431. doi: 10.4238/gmr16019431
Feng, T., Cao, G. L., Chu, M. X., Di, R., Huang, D. W., Liu, Q. Y., et al. (2015). Identification and verification of differentially expressed genes in the caprine hypothalamic-pituitary-gonadal axis that are associated with litter size. Mol. Reprod. Dev. 82, 132–138. doi: 10.1002/mrd.22451
Fogarty, N. (2009). A review of the effects of the Booroola gene (FecB) on sheep production. Small Rumin. Res. 85, 75–84. doi: 10.1016/j.smallrumres.2009.08.003
Fuchs, Y., and Steller, H. (2011). Programmed cell death in animal development and disease. Cell 147, 742–758. doi: 10.1016/j.cell.2011.10.033
Gou, X., Wang, Z., Li, N., Qiu, F., Xu, Z., Yan, D., et al. (2014). Whole-genome sequencing of six dog breeds from continuous altitudes reveals adaptation to high-altitude hypoxia. Genome Res. 24, 1308–1315. doi: 10.1101/gr.171876.113
Guan, D., Luo, N., Tan, X., Zhao, Z., Huang, Y., Na, R., et al. (2016). Scanning of selection signature provides a glimpse into important economic traits in goats (Capra hircus). Sci. Rep. 6:36372. doi: 10.1038/srep36372
Heuser, M., Yap, D. B., Leung, M., De Algara, T. R., Tafech, A., Mckinney, S., et al. (2009). Loss of MLL5 results in pleiotropic hematopoietic defects, reduced neutrophil immune function, and extreme sensitivity to DNA demethylation. Blood 113, 1432–1443. doi: 10.1182/blood-2008-06-162263
Holsinger, K. E., and Weir, B. S. (2009). Genetics in geographically structured populations: defining, estimating and interpreting F ST. Nat. Rev. Genet. 10, 639–650. doi: 10.1038/nrg2611
Hong, E. P., and Park, J. W. (2012). Sample size and statistical power calculation in genetic association studies. Genomics Inform. 10, 117–122.
Horie, K., Takakura, K., Taii, S., Narimoto, K., Noda, Y., Nishikawa, S., et al. (1991). The expression of c-kit protein during oogenesis and early embryonic development. Biol. Reprod. 45, 547–552. doi: 10.1095/biolreprod45.4.547
Jamnongjit, M., and Hammes, S. R. (2006). Ovarian steroids: the good, the bad, and the signals that raise them. Cell Cycle 5, 1178–1183. doi: 10.4161/cc.5.11.2803
Janssens, S., Vandepitte, W., and Bodin, L. (2004). Genetic parameters for litter size in sheep: natural versus hormone-induced oestrus. Genet. Sel. Evol. 36, 543–562.
Jonas, E., and Koning, D.-J. D. (2015). Genomic selection needs to be carefully assessed to meet specific requirements in livestock breeding programs. Front. Genet. 6:49. doi: 10.3389/fgene.2015.00049
Kahn, B. B., Alquier, T., Carling, D., and Hardie, D. G. (2005). AMP-activated protein kinase: ancient energy gauge provides clues to modern understanding of metabolism. Cell Metab. 1, 15–25. doi: 10.1016/j.cmet.2004.12.003
Kezele, P. R., Nilsson, E. E., and Skinner, M. K. (2002). Insulin but not insulin-like growth factor-1 promotes the primordial to primary follicle transition. Mol. Cell. Endocrinol. 192, 37–43. doi: 10.1016/s0303-7207(02)00114-4
Konstantinov, K., Erasmus, G., and Van Wyk, J. (1994). Evaluation of Dormer sires for litter size and lamb mortality using a threshold model. S. Afr. J. Anim. Sci. 24, 119–121.
Krishan, S., Richardson, D. R., and Sahni, S. (2014). Amp kinase (prkaa1). J. Clin. Pathol. 67, 758–763. doi: 10.1136/jclinpath-2014-202422
Kumar, S., Stecher, G., Li, M., Knyaz, C., and Tamura, K. (2018). MEGA X: molecular evolutionary genetics analysis across computing platforms. Mol. Biol. Evol. 35, 1547–1549. doi: 10.1093/molbev/msy096
Lai, F.-N., Zhai, H.-L., Cheng, M., Ma, J.-Y., Cheng, S.-F., Ge, W., et al. (2016). Whole-genome scanning for the litter size trait associated genes and SNPs under selection in dairy goat (Capra hircus). Sci. Rep. 6:38096. doi: 10.1038/srep38096
Letunic, I., and Bork, P. (2019). Interactive tree of life (iTOL) v4: recent updates and new developments. Nucleic Acids Res. 47, W256–W259. doi: 10.1093/nar/gkz239
Li, H., and Durbin, R. (2009). Fast and accurate short read alignment with Burrows–Wheeler transform. Bioinformatics 25, 1754–1760. doi: 10.1093/bioinformatics/btp324
Li, H., Handsaker, B., Wysoker, A., Fennell, T., Ruan, J., Homer, N., et al. (2009). The sequence alignment/map format and SAMtools. Bioinformatics 25, 2078–2079. doi: 10.1093/bioinformatics/btp352
McCarthy, M. I., Abecasis, G. R., Cardon, L. R., Goldstein, D. B., Little, J., Ioannidis, J. P., et al. (2008). Genome-wide association studies for complex traits: consensus, uncertainty and challenges. Nat. Rev. Genet. 9, 356–369. doi: 10.1038/nrg2344
McKenna, A., Hanna, M., Banks, E., Sivachenko, A., Cibulskis, K., Kernytsky, A., et al. (2010). The genome analysis toolkit: a MapReduce framework for analyzing next-generation DNA sequencing data. Genome Res. 20, 1297–1303. doi: 10.1101/gr.107524.110
Miao, X., Luo, Q., Zhao, H., and Qin, X. (2016). Genome-wide analysis of miRNAs in the ovaries of Jining Grey and Laiwu Black goats to explore the regulation of fecundity. Sci. Rep. 6:37983. doi: 10.1038/srep37983
Moniruzzaman, M., Sakamaki, K., Akazawa, Y., and Miyano, T. (2007). Oocyte growth and follicular development in KIT-deficient Fas-knockout mice. Reproduction 133, 117–125. doi: 10.1530/rep-06-0161
Naderi, S., Rezaei, H.-R., Pompanon, F., Blum, M. G., Negrini, R., Naghash, H.-R., et al. (2008). The goat domestication process inferred from large-scale mitochondrial DNA analysis of wild and domestic individuals. Proc. Natl. Acad. Sci. U.S.A. 105, 17659–17664. doi: 10.1073/pnas.0804782105
Onzima, R. B., Upadhyay, M. R., Doekes, H. P., Brito, L. F., Bosse, M., Kanis, E., et al. (2018). Genome-wide characterization of selection signatures and runs of homozygosity in Ugandan goat breeds. Front. Genet. 9:318. doi: 10.3389/fgene.2018.00318
Peloso, G. M., Rader, D. J., Gabriel, S., Kathiresan, S., Daly, M. J., and Neale, B. M. (2016). Phenotypic extremes in rare variant study designs. Eur. J. Hum. Genet. 24, 924–930. doi: 10.1038/ejhg.2015.197
Pérez-Enciso, M., Foulley, J. L., Bodin, L., Elsen, J. M., and Poivey, J. P. (1995). Genetic improvement of litter size in sheep. A comparison of selection methods. Genet. Sel. Evol. 27, 43–61.
Peripolli, E., Munari, D., Silva, M., Lima, A., Irgang, R., and Baldi, F. (2017). Runs of homozygosity: current knowledge and applications in livestock. Anim. Genet. 48, 255–271. doi: 10.1111/age.12526
Polley, S., De, S., Brahma, B., Mukherjee, A., Vinesh, P., Batabyal, S., et al. (2010). Polymorphism of BMPR1B, BMP15 and GDF9 fecundity genes in prolific Garole sheep. Trop. Anim. Health Prod. 42, 985–993. doi: 10.1007/s11250-009-9518-1
Pru, J. K., and Tilly, J. L. (2001). Programmed cell death in the ovary: insights and future prospects using genetic technologies. Mol. Endocrinol. 15, 845–853. doi: 10.1210/mend.15.6.0646
Pryce, J., and Daetwyler, H. (2012). Designing dairy cattle breeding schemes under genomic selection: a review of international research. Anim. Prod. Sci. 52, 107–114.
Purcell, S., Neale, B., Todd-Brown, K., Thomas, L., Ferreira, M. A., Bender, D., et al. (2007). PLINK: a tool set for whole-genome association and population-based linkage analyses. Am. J. Hum. Genet. 81, 559–575. doi: 10.1086/519795
Ruiz-Cortés, Z. T. (2012). “Gonadal sex steroids: production, action and interactions in mammals,” in Steroids-From Physiology to Clinical Medicine, ed. S. M. Ostojic (London: IntechOpen).
Saitou, N., and Nei, M. (1987). The neighbor-joining method: a new method for reconstructing phylogenetic trees. Mol. Biol. Evol. 4, 406–425.
Shi, Y., Wang, S., Bai, S., Huang, L., and Hou, Y. (2015). Postnatal ovarian development and its relationship with steroid hormone receptors in JiNing Grey goats. Anim. Reprod. Sci. 154, 39–47. doi: 10.1016/j.anireprosci.2015.01.001
Stranger, B. E., Stahl, E. A., and Raj, T. (2011). Progress and promise of genome-wide association studies for human complex trait genetics. Genetics 187, 367–383. doi: 10.1534/genetics.110.120907
Su, F., Guo, X., Wang, Y., Wang, Y., Cao, G., and Jiang, Y. (2018). Genome-wide analysis on the landscape of transcriptomes and their relationship with DNA methylomes in the hypothalamus reveals genes related to sexual precocity in Jining gray goats. Front. Endocrinol. 9:501. doi: 10.3389/fendo.2018.00501
Tajima, F. (1989). Statistical method for testing the neutral mutation hypothesis by DNA polymorphism. Genetics 123, 585–595.
Talebi, R., Ahmadi, A., Afraz, F., Sarry, J., Woloszyn, F., and Fabre, S. (2018). Detection of single nucleotide polymorphisms at major prolificacy genes in the Mehraban sheep and association with litter size. Ann. Anim. Sci. 18, 685–698. doi: 10.2478/aoas-2018-0014
Thomas, F. H., Ismail, R. S., Jiang, J.-Y., and Vanderhyden, B. C. (2008). Kit ligand 2 promotes murine oocyte growth in vitro. Biol. Reprod. 78, 167–175. doi: 10.1095/biolreprod.106.058529
Tsukamoto, S., Mizuta, T., Fujimoto, M., Ohte, S., Osawa, K., Miyamoto, A., et al. (2014). Smad9 is a new type of transcriptional regulator in bone morphogenetic protein signaling. Sci. Rep. 4:7596. doi: 10.1038/srep07596
Turner, S. D. (2014). qqman: an R package for visualizing GWAS results using Q-Q and manhattan plots. Biorxiv [Preprint]
Våge, D. I., Husdal, M., Kent, M. P., Klemetsdal, G., and Boman, I. A. (2013). A missense mutation in growth differentiation factor 9 (GDF9) is strongly associated with litter size in sheep. BMC Genet. 14:1. doi: 10.1186/1471-2156-14-1
VanRaden, P., Van Tassell, C., Wiggans, G., Sonstegard, T., Schnabel, R., Taylor, J., et al. (2009). Invited review: reliability of genomic predictions for North American Holstein bulls. J. Dairy Sci. 92, 16–24. doi: 10.3168/jds.2008-1514
Vitti, J. J., Grossman, S. R., and Sabeti, P. C. (2013). Detecting natural selection in genomic data. Annu. Rev. Genet. 47, 97–120. doi: 10.1146/annurev-genet-111212-133526
Wang, K., Li, M., and Hakonarson, H. (2010). ANNOVAR: functional annotation of genetic variants from high-throughput sequencing data. Nucleic Acids Res. 38:e164. doi: 10.1093/nar/gkq603
Xu, L., Zhao, G., Yang, L., Zhu, B., Chen, Y., Zhang, L., et al. (2019). Genomic patterns of homozygosity in Chinese local cattle. Sci. Rep. 9:16977. doi: 10.1038/s41598-019-53274-3
Xu, S.-S., Gao, L., Xie, X.-L., Ren, Y.-L., Shen, Z.-Q., Wang, F., et al. (2018). Genome-wide association analyses highlight the potential for different genetic mechanisms for litter size among sheep breeds. Front. Genet. 9:118. doi: 10.3389/fgene.2018.00118
Yang, J., Lee, S. H., Goddard, M. E., and Visscher, P. M. (2011). GCTA: a tool for genome-wide complex trait analysis. Am. J. Hum. Genet. 88, 76–82. doi: 10.1016/j.ajhg.2010.11.011
Yang, W., Yan, H., Wang, K., Cui, Y., Zhou, T., Xu, H., et al. (2019). Goat PDGFRB: unique mRNA expression profile in gonad and significant association between genetic variation and litter size. R. Soc. Open Sci. 6:180805. doi: 10.1098/rsos.180805
Yap, D. B., Walker, D. C., Prentice, L. M., Mckinney, S., Turashvili, G., Mooslehner-Allen, K., et al. (2011). Mll5 is required for normal spermatogenesis. PLoS One 6:e27127. doi: 10.1371/journal.pone.0027127
Yu, D., Chen, F., Zhang, L., Wang, H., Chen, J., Zhang, Z., et al. (2017). Smad9 is a key player of follicular selection in goose via keeping the balance of LHR transcription. bioRxiv [Preprint]
Yu, Y., Ouyang, Y., and Yao, W. (2017). shinyCircos: an R/Shiny application for interactive creation of Circos plot. Bioinformatics 34, 1229–1231. doi: 10.1093/bioinformatics/btx763
Zhang, C., Dong, S.-S., Xu, J.-Y., He, W.-M., and Yang, T.-L. (2018). PopLDdecay: a fast and effective tool for linkage disequilibrium decay analysis based on variant call format files. Bioinformatics 35, 1786–1788. doi: 10.1093/bioinformatics/bty875
Zhang, R.-Q., Lai, F.-N., Wang, J.-J., Zhai, H.-L., Zhao, Y., Sun, Y.-J., et al. (2018). Analysis of the SNP loci around transcription start sites related to goat fecundity trait base on whole genome resequencing. Gene 643, 1–6. doi: 10.1016/j.gene.2017.12.002
Zhang, R.-Q., Wang, J.-J., Zhang, T., Zhai, H.-L., and Shen, W. (2019). Copy-number variation in goat genome sequence: a comparative analysis of the different litter size trait groups. Gene 696, 40–46. doi: 10.1016/j.gene.2019.02.027
Zhang, X., Yan, H., Wang, K., Zhou, T., Chen, M., Zhu, H., et al. (2018). Goat CTNNB1: mRNA expression profile of alternative splicing in testis and association analysis with litter size. Gene 679, 297–304. doi: 10.1016/j.gene.2018.08.061
Zhao, Z., Park, C., Mcdevitt, M. A., Glidewell-Kenney, C., Chambon, P., Weiss, J., et al. (2009). p21-Activated kinase mediates rapid estradiol-negative feedback actions in the reproductive axis. Proc. Natl. Acad. Sci. U.S.A. 106, 7221–7226. doi: 10.1073/pnas.0812597106
Zhou, Y., Zhou, B., Pache, L., Chang, M., Khodabakhshi, A. H., Tanaseichuk, O., et al. (2019). Metascape provides a biologist-oriented resource for the analysis of systems-level datasets. Nat. Commun. 10:1523. doi: 10.1038/s41467-019-09234-6
Keywords: Jining Gray goat, litter size, genomic sequence, signatures of selection, candidate genes
Citation: Wang J-J, Zhang T, Chen Q-M, Zhang R-Q, Li L, Cheng S-F, Shen W and Lei C-Z (2020) Genomic Signatures of Selection Associated With Litter Size Trait in Jining Gray Goat. Front. Genet. 11:286. doi: 10.3389/fgene.2020.00286
Received: 05 November 2019; Accepted: 09 March 2020;
Published: 26 March 2020.
Edited by:
Fabyano Fonseca Silva, Universidade Federal de Viçosa, BrazilReviewed by:
Eugenio López-Cortegano, University of Edinburgh, United KingdomBo Xiong, Nanjing Agricultural University, China
Qing-Yuan Sun, Chinese Academy of Sciences, China
Copyright © 2020 Wang, Zhang, Chen, Zhang, Li, Cheng, Shen and Lei. This is an open-access article distributed under the terms of the Creative Commons Attribution License (CC BY). The use, distribution or reproduction in other forums is permitted, provided the original author(s) and the copyright owner(s) are credited and that the original publication in this journal is cited, in accordance with accepted academic practice. No use, distribution or reproduction is permitted which does not comply with these terms.
*Correspondence: Wei Shen, d3NoZW5AcWF1LmVkdS5jbg==; c2hlbndlaTQyN0AxNjMuY29t; Chu-Zhao Lei, bGVpY2h1emhhbzExMThAbndhZnUuZWR1LmNu; bGVpY2h1emhhbzExMThAMTI2LmNvbQ==