 Weilong Kong
 Tong Sun
- State Key Laboratory of Hybrid Rice, College of Life Sciences, Wuhan University, Wuhan, China
Polyol transporters (PLTs), also called polyol/monosaccharide transporters, is of significance in determining plant development and sugar transportation. However, the diverged evolutionary patterns of the PLT gene family in Gramineae crops are still unclear. Here a micro-evolution analysis was performed among the seven Gramineae representative crops using whole-genome sequences, i.e., Brachypodium distachyon (Bd), Hordeum vulgare (Hv), Oryza rufipogon (Or), Oryza sativa (Os), Sorghum bicolor (Sb), Setaria italica (Si), and Zea mays (Zm), leading to the identification of 12, 11, 12, 15, 20, 24, and 20 PLT genes, respectively. In this study, all PLT genes were divided into nine orthogroups (OGs). However, the number of PLT genes and the distribution of PLT OGs were not the same in these seven Gramineae species, and different OGs were also subject to different purification selection pressures. These results indicated that the PLT OGs of the PLT gene family have been expanded or lost unevenly in all tested species. Then, our results of gene duplication events confirmed that gene duplication events promoted the expansion of the PLT gene family in some Gramineous plants, namely, Bd, Or, Os, Si, Sb, and Zm, but the degree of gene family expansion, the type of PLT gene duplication, and the differentiation time of duplicate gene pairs varied greatly among these species. In addition, the sequence alignment and the internal repeat analysis of all PLTs protein sequences implied that the PLT protein sequences may originate from an internal repeat duplication of an ancestral six transmembrane helical units. Besides that, the protein motifs result highlighted that the PLT protein sequences were highly conserved, whereas the functional differentiation of the PLT genes was characterized by different gene structures, upstream elements, as well as co-expression analysis. The gene expression analysis of rice and maize showed that the PLT genes have a wide range of expression patterns, suggesting diverse biological functions. Taken together, our finding provided a perspective on the evolution differences and the functional characterizations of PLT genes in Gramineae representative crops.
Introduction
Sugar is the main product of plant photosynthesis. Sugar (monosaccharides, sucrose, and polyols) plays an important role in the entire life cycle of plants (Deng et al., 2019; Kong et al., 2019a). It can not only provide energy for the growth and the development of plants but also is used for storage and transportation (Kühn and Grof, 2010). In various plant metabolic pathways, sugar can be used as a signal molecule (Wingenter et al., 2010; Kong et al., 2019a). Plant sugar transporters mainly mediate the transportation of sugars, participate in the loading and unloading of various sugars between “source and sink” tissues, and affect the distribution of plant carbohydrates (Kong et al., 2019a; Misra et al., 2019; Patil et al., 2019). To date, more and more sugar transporters have been identified and experimentally verified in various plant species, namely, monosaccharide transporters (MSTs), sucrose transporters, and sugars will eventually be exported transporters (Jeena et al., 2019; Kong et al., 2019a; Misra et al., 2019).
As we all know, polyol transporters (PLTs) belong to a subfamily of the MST superfamily (Deng et al., 2019; Kong et al., 2019a). Previous studies have demonstrated that PLTs can transport polyols and monosaccharides, also known as polyol/monosaccharide transporters (PMTs) (Büttner, 2007; Klepek et al., 2010). Besides that, PLTs reportedly loaded polyols into the phloem or unloaded sugars from the phloem for accumulation in sink tissues (Noiraud et al., 2001; Watari et al., 2004; Conde et al., 2007; Juchaux-Cachau et al., 2007). The first PLT was identified in celery (Apium graveolens), named AgMaT1, which had a high affinity for mannitol (Km = 275 μM) and showed a high expression level in mature leaves (Noiraud et al., 2001). Next, AgMaT2 was identified as an H(+)/mannitol co-transporter, which was less selective for other polyol molecules in celery and played a role in defense mechanisms (Juchaux-Cachau et al., 2007). What is more, Arabidopsis PMT5 (AtPMT5) transported a broad range of sugars, including cyclic and linear polyols, hexoses, and pentoses (Klepek, 2005; Reinders et al., 2005; Klepek et al., 2010). A tissue expression analysis showed that AtPMT1 and AtPMT2 were relatively highly expressed in some immature tissues, such as young germinating pollen and pollen tubes. Notably, they had a high ability to transport fructose (Klepek, 2005; Klepek et al., 2010). In Lotus japonicus, 14 putative PLT genes were identified and three genes (LjPLT1, LjPLT3, and LjPLT9) among them were found to respond to salinity and/or osmotic stresses (Lu et al., 2017). Another example is the VvPLT1 gene in grapevine, which was up-regulated under salt- and water-deficit stresses, as well as exogenous salicylic acid and abscisic acid treatments, and had a high affinity for sorbitol and mannitol (Conde et al., 2015). Also, OeMaT1 in Olea europaea was significantly induced by salinity and drought stresses (Conde et al., 2011). Another study reported that Hevea brasiliensis HbPLT2 expressing yeast displayed active absorption of xylitol but a marginal level of absorption of inositol, mannitol, and sorbitol (Dusotoit-Coucaud et al., 2010).
Previous studies have focused on the transport substrate, tissue-specific expression, and subcellular localization of PLTs (Kühn and Grof, 2010). However, the evolutionary dynamics of PLT genes in plants are still unclear. Given the strong transportation capacity of PLTs, they are of great significance to the growth and the yield increase of Gramineae crops. On the other hand, several Gramineae crops with high-quality genomes are ideal model systems to study the short-term evolutionary dynamics of gene families and their consequences (Kong et al., 2019a,b,c). Here seven Gramineae crops, namely, Brachypodium distachyon (Bd), Hordeum vulgare (Hv), Setaria italica (Si), Sorghum bicolor (Sb), Zea mays (Zm), Oryza rufipogon (Or), and Oryza sativa (Os), were selected for a systematical study of Gramineae PLT gene family, including evolutionary analysis, topology, 3D structure, genetic structure, conserved domains, gene duplication events, selection pressures, orthogroups (OGs), co-expression analysis, upstream elements in promoters, and tissue expression analysis. Our study will facilitate further molecular evolution and function study of Gramineae PLTs.
Materials and Methods
Plant Materials and Treatments
Seedlings of rice cultivar “9311” (O. sativa ssp. indica) were grown in containers with sponges as supporting materials in Yoshida solution in a Wuhan University greenhouse, with 16/8-h light/dark photoperiod at 26°C and 60% relative humidity (Deng et al., 2019; Kong et al., 2019a). The 12-day-old seedlings were changed to 40 and 4°C for the hot and the cold treatments. The leaves were collected at 0, 1, 3, 6, and 12 h after the hot or the cold treatment (Kong et al., 2019a).
In this study, three biological replicates of every treatment were generated, and each biological replicate was collected and pooled together from over 12 plants. To ensure the accuracy of the results, three technical replicates were set for each biological replicate in quantitative real-time PCR (qRT-PCR) (Kong et al., 2019d).
Identification and Phylogenetic Tree Construction of PLT Genes
Firstly, the genome databases of Bd, Hv, Si, Sb, Zm, and Or were obtained from Ensembl Plants release 411. A genome database of Os (MSU 7.0) was downloaded from TIGR Database2. The hidden Markov model profile of the Sugar_tr (PF00083) was downloaded from the Pfam website3. Then, all these candidate PTL protein sequences were separately obtained by HMMER 3.2.1 with default parameters (Finn et al., 2011) and BlastP homology search with E-value cutoff e–5 (Kong et al., 2017; Wu et al., 2019). Only the longest splice variant of each gene locus was adopted in this study. After removing the redundant sequences, all candidate PLT protein sequences were submitted to SMART4, Pfam5, and National Center for Biotechnology Information Protein Basic Local Alignment Search Tool6 to confirm the highly conserved Sugar_tr domain (Kong et al., 2017; Kong et al., 2019d).
Multiple sequence alignment of all full-length PLT protein sequences was performed using MUSCLE with default parameters (Edgar, 2004). We used ModelFinder software to determine that the best substitution model of the aligned PLT protein sequences was JTT + F + G4 (Kalyaanamoorthy et al., 2017). Subsequently, the tree reconstruction was conducted by the IQ-tree software with a bootstrap test for 1,000 replicates and an SH-aLRT test for 1,000 random addition replicates (Nguyen et al., 2015).
Orthogroup Analysis of PLTs, Gene Duplicate Events, and Selective Stress Analysis
PLT OGs were identified using OrthoFinder software with default parameters after an all-vs-all BlastP search of PLT protein sequences with E-value of 1 e–3 (Emms and Kelly, 2015; Kong et al., 2019d). Additionally, the selective forces on OGs were evaluated by Tajima’s D-values using DnaSP 5.0 (Librado and Rozas, 2009; Kalyaanamoorthy et al., 2017).
In order to explore the expansion mechanism of the PLT gene family in Gramineous crops, the gene duplication events of PLT genes were analyzed with default parameters using the “duplicate_gene_classifier” script in Multiple Collinearity Scan toolkit X version (MCScanX) after a BlastP search of intraspecies PLT protein sequences with an E-value of 1 e–5 (Wang et al., 2012; Kong et al., 2019a). Next, the physical gene locations and the gene duplication events of PLT genes were visualized by Circos (Krzywinski et al., 2009).
In this study, we used DnaSP v5.0 software to determine non-synonymous (Ka) to synonymous (Ks) substitution rates (Ka/Ks) of duplicate gene pairs in seven tested species (Librado and Rozas, 2009; Kong et al., 2019b). Furthermore, the divergence time of the duplicate gene pairs was predicted using the formula: T = Ks/(2 × 9.1 × 10–9) × 10–6 Mya (Deng et al., 2019; Kong et al., 2019c).
Internal Repeat Analyses, Transmembrane Helical Domains, 3D Structure Analysis, Conserved Motifs, and Gene Structures
The multiple alignment result of all PLT protein sequences was generated by the Clustal X software (Thompson et al., 1997) for internal repeat analyses for exploring the generation mechanism of PLT proteins. HHrepID was used to generate the internal repeats with these parameters: maximal number of multiple sequence alignment generation steps was one, score secondary structure was no, repeat family P-value threshold was 1 e–2, self-alignment P-value threshold was 1 e–1, merge rounds was three, and domain boundary detection was no (Biegert and Söding, 2008). At the same time, we also predicted the transmembrane helical (TMH) domains of all PLT protein alignment results in TMHMM Severv.2.07 (Kong et al., 2019b). On the other hand, the 3D structure models of all rice PLT protein sequences were analyzed in the SWISS-MODEL website8 with default parameters, and the best template result was chosen for each PLT protein sequence (Waterhouse et al., 2018).
The MEME online tool9 was used to search the conserved motifs of all PLTs protein sequences, with a motif width of 6–100 amino acids, a limit of 20 motifs, and all other default parameters (Bailey et al., 2015). A gene exon–intron structure analysis of all PLT genes was performed on the Gene Structure Display Server 2.0 (GSDS 2.010) (Hu et al., 2015).
Quantitative Analysis of Rice PLT Genes Under Heat and Cold Stresses
All RNAs were extracted by the TRIzol reagent (Invitrogen, Beijing, China) and reversed to cDNAs using HiScript III 1st Strand cDNA Synthesis Kit (Vazyme, Shanghai, China). The qRT-PCR reactions (10 μl) were formulated using 2× SYBR Green qPCR Master Mix (US Everbright® Inc., Suzhou, China), following the manufacturer’s instructions. The qRT-PCR reactions were detected on a CFX96 TouchTM Real-Time PCR Detection System (Bio-Rad, Hercules, CA, United States). The actin gene was used as an internal control (An et al., 2017; Kong et al., 2019b), and relative expression values were calculated by 2–ΔΔCT method based on three biological replicates, with each replicate having three technical replicates (Kong et al., 2019d).
Cis-Elements, Expression Analyses, and Co-expression Analysis
Two-kbp upstream sequences from the transcription start site of all PLT genes in these seven tested species were regarded as promoter sequences and extracted from gff3 and genetic fasta using Gtf/Gff3 sequences extractor tool in TBtools (Chen et al., 2018). Then, all upstream promoter sequences were submitted to the PLANTCARE website for the cis-elements identification (Lescot et al., 2002). To determine the expression patterns of PLT genes in rice and maize, the RNA-seq data of various tissues from rize and maize were obtained from the MBKbase database11 (Peng et al., 2020) and the maize eFP Browser12 (data source: Hoopes et al., 2019), respectively. The fragments per kilobase of transcript per million mapped reads values were used to represent the gene expression levels in this study, and all heatmaps were made by R package (pheatmap) (Kolde, 2012).
To understand the potential molecular regulation and gene network, the correlation coefficient between PLT genes was calculated based on Pearson coefficient. On the other hand, the co-expression network of rice PLT genes was constructed based on massive expression data (including 9 tissues, 24 projects, and 284 experiments) using a co-expression tool in the Rice Expression Database (RED13). Here the MSU 7.0 gene IDs of the PTL genes were input IDs, and the Pearson’s r-value was 0.85. The co-expressed gene network was visualized with Cytoscape V 3.6.1 (Shannon et al., 2003). Next, a gene ontology (GO) enrichment analysis of the obtained co-expressed genes was implemented by the GOseq R packages based on Wallenius non-central hyper-geometric distribution (Young et al., 2010).
Results
Identification and OG Classification of PLT Genes
A total of 114 PLT genes were identified in these seven tested Gramineae crops, namely, 12 in Bd, 11 in Hv, 12 in Or, 15 in Os, 20 in Sb, 24 in Si, and 20 in Zm (Figures 1, 2A, 5A and Supplementary Table S1). We found that Sb, Si, and Zm had more PLT genes than Bd, Hv, Or, and Os (Figures 1, 2C). In order to further analyze the reasons for the quantitative differences of the PLT genes in these tested species, a phylogenetic tree and OGs classification were conducted. As a result, all PLT proteins were clearly divided into nine OGs based on OrthoFinder analysis, namely, OG1, OG2, OG3, OG4, OG5, OG6, OG7, OG8, and OG9 (Figures 1, 2). The PTL genes in the same OGs were clustered together in the phylogenetic tree (Figures 1, 2 and Supplementary Tables S1, S2). We thus inferred that the number difference of the PLT gene among these tested species may be caused by the unequal loss and expansion of OGs in these different Gramineae crops (Figure 2 and Supplementary Table S2). For example, Hv had the smallest number of PLT genes, probably due to its loss of OG9 compared to other species in this study (Figure 2 and Supplementary Table S2). Another reason was that OG1 and OG2 expanded more obviously in Sb, Si, and Zm than in Bd, Hv, Or, and Os, which resulted in more PLT genes in Sb, Si, and Zm than in Bd, Hv, Or, and Os (Figure 2A and Supplementary Table S2). In addition, the specific expansion of OGs in the individual tested species also contributed to the difference in the number of PLT genes between species, namely, the specific expansion of OG5 in Sb, OG6 in Zm, and OG7 in Si (Figure 2A and Supplementary Table S2). Interestingly, OG8 was a single OG, which implied that the PLT gene in OG8 was very conservative during the evolution of Gramineae crops (Figure 2C and Supplementary Table S2). Furthermore, the orthologs were counted and summarized based on the OrthoFinder analysis result (Figure 2C and Supplementary Tables S3, S4). As expected, Sb, Si, and Zm had more orthologs than Bd, Hv, Or, and Os (Figure 2B). All orthologs could be divided into four types: many to many, one to one, many to one, and one to many (Supplementary Tables S3, S4). Finally, we evaluated the selection pressure of these nine OGs according to Tajima’s D-values using DnaSP 5.0 software. The result showed that the Tajima’s D-values of these nine OGs were less than 0, and from −0.1669 to −1.597 (Figure 2C), which denoted that these nine OGs were subjected to different intensities of purification selection pressure.
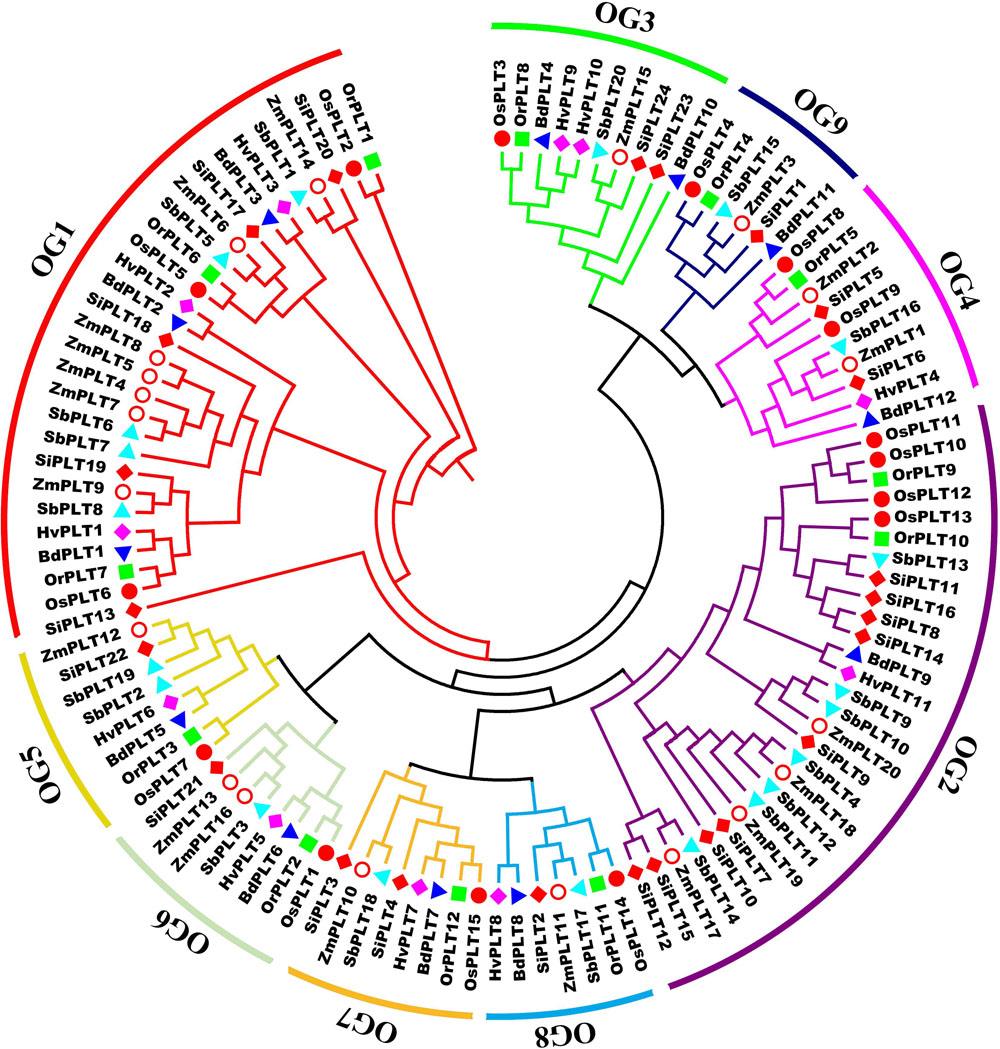
Figure 1. A maximum likelihood phylogeny tree of the polyol transporter protein sequences from seven Gramineae crops, namely, Brachypodium distachyon (Bd), Hordeum vulgare (Hv), Setaria italica (Si), Sorghum bicolor (Sb), Zea mays (Zm), Oryza rufipogon (Or), and Oryza sativa ssp. japonica (Os). This tree was established by IQ-tree software with a 1,000-replicate bootstrap test and a 1,000-random-addition-replicate SH-aLRT test. The colors in the outside circles and the inside branches represent different orthogroups (OG), including OG1, OG2, OG3, OG4, OG5, OG6, OG7, OG8, and OG9. Markers of different shapes markers indicate the different species in the phylogeny tree. The orthogroup analysis was performed using OrthoFinder v2.0 software with default parameters.
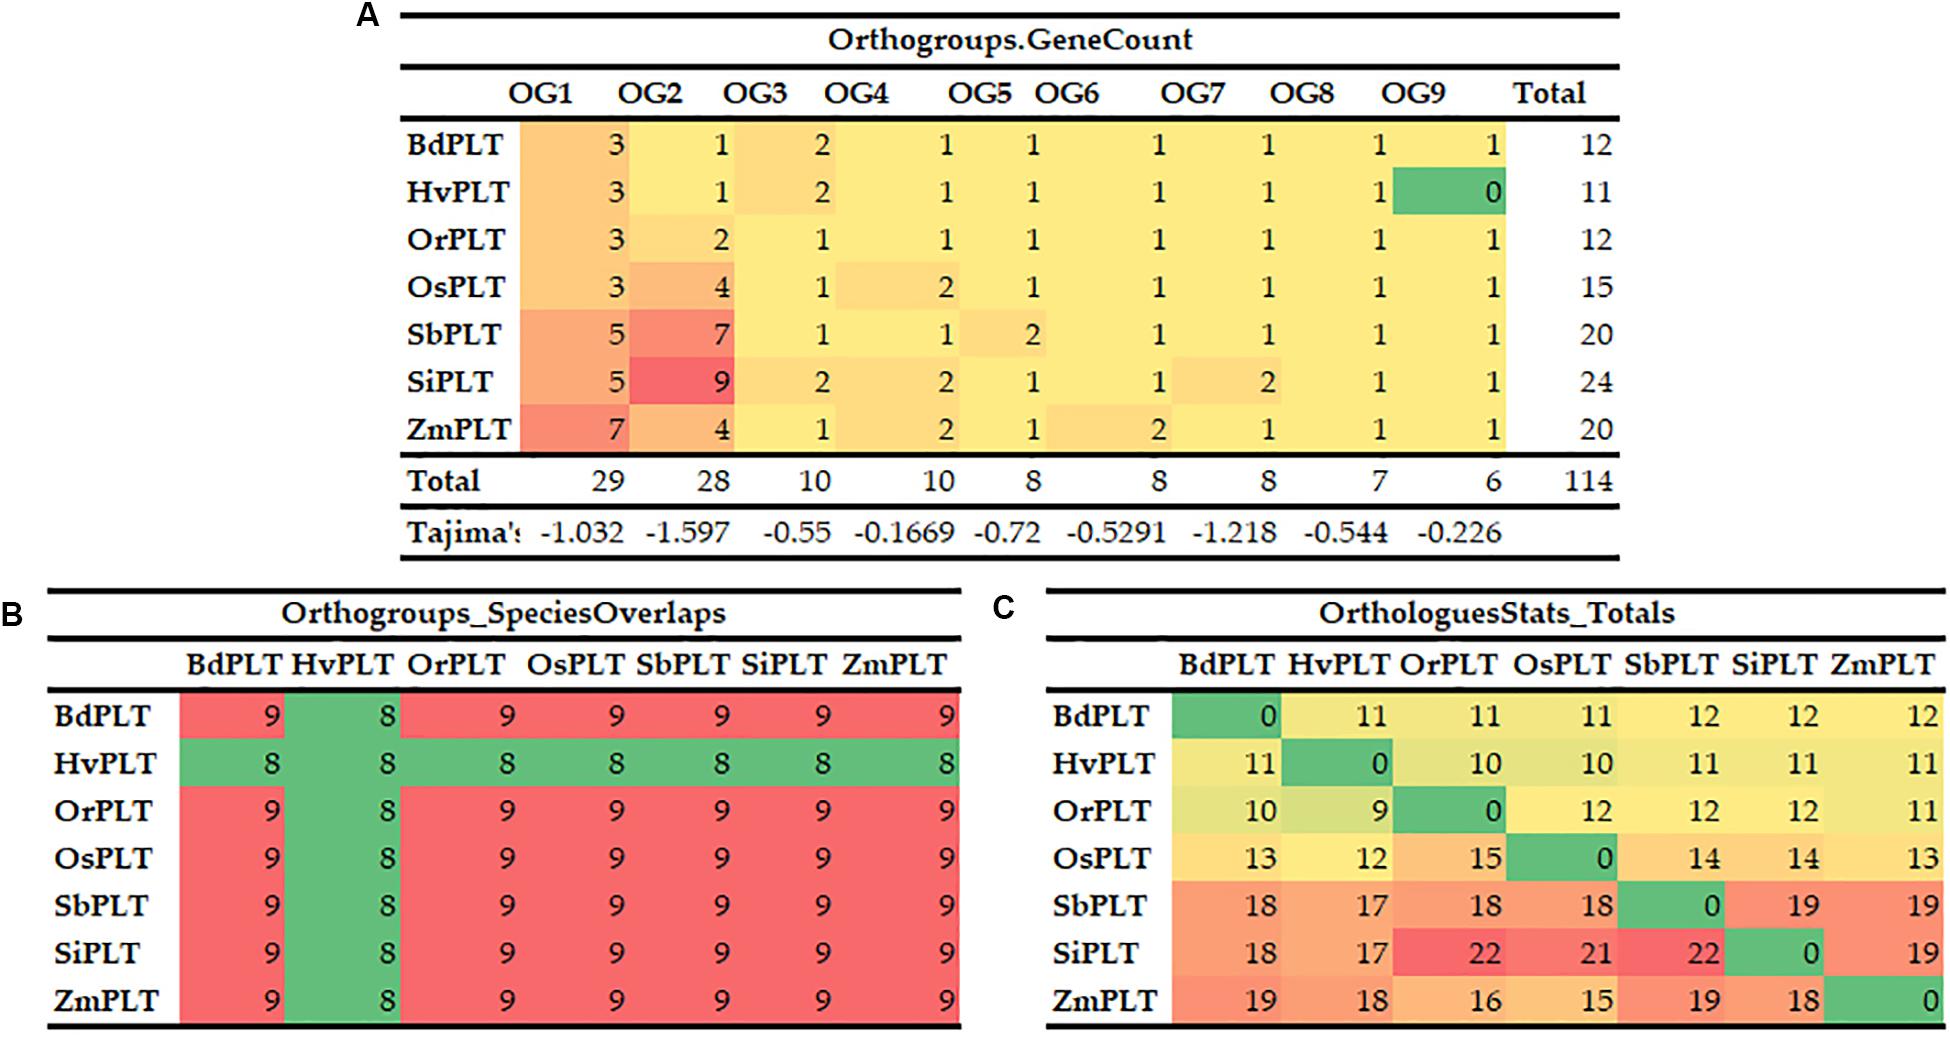
Figure 2. Orthogroups of PLT genes among the seven Gramineae crops, namely, BdPLT, HvPLT, OrPLT, OsPLT, SbPLT, SiPLT, and ZmPLT. Orthogroup overlaps (A), statistical results of orthologous genes between different crops (B), and gene counts and Tajima’s values of different orthogroups in these seven crops (C).
Gene Duplicate Events of OGs and Selective Pressure of Duplicate Gene Pairs
In order to learn the specific expansion mechanism of OGs, duplicate gene pairs were identified and classified by MCScanX software (Wang et al., 2012). The result showed that a total of nine duplicate gene pairs originated from tandem duplication events, namely, one in Or, two in Os, two in Si, three in Sb, one in Zm, and zero in Hv and Bd (Figure 3 and Table 1). Besides that, six duplicate gene pairs from whole-genome duplication (WGD) or segmental duplication (SD) events were discovered in Bd (one), Zm (two), and Si (three). These results proved that gene duplications played significant roles in the OG expansion of the PLT gene family in these important Gramineae crops. Subsequently, the selective stress and the divergence time of these duplicate gene pairs were calculated to reveal the expansion differences of the PLT genes in these Gramineae crops. All Ka/Ks values of PLT duplicate gene pairs ranged from 0.25 to 0.77, suggesting that these duplicate gene pairs were mainly subject to purification selection pressure. Notably, the divergence times of the tandem duplication gene pairs were both later (<23 MYa) than that of the WGD/SD gene pairs (>24 MYa). These results indicated that the earlier expansion mode of all the Gramineous tested crops was WGD/SD and the later expansion mode was TD.
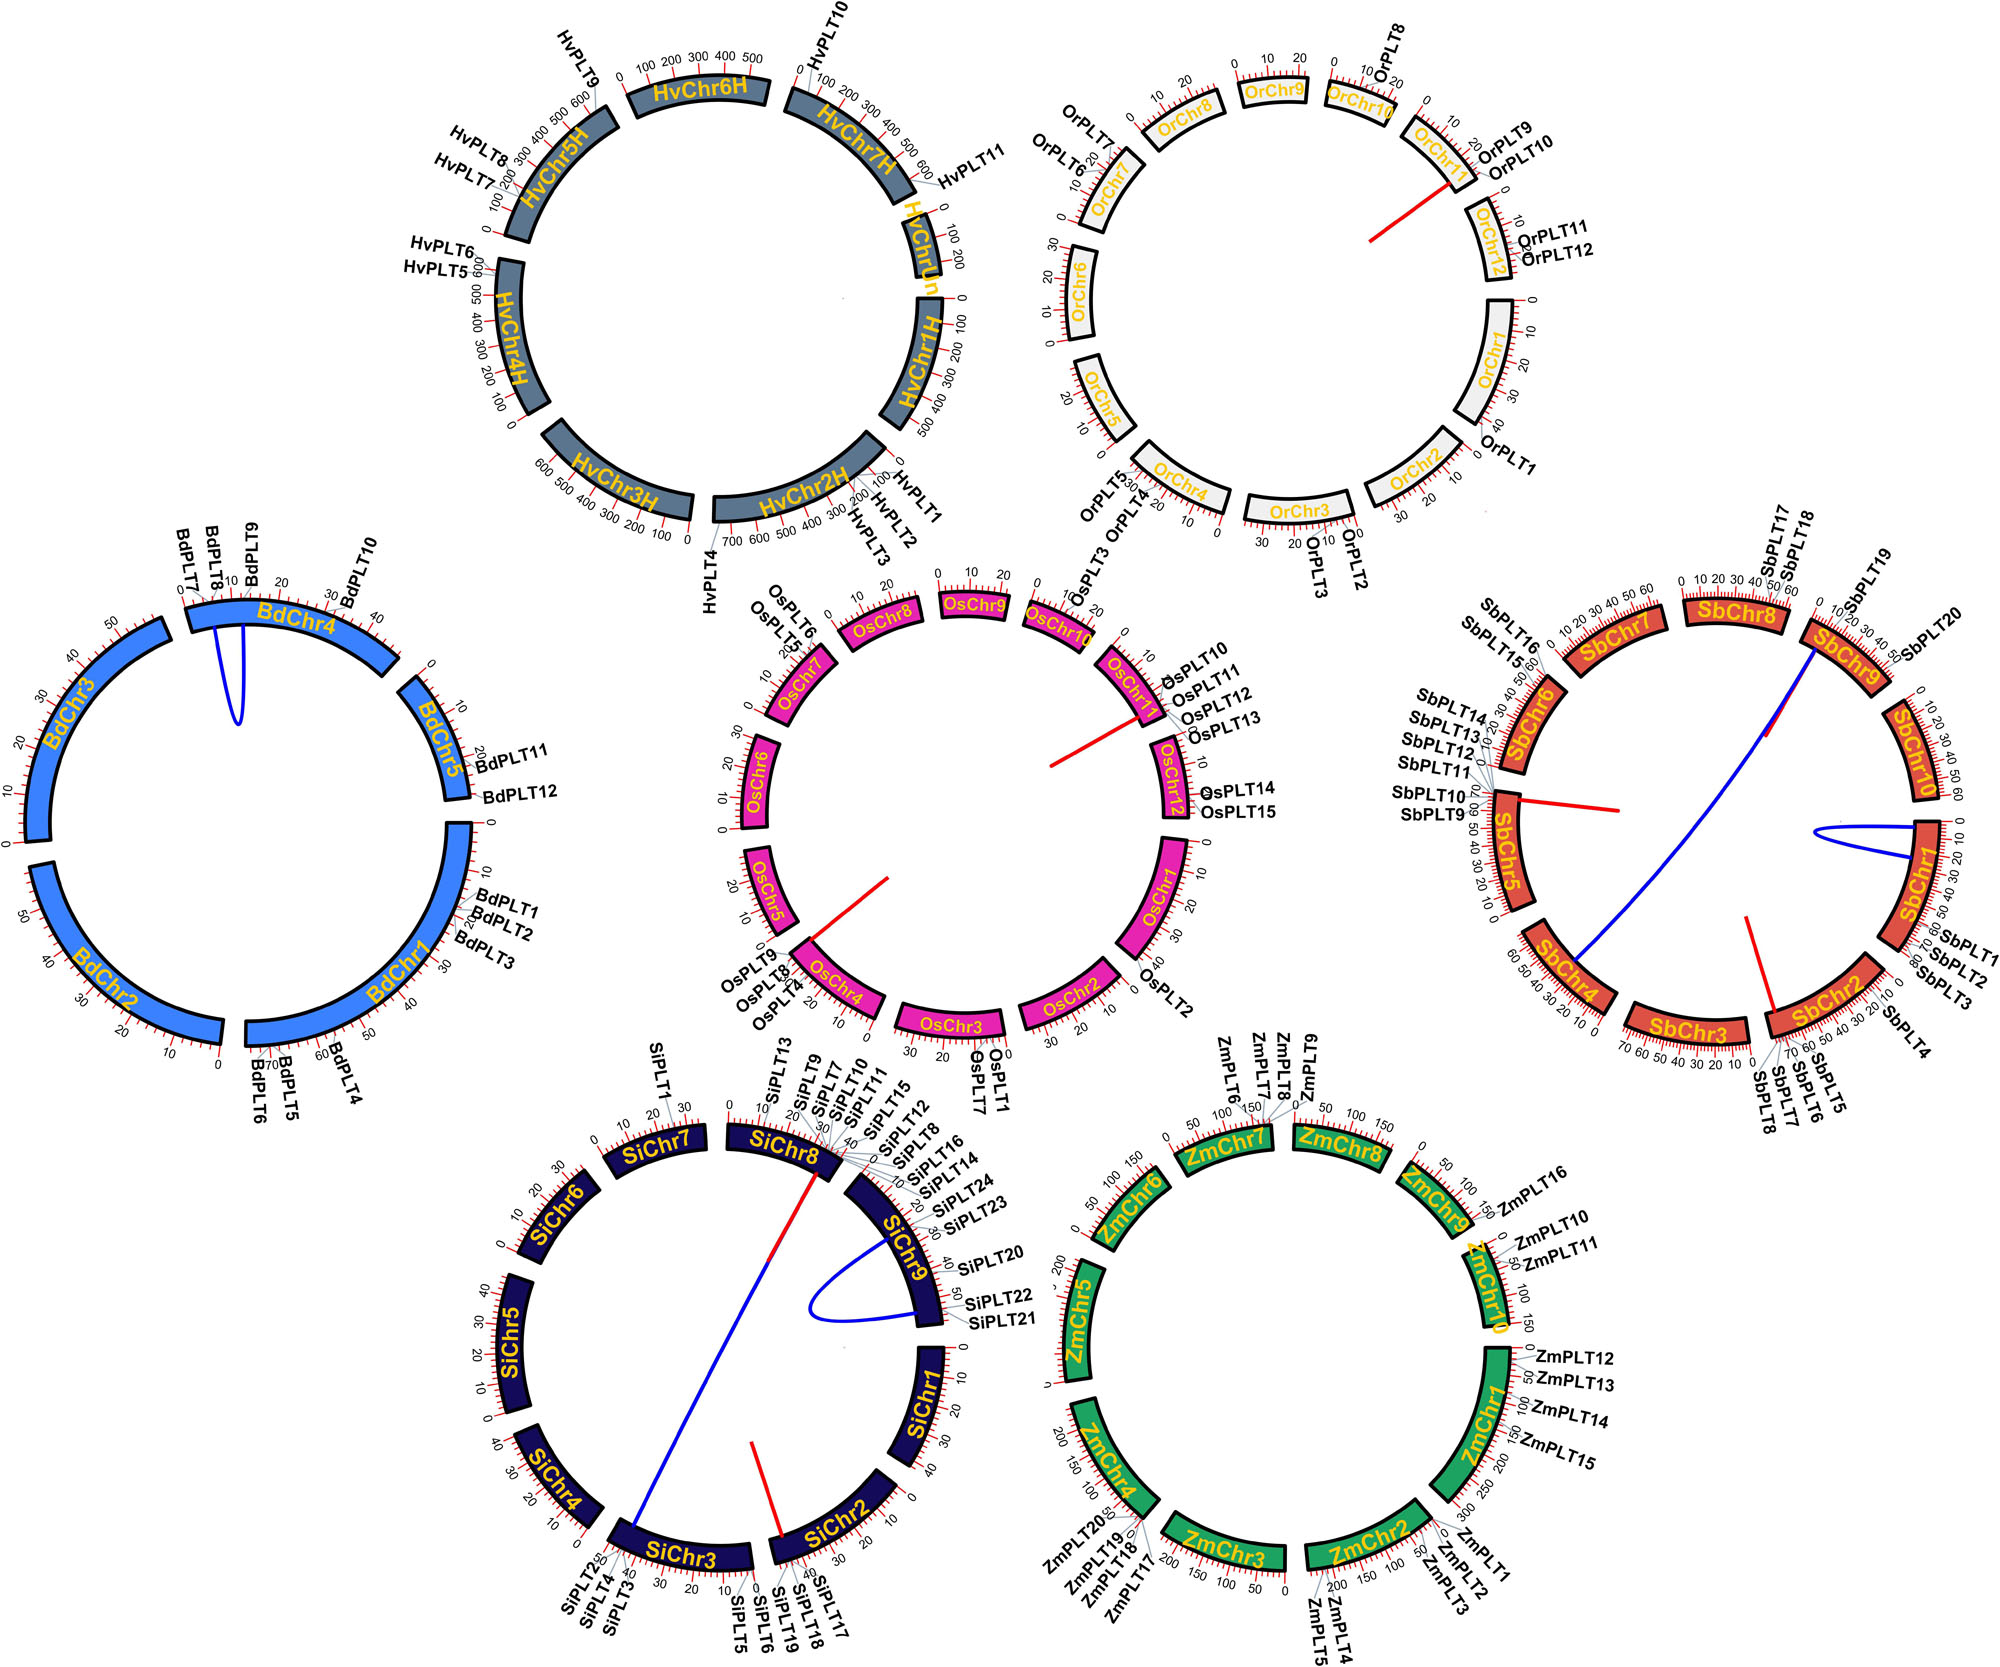
Figure 3. The chromosome locations and gene duplication events of PLT genes in seven species, namely, Brachypodium distachyon (Bd), Hordeum vulgare (Hv), Setaria italica (Si), Sorghum bicolor (Sb), Zea mays (Zm), Oryza rufipogon (Or), and Oryza sativa ssp. japonica (Os). The red line meant tandem duplication and the blue line meant whole-genome duplication/segmental duplication and tandem duplication.
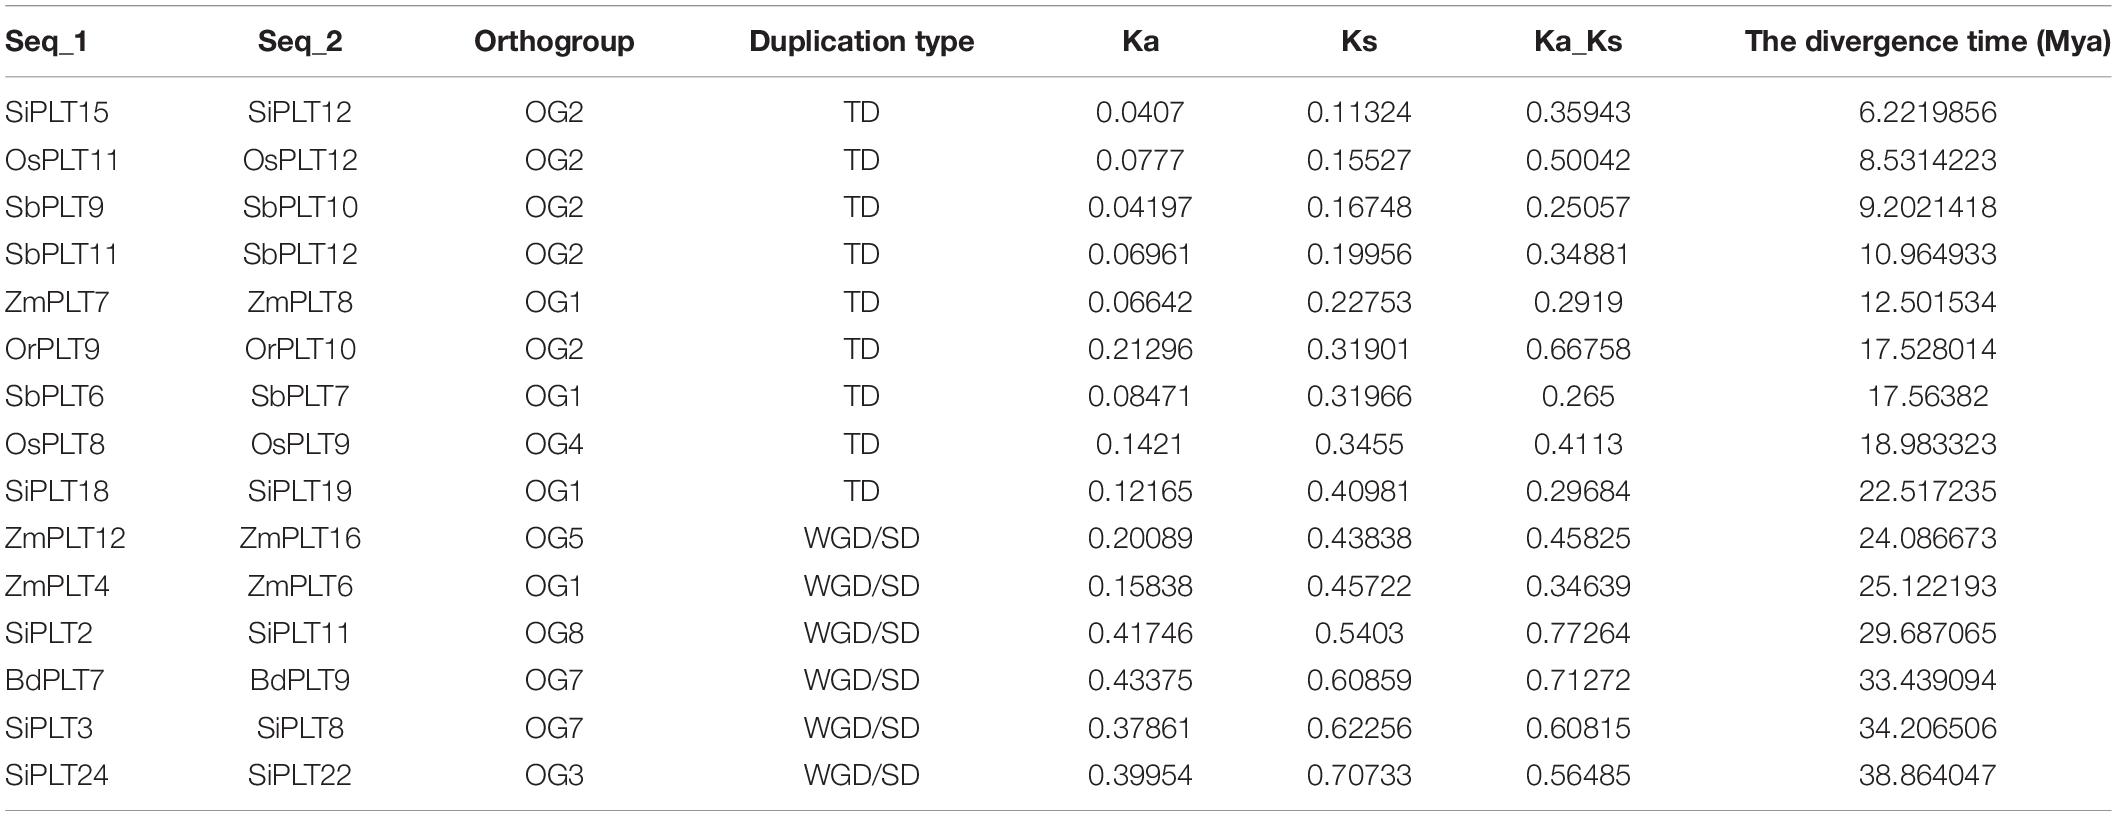
Table 1. Ka/Ks values and the divergence times of duplicate gene pairs in seven tested species.
TMH Prediction, Internal Repeat Analyses, Conserved Motifs, and Gene Structure Analysis
Our results of the protein sequence alignment and the TMH prediction revealed that all PLT protein sequences were strictly conserved and both had 12 TMHs, which supported the previous conclusion that PLT proteins consisted of 12 TMHs (Figure 4; Johnson et al., 2006). Interestingly, we also noticed that the first six TMHs were very similar to the next six TMHs (Figure 4). Therefore, we used the HHrepID program to perform the internal repeat analysis for all PLT protein sequences. As expected, we found that TMH1–TMH6 and TMH7–TMH12 were distributed in two duplicated regions, i.e., A1 and A2 (Figure 4 and Supplementary Figure S1), which implied that PLT protein sequences may originate from an internal repeat duplication of an ancestral six-TMH unit. Our findings were in agreement with the original hypotheses and provided a theoretical basis (Saier, 2000; Johnson et al., 2006). What is more, the 3D-structure models and ligands were predicted by the SWISS-MODEL website. We found that all PLT proteins belonged to two templates, namely, OsPLT4, OsPLT5, OsPLT6, OsPLT10, and OsPLT14 in 6h7d.1. A (description: sugar transport protein 10) and OsPLT1, OsPLT2, OsPLT3, OsPLT7, OsPLT8, OsPLT9, OsPLT11, OsPLT12, OsPLT13, and OsPLT15 in 6n3i.1. A (description: D-xylose transporter) (Supplementary Figure S2 and Supplementary Table S5). Among them, OsPLT4 had a ligand; the ligand was 1× OLC: (2R)-2,3-dihydroxypropyl(9Z)-octadec-9-enoate (Supplementary Table S5).
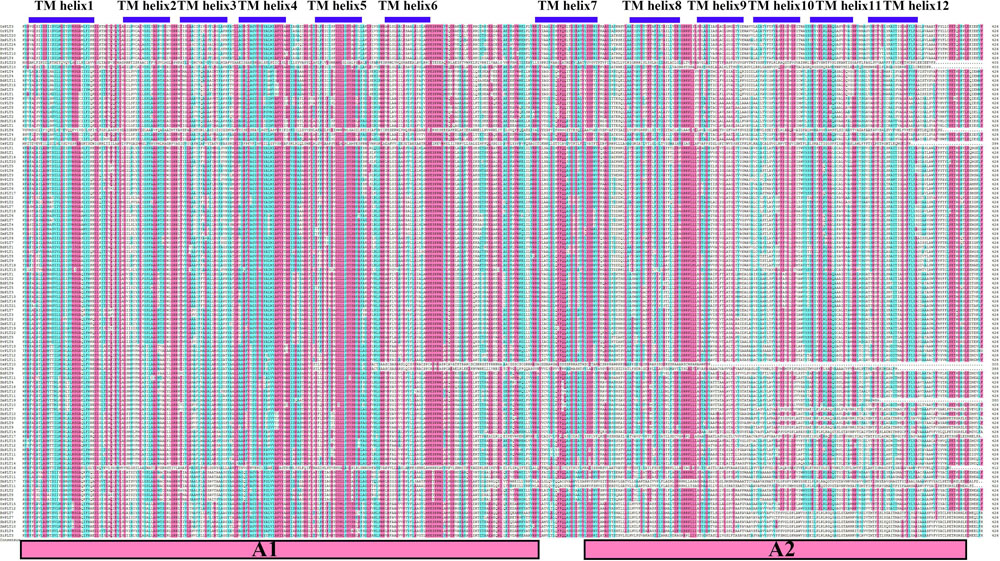
Figure 4. Sequence alignment result of polyol transporter protein sequences. The residues in red background represent the highly conserved residues. Twelve transmembrane helices were marked by blue boxes and the two functional duplicated regions are shown in red boxes at the bottom, namely, A1 and A2.
To further explore the conservation and the sequence variation of the PLT genes in Gramineous crops, we separately utilized the MEME suite and GSDS 2.0 to predict the distribution of conserved domains and the intron–exon composition of all the PLT genes. Interestingly, all PLT protein sequences showed almost the same motif distribution, suggesting that the PLT proteins were very conserved in all tested species (Figure 5B). However, the PLT genes from the same OGs showed different intron–exon compositions among these seven tested species (Figure 5C). It was speculated that genetic sequence loss and exon fusion may occur during the evolution of the PLT gene family.
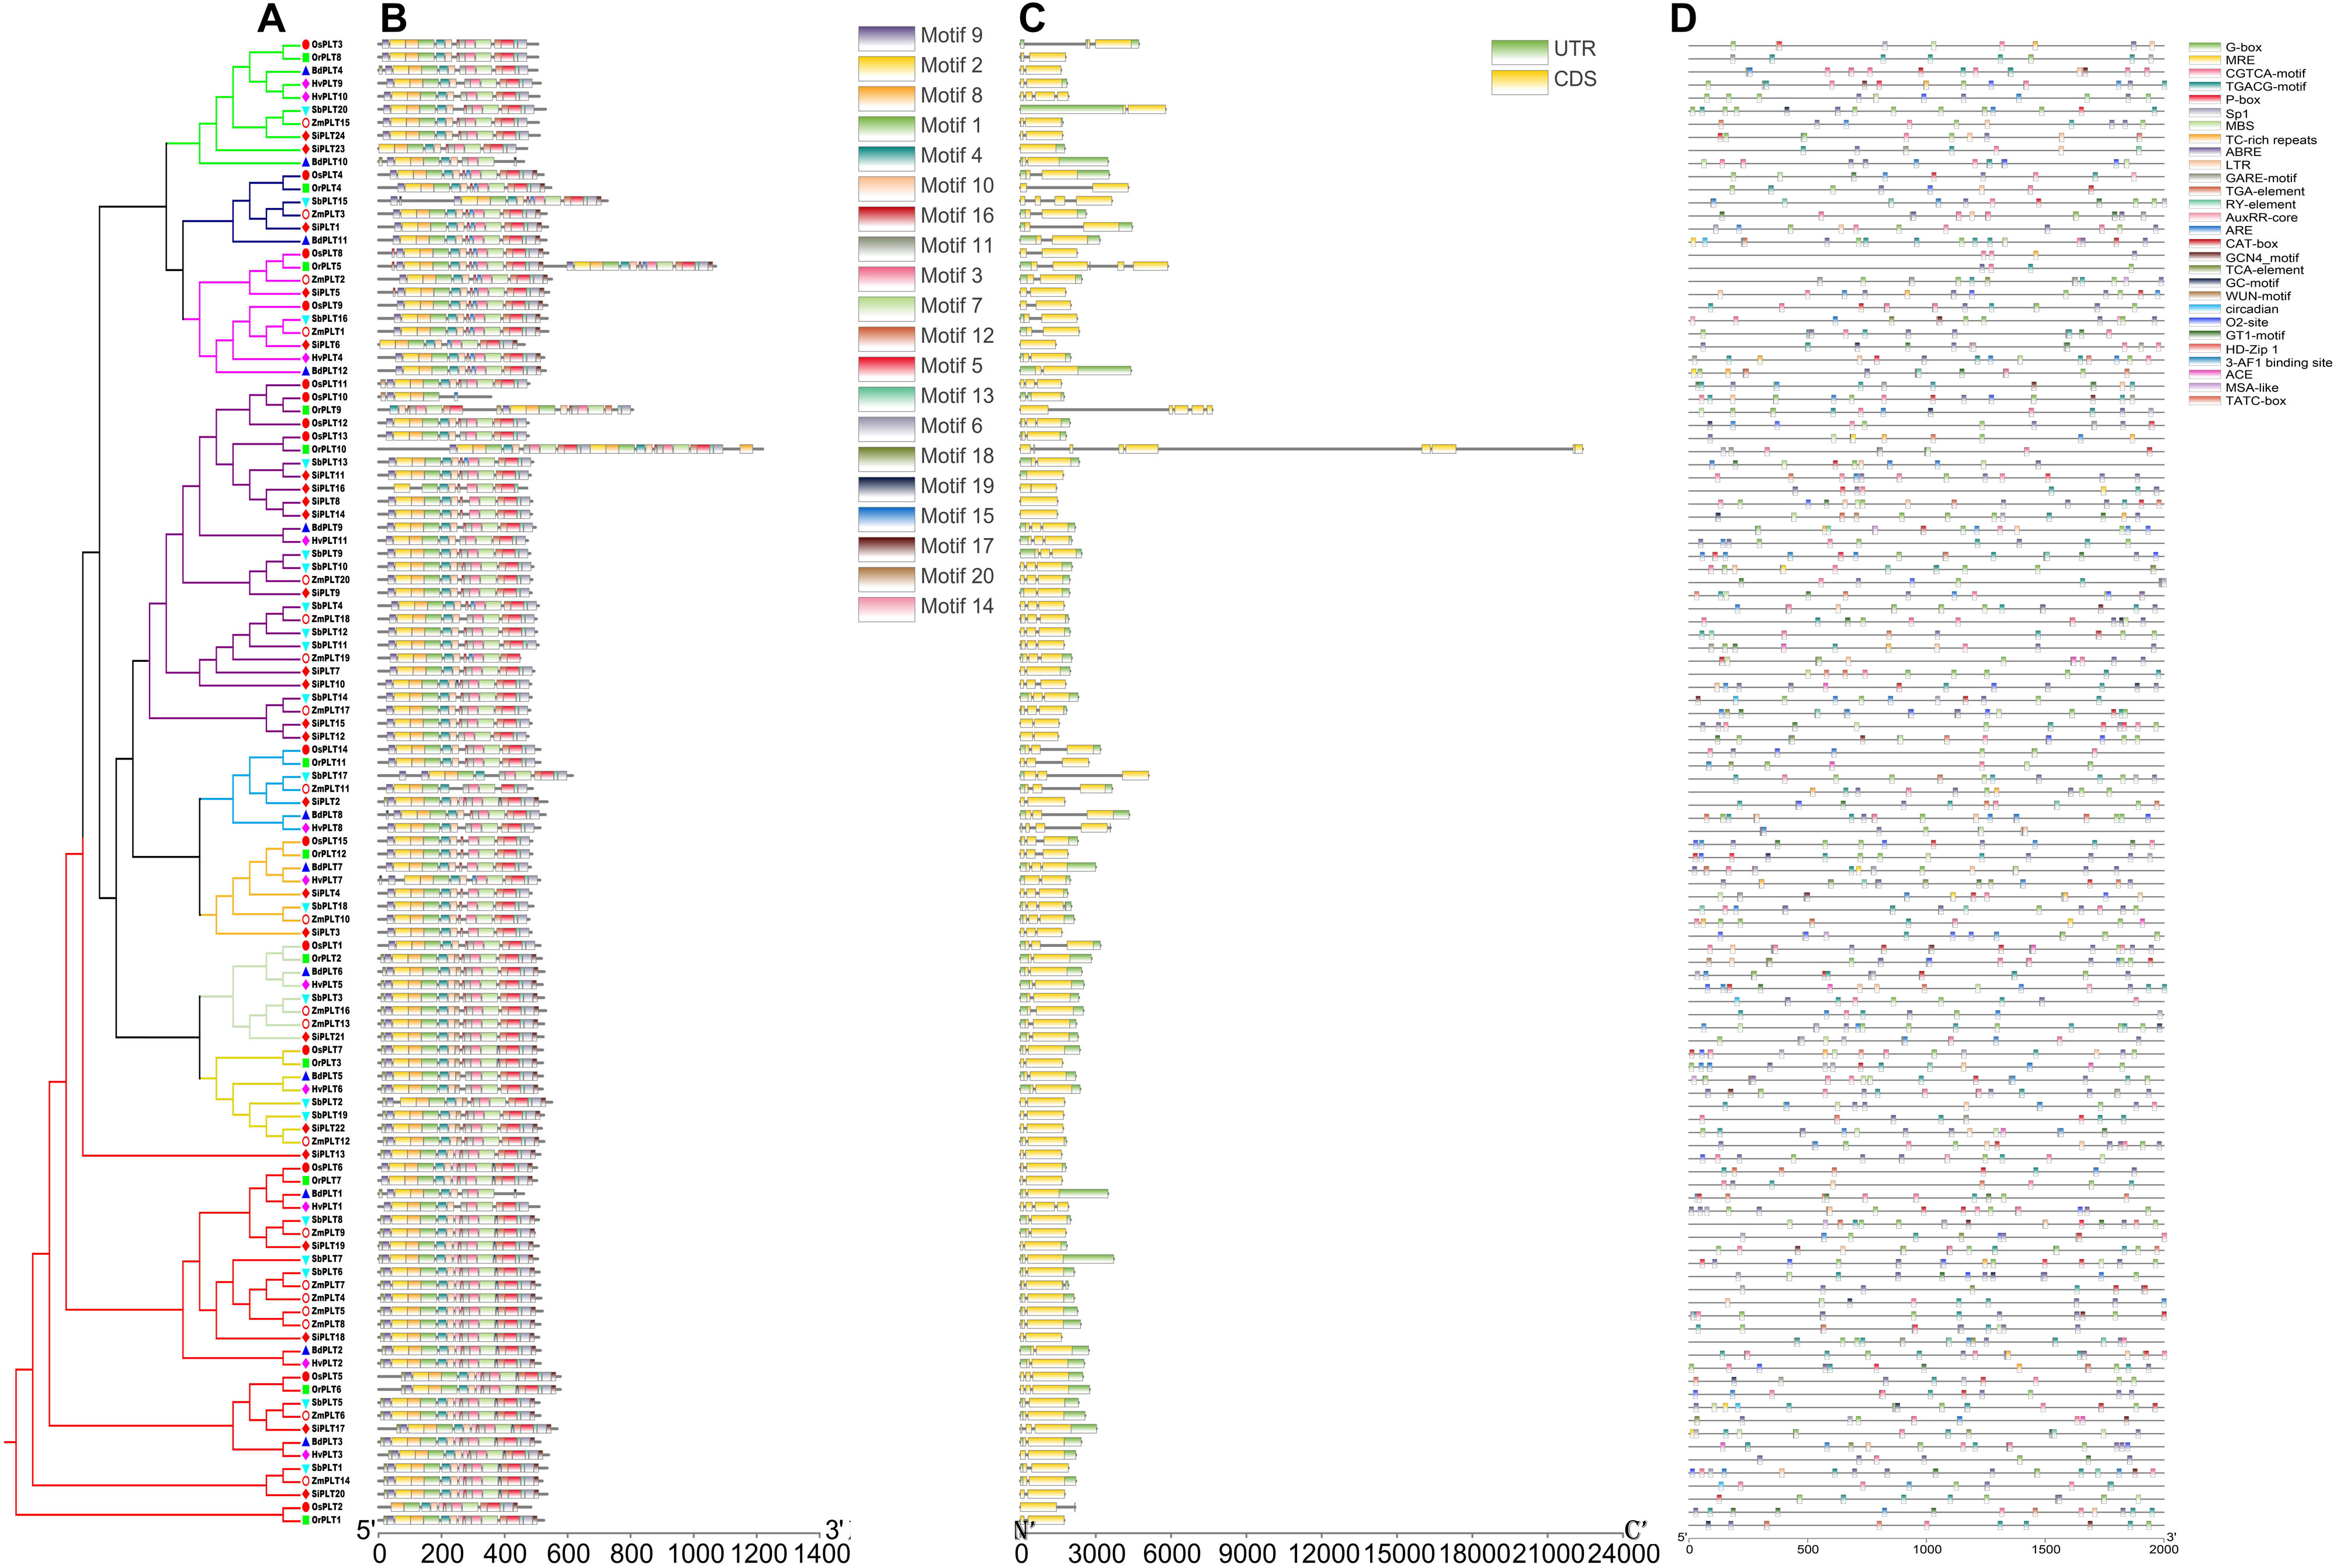
Figure 5. The phylogenetic tree (A), conserved motif (B), exon/intron compositions (C) and cis-elements (D) in the upstream promoters of the PLT genes in these seven species. The different colors of the branches represent different orthogroups and the different shapes of the markers mean different species in the phylogeny tree. The relative lengths of genes and proteins are shown by the width of the gray bars. The different motifs/cis-elements are distinguished by different colored boxes. The exons and introns are displayed by yellow boxes and gray lines, respectively.
Cis-Elements in Upstream Promoters and Gene Expression Analysis of Rice and Maize PLT Genes
The analysis of upstream elements and gene expression can provide a perspective for gene function speculation and functional differentiation research (Cao et al., 2019; Kong et al., 2019a; Zhang et al., 2020). We thus investigated the upstream elements of all the PLT genes in Gramineous crops and the PLT gene expression in various tissues of rice and maize at different developmental stages. Additionally, the expression changes of rice PLT genes was also detected by qRT-PCR.
A total of 2,670 cis-elements responsible for growth and development, phytohormone responses, light responsiveness, and stress responses were identified and unevenly distributed on the promoters of all the PLT genes (Figure 5D and Supplementary Table S6). The statistics of all cis-elements showed that 48% of them belonged to phytohormone responses and were involved in abscisic acid responsiveness, auxin responsiveness (AuxRR-core and TGA-element), gibberellin responsiveness (GARE-motif, P-box, and TATC-box), MeJA responsiveness (TGACG-motif), and salicylic acid responsiveness (TCA-element) (Figure 6 and Supplementary Table S6). A total of 24% of the elements were light responsiveness elements, including, G-box, GT1-motif, Sp1, MRE, ACE, and 3-AF1 (Figure 6 and Supplementary Table S6). The cis-elements associated with plant growth and development (11%) were CAT-box, responsible for meristem expression; O2, site responsible for zein metabolism regulation; RY, element responsible for seed-specific regulation; GCN4_motif, responsible for endosperm expression; circadian, responsible for circadian control; MSA-like element, responsible for cell cycle regulation; as well as HD-Zip, responsible for the differentiation of the palisade mesophyll cells (Figure 6 and Supplementary Table S6). In addition, ARE, MBS, LTR, TC-rich, GC-motif, and WUN-motif cis-elements were involved in anaerobic induction, drought inducibility, low temperature responsiveness, defense and stress responsiveness, anoxic-specific inducibility, and wound responsiveness, respectively (Figure 6 and Supplementary Table S6).
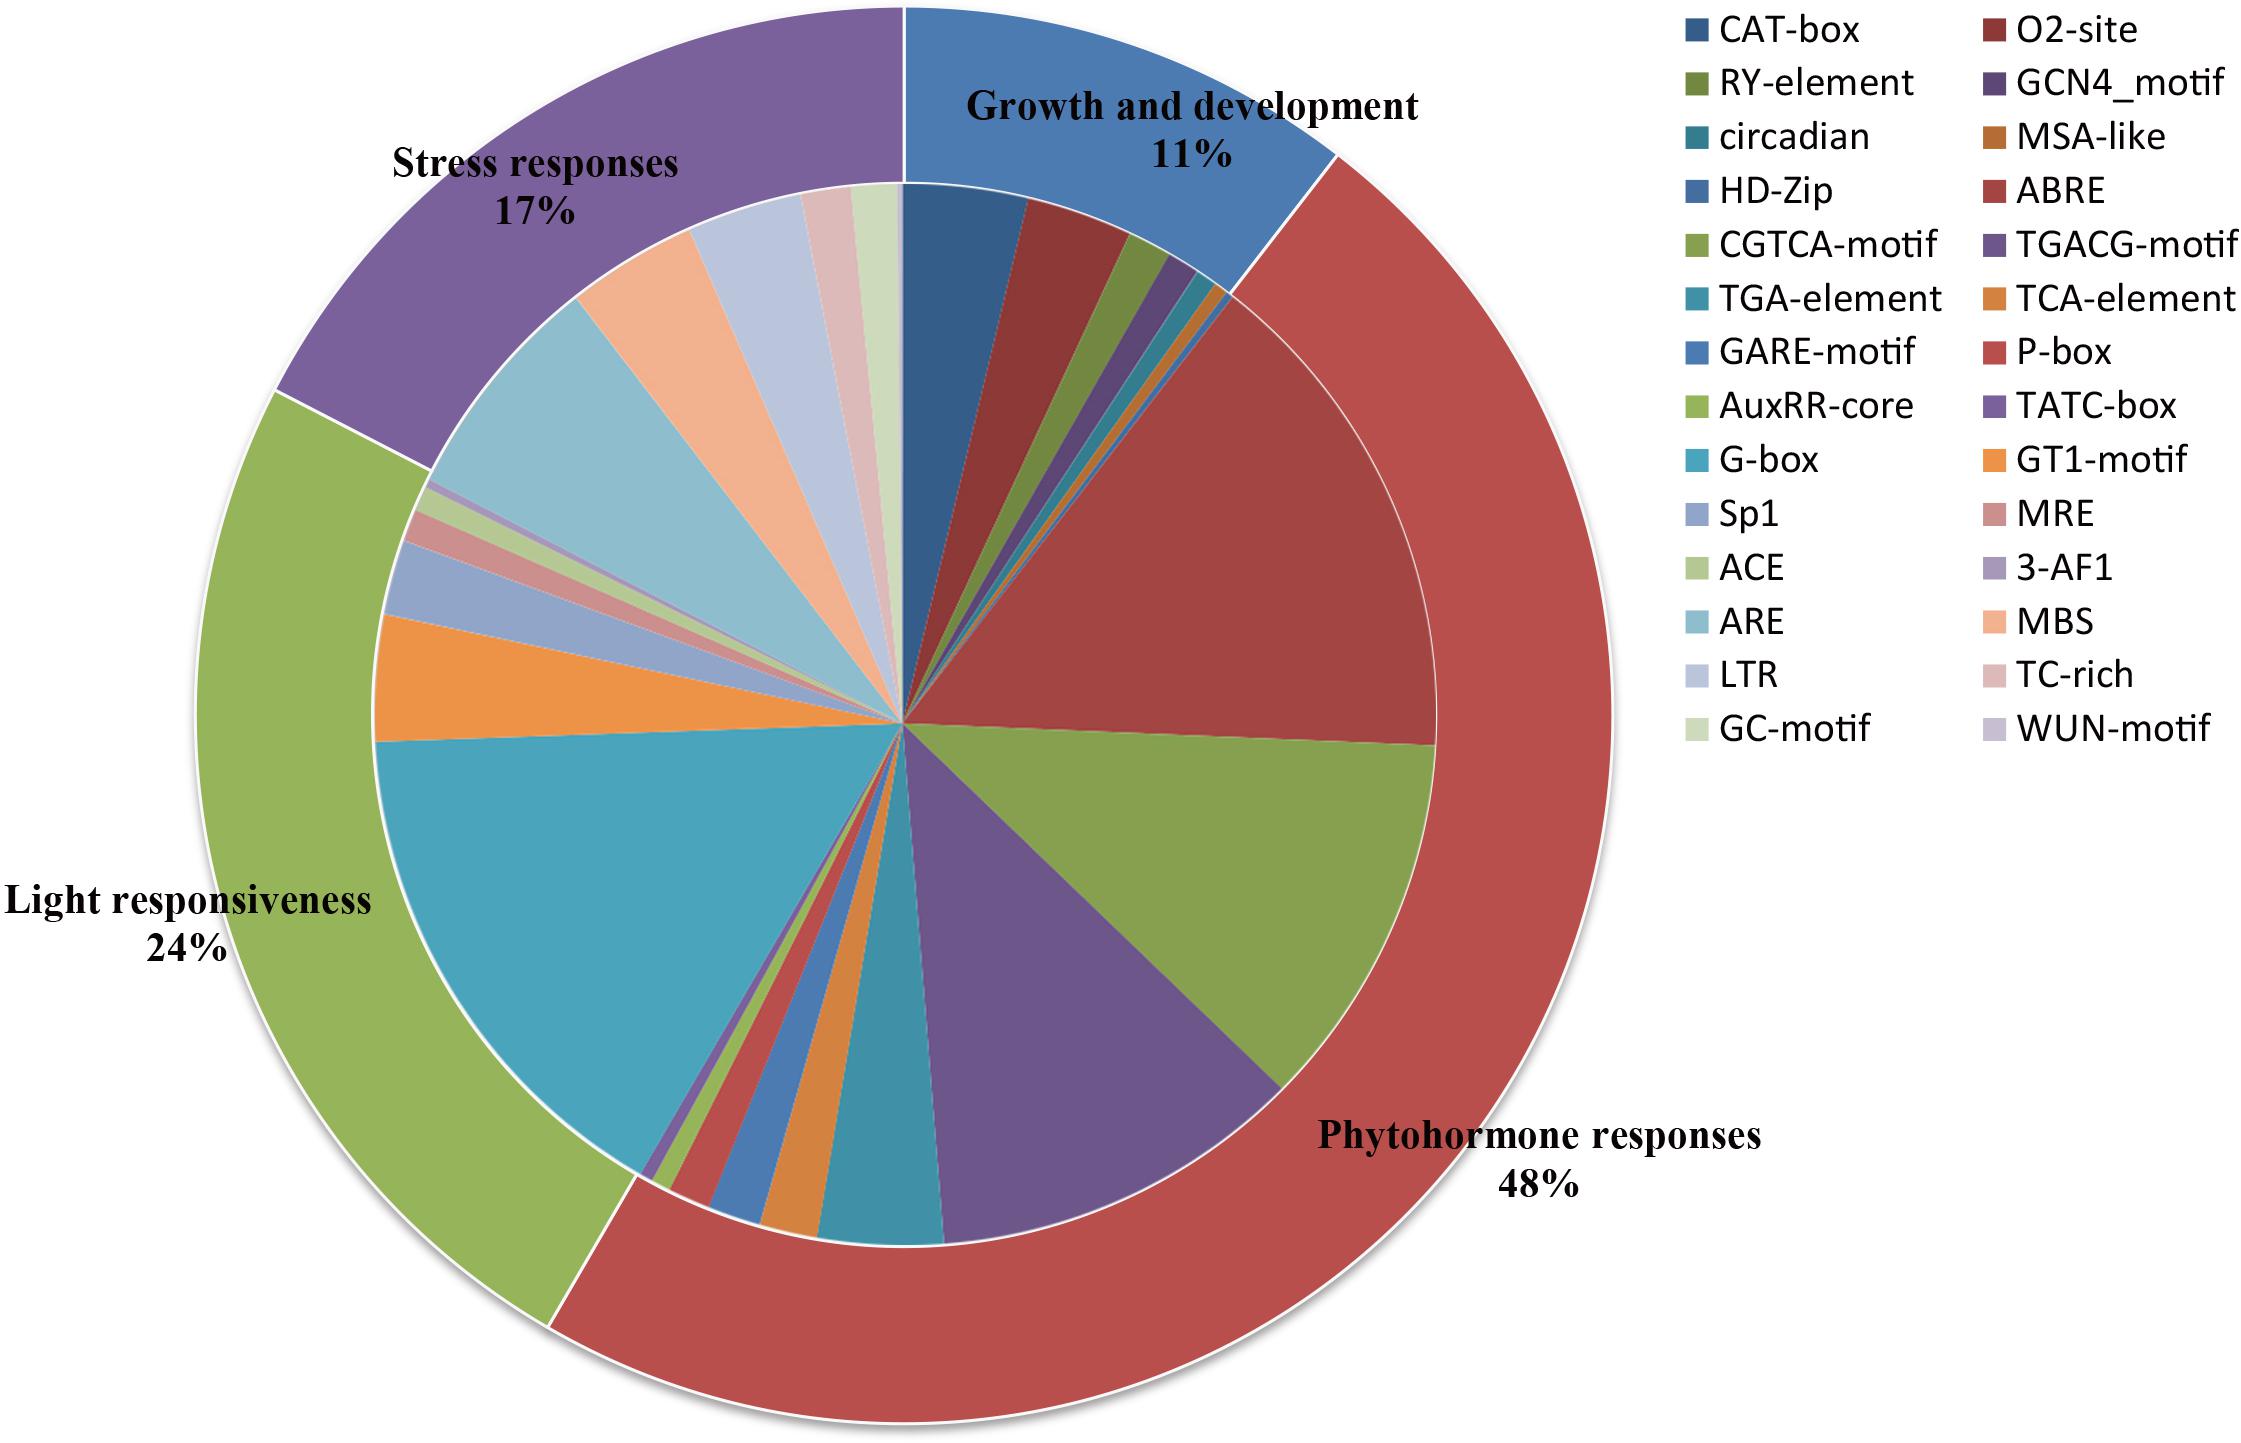
Figure 6. Cis-acting elements of all PLT genes in seven Gramineae crops. The ratios of primary categories/cis-elements are displayed by different sizes in the pie charts.
The expression analyses of the PLT genes in rice and maize showed that the PLT gene has different expression profiles in various tissues, which indicated that the PLT gene may have multiple biological functions and participate in the growth and the development of multiple organs (Figure 7). Several PLT genes showed tissue-specific expression, suggesting that they play a role in specific tissues (Figure 7). For instance, OsPLT13 gene was expressed in a root-specific manner (Figure 7A). Similarly, OsPLT3 and OsPLT4 were specifically expressed in pollen at different developmental stages. In order to further explore the functional differentiation of the PLT genes in rice and maize, a correlation coefficient between the PLT genes was calculated through Pearson coefficient (Figure 8). Most of the correlation coefficients between the PLT genes in rice were less than 0.8 (Figure 8A) and the maize species had a similar situation (Figure 8B). However, the correlation coefficients between several PLT gene pairs were greater than 0.8, namely, OsPLT9 and OsPLT10, ZmPLT5 and ZmPLT8, ZmPLT8 and ZmPLT15, ZmPLT6 and ZmPLT7, ZmPLT1 and ZmPLT2, as well as ZmPLT12 and ZmPLT14 (Figures 8A,B). These results revealed that the PLT gene family in rice and maize have undergone significant functional differentiation, but some PLT genes may be functionally redundant. Notably, the correlation coefficients of five PLT duplicate gene pairs in rice and maize were less than 0.8, namely, OsPLT11 and OsPLT12 (0.62), OsPLT8 and OsPLT9 (0.14), ZmPLT7 and ZmPLT8 (0.32), ZmPLT12 and ZmPLT16 (-0), as well as ZmPLT4 and ZmPLT6 (0.36), which demonstrated that these PLT duplicate gene pairs had obvious subfunctionalization.
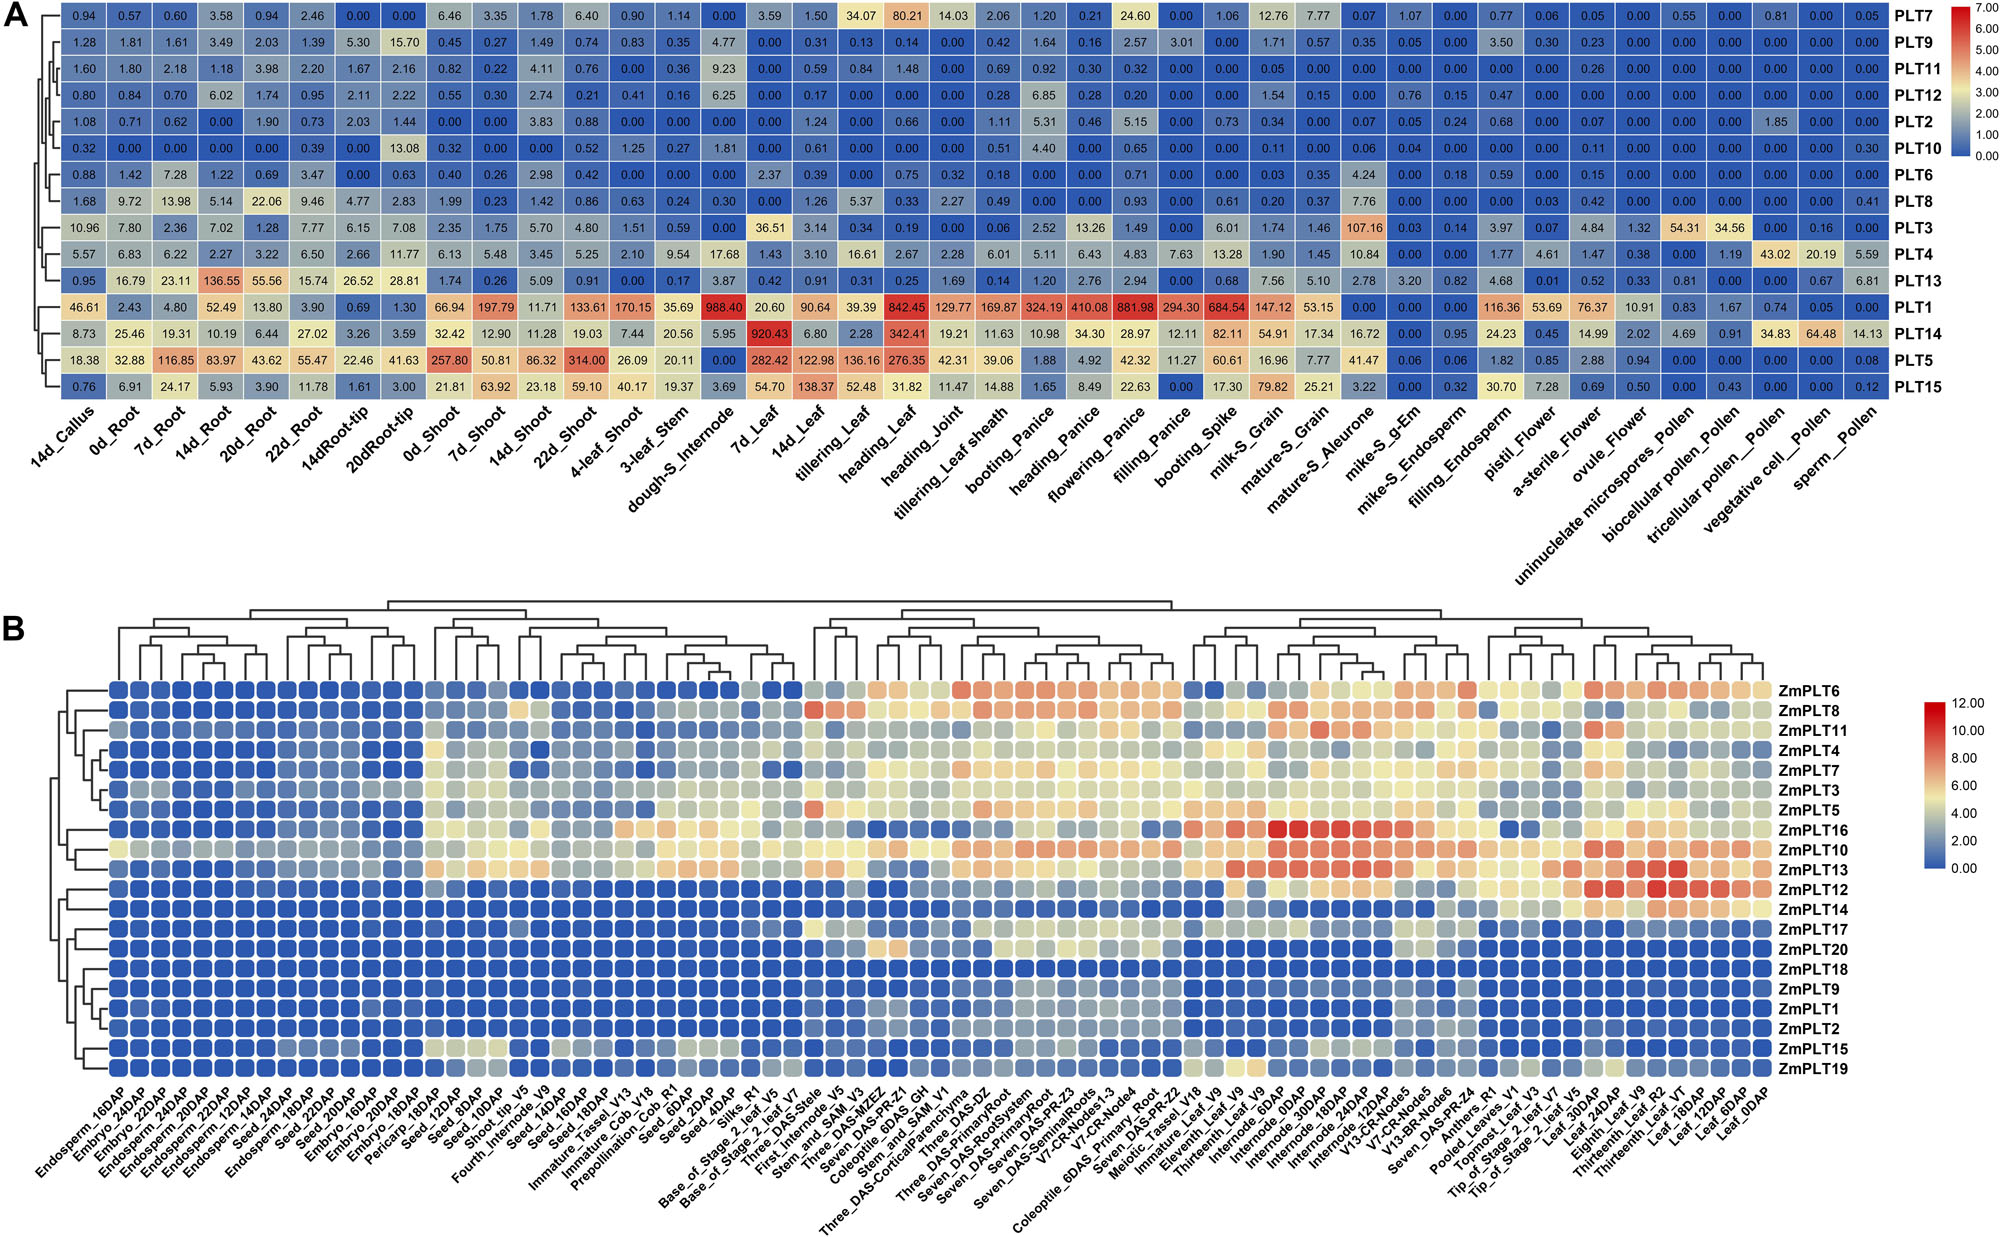
Figure 7. Expression patterns of PLT genes in different tissues from rice (A) and maize (B). The absolute expression values of rice PLT genes were obtained from MBKbase (http://www.mbkbase.org/rice). The absolute expression values of maize PLT genes were obtained from maize eFP Browser (http://bar.utoronto.ca/efp_maize/cgi-bin/efpWeb.cgi, data source: Hoopes et al., 2019).
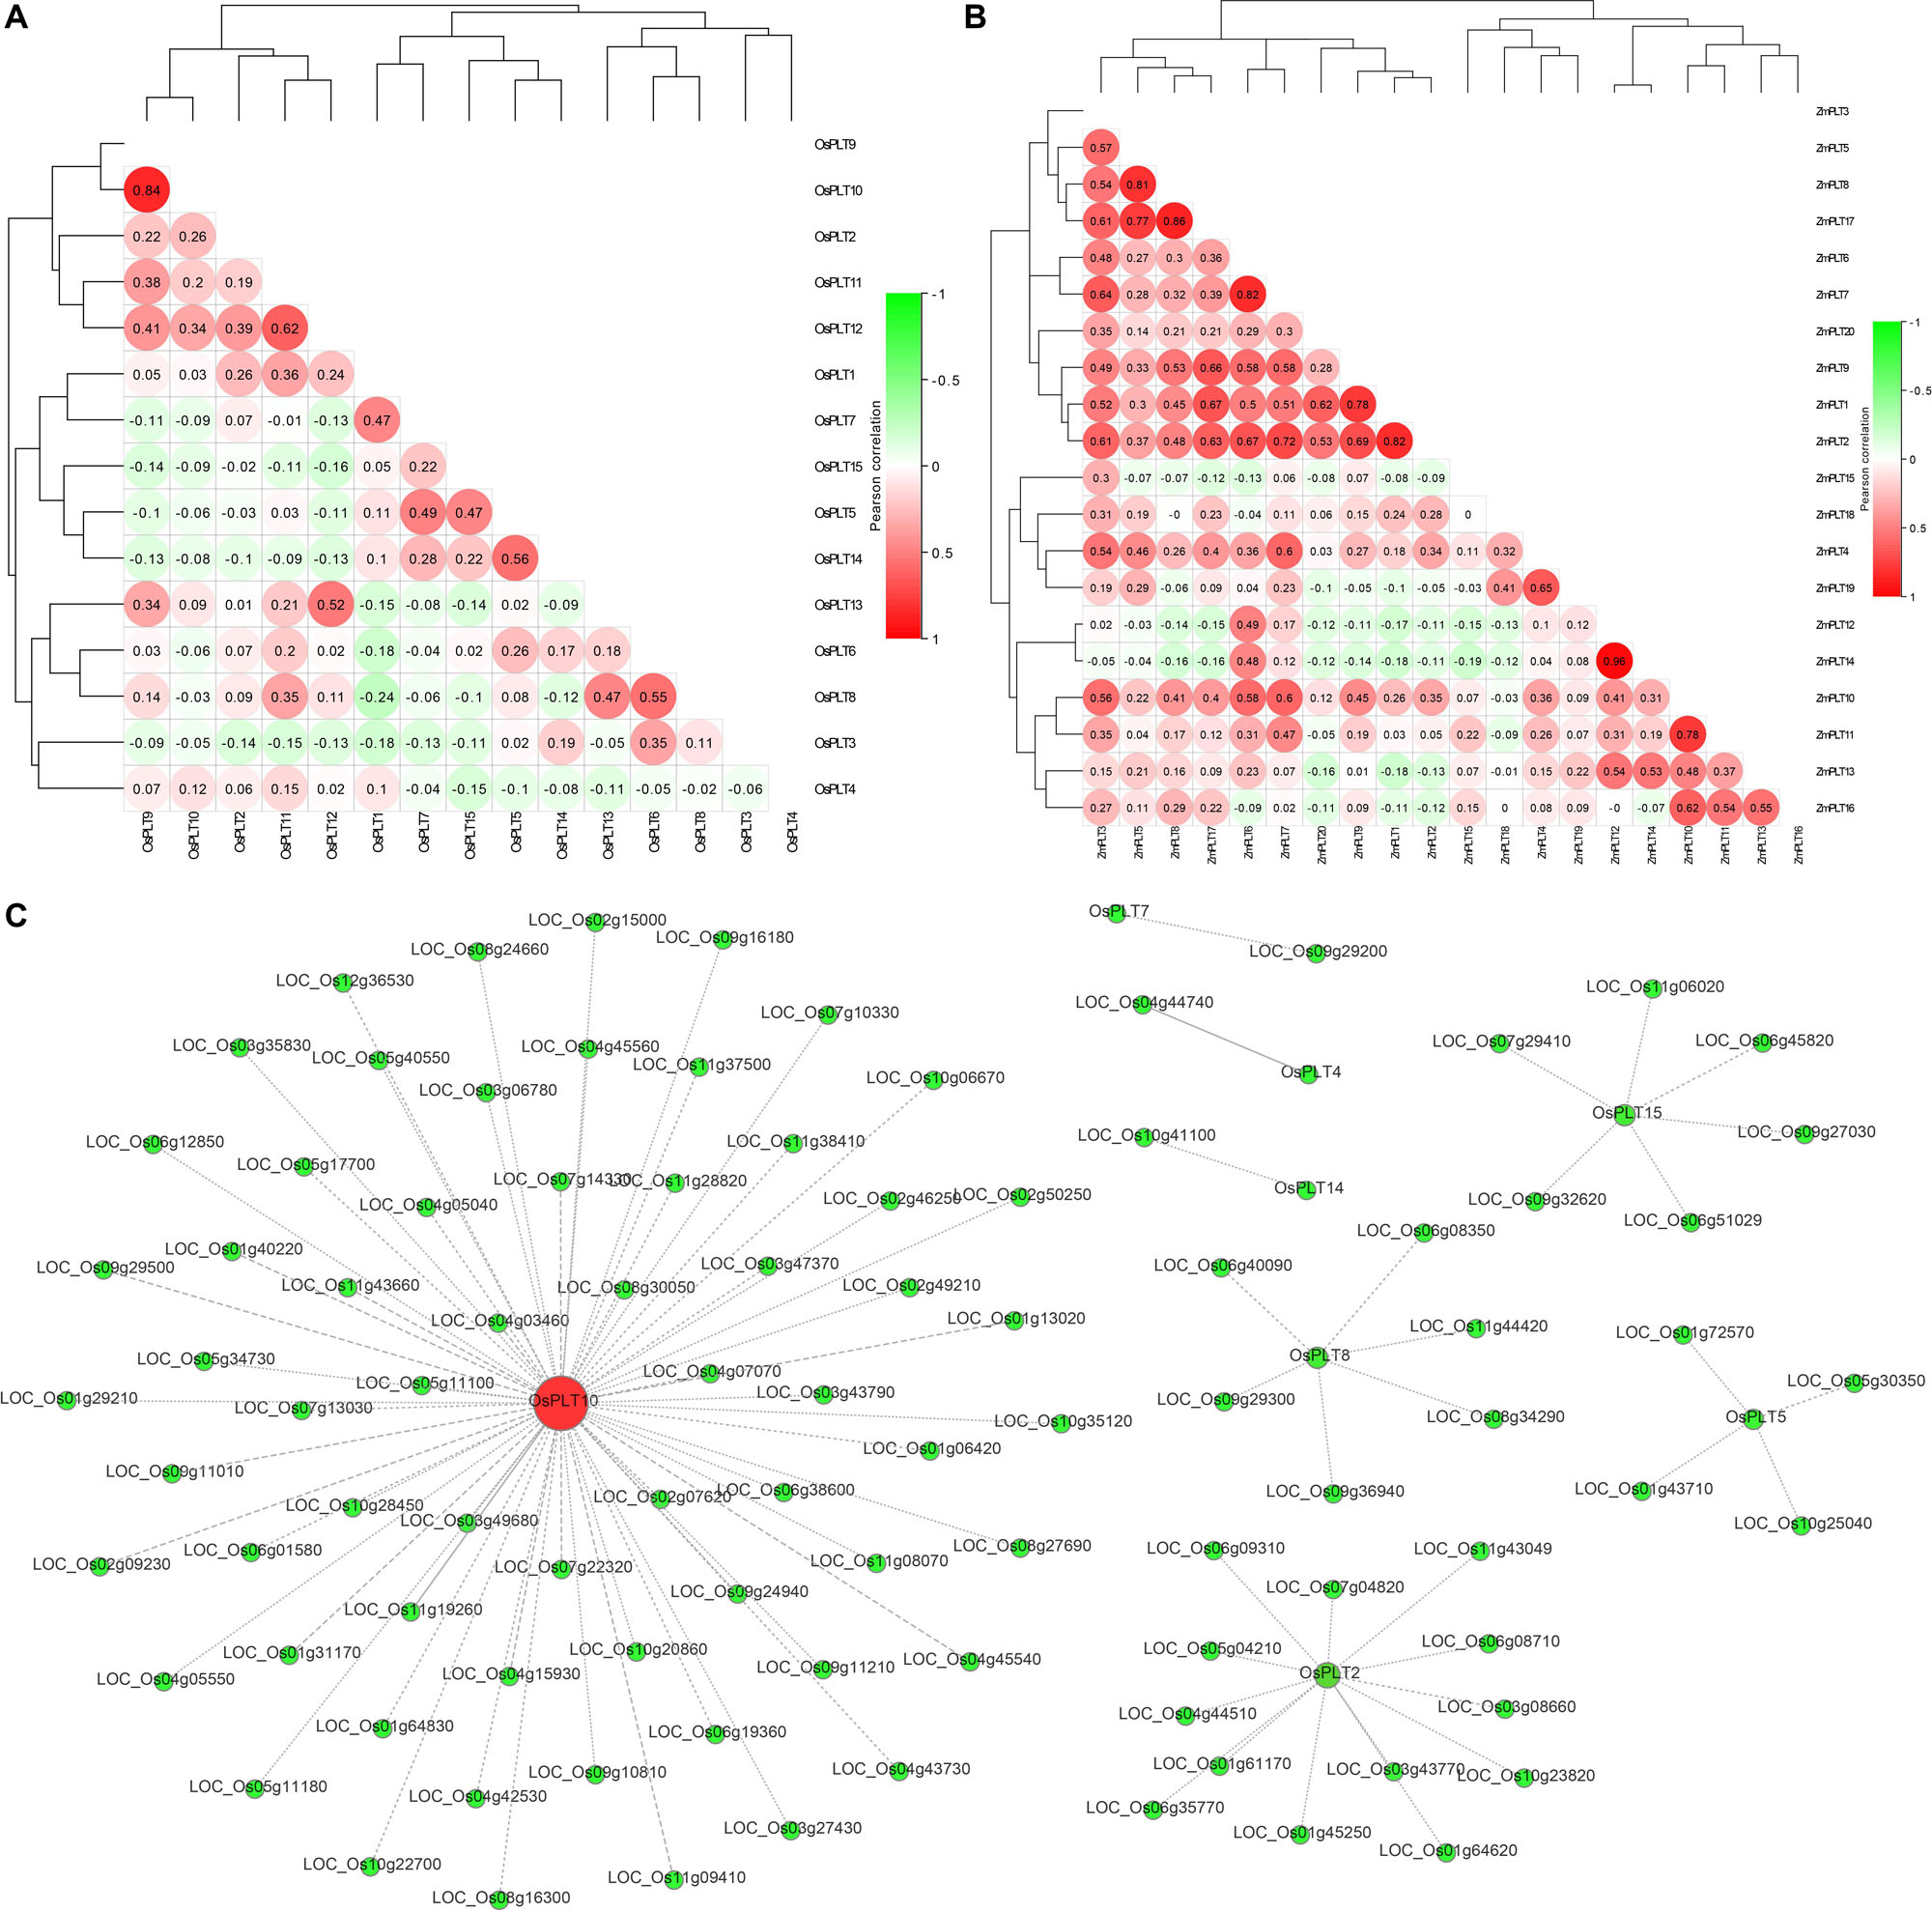
Figure 8. Pearson’s correlation coefficient among PLT genes in rice (A) and maize (B), respectively. A co-expression network using rice PLT genes as query genes was constructed in the Rice Expression Database (http://expression.ic4r.org/) with Pearson’s r-value > 0.85 (C).
Co-expression Network, GO Annotation, and qRT-PCR of Rice PLT Gene Under Heat and Cold Stresses
In this study, a co-expression network using rice PLT genes as query genes was constructed on the RED website (Pearson’s r-value > 0.85) to find the functional partners of rice PLT genes. A total of 96 genes were identified in this co-expression network (Figure 8C and Supplementary Table S6). OsPLT10 was a hub gene and had 64 partners, while OsPLT2, OsPLT8, OsPLT15, and OsPLT5 had 13, 6, 6, and 4 partners, respectively (Figure 8C). A GO annotation was performed to analyze the biological processes involved in this co-expression network (Supplementary Table S7). The results showed that the genes in this co-expression network can be annotated to 269 GO terms, suggesting that the co-expression network may be involved in multiple biological processes of rice growth and development (Supplementary Table S7).
The expression changes of nine rice PLT genes under cold and heat stresses were detected. The majority of the rice PLT genes were down-regulated under heat stress and cold stress (Figure 9). However, the expression level of OsPLT6 was induced by cold stress. OsPLT3 and OsPLT13 had obvious up-regulated expressions under heat stress (Figure 9).
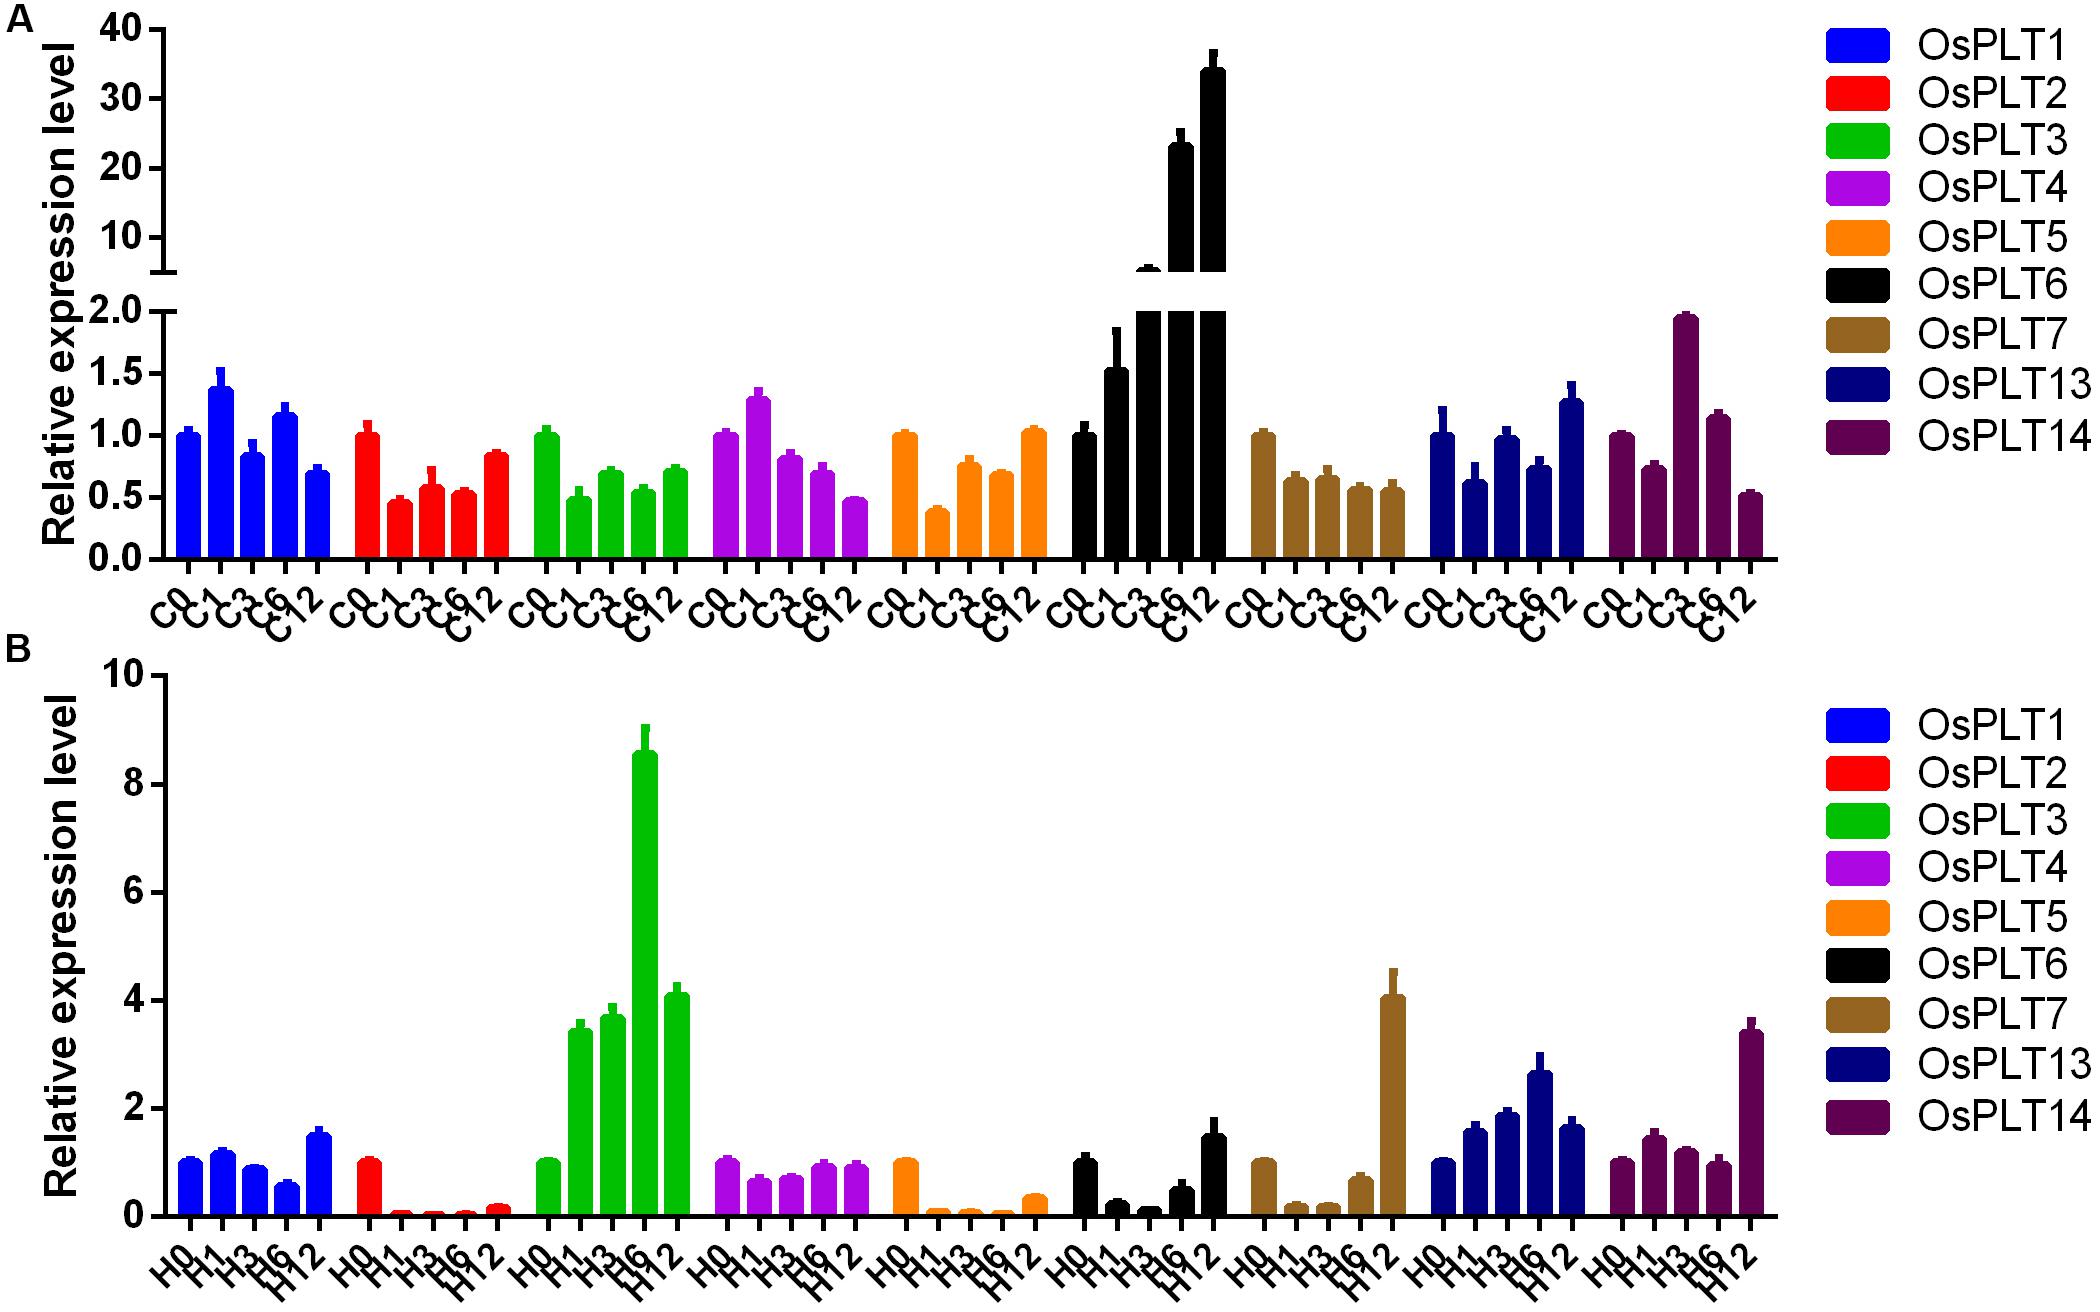
Figure 9. Expression changes of rice PLT genes under cold (A) and heat (B) stresses by qRT-PCR. The numbers 0, 1, 3, 6, and 12 represent 0, 1, 3, 6, and 12 h after treatments.
Discussion
Gene Duplication and Orthogroup Expansion Promoted the Expansion of the PLT Gene Family in Gramineae Crops
Previous gene family studies have demonstrated that gene duplication events play a crucial role in family gene expansion (Büttner, 2007; Van Holle and Van Damme, 2015; Kong et al., 2019b, d). Our earlier studies of MSTs also found that duplication events led to the expansion of the rice STP and ERD gene families (Deng et al., 2019). In this study, we found that gene duplication events also affected the expansion of PTL gene families in some Gramineous crops and ultimately led to differences in the total number of PLT genes in these seven tested species. We also found that some OGs in the Gramineous crops had an obvious expansion phenomenon, especially OG1 and OG2. The expansion of OGs had species bias, and the expansion was larger in Sb, Si, and Zm than in Bd, Hv, Or, and Os. On the other hand, the unequal loss of OGs also affected the total number of PLT genes in each species. For example, Hv had the least PLT gene compared with Bd, Or, Os, Si, Sb, and Zm, which was due to the fact that Hv did not have any PLT gene duplication events, that the expansion of OGs was not obvious, and that OG9 was lost. Our results supported the theoretical models of gene family evolution, such that gene families continuously undergo stochastic gain and loss events (Zimmer et al., 1980; Reed and Hughes, 2004). On the other hand, the types and the numbers of PLT gene duplication events were not the same in the tested crops, which indicated that the evolution and the expansion patterns of the PLT gene family were different in each species. Thus, the Ka/Ks values and the divergence times of the duplicate gene pairs were calculated. All Ka/Ks values of duplicate gene pairs from different types of duplication events were less than 0. Interestingly, the divergence times of the TD duplicate gene pairs (<23 MYa) were later than that of the WGD/SD gene pairs (>24 MYa). This result indicated that different types of gene duplication events were responsible for the expansion of the PLT gene family in different evolutionary periods of Gramineous crops, but the driving force and the cause of this phenomenon were still unclear.
Gene Structure Variations and Different Selection Pressures Promoted the Functional Differentiation of PLT
Previous studies reported that PLT proteins had 12 transmembrane domains and high consistency at the N- and C-termini (Baud et al., 2005; Johnson et al., 2006; Klepek et al., 2010). Our results of the conservative motifs and the transmembrane domain of all PLT protein sequences revealed that the PLTs were very conserved, with 12 transmembrane domains. Internal repeat duplication analysis confirmed that the PLTs protein sequence may originate from an internal repeat duplication of an ancestral six-TMHs unit (Saier, 2000; Johnson et al., 2006). In this study, we found that nine OGs had different purification selection pressures, which provided evolutionary motivation for the functional differentiation of the members of the PLT gene family. Significant differences in upstream promoter elements, genomic intron–exon structure, and gene expression among PLT genes indeed confirmed that the PLT genes were functionally differentiated in rice and maize. The theoretical models of gene duplication proposed that duplicate gene pairs continuously underwent functional differentiation (subfunctionalization), gained new functions (neofunctionalization), or lost original functions (pseudo-genization) after the gene duplication events (Lynch and Force, 2000; He and Zhang, 2005; Innan and Kondrashov, 2010). Gene expression data and co-expression analysis could provide a perspective on the functional fates of duplicate gene pairs (Reinders et al., 2005; Johnson et al., 2006; Kong et al., 2019b). The correlation coefficients of all duplicate gene pairs were less than 0.8, suggesting that these gene pairs had significant functional differentiation. It should be noted that the correlation coefficients between some PLT genes in rice and maize are greater than 0.8, which indicates that the PLT genes have functional redundancy.
PLT Genes Were Widely Involved in Plant Growth and Development and Stress Responses
The RNA data analysis results from a large number of tissues in rice and maize reflected that the PLT genes have a wide range of expression patterns. In this study, we used rice PLT genes as the query gene to construct a co-expression network. The GO annotation results of the co-expression network genes showed that multiple GO terms were involved, and OsPLT10 was the key core gene of the co-expression network. These results indicated that the PLT genes have multiple biological functions in plants. Cold and heat stresses frequently severely affect the growth, development, and food yield of crops in many countries (Mittler, 2006; Zhao et al., 2014; Kong et al., 2019b). Previous studies of PLT proteins have focused on transporting monosaccharide types, salt stress response, and drought stress response (Noiraud et al., 2001; Watari et al., 2004; Klepek, 2005; Reinders et al., 2005; Conde et al., 2007, 2011, 2015; Juchaux-Cachau et al., 2007; Dusotoit-Coucaud et al., 2010; Lu et al., 2017). However, few studies have been conducted on the effects of heat or cold stress on the PLT genes. In this study, we found that OsPLT6 was identified as a cold stress-inducible gene, whereas OsPLT3 and OsPLT13 were heat stress-inducible genes. These results suggested that the PLT genes may also be involved in cold and heat stresses. Although the co-expression network and the qRT-PCR data provided us with clues to the function prediction of rice PLT genes and candidate gene screening for genetic breeding, these remain to be experimentally verified in future studies.
Data Availability Statement
All datasets generated/analyzed for this study are included in the article/Supplementary Material.
Author Contributions
WK performed all of the experiments, analyzed the data, prepared the figures and the tables, and wrote the manuscript. WK and YL conceived and designed the experiments. TS, CZ, and YQ prepared parts of the figures and the tables. All the authors read and approved the final version of the manuscript.
Funding
The National Special Key Project for Transgenic Breeding (Grant No. 2016ZX08001001) and the National Key Research and Development Program of China (2016YFD0100400) funded this study.
Conflict of Interest
The authors declare that the research was conducted in the absence of any commercial or financial relationships that could be construed as a potential conflict of interest.
Acknowledgments
We thank the reviewers and the editor for their careful reading and helpful comments on this manuscript.
Supplementary Material
The Supplementary Material for this article can be found online at: https://www.frontiersin.org/articles/10.3389/fgene.2020.00565/full#supplementary-material
FIGURE S1 | An internal repeat of PLT genes. The proteins themselves are represented by the dark diagonal lines, and the duplicated regions are represented by the above the dark diagonal lines.
FIGURE S2 | 2D models of 6h7d.1. A and 6n3i.1.A.
FIGURE S3 | Sketch map of maize tissues.
TABLE S1 | Detailed information on the PLT genes in seven tested Gramineous crops.
TABLE S2 | Nine orthogroups among the seven tested Gramineous crops.
TABLE S3 | Statistics of the four types of orthologs between different Gramineous crops.
TABLE S4 | Orthologs list among different Gramineous crops.
TABLE S5 | 3D structure prediction results of rice PLTs proteins.
TABLE S6 | Genes and Pearson’s r-values in the co-expression network.
TABLE S7 | GO enrichment of genes in the co-expression network.
Footnotes
- ^ http://plants.ensembl.org/index.html
- ^ http://rice.plantbiology.msu.edu
- ^ http://pfam.xfam.org/
- ^ http://smart.embl-heidelberg.de/
- ^ http://pfam.xfam.org/search/sequence
- ^ https://blast.ncbi.nlm.nih.gov/
- ^ http://www.cbs.dtu.dk/services/TMHMM/
- ^ https://swissmodel.expasy.org/
- ^ http://meme-suite.org/tools/meme
- ^ http://gsds.cbi.pku.edu.cn/
- ^ http://www.mbkbase.org/rice
- ^ http://bar.utoronto.ca/efp_maize/cgi-bin/efpWeb.cgi
- ^ http://expression.ic4r.org/
References
An, B., Jie, L., Xiaolong, D., Silan, C., Chao, O., Huiyun, S., et al. (2017). Silencing of D-lactate dehydrogenase impedes glyoxalase system and leads to methylglyoxal accumulation and growth inhibition in rice. Front. Plant Sci. 8:2071. doi: 10.3389/fpls.2017.02071
Bailey, T. L., Johnson, J., Grant, C. E., and Noble, W. S. (2015). The MEME suite. Nucleic Acids Res. 43, W39–W49.
Baud, S., Wuillème, S., Lemoine, R., Kronenberger, J., Caboche, M., Lepiniec, L. C., et al. (2005). The AtSUC5 sucrose transporter specifically expressed in the endosperm is involved in early seed development in Arabidopsis. Plant J. 43, 824–836. doi: 10.1111/j.1365-313x.2005.02496.x
Biegert, A., and Söding, J. (2008). HHrepID: de novo protein repeat identification by probabilistic consistency. Bioinformatics 24, 807–814. doi: 10.1093/bioinformatics/btn039
Büttner, M. (2007). The monosaccharide transporter(-like) gene family in Arabidopsis. FEBS Lett. 581, 2318–2324. doi: 10.1016/j.febslet.2007.03.016
Cao, Y., Liu, W., Zhao, Q., Long, H., Li, Z., Liu, M., et al. (2019). Integrative analysis reveals evolutionary patterns and potential functions of SWEET transporters in Euphorbiaceae. Int. J. Biol. Macromol. 139, 1–11. doi: 10.1016/j.ijbiomac.2019.07.102
Chen, C., Chen, H., He, Y., and Xia, R. (2018). TBtools, a toolkit for biologists integrating various biological data handling tools with a user-friendly interface. BioRxiv [Preprint] doi: 10.1101/289660
Conde, A., Regalado, A., Rodrigues, D., Costa, J. M., Blumwald, E., Chaves, M. M., et al. (2015). Polyols in grape berry: transport and metabolic adjustments as a physiological strategy for water-deficit stress tolerance in grapevine. J. Exp. Bot. 66, 889–906. doi: 10.1093/jxb/eru446
Conde, A., Silva, P., Agasse, A., Conde, C., and Geros, H. (2011). Mannitol transport and mannitol dehydrogenase activities are coordinated in Olea europaea under salt and osmotic stresses. Plant Cell Physiol. 52, 1766–1775. doi: 10.1093/pcp/pcr121
Conde, C., Silva, P., Agasse, A., Lemoine, R., Delrot, S., Tavares, R., et al. (2007). Utilization and transport of mannitol in Olea europaea and implications for salt stress tolerance. Plant Cell Physiol. 48, 42–53. doi: 10.1093/pcp/pcl035
Deng, X., An, B., Zhong, H., Yang, J., Kong, W., and Li, Y. (2019). A novel insight into functional divergence of the MST gene family in rice based on comprehensive expression patterns. Genes 10:239. doi: 10.3390/genes10030239
Dusotoit-Coucaud, A., Porcheron, B., Brunel, N., Kongsawadworakul, P., Franchel, J., Viboonjun, U., et al. (2010). Cloning and characterization of a new polyol transporter (HbPLT2) in Hevea brasiliensis. Plant Cell Physiol. 51, 1878–1888. doi: 10.1093/pcp/pcq151
Edgar, R. C. (2004). MUSCLE: multiple sequence alignment with high accuracy and high throughput. Nucleic Acids Res. 32, 1792–1797. doi: 10.1093/nar/gkh340
Emms, D. M., and Kelly, S. (2015). OrthoFinder: solving fundamental biases in whole genome comparisons dramatically improves orthogroup inference accuracy. Genome Biol. 16:157.
Finn, R. D., Clements, J., and Eddy, S. R. (2011). HMMER web server: interactive sequence similarity searching. Nucleic Acids Res. 39, W29–W37.
He, X., and Zhang, J. (2005). Rapid subfunctionalization accompanied by prolonged and substantial neofunctionalization in duplicate gene evolution. Genetics 169, 1157–1164. doi: 10.1534/genetics.104.037051
Hoopes, G. M., Hamilton, J. P., Wood, J. C., Esteban, E., Pasha, A., Vaillancourt, B., et al. (2019). An updated gene atlas for maize reveals organ-specific and stress-induced genes. Plant J. 97, 1154–1167. doi: 10.1111/tpj.14184
Hu, B., Jin, J., Guo, A.-Y., Zhang, H., Luo, J., and Gao, G. (2015). GSDS 2.0: an upgraded gene feature visualization server. Bioinformatics 31, 1296–1297. doi: 10.1093/bioinformatics/btu817
Innan, H., and Kondrashov, F. (2010). The evolution of gene duplications: classifying and distinguishing between models. Nat. Rev. Genet. 11, 97–108. doi: 10.1038/nrg2689
Jeena, G. S., Kumar, S., and Shukla, R. K. (2019). Structure, evolution and diverse physiological roles of SWEET sugar transporters in plants. Plant Mol. Biol. 100, 351–365. doi: 10.1007/s11103-019-00872-4
Johnson, D. A., Hill, J. P., and Thomas, M. A. (2006). The monosaccharide transporter gene family in land plants is ancient and shows differential subfamily expression and expansion across lineages. BMC Evol. Biol. 6:64. doi: 10.1186/1471-2148-6-64
Juchaux-Cachau, M., Landouar-Arsivaud, L., Pichaut, J.-P., Campion, C., Porcheron, B., Jeauffre, J., et al. (2007). Characterization of AgMaT2, a plasma membrane mannitol transporter from celery, expressed in phloem cells, including phloem parenchyma cells. Plant Physiol. 145, 62–74. doi: 10.1104/pp.107.103143
Kalyaanamoorthy, S., Minh, B. Q., Wong, T. K., von Haeseler, A., and Jermiin, L. S. (2017). ModelFinder: fast model selection for accurate phylogenetic estimates. Na. Methods 14, 587–589. doi: 10.1038/nmeth.4285
Klepek, Y. S. (2005). Arabidopsis polyol transporter5, a new member of the monosaccharide transporter-like superfamily, mediates H+-symport of numerous substrates, including myo-inositol, glycerol, and ribose. Plant Cell 17, 204–218. doi: 10.1105/tpc.104.026641
Klepek, Y. S., Volke, M., Konrad, K. R., Wippel, K., Hoth, S., Hedrich, R., et al. (2010). Arabidopsis thaliana polyol/monosaccharide transporters 1 and 2: fructose and xylitol/H+ symporters in pollen and young xylem cells. J. Exp. Bot. 61, 537–550. doi: 10.1093/jxb/erp322
Kong, W., An, B., Zhang, Y., Yang, J., Li, S., Sun, T., et al. (2019a). Sugar transporter proteins (STPs) in Gramineae crops: comparative analysis, phylogeny, evolution, and expression profiling. Cells 8:560. doi: 10.3390/cells8060560
Kong, W., Gong, Z., Zhong, H., Zhang, Y., Zhao, G., Gautam, M., et al. (2019b). Expansion and evolutionary patterns of glycosyltransferase family 8 in gramineae crop genomes and their expression under salt and cold stresses in Oryza sativa ssp. japonica. Biomolecules 9:188. doi: 10.3390/biom9050188
Kong, W., Zhang, Y., Deng, X., Zhang, C., and Li, Y. (2019c). Comparative genomic and transcriptomic analyses suggests the evolutionary dynamic of GH3 genes in Gramineae crops. Front. Plant Sci. 10:1297. doi: 10.3389/fpls.2019.01297
Kong, W., Zhong, H., Deng, X., Gautam, M., Gong, Z., Zhang, Y., et al. (2019d). Evolutionary analysis of GH3 genes in six Oryza species/subspecies and their expression under salinity stress in Oryza sativa ssp. japonica. Plants 8:30. doi: 10.3390/plants8020030
Kong, W., Yang, S., Wang, Y., Bendahmane, M., and Fu, X. (2017). Genome-wide identification and characterization of aquaporin gene family in Beta vulgaris. PeerJ. 5:e3747. doi: 10.7717/peerj.3747
Krzywinski, M., Schein, J., Birol, I., Connors, J., Gascoyne, R., Horsman, D., et al. (2009). Circos: an information aesthetic for comparative genomics. Genome Res. 19, 1639–1645. doi: 10.1101/gr.092759.109
Kühn, C., and Grof, C. P. (2010). Sucrose transporters of higher plants. Curr. Opin. Plant Biol. 13, 287–297. doi: 10.1016/j.pbi.2010.02.001
Lescot, M., Déhais, P., Thijs, G., Marchal, K., Moreau, Y., Van de Peer, Y., et al. (2002). PlantCARE, a database of plant cis-acting regulatory elements and a portal to tools for in silico analysis of promoter sequences. Nucleic Acids Res. 30, 325–327. doi: 10.1093/nar/30.1.325
Librado, P., and Rozas, J. (2009). DnaSP v5: a software for comprehensive analysis of DNA polymorphism data. Bioinformatics 25, 1451–1452. doi: 10.1093/bioinformatics/btp187
Lu, T., Leru, L., Yehu, Y., Mingchao, H., Yanbo, C., Xinlan, X., et al. (2017). Heterogeneity in the expression and subcellular localization of polyol/monosaccharide transporter genes in Lotus japonicus. PloS One 12:e0185269. doi: 10.1371/journal.pone.0185269
Lynch, M., and Force, A. (2000). The probability of duplicate gene preservation by subfunctionalization. Genetics 154, 459–473.
Misra, V. A., Wafula, E. K., Wang, Y., dePamphilis, C. W., and Timko, M. P. (2019). Genome-wide identification of MST, SUT and SWEET family sugar transporters in root parasitic angiosperms and analysis of their expression during Host parasitism. BMC Plant Biol. 19:196. doi: 10.1186/s12870-019-1786-y
Mittler, R. (2006). Abiotic stress, the field environment and stress combination. Trends Plant Sci. 11, 15–19. doi: 10.1016/j.tplants.2005.11.002
Nguyen, L.-T., Schmidt, H. A., Von Haeseler, A., and Minh, B. Q. (2015). IQ-TREE: a fast and effective stochastic algorithm for estimating maximum-likelihood phylogenies. Mol. Biol. Evol. 32, 268–274. doi: 10.1093/molbev/msu300
Noiraud, N., Maurousset, L., and Lemoine, R. (2001). Identification of a mannitol transporter, AgMaT1, in celery phloem. Plant Cell 13, 695–705. doi: 10.1105/tpc.13.3.695
Patil, S. S., Prashant, R., Kadoo, N. Y., Upadhyay, A., and Gupta, V. S. (2019). Global study of MFS superfamily transporters in arabidopsis and grapes reveals their functional diversity in plants. Plant Gene 18:100179. doi: 10.1016/j.plgene.2019.100179
Peng, H., Wang, K., Chen, Z., Cao, Y., Gao, Q., Li, Y., et al. (2020). MBKbase for rice: an integrated omics knowledgebase for molecular breeding in rice. Nucleic Acids Res. 48, D1085–D1092.
Reed, W. J., and Hughes, B. D. (2004). A model explaining the size distribution of gene and protein families. Math. Biosci. 189, 97–102. doi: 10.1016/j.mbs.2003.11.002
Reinders, A., Panshyshyn, J. A., and Ward, J. M. (2005). Analysis of transport activity of Arabidopsis sugar alcohol permease homolog AtPLT5. J. Biol. Chem. 280, 1594–1602. doi: 10.1074/jbc.m410831200
Saier, M. H. Jr. (2000). Families of transmembrane sugar transport proteins: microreview. Mol. Microbiol. 35, 699–710. doi: 10.1046/j.1365-2958.2000.01759.x
Shannon, P., Markiel, A., Ozier, O., Baliga, N. S., Wang, J. T., Ramage, D., et al. (2003). Cytoscape: a software environment for integrated models of biomolecular interaction networks. Genome Res. 13, 2498–2504. doi: 10.1101/gr.1239303
Thompson, J. D., Gibson, T. J., Plewniak, F., Jeanmougin, F., and Higgins, D. G. (1997). The CLUSTAL_X windows interface: flexible strategies for multiple sequence alignment aided by quality analysis tools. Nucleic Acids Res. 25, 4876–4882. doi: 10.1093/nar/25.24.4876
Van Holle, S., and Van Damme, E. J. M. (2015). Distribution and evolution of the lectin family in soybean (Glycine max). Molecules 20, 2868–2891. doi: 10.3390/molecules20022868
Wang, Y., Tang, H., DeBarry, J. D., Tan, X., Li, J., Wang, X., et al. (2012). MCScanX: a toolkit for detection and evolutionary analysis of gene synteny and collinearity. Nucleic Acids Res. 40, e49–e49. doi: 10.1093/nar/gkr1293
Watari, J., Kobae, Y., Yamaki, S., Yamada, K., and Shiratake, K. (2004). Identification of sorbitol transporters expressed in the phloem of apple source leaves. Plant Cell Physiol. 45, 1032–1041. doi: 10.1093/pcp/pch121
Waterhouse, A., Bertoni, M., Bienert, S., Studer, G., Tauriello, G., Gumienny, R., et al. (2018). SWISS-MODEL: homology modelling of protein structures and complexes. Nucleic Acids Res. 46, W296–W303.
Wingenter, K., Schulz, A., Wormit, A., Wic, S., Trentmann, O., Hoermiller, I. I., et al. (2010). Increased activity of the vacuolar monosaccharide transporter TMT1 alters cellular sugar partitioning, sugar signaling, and seed yield in Arabidopsis. Plant Physiol. 154, 665–677. doi: 10.1104/pp.110.162040
Wu, G.-Q., Wang, J.-L., and Li, S.-J. (2019). Genome-wide identification of Na+/H+ antiporter (NHX) genes in sugar beet (Beta vulgaris L.) and their regulated expression under salt stress. Genes 10:401. doi: 10.3390/genes10050401
Young, M. D., Wakefield, M. J., Smyth, G. K., and Oshlack, A. (2010). Gene ontology analysis for RNA-seq: accounting for selection bias. Genome Biol. 11:R14.
Zhao, X., Wensheng, W., Fan, Z., Jianli, D., Zhikang, L., Binying, F., et al. (2014). Comparative metabolite profiling of two rice genotypes with contrasting salt stress tolerance at the seedling stage. PLoS One. 9:e108020. doi: 10.1371/journal.pone.0108020
Zhang, L., Jiao, C., Cao, Y., Cheng, X., Wang, J., Jin, Q., et al. (2020). Comparative analysis and expression patterns of the PLP_deC genes in Dendrobium officinale. Int. J. Mol. Sci. 21:54. doi: 10.3390/ijms21010054
Keywords: polyol transporters, Gramineae crops, orthologous gene pairs, orthogroups, duplicate gene pairs, functional differentiation
Citation: Kong W, Sun T, Zhang C, Qiang Y and Li Y (2020) Micro-Evolution Analysis Reveals Diverged Patterns of Polyol Transporters in Seven Gramineae Crops. Front. Genet. 11:565. doi: 10.3389/fgene.2020.00565
Received: 03 March 2020; Accepted: 11 May 2020;
Published: 19 June 2020.
Edited by:
Hongjian Wan, ZheJiang Academy of Agricultural Sciences, ChinaReviewed by:
Ertugrul Filiz, Duzce University, TurkeyMehanathan Muthamilarasan, University of Hyderabad, India
Venkata Suresh Bonthala, Helmholtz Zentrum München, Germany
Yan Xiang, Anhui Agricultural University, China
Copyright © 2020 Kong, Sun, Zhang, Qiang and Li. This is an open-access article distributed under the terms of the Creative Commons Attribution License (CC BY). The use, distribution or reproduction in other forums is permitted, provided the original author(s) and the copyright owner(s) are credited and that the original publication in this journal is cited, in accordance with accepted academic practice. No use, distribution or reproduction is permitted which does not comply with these terms.
*Correspondence: Yangsheng Li, bHlzaDIwMDFAd2h1LmVkdS5jbg==