 Yujuan Gui1†
 Mélanie H. Thomas2†Pierre Garcia2,3,4Mona Karout2Rashi Halder2
 Alessandro Michelucci2,5Heike Kollmus6
 Cuiqi Zhou7
 Shlomo Melmed7
 Klaus Schughart6,8,9
 Rudi Balling2
 Michel Mittelbronn2,3,4,5Joseph H. Nadeau10,11
 Robert W. Williams12
 Thomas Sauter1
 Manuel Buttini2*
 Lasse Sinkkonen1*
- 1Department of Life Sciences and Medicine, University of Luxembourg, Belvaux, Luxembourg
- 2Luxembourg Centre for Systems Biomedicine, University of Luxembourg, Belvaux, Luxembourg
- 3National Center of Pathology, Laboratoire National de Santé, Dudelange, Luxembourg
- 4Luxembourg Centre of Neuropathology, Dudelange, Luxembourg
- 5Department of Oncology, Luxembourg Institute of Health, Luxembourg City, Luxembourg
- 6Department of Infection Genetics, Helmholtz Centre for Infection Research, Braunschweig, Germany
- 7Cedars Sinai Medical Centre, Los Angeles, CA, United States
- 8Department of Infection Genetics, University of Veterinary Medicine Hannover, Hanover, Germany
- 9Department of Microbiology, Immunology and Biochemistry, University of Tennessee Health Science Center, Memphis, TN, United States
- 10Pacific Northwest Research Institute, Seattle, WA, United States
- 11Maine Medical Center Research Institute, Scarborough, ME, United States
- 12Department of Genetics, Genomics and Informatics, University of Tennessee Health Science Center, Memphis, TN, United States
Dopaminergic neurons in the midbrain are of particular interest due to their role in diseases such as Parkinson’s disease and schizophrenia. Genetic variation between individuals can affect the integrity and function of dopaminergic neurons but the DNA variants and molecular cascades modulating dopaminergic neurons and other cells types of ventral midbrain remain poorly defined. Three genetically diverse inbred mouse strains – C57BL/6J, A/J, and DBA/2J – differ significantly in their genomes (∼7 million variants), motor and cognitive behavior, and susceptibility to neurotoxins. To further dissect the underlying molecular networks responsible for these variable phenotypes, we generated RNA-seq and ChIP-seq data from ventral midbrains of the 3 mouse strains. We defined 1000–1200 transcripts that are differentially expressed among them. These widespread differences may be due to altered activity or expression of upstream transcription factors. Interestingly, transcription factors were significantly underrepresented among the differentially expressed genes, and only one transcription factor, Pttg1, showed significant differences between all three strains. The changes in Pttg1 expression were accompanied by consistent alterations in histone H3 lysine 4 trimethylation at Pttg1 transcription start site. The ventral midbrain transcriptome of 3-month-old C57BL/6J congenic Pttg1–/– mutants was only modestly altered, but shifted toward that of A/J and DBA/2J in 9-month-old mice. Principle component analysis (PCA) identified the genes underlying the transcriptome shift and deconvolution of these bulk RNA-seq changes using midbrain single cell RNA-seq data suggested that the changes were occurring in several different cell types, including neurons, oligodendrocytes, and astrocytes. Taken together, our results show that Pttg1 contributes to gene regulatory variation between mouse strains and influences mouse midbrain transcriptome during aging.
Introduction
Two populations of dopaminergic neurons (DAns) in ventral midbrain are of translational interest. One group resides in substantia nigra (SN) controlling motor function, while the other is in ventral tegmental area (VTA) and associated with cognitive function (Vogt Weisenhorn et al., 2016). Many human phenotypes, such as differences in motor learning (Pearson-Fuhrhop et al., 2013) or in disease susceptibility to schizophrenia and Parkinson’s disease (PD), are linked to DAns and modulated by genetic variation regulating dopaminergic circuits (Gao and Hong, 2011; Avramopoulos, 2018). Interestingly, recent work has established that most genetic variants associated with human traits and diseases are localized in non-coding genome and significantly enriched in cell type-specific gene regulatory regions (Maurano et al., 2012). Indeed, it has been suggested that most complex traits are explained by cumulative effects of numerous cis- and trans-regulatory variants that individually contributes to relatively small phenotypic effects (Liu et al., 2019). In particular, peripheral master regulators such as transcription factors (TFs) with tens to hundreds of target genes could be mediating a lot of gene regulatory variation through trans-effects while their own expression is altered by local cis-variants.
Mouse and human brains share large similarities in dopaminergic circuits and related gene expression, making mouse an ideal model system for neuroscience (Vogt Weisenhorn et al., 2016; Hodge et al., 2019). Three mouse strains, C57BL/6J, A/J, and DBA/2J, are frequently used in biology and show phenotypic differences in their dopaminergic circuits. For example, C57BL/6J has the highest motor activity and sensitivity to addiction (Ingram et al., 1981; Yoshimoto and Komura, 1987; de Jong et al., 2010; Eisener-Dorman et al., 2011; Ziółkowska et al., 2012), and its dopamine-related phenotypes differ substantially from those of other strains (Cabib et al., 2002). Moreover, the strains respond differently to PD toxins such as methyl-4-phenyl-1,2,3,6-tetrahydropyridine (MPTP), drawing parallels with varied susceptibility to PD in human population (Hamre et al., 1999). Mouse models are also a fundamental tool to study genetic aspects of the brain, with 90% of mouse genes being identical to human genes (Guénet, 2005). Similar to a typical human genome that differs from the reference genome by approximately 5 million variants (Auton et al., 2015), these mouse strains are collectively segregated by around 7 million variants. These characteristics make the mouse an interesting model to study genetic factors and extent of gene regulatory variation in connection to ventral midbrain and dopaminergic circuits.
Here we aimed to elucidate gene regulatory variation underlying the known phenotypic differences within mouse midbrains (Ingram et al., 1981; Yoshimoto and Komura, 1987; de Jong et al., 2010; Eisener-Dorman et al., 2011; Ziółkowska et al., 2012) by using a comparative functional genomics approach focusing on transcriptomic and epigenomic analysis of C57BL/6J, A/J, and DBA/2J strains. We identify significant differences between midbrains of the mouse strains with over 1000 genes showing altered expression levels in each comparison. To delineate whether these changes are due to regulatory variation associated with TFs, we looked at which TFs have altered expression. Surprisingly, TFs are significantly under-represented among the altered genes with only Pttg1 (Pituitary Tumor Transforming Gene 1) showing significant changes between all three strains. Deletion of Pttg1 alone is not sufficient to cause major midbrain gene expression changes in young mice, but does lead to substantial transcriptomic shift during aging, resembling the differences distinguishing C57BL/6J from A/J and DBA/2J strains. The changes induced by loss of Pttg1 are not limited to any specific cell type but instead appear to affect multiple different cell types of the ventral midbrain. Our findings implicate Pttg1 in the transcriptomic control of the midbrain during aging, and suggest it could contribute to the gene regulatory variation, and possibly also phenotypic variation, between mouse strains.
Materials and Methods
Animals
All experiments were performed in accordance with the European Communities Council Directive 2010/63/EU, approved by appropriate government agencies and respecting the 3 Rs’ requirements for Animal Welfare. For the mice bred in the Animal Facility of University of Luxembourg, all experiments with mice were performed according to the national guidelines of the animal welfare law in Luxembourg (Règlement grand-ducal adopted on January 11th, 2013). The protocol was reviewed and approved by the Animal Experimentation Ethics Committee (AEEC). For the mice bred in Helmholtz Centre for Infection Research (Braunschweig, Germany), all experiments were performed according to the national guidelines of the animal welfare law in Germany (BGBl. I S. 1206, 1313 and BGBl. I S. 1934). The protocol was reviewed and approved by the ‘Niedersächsisches Landesamt für Verbraucherschutz und Lebensmittelsicherheit, Oldenburg, Germany’ (Permit Number: 33.9-42502-05-11A193). Mice were housed on a 12 h light/dark cycle and provided food and water ad libitum. Three mouse strains, C57BL6/6J, A/J and DBA/2J, were used in this study. C57BL/6J and DBA/2J mice were purchased from the provider of Jackson Laboratory in Europe (Charles River). Study cohorts were either directly used after a 2-weeks resting period to allow for acclimatization and control for potential environmental effects, or were bred in house. The A/J breeders were directly purchased from Jackson Laboratory and the study cohorts were bred either at the Helmholtz Centre for Infection Research (Braunschweig, Germany) or in-house at the Animal Facility of University of Luxembourg (Esch-sur-Alzette, Luxembourg). Mice used were within 3–4 generations of breeding cycles. The Pttg1 knock-out transgenic line was established at Cedars Sinai Medical Center (Wang et al., 2003) and Pttg1–/– mice had been backcrossed to C57BL/6J for more than 10 generations. The Pttg1+/– mice were bred in-house to generate a 3 month-old study cohort (Pttg1+/+, Pttg1+/–, and Pttg1–/–) and to maintain a colony at the local animal facility. The cohort of older Pttg1–/– mice were kindly provided by Cedars Sinai Medical Centre (Los Angeles, United States) and housed for 2 weeks at the University of Luxembourg, before being euthanized, to allow for acclimatization. Nine month-old wildtype strain-matched C57BL/6J were used as a control. Strain background was controlled by TaqMan SNP Genotyping assays (Thermo Fisher Scientific, 4351382) for variants rs13477101 and rs13483897 (data not shown).
In this study, 12 mice per strain were used at 3 months of age, 4–6 mice per strain were used at 9 months of age and 5–6 mice per group were used for the Pttg1 cohorts. For each cohort a comparable number of males and females was used except for aged Pttg1–/– cohort where all of the mice were female. At each age group the mice were anesthetized with a ketamine-medetomidine mix (150 and 1 mg/kg, respectively) and intracardially perfused with PBS (phosphate-buffered saline) before extracting the brain. One hemibrain of each mouse was dissected for midbrain. The ventral midbrain was dissected as described in Karunakaran et al. (2007). Briefly, one hemibrain was placed ventral side up on a metal plate over ice, and the region was removed with Dumont forceps caudally of the hypothalamus and thalamus, rostrally of the pons, and ventrally of the Medial Lemniscus, and inferior colliculus. These regions were identified visually on the cut medial surface of the hemibrain. The dissected midbrain was immediately snap-frozen, stored at −80°C, and used for qPCR, RNA-seq, and ChIP-seq analysis as described below.
RT-qPCR
The RNA expression of genes of interest was measured in the midbrains of C57BL/6J, A/J, and DBA/2J. RNA was extracted from the midbrain of each mouse using the RNeasy® Plus Universal Mini Kit (Qiagen, Germany). The reverse transcription was performed using 300 ng of total RNA mixed with 3.8 μM of oligo(dT)20 (Life Technologies) and 0.8 mM of dNTP Mix (Invitrogen). After heating the mixture to 65°C for 5 min and an incubation on ice for 1 min, a mix of first-strand buffer, 5 mM of DTT (Invitrogen), RNAse OUTTM (Invitrogen) and 200 units of SuperScript III reverse transcriptase (200 units/μL, Invitrogen) was added to the RNA. The mixture was incubated at 50°C for 60 min and then the reaction was inactivated by heating at 70°C for 15 min. After adding 80 μL of RNAse free water, the cDNA is stored at −20°C.
RT-qPCR was performed to measure the RNA expression of several genes using the Applied Biosystems 7500 Fast Real-Time PCR System. Each reaction had 5 μL of cDNA, 5 μL of primer mixture (forward and reverse primers) (2 μM) and 10 μL of the Absolute Blue qPCR SYBR Green Low ROX Mix (Thermo Fisher Scientific, AB4322B). The conditions of the PCR reaction were the following: 95°C for 15 min and repeating 40 cycles of 95°C for 15 s, 55°C for 15 s and 72°C for 30 s. The gene expression level was calculated using the 2–(ΔΔCt) method. The ΔΔCt refers to ΔCt(target gene) −ΔCt(housekeeping gene)test − (ΔCt(target gene) −ΔCt(housekeeping gene))control. Rpl13a and Gapdh were used as the housekeeping genes and the sequences of the used primers are provided in the Supplementary Table S1.
RNA-Seq
The RNA sequencing of 6 C57BL/6J and 6 A/J samples from both 3 and 9 months old mice was done at the sequencing platform of the Genomics Core Facility in EMBL Heidelberg, Germany. The samples were processed by Illumina CBot. The single-end, stranded sequencing was applied by the Illumina NextSeq 500 machine with read length of 80 bp.
The remaining RNA-seq samples were processed at the sequencing platform in the Luxembourg Centre for Systems Biomedicine (LCSB) of the University of Luxembourg. The RNA quality was determined by Agilent 2100 Bioanalyzer and the concentration was quantified by NanoDrop. The TruSeq Stranded mRNA Library Prep kit (Illumina) was used for library preparation with 1 μg of RNA as input according to the manufacturer’s instructions. The libraries were then adjusted to 4 nM. The single-end, stranded sequencing was applied by the Illumina NextSeq 500 machine with read length of 75 bp.
The raw reads quality was assessed by FastQC (v0.11.5) (Andrews, 2010). Using the PALEOMIX pipeline (v1.2.12) (Schubert et al., 2014), AdapterRemoval (v2.1.7) (Lindgreen, 2012) was used to remove adapters, with a minimum length of the remaining reads set to 25 bp. The rRNA reads were removed using SortMeRNA (v2.1) (Kopylova et al., 2012). After removal of adapters and rRNA reads, the quality of the files was re-assessed by FastQC. The mapping was done by STAR (v.2.5.2b) (Dobin et al., 2013). The mouse reference genome, GRCm38.p5 (mm10, patch 5), was downloaded from GENCODE. The suit tool Picard (v2.10.9) (Adams et al., 2000) validated the BAM files. Raw FASTQ files were deposited in ArrayExpress with the accession number E-MTAB-8333.
The reads were counted using featureCounts from the R package Rsubread (v1.28.1) (Liao et al., 2014). The differentially expressed genes (DEGs) were called using R package DESeq2 (v1.20.0) (Love et al., 2014). RPKM for each gene in each sample was calculated as reads divided by the scale factor and the gene length (kb). The scale factor was calculated as library size divided by 1 million.
Chromatin Immunoprecipitation (ChIP)
ChIP was performed on the dissected mouse midbrain tissue. The fresh tissue was snap frozen for at least a week before crosslinking with formaldehyde (Sigma-Aldrich, F8775-25ML) at a final concentration of 1.5% in PBS (Lonza, BE17-516F) for 10 min at room temperature. The formaldehyde was quenched by glycine (Carl Roth, 3908.3) at a final concentration of 125 mM for 5 min at room temperature, followed by centrifugation at 1,300 rpm for 5 min at 7°C. The fixed tissue was washed twice for 2 min with ice-cold PBS plus 1x cOmpleteTM mini Proteinase Inhibitor (PI) Cocktail (Roche, 11846145001). The tissue was minced by the Dounce Tissue Grinder (Sigma, D8939-1SET), the lysate of which was centrifuged at 1,300 rpm for 5 min at 7°C. The pellet was suspended in ice-cold Lysis Buffer [5 mM 1,4- piperazinediethanesulfonic acid (PIPES) pH 8.0 (Carl Roth, 9156.3), 85 mM potassium chloride (KCl) (PanReac AppliChem, A2939), 0.5% 4-Nonylphenyl-polyethylene glycol (NP-40) (Fluka Biochemika, 74385)] with 1xPI, and kept on ice for 30 min. The tissue lysate was centrifuged 2,500 rpm for 10 min at 7°C. The pellet was suspended with ice-cold Shearing Buffer [50 mM Tris Base pH 8.1, 10 mM ethylenediamine tetraacetic acid (EDTA) (Carl Roth, CN06.3), 0.1% sodium dodecylsulfate (SDS) (PanReac Applichem, A7249), 0.5% sodium deoxycholate (Fluka Biochemika, 30970)] with 1x PI.
The sonication (Diagenode Bioruptor Pico® Sonication System with minichiller 3000) was used to shear the chromatin with program 30 s on, 30 s off with 35 cycles at 4°C. After sonication the cell debris was removed by centrifugation at 14,000 rpm for 10 min at 7°C. The concentration of the sheared and reverse crosslinked chromatin was measured by NanoDrop 2000c (Thermo Fisher Scientific, E597) and shearing was confirmed to produce chromatin fragments of 100–200 bp.
Each reaction had 10–14 μg of chromatin, of which 10% of the aliquot was used as input DNA. The chromatin sample was diluted 1:10 with Modified RIPA buffer [140 mM NaCl (Carl Roth, 3957.2), 10 mM Tris pH 7.5, 1 mM EDTA, 0.5 mM ethylene glycol-bis-N,N,N′,N′-tetraacetic acid (EGTA) (Carl Roth, 3054.3), 1% Triton X-100, 0.01% SDS, 0.1% sodium deoxycholate] with 1x PI, followed by addition of 5 μL of H3K4me3 (histone H3 lysine 4 trimethylation) antibody (Millipore, 17-614) and incubation overnight at 4°C with rotation. After incubation, the immunocomplexes were collected with 25 μL of PureProteomeTM Protein A Magnetic (PAM) Beads (Millipore, LSKMAGA10) for 2 h at 4°C with rotation.
The beads were washed twice with 800 μL of Wash Buffer 1 (WB1) [20 mM Tris pH 8.1, 50 mM NaCl, 2 mM EDTA, 1% Triton X-100, 0.1% SDS], once with 800 μL of Wash Buffer 2 (WB2) [10 mM Tris pH 8.1, 150 mM NaCl, 1 mM EDTA, 1% NP-40, 1% sodium deoxycholate, 250 mM lithium chloride (LiCl) (Carl Roth, 3739.1)], and twice with 800 μL of Tris-EDTA (TE) Buffer (10 mM Tris PH 8.1, 1 mM EDTA pH 8.0). The beads were re-suspended in 100 μL of ChIP Elution Buffer [0.1 M sodium bicarbonate (NaHCO3) (Sigma-Aldrich, S5761) and 1% SDS]. After the elution, the chromatin and the 10% input were both reverse-crosslinked at 65°C for 3 h with 10 μg of RNase A (Thermo Fisher Scientific, EN0531) and 20 μg of thermoresistant proteinase K (Thermo Fisher Scientific, EO0491), followed by purification with MiniElute Reaction Cleanup Kit (Qiagen, 28206) according to the manufacture’s instruction.
The concentration of the chromatin was measured by Qubit dsDNA HS Assay Kit (Thermo Fisher Scientific, Q32851) and Qubit 1.0 fluorometer (Invitrogen, Q32857) according to the manufacturer’s instructions and rest of the chromatin was used for high-throughput sequencing.
ChIP-Seq
The sequencing of the chromatin samples was done at the sequencing platform in the LCSB of the University of Luxembourg. The single-end, unstranded sequencing was applied by the Illumina NextSeq 500 machine with read length of 75 bp. The raw reads quality was assessed by FastQC (v0.11.5) (Andrews, 2010). The PALEOMIX pipeline (v1.2.12) (Schubert et al., 2014) was used to generate BAM files from the FASTQ files, including steps of adapter removal, mapping and duplicate marking. The mapping was done by BWA (v.0.7.16a) (Li and Durbin, 2009), with backtrack algorithm using the quality offset of Phred score to 33. Duplicate reads were marked but not discarded. The mouse reference genome, GRCm38.p5 (mm10, patch 5), was downloaded from GENCODE1. The suit tool Picard (v2.10.9) (Adams et al., 2000) was used to validate the BAM files. Raw FASTQ files were deposited in ArrayExpress with the accession number E-MTAB-8333.
The H3K4me3 ChIP-seq peaks were called by Model-based analysis of ChIP-seq (MACS, v2.1.1) (Zhang et al., 2008). The signal normalization in pairwise comparison was done by THOR (v0.10.2) (Allhoff et al., 2016), with TMM normalization and adjusted p-value cut-off 0.01.
Principle Component Analysis (PCA)
The raw counts were normalized to library size and log2-transformed using DESeq2 (v1.20.0). The PCs were calculated with 500 genes which have the most varied expression across samples.
Bulk RNA-Seq Data Deconvolution Using Single Cell RNA-Seq Data
The bulk RNA-seq deconvolution was done with CIBERSORTx2 (Newman et al., 2019). The signature matrix on SN of single cell RNA-seq was constructed with DropViz3 with default parameters. The expression of 332 genes correlating with PC1 (p < 0.05) from Figure 5A in 5 cell types (neuron, dopaminergic neuron, oligodendrocyte, astrocyte, endothelial cells) were inferred with default parameters.
Statistical Analysis
The p-value of DEGs called from pair-wise comparisons in RNA-seq was adjusted for multiple testing with the Benjamini-Hochberg procedure with cutoff below 0.05. The significance of peak calling was analyzed with MACS2 and the significance in ChIP-seq signal normalization was defined with multiple test correction (Benjamini/Hochberg) for p-values with cutoff below 0.05.
Results
Midbrain Transcriptomes Are Significantly Different Between Common Mouse Strains
To investigate genetic background driving gene expression differences in ventral midbrain, we performed transcriptomic and epigenomic analyses on isolated ventral midbrains containing SN and VTA from three genetically diverse mouse strains, C57BL/6J, A/J, and DBA/2J (Figure 1A). For transcriptomic profiling, midbrains from 36 individual 3-month old mice were analyzed by RNA-seq, corresponding to 12 mice (6 males and 6 females) from each strain. For epigenomic analysis, the enrichment of histone H3 lysine 4 trimethylation (H3K4me3), an established marker of open transcription start sites (TSS) (Santos-Rosa et al., 2002; Barski et al., 2007; Guenther et al., 2007), was analyzed by ChIP-seq from dissected ventral midbrain of 6 individual 3-month old mice (2 males from each strain).
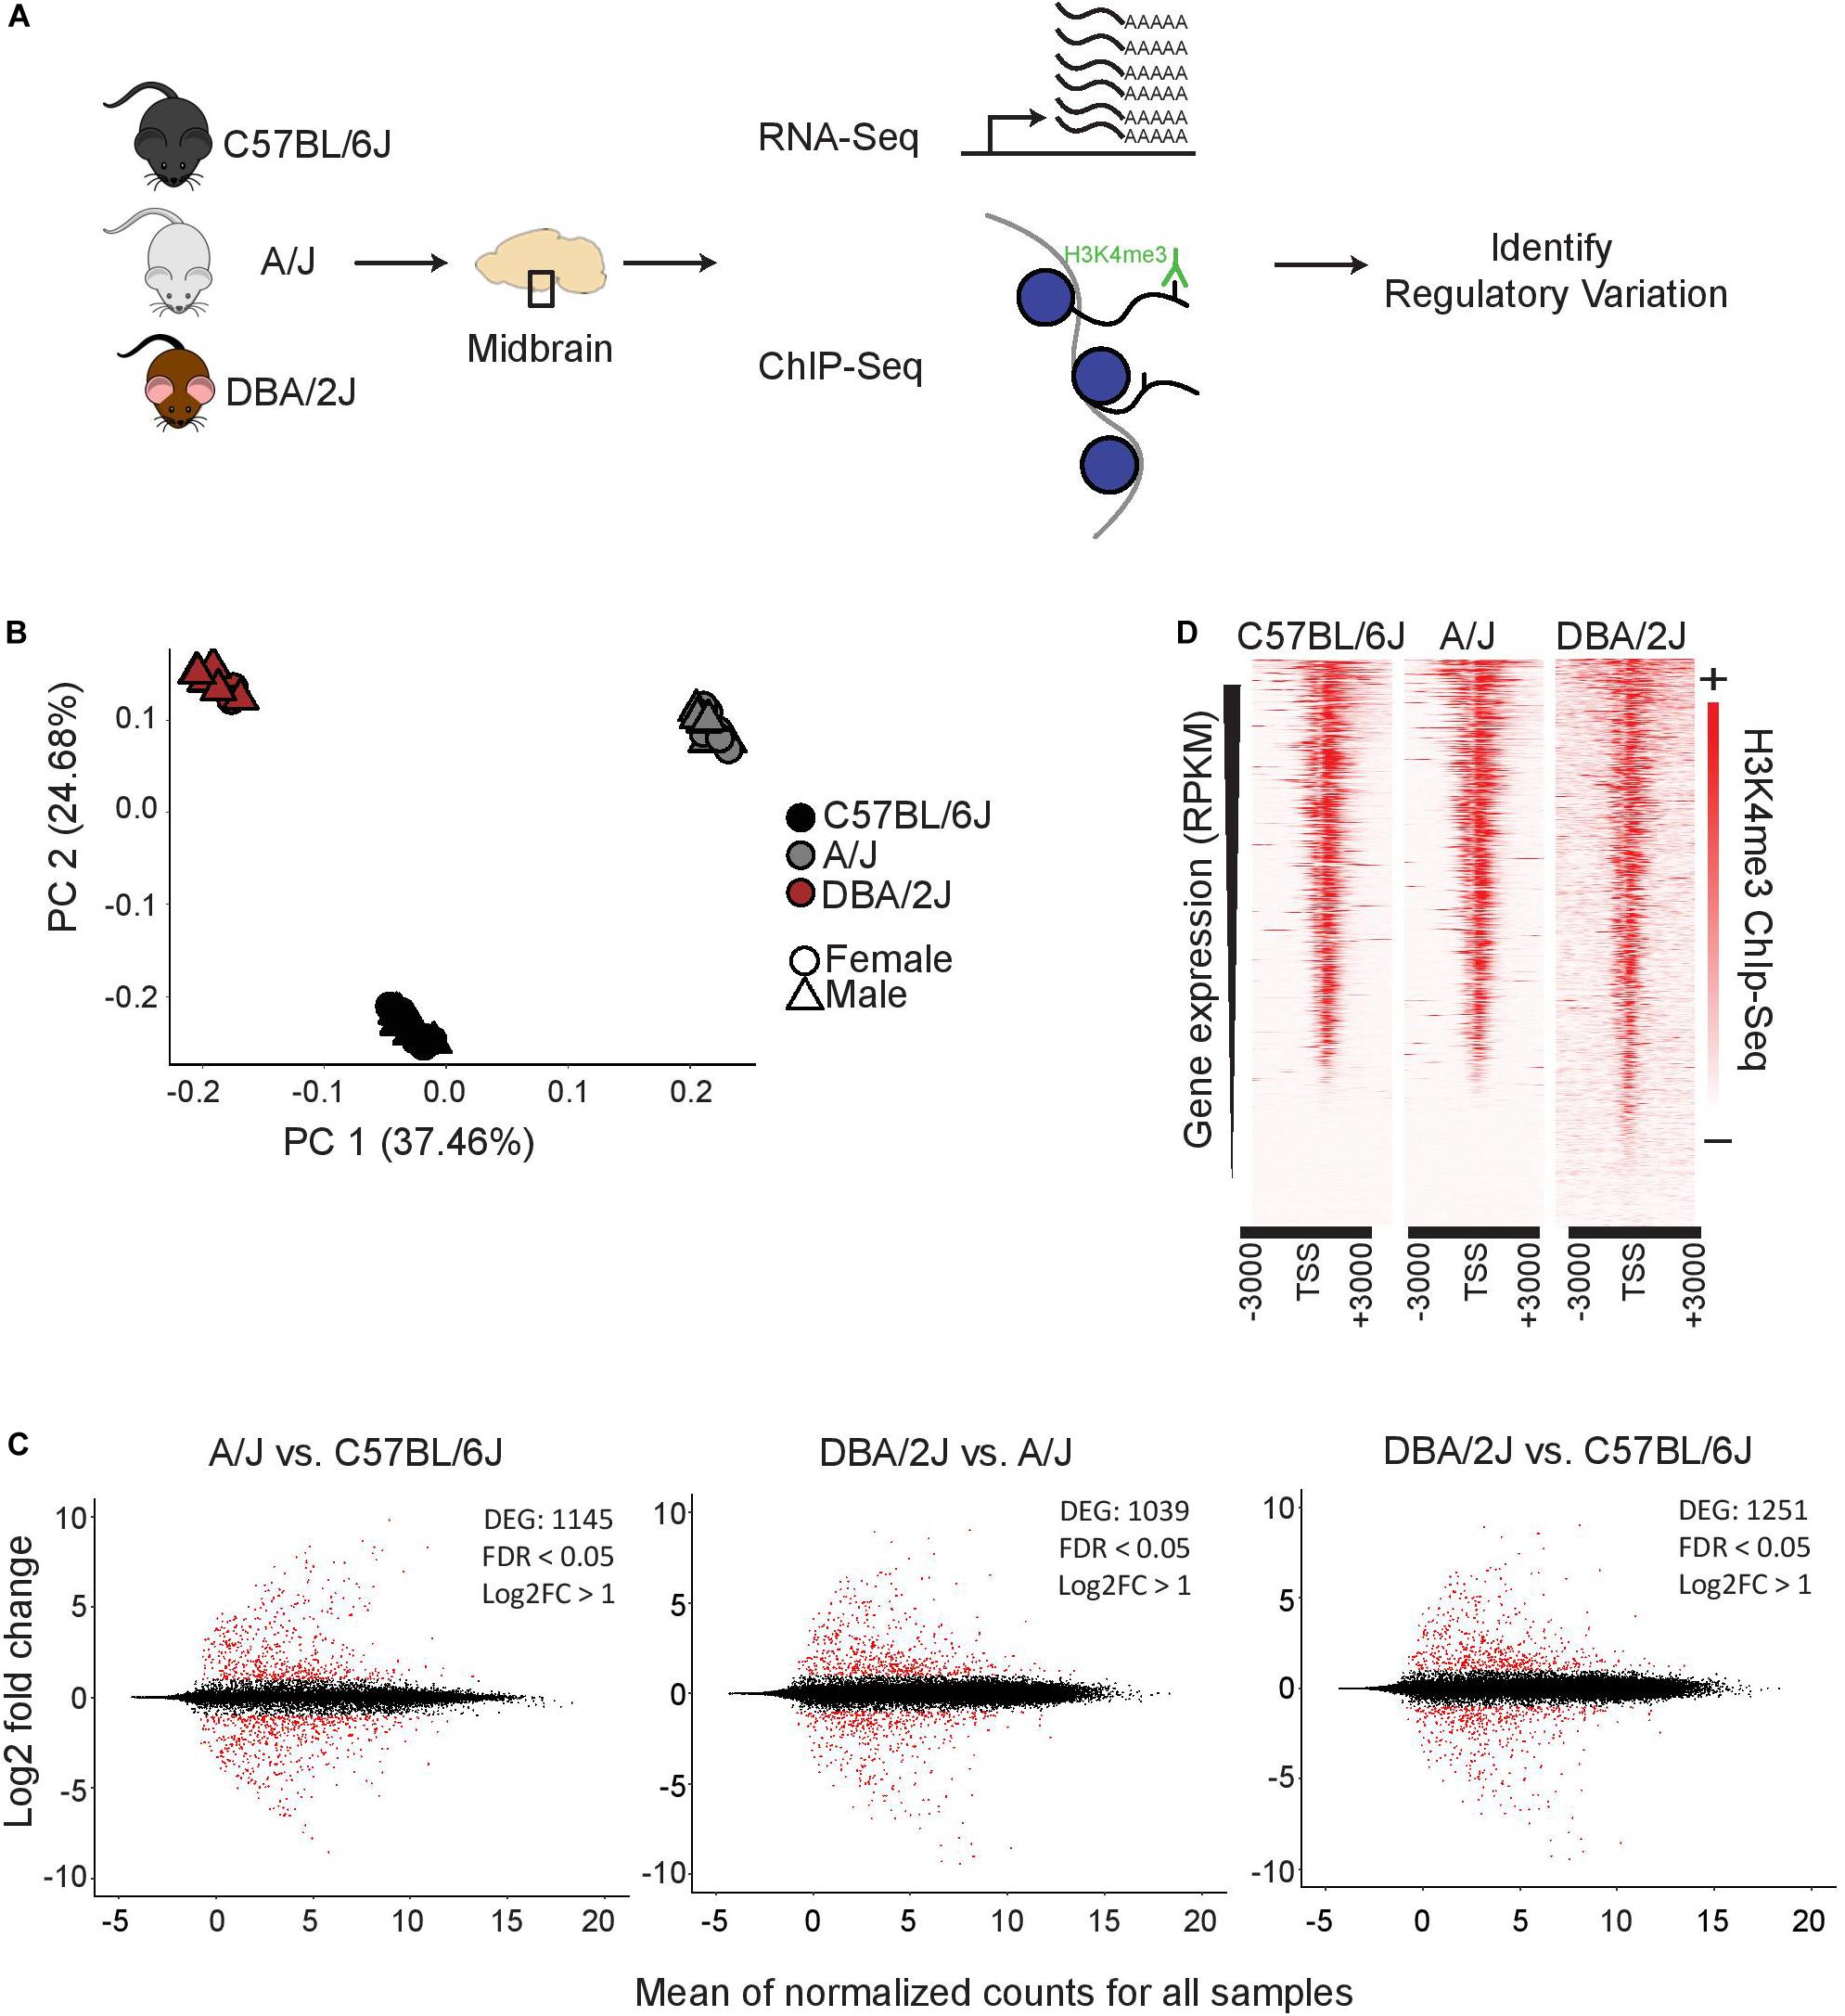
Figure 1. Functional genomics profiling of isolated midbrains of 3-month-old C57BL/6J, A/J, and DBA/2J mice. (A) Schematic representation of the experimental set-up. The ventral midbrains of C57BL/6J, A/J, and DBA/2J, dissected using anatomical landmarks directly after mouse euthanasia, were used for RNA-seq and ChIP-seq. (B) Principle component analysis showing transcriptome level differences in the midbrains of the three strains. The individual mice are indicated with black (C57BL/6J), gray (A/J), or brown (DBA/2J). Circles indicate females and triangles males. No bias was observed between females and males. (C) Pairwise comparisons showing DEGs in the midbrains of the three strains. MA plots from left to right: A/J vs. C57BL/6J, DBA/2J vs. A/J, and DBA/2J vs. C57BL/6J. The analysis was done by DEseq2 using ashr shrinkage. The x-axis represents the mean of normalized counts for all replicates and the y-axis represents the log2-fold change. Each dot represents one gene. Genes with FDR < 0.05 and log2-fold change (log2FC) > 1 are indicated in red and referred to as DEGs. (D) H3K4me3 ChIP-seq signal with corresponding gene expression levels as measured by RNA-seq. The intensity of H3K4me3 ChIP-seq signals are plotted in a window of 3 kb upstream and downstream of the TSS and within-sample normalization was applied. The genes are ranked based on gene expression levels (RPKM) from highest to lowest.
A principle component analysis (PCA) of RNA-seq data could clearly separate the samples according to strain of origin (Figure 1B), suggesting significant differences exist at the transcriptomic level between ventral midbrains. Males and females showed only minor differences as indicated in Figure 1B. Analysis of strain:sex interaction effect by DESeq2 revealed only 1–13 genes, depending on the comparison, to be dependent on the sex, indicating that main driver of gene expression differences was the genetic background of each strain. Indeed, a pair-wise comparison of the individual strains to each other revealed a significant (FDR < 0.05) change in expression with a log2-fold change (log2FC) higher than 1 for more than 1000 genes (Figure 1C and Supplementary Table S2). Changes could be observed for both high expressed genes as well as lower abundance transcripts with comparable numbers of up- and down-regulated transcripts in each comparison.
Gene expression levels correlated well with the enrichment of H3K4me3 at the corresponding TSS (Figure 1D), indicating that the ChIP-seq could serve as an indicator of midbrain transcriptional activity.
Pttg1 Is the Only Transcription Factor With Altered Midbrain Expression Between All Three Mouse Strains
Gene expression changes linked to complex traits have been suggested to be explained by both small cumulative effects of cis-regulatory variants across numerous genes, and by cis-regulatory variants at “peripheral master regulators” such as TFs that can in trans influence a number of co-regulated genes directly linked to the trait (Liu et al., 2019). To better understand whether the observed gene expression changes in the mouse midbrain transcriptomes could be due to variants affecting upstream TFs, we further examined TFs included among the differentially expressed genes (DEGs). We first overlapped the DEGs from the pair-wise comparisons of the strains and identified 53 genes to be differentially expressed between all three strains (Figure 2A). Moreover, we identified a total of 1292 genes to be shared between at least two of the pair-wise comparisons of the strains (Supplementary Table S3). These genes are clustered in Figure 2B according to their gene expression profiles across the three strains with comparable numbers of genes showing particularly abundant or low expression levels in one or another strain. Next we used a manually curated list of 950 TFs (Heinäniemi et al., 2013), 841 of which could be detected in the midbrain, and identified 5 genes coding for TFs (Pttg1, Npas1, Hes5, Scand1, and Zfp658) to be differentially expressed in at least one of the mouse strains (Figure 2B). Interestingly, the number of differentially expressed TFs was much smaller than the 36 TFs that could be expected among the DEGs just by chance (hypergeometric test, p = 2.03∗10–11). This lack of variation among TFs indicates a tight control of TF gene expression, which may need to be kept within a narrow range to allow for proper cellular function in the midbrain. Among the five TFs, only Pttg1 showed a significant difference between all three strains and higher than 2-fold change in each comparison (Figure 2B and Supplementary Table S3). In detail, C57BL/6J midbrain samples showed an average Pttg1 expression of 14 RPKM (Reads Per Kilobase Million) and DBA/2J samples an average expression of 2.5 RPKM while in A/J midbrains Pttg1 expression was never higher than 1 RPKM (Figure 2B and Supplementary Table S3). Differential midbrain expression levels of Pttg1 between different mouse strains was confirmed by RT-qPCR, with A/J showing a particularly low expression level (Supplementary Figures S1A,B). Moreover, the H3K4me3 signal from ChIP-seq analysis was clearly reduced at the TSS of Pttg1 gene in A/J compared to C57BL/6J, while no differences were observed at the TSS of neighboring genes Slu7 and C1qtnf2 (Figure 2C). In addition, the signal in A/J appeared comparable or lower than in DBA/2J, despite the overall enrichment in DBA/2J samples being weaker than in the other two strains. These results suggest that reduced expression of Pttg1 in the midbrain of A/J is due to decreased transcription at the locus.
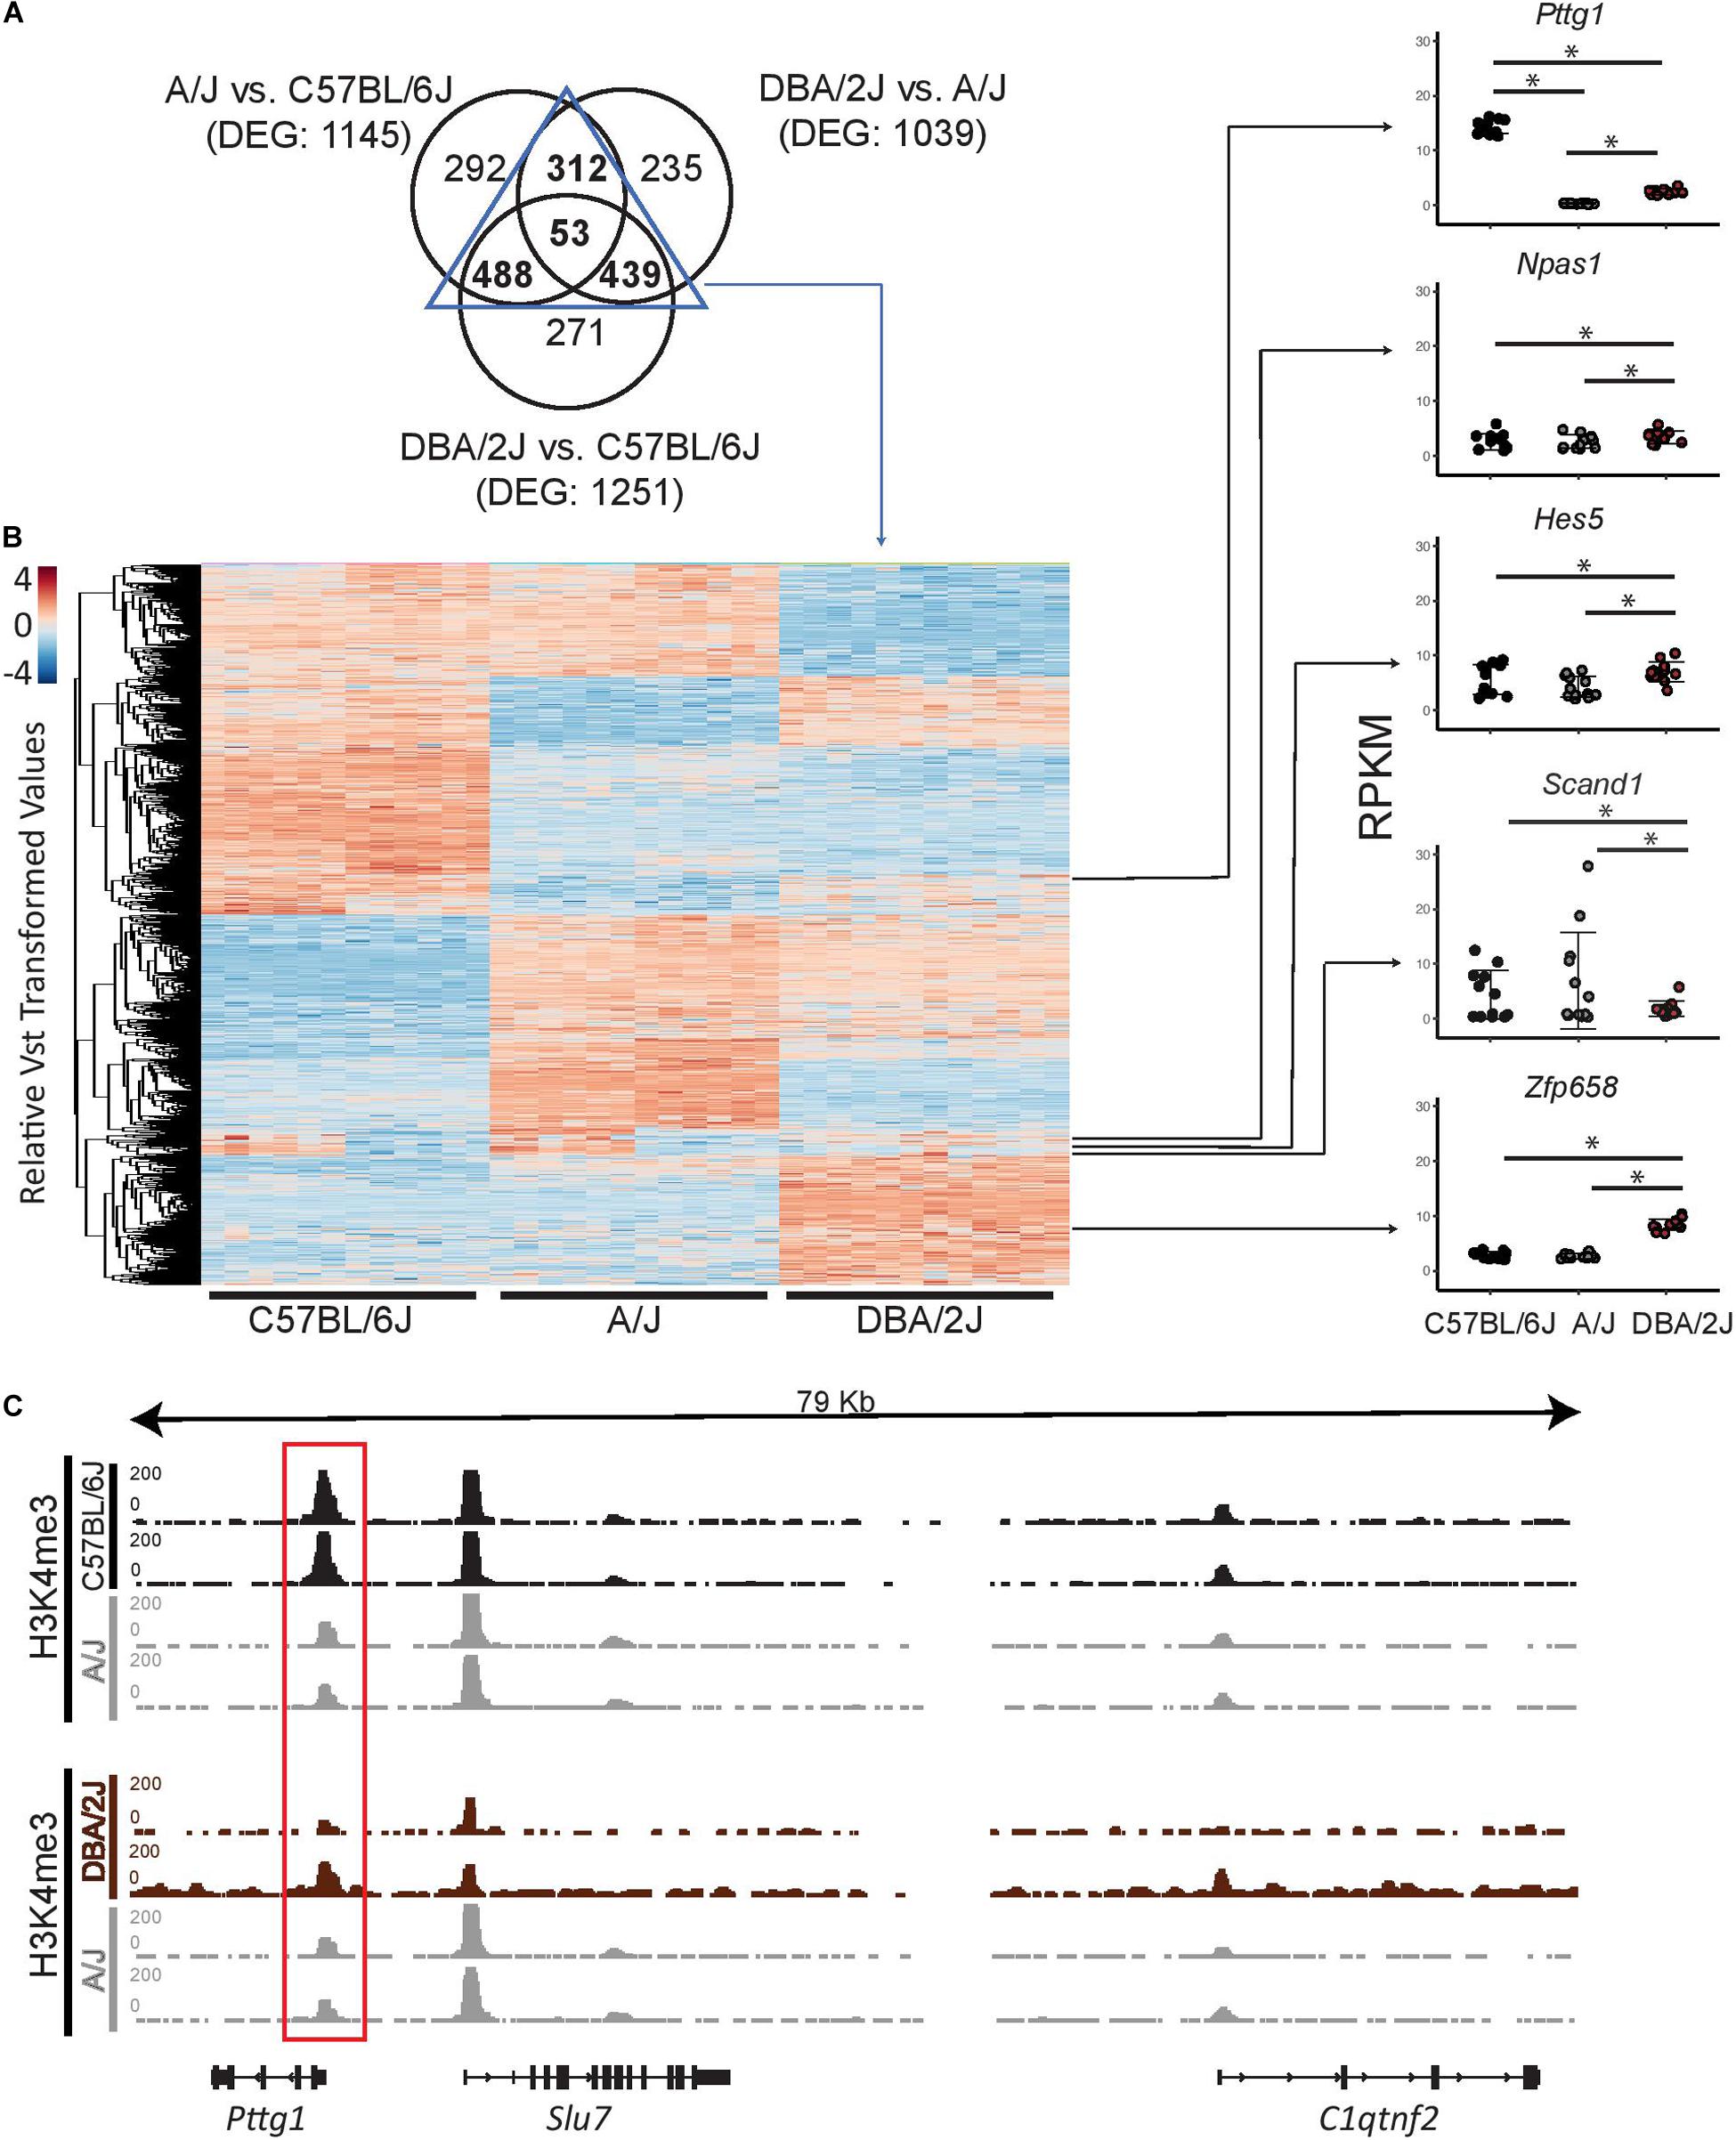
Figure 2. Pttg1 is the only TF differentially expressed between the midbrains of 3-month-old C57BL/6J, A/J and DBA/2J mice. (A) Venn diagram comparing DEGs of each pair-wise comparison of the mouse strains from Figure 1C. The majority of DEGs are shared by at least two comparisons. (B) Heatmap of the expression of the 1292 DEGs shared between at least two of the comparisons. The read counts were vst-transformed and used for clustering. Expression levels of the five DEGs coding for TFs are shown as dot plots. *FDR < 0.05. (C) The altered expression of Pttg1 is accompanied by changes in H3K4me3 ChIP-seq signal at the Pttg1 TSS. The H3K4me3 ChIP-seq was performed on two male replicates. The pair-wise comparisons (C57BL/6J vs. A/J and DBA2J vs. A/J) were performed by THOR with within-sample and between-sample normalizations. Normalized ChIP-seq signals are depicted in black (for C57BL/6J and DBA/2J) or in gray (for A/J). Red rectangle indicates Pttg1 TSS.
Therefore Pttg1 appears to be a prime candidate for explaining midbrain transcriptomic differences between the mouse strains.
Loss of Pttg1 Leads to Changes in the Midbrain Transcriptome During Aging
Given that Pttg1 encodes the only TF with significantly altered expression levels between all three mouse strains, we investigated the role of midbrain PTTG1 in more detail. To test whether altered expression of Pttg1 alone can indeed influence the midbrain transcriptome, we investigated C57BL/6J congenic Pttg1–/– mice. In contrast to differences in A/J or DBA/2J, deletion of Pttg1 in the 3-month old mice leads to minor transcriptomic changes with 3 additional genes differentially expressed compared to the Pttg1+/+ littermates (Figure 3A). Two of these (Thg1l and Ublcp1) were previously found to strongly correlate with Pttg1 expression across different mouse strains, and to be genetically associated with neocortex volume (Gaglani et al., 2009), while the third gene (Gm12663) is an anti-sense transcript of Ublcp1. Moreover, the expression of these genes is dependent of Pttg1 expression level when corroborating the analysis with 3-month-old Pttg1+/–, with Ublcp1 showing positive, and Thg1l and Gm12663 showing negative correlation with Pttg1 levels (Figure 3B).
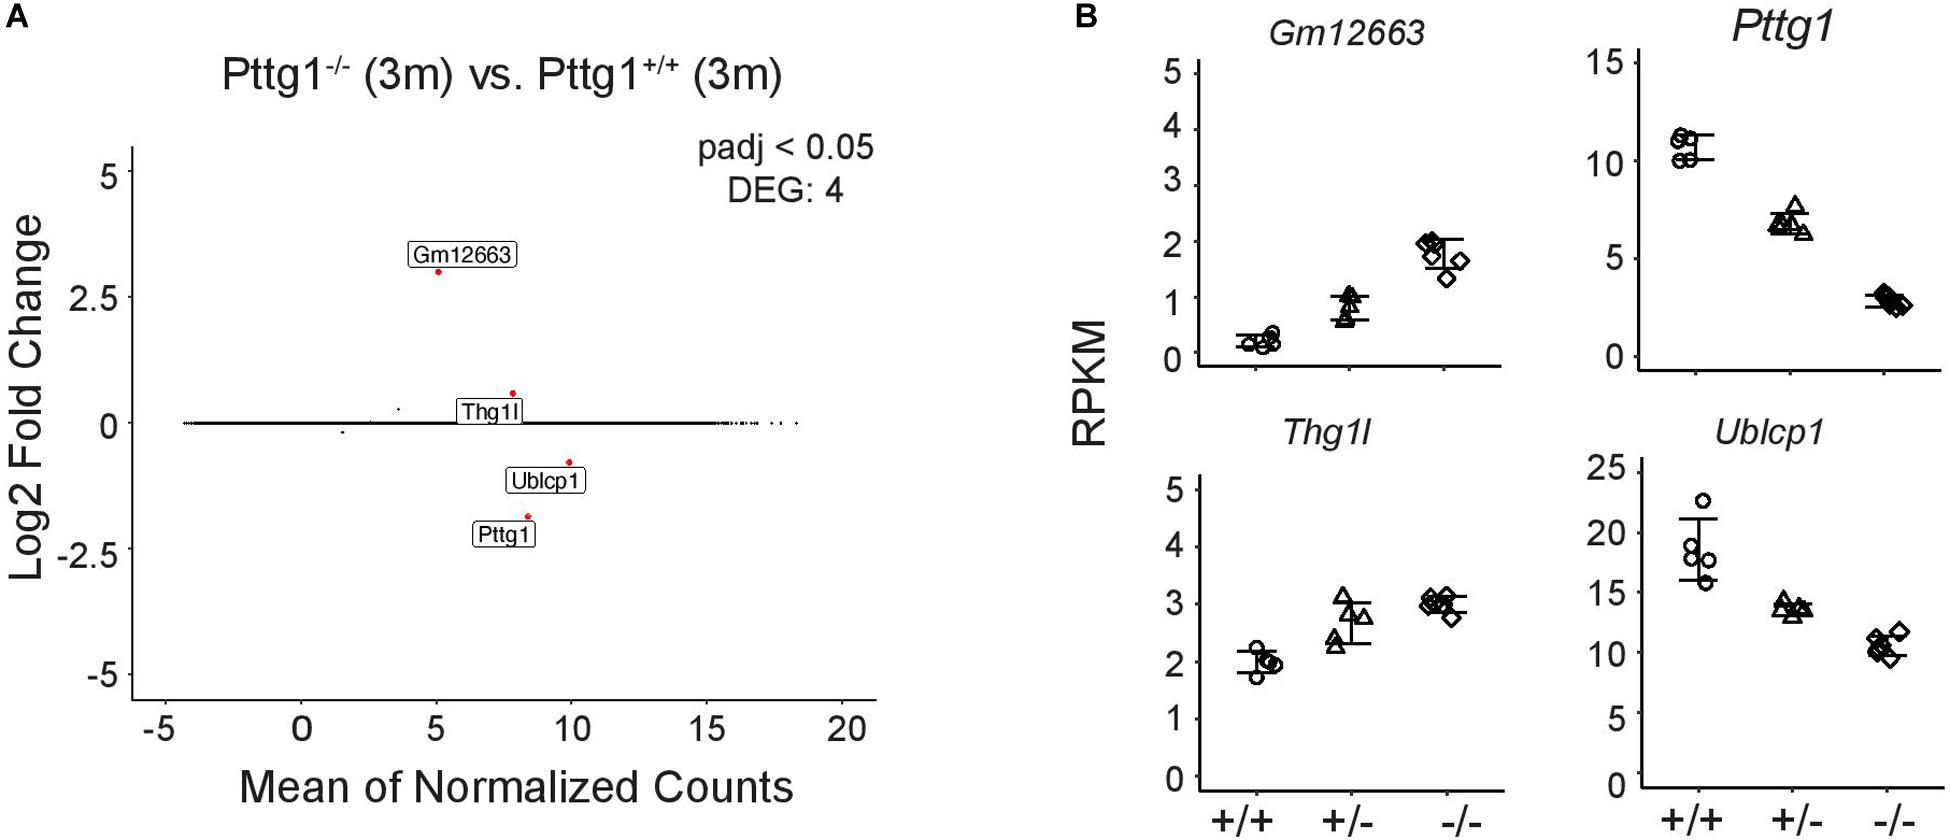
Figure 3. Loss of Pttg1 leads to minimal changes in the midbrain transcriptome in 3-month old mice. (A) RNA-seq analysis identifies four DEGs in comparison of the congenic C57BL/6J Pttg1–/– vs. Pttg1+/+ mice at the age of 3 months. MA plot was generated as in Figure 1C with labeling of the four DEGs (Pttg1, Thg1l, Ublcp1, Gm12663) that are indicated as red dots. (B) The expression of Ublcp1 is positively correlated with Pttg1 across genotypes, while Gm12663 and Thg1l show negative correlation with Pttg1. The dot plots indicate the expression levels of the DEGs as RPKM in isolated midbrains of Pttg1+/+, Pttg1+/–, and Pttg1–/– mice.
Although the observed midbrain transcriptome changes in Pttg1–/– mice were minimal, we were curious to elucidate whether these early changes would lead to additional transcriptomic differences at an older age. We therefore performed further RNA-seq analysis with isolated midbrains of a cohort of six aged mice from each C57BL/6J, A/J, and DBA/2J strains (all 9 months old), and C57BL/6J congenic Pttg1–/– mice (9–13 months old) (Figure 4A). Interestingly, comparing samples from 9-month-old wild-type C57BL/6J or A/J to those from younger 3-month-old mice of the respective strains identified almost no genes with strong expression changes of 5-fold or more (log2FC > 2.25) (Figure 4B and Supplementary Table S4). Similarly, comparison of 9-month-old DBA/2J midbrain transcriptome to the younger counterparts revealed only 57 strongly altered genes. Conversely, the midbrain samples of Pttg1–/– mice showed over 300 genes that were strongly differentially expressed in the aged mice compared to 3-month-old mice, as shown in the Volcano plot in Figure 4B.
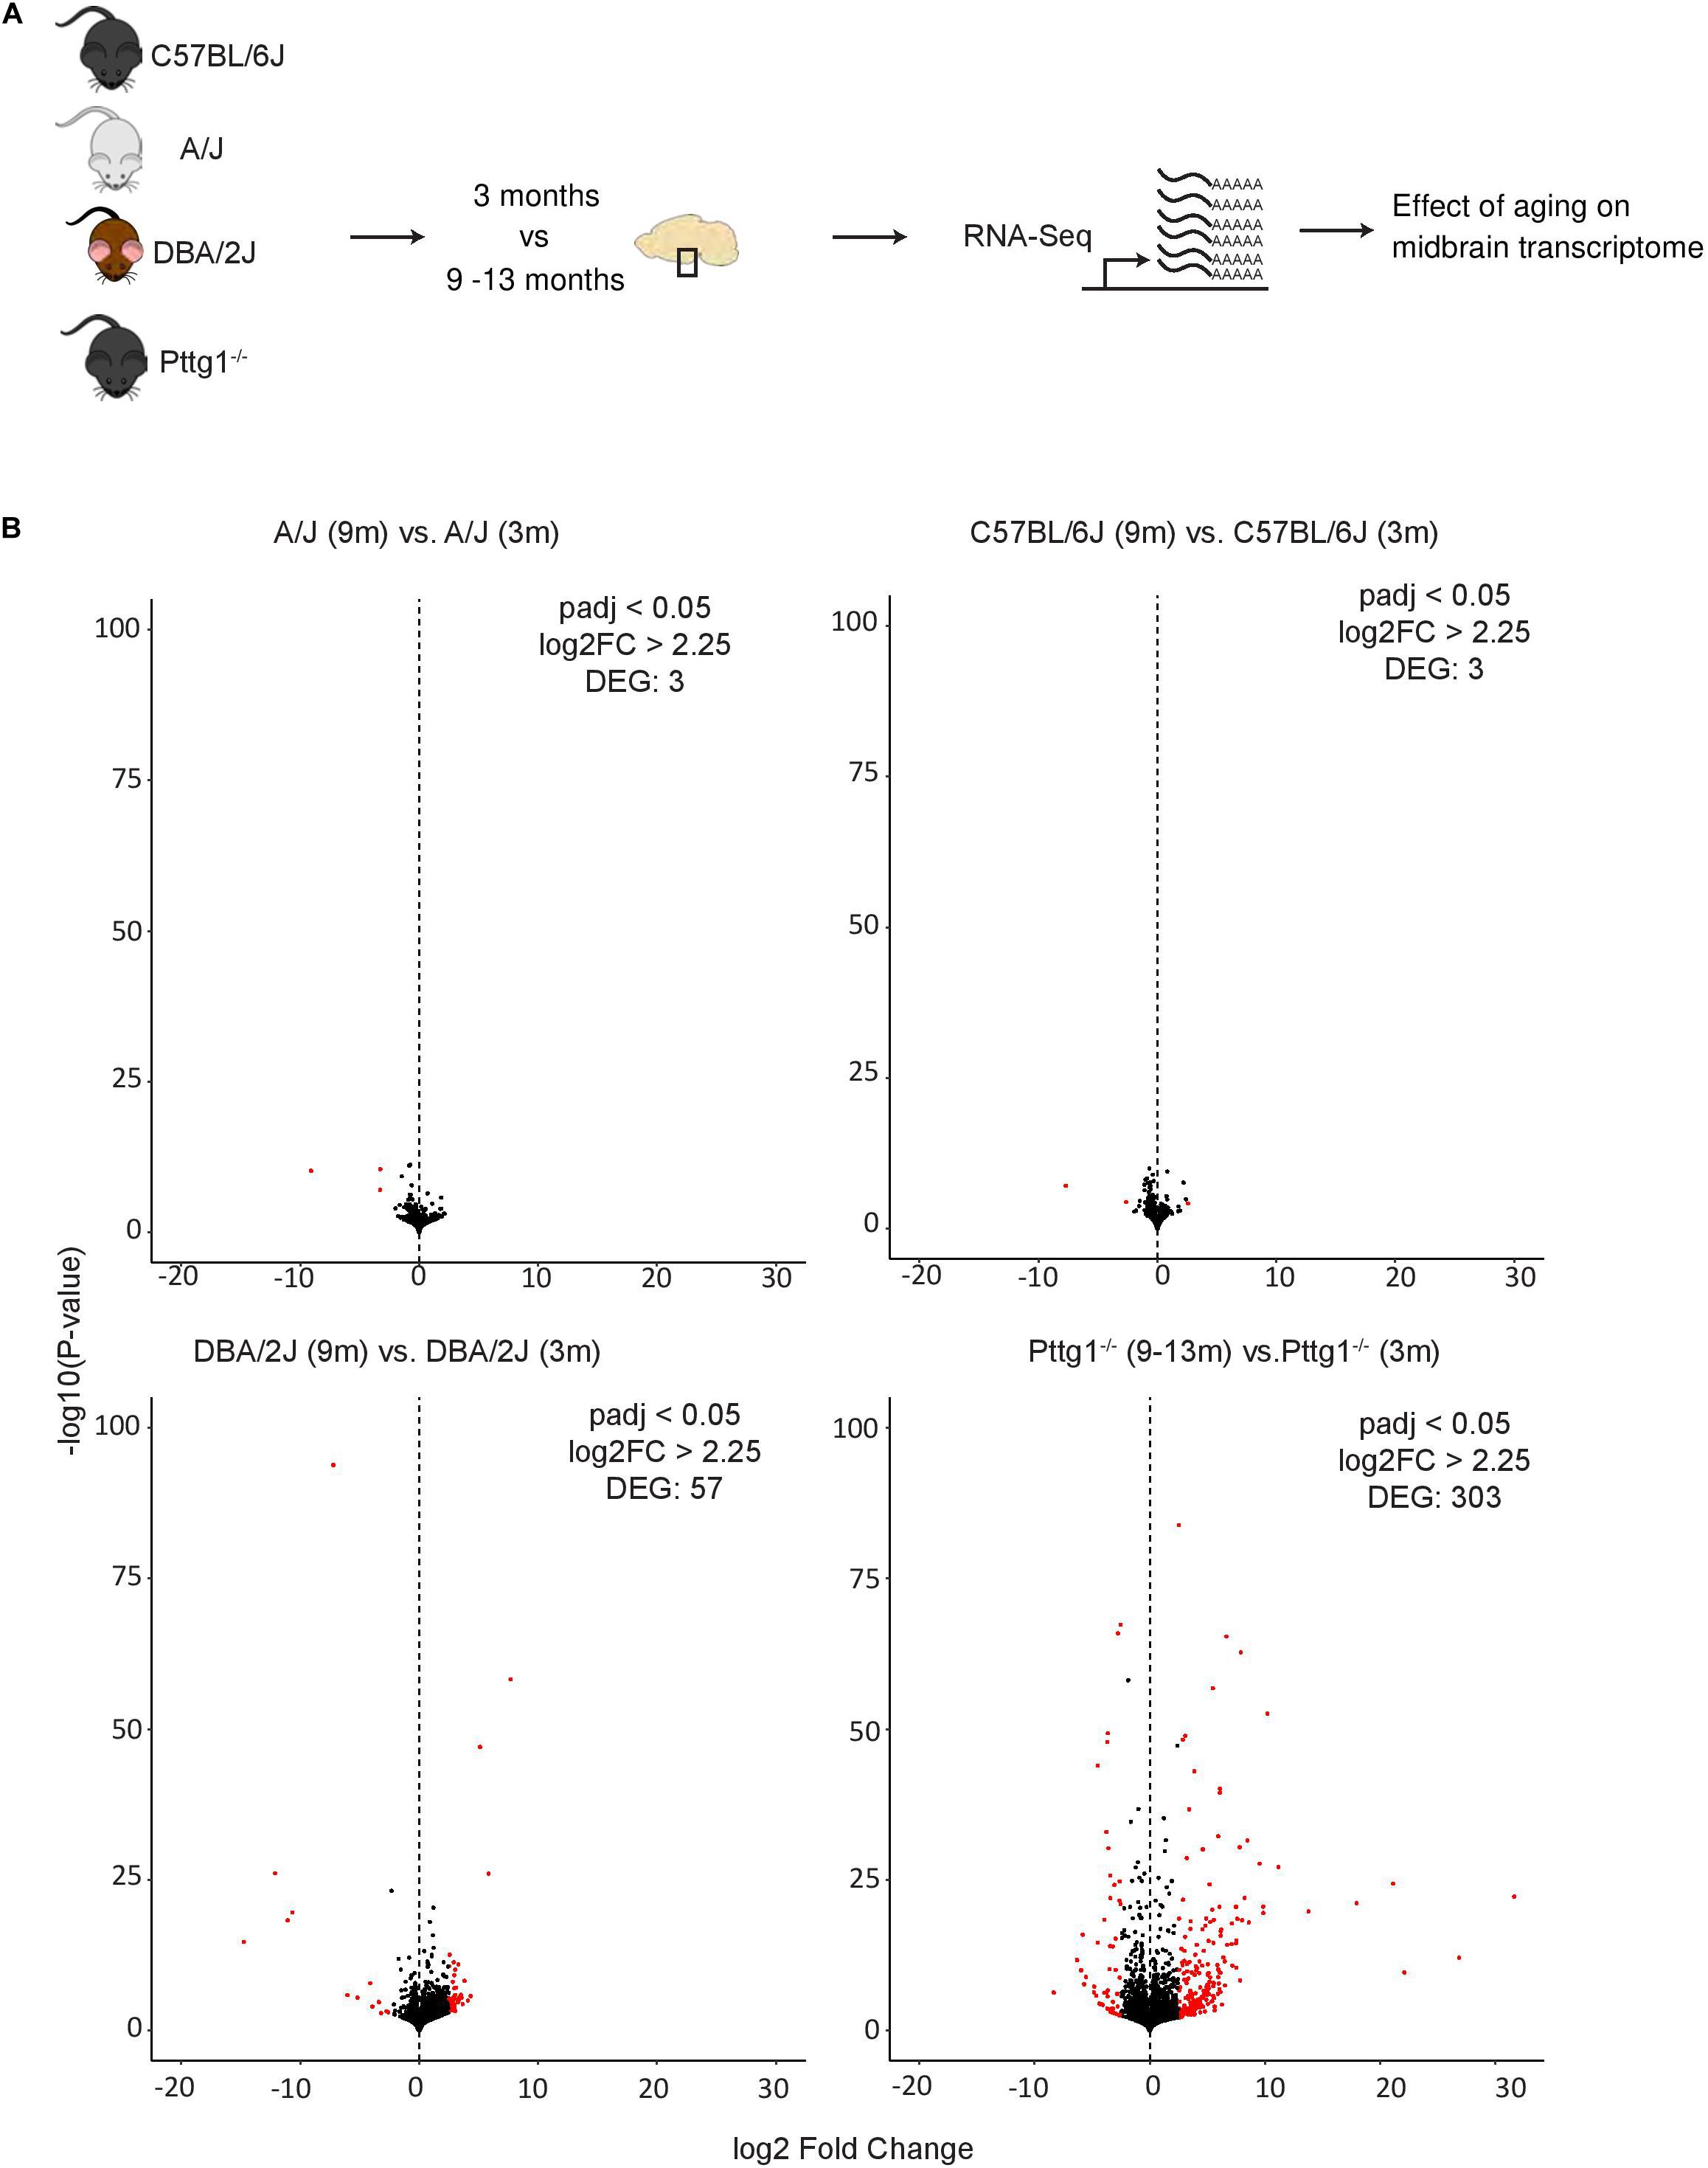
Figure 4. Loss of Pttg1 leads to significant transcriptomic changes in the midbrain during aging. (A) Schematic representation of the experimental set-up. The ventral midbrains of 9-month-old C57BL/6J, A/J and DBA/2J mice, and 9–13-months-old congenic C57BL/6J Pttg1–/– mice were used for RNA-seq as in Figures 1, 3. (B) Comparison of midbrain transcriptome of 9-month-old mice to the midbrain transcriptome of the corresponding strains at 3 months of age. Pttg1 deletion leads to more significant and higher gene expression changes than observed for wild-type mouse strains during aging. Volcano plots from left to right: A/J, C57BL/6J, DBA/2J, and congenic C57BL/6J Pttg1–/–. The x-axis represents the mean log2-fold change for all replicates and the y-axis represents the significance of change as –log10 (p-value). Each dot represents one gene. Genes with FDR < 0.05 and log2-fold change (log2FC) > 2.25 are indicated in red and referred to as DEGs.
Pttg1 Contributes to Gene Regulatory Variation in the Midbrain Cell Types During Aging
To obtain a broader overview of the extent and the direction of transcriptomic changes across the studied mouse strains and ages, we performed PCA analysis for all 78 midbrain transcriptome profiles. Interestingly, the PCA revealed that over half of the variance between the studied mice was explained by the first and the second principle components (PCs) that separated the mice according to genetic background (Figure 5A). C57BL/6J mice were separated from A/J and DBA/2J along PC1 while A/J and DBA/2J were separated from each other along PC2. Consistent with the small number of DEGs in 3-month-old Pttg1–/– mice, they clustered closely together with their heterozygous Pttg1+/– littermates, and with wild-type C57BL/6J mice. Also, aged mice clustered largely together with their genetically identical counterparts for each A/J, DBA/2J, and C57BL/6J. However, for the aged cohort of Pttg1–/– mice, the transcriptome profiles had significantly shifted along PC1 from C57BL/6J toward A/J and DBA/2J (Figure 5A).
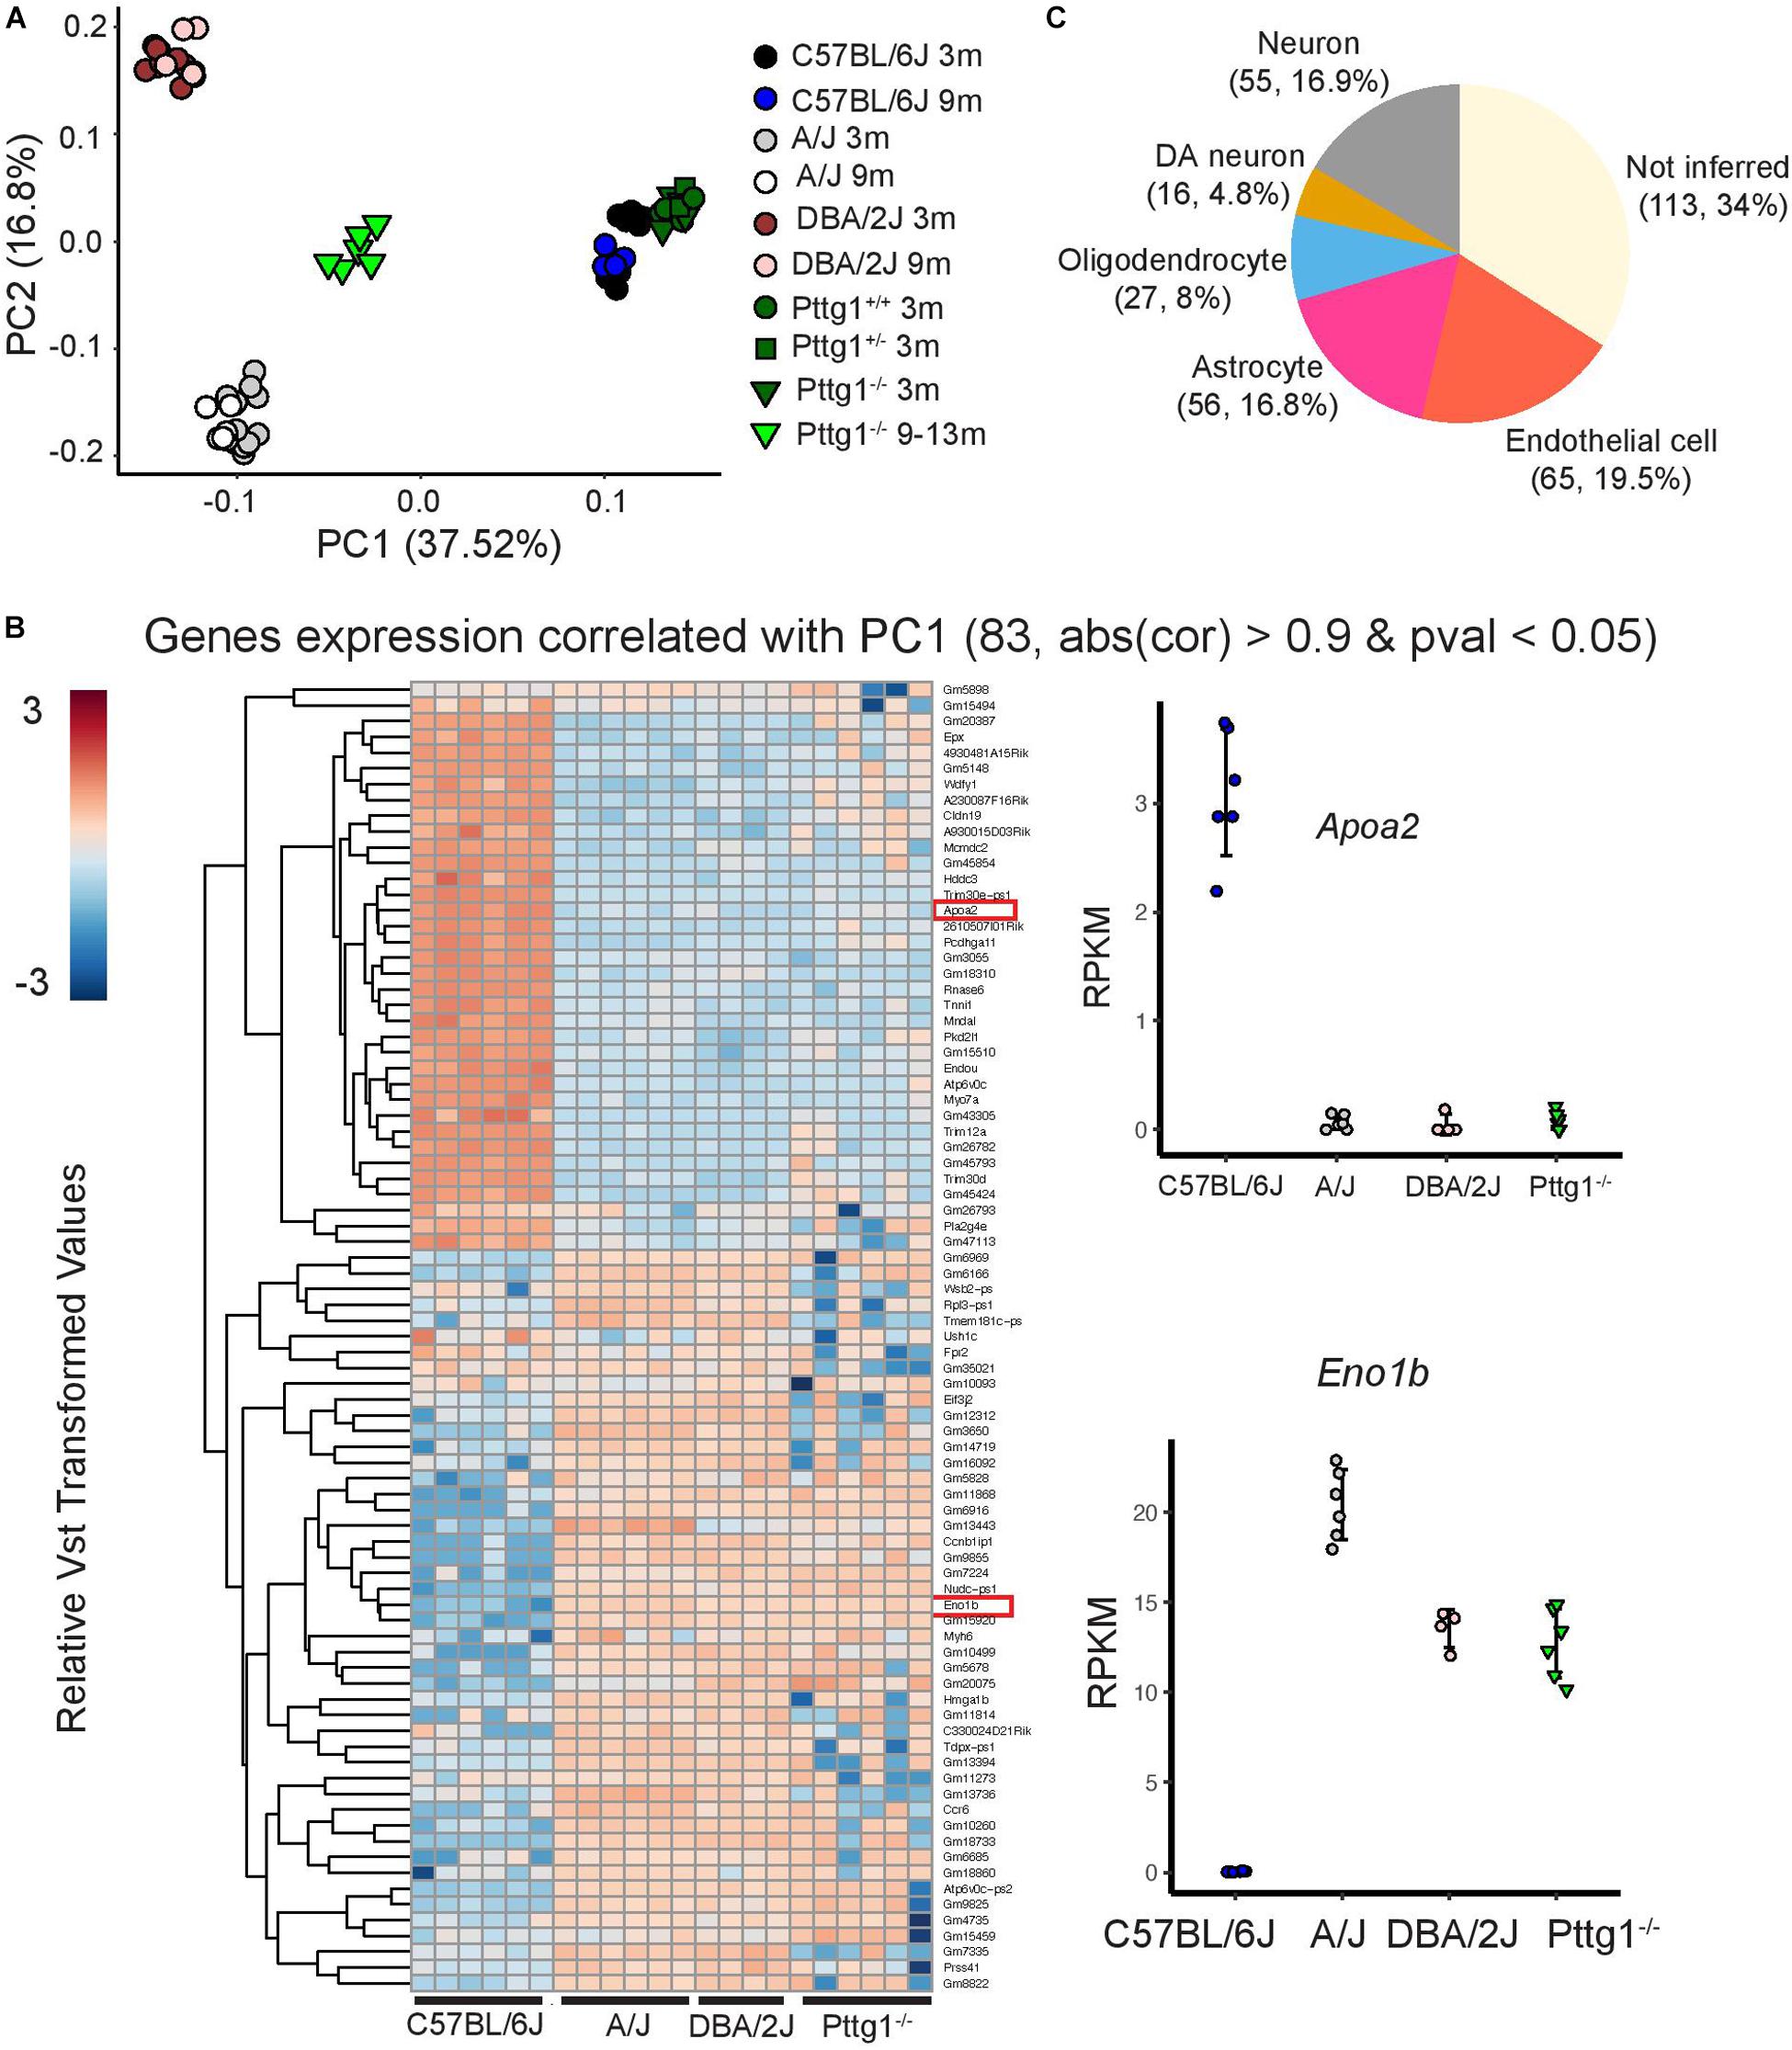
Figure 5. C57BL/6J Pttg1–/– midbrain transcriptome shift toward A/J and DBA/2J during aging. (A) Principle component analysis showing transcriptome level differences in the midbrains of C57BL/6J, DBA/2J, and A/J mice at the age of 3 and 9 months, congenic C57BL/6J Pttg1+/+, Pttg1+/–, and Pttg1–/– at 3 months, and Pttg1–/– at 9–13 months. Individual mice are indicated with black circles (C57BL/6J 3m), blue circles (C57BL/6J 9m), gray circles (A/J 3m), white circles (A/J 9m), brown circles (DBA/2J 3m), light brown circles (DBA/2J 9m), green circles (Pttg1+/+ 3m), dark green rectangles (Pttg1+/– 3m), dark green triangles (Pttg1–/– 3m), or light green triangles (Pttg1–/– 9–13m). No gender bias was observed. (B) Heat map of the differential genes associated with principle component 1 in (A). Gene expression profile of Pttg1–/– mice clusters with A/J and DBA/2J mice instead of C57BL/6J. (C) Deconvolution of differential gene expression using single cell RNA-seq was done for 331 genes contributing the most to PC1 in panel A and detected as expressed in 5 major cell types of the scRNA-seq data. The number of genes and their proportion of all analyzed genes are shown for each cell type.
Analysis of genes that contributed most to the differences along PC1 revealed genes that were altered not only in A/J and DBA/2J strains but also in aged Pttg1–/– mice when compared to C57BL/6J (Figure 5B). Furthermore, gene changes in Pttg1–/–, A/J, and DBA/2J mice showed the same directionality, with the Pttg1–/– mice clustering together with A/J and DBA/2J rather than C57BL/6J when analyzed with hierarchical clustering.
Finally, to see whether the loss of Pttg1 was specifically affecting only some of the cell types in the midbrain, we performed deconvolution analysis of the DEGs contributing to PC1 using mouse midbrain single cell RNA-seq data (Saunders et al., 2018). Based on the inference, the DEGs included genes preferentially expressed in many different cell types, including different types of neurons such as Th+ DAns, oligodendrocytes, astrocytes, and endothelial cells (Figure 5C). Additionally, over a third of the genes could not be inferred, suggesting they are expressed broadly across multiple different cell types.
Taken together, the results indicate that loss of Pttg1 leads to only limited transcriptomic changes in the midbrain of young mice, but can lead to substantial differences during aging, with parts of C57BL/6J transcriptome shifted toward A/J and DBA/2J in aging mice. Thus, our data indicate that PTTG1 contributes to transcriptome differences in multiple cell types of the midbrain between the three genetically diverse mouse strains.
Discussion
We investigated gene expression differences between mouse strains to understand how genetic variation can influence midbrain and its important cell types such as DAns that control motor function and behavior. Our transcriptomic analysis revealed extensive changes in midbrain gene expression between the 3 mouse strains and highlighted Pttg1 as an important regulator of midbrain transcriptome during aging.
The observed midbrain transcriptomic differences are comparable to the transcriptome level changes observed between mouse strains in other tissues such as lung (Wilk et al., 2015), striatum (Bottomly et al., 2011), and retina (Wang et al., 2019), or in specific cell types such as macrophages (Link et al., 2018) and other immune cells (Mostafavi et al., 2014). Interestingly, despite the obvious variation in the gene expression between the mouse strains, genes encoding for TFs are under-represented among the DEGs in the mouse midbrain. This finding is consistent with similar results from plants (Lin et al., 2017), where TF coding genes were also found to be under-represented among the genes showing differential expression between genetically diverse strains. Such findings are likely to be due to natural selection against phenotypes arising from major variation in TF expression levels that could be detrimental for the normal functioning of an organism.
In total 5 TFs were found to vary in their expression between the mouse strains. While most changes were weaker than those observed for Pttg1, they could nevertheless contribute to the observed gene regulatory variation. Indeed, both Npas1 and Hes1 have been previously connected to regulation of neuronal genes and neurogenesis (Ishibashi et al., 1994, 1995; Michaelson et al., 2017) while possible roles for Scand1 and Zfp658 in CNS have not yet been described. To investigate the possible contribution of these factors on gene regulatory variation between the mouse strains, we searched the existing data sets for those identifying targets of these TFs in central nervous system. Interestingly, target genes of Npas1 in hippocampus have been previously described (Michaelson et al., 2017). However, comparison of genes altered upon Npas1 deletion (FDR < 0.05) revealed only 5 genes to be shared with DEGs between A/J, DBA/2J, and C57BL/6J (data not shown). Therefore, Npas1 is not likely to mediate trans-acting variation between the mouse strains.
The only TF showing significant changes in the ventral midbrain between all three mouse strains is Pttg1, also known as securin. Pttg1 was originally described as an oncogene in pituitary tumors (Pei and Melmed, 1997) and found to regulate sister chromatid adhesion in M-phase of cell cycle (Zou et al., 1999). However, the protein has multiple functions and also a role as a DNA-binding transcriptional activator has been described (reviewed in Vlotides et al., 2007).
Little is known about the neurological functions of PTTG1. Keeley et al. (2014) identified a link between PTTG1 and the central nervous system, showing increased Pttg1 expression in retinas of C57BL/6J mice compared to A/J due to a cis deletion variant at the Pttg1 promoter, consistent with our findings in the midbrain. Interestingly, differential Pttg1 expression correlated with mosaic regularity variation across 25 recombinant inbred strains derived from the two parental C57BL/6J and A/J mouse strains, involving PTTG1 in the patterning of a type of retinal neurons, the amacrine cells. Moreover, Pttg1 expression in neocortex correlates with neocortical volume and the locus is genetically associated with this trait (Gaglani et al., 2009). Therefore, Pttg1 appears to play a role in development or maintenance of central nervous system, and our results indicate its possible involvement in genetic control of midbrain cell types. Indeed, previous work using microarrays found > 1400 genes to be misregulated across the whole brain of Pttg1–/– mice at the age of 3–5 months (Lum et al., 2006). While we identified far fewer DEGs specifically in the midbrain of the 3 month-old Pttg1–/– mice at our significance cut-off (FDR < 0.05) using RNA-seq, this increased significantly during aging. The differences in the results for younger mice could be due to the use of a specific brain region (rather than the whole brain) and applied methodology with related statistical analysis, but could also be contributed to by unknown differences in the environmental conditions between the studies. Importantly, the overall transcriptomic profile of aged Pttg1–/– mice shifted toward the profiles of A/J and DBA/2J (Figure 5), indicating that Pttg1 might indeed exhibit genetic control over gene expression in the midbrain, although additional genetic factors are likely altered to contribute to these changes already in young mice.
It has been previously reported that Pttg1 is involved in many biological functions such as regulation of sister chromatid separation, DNA repair or senescence processes (Zou et al., 1999; Bernal et al., 2008; Hsu et al., 2010). Interestingly, a deconvolution analysis of the gene expression changes using single cell RNA-seq analysis indicated that the loss of Pttg1 influenced gene expression across multiple cell types. However, these changes become observable only during aging. Unlike human brain, mouse brain volume has been shown to increase still during adulthood between 6 and 14 months of age (Maheswaran et al., 2009). Given the abovementioned role of Pttg1 in regulation of neocortex volume and its effect of gene expression in multiple cell types during aging, it is tempting to speculate that Pttg1 would contribute also to control of midbrain volume. Interestingly, a greater brain volume has been reported for C57BL/6J than A/J (Williams, 2000; Wahlsten et al., 2006).
Conclusion
Rather than being entirely explained by the TF expression levels due to cis-variation at the Pttg1 locus, complex traits like midbrain gene expression could be due to cumulative cis- and trans-regulatory variants across TF binding sites controlling the DEGs. In the future, mapping QTLs associated with the DAn’s traits across mouse strains, together with the transcriptomic and epigenomic data generated as part of this work, will enable the identification of further regulatory variants and their impact on midbrain expression phenotype and function of the nigrostriatal circuitry. While linking complex traits such as behavior and motor function to specific gene expression changes will require further studies, our work highlights the role of Pttg1 as regulator of mouse midbrain gene expression phenotype and paves way for further identification of additional genetic regulators.
Data Availability Statement
The datasets presented in this study can be found in online repositories. The names of the repository/repositories and accession number(s) can be found below: https://www.ebi.ac.uk/arrayexpress/, E-MTAB-8333.
Ethics Statement
The animal study was reviewed and approved by the Animal Experimentation Ethics Committee (AEEC) for mice bred at University of Luxembourg. For the mice bred in Helmholtz Centre for Infection Research (Braunschweig, Germany), the protocol was reviewed and approved by the “Niedersächsisches Landesamt für Verbraucherschutz und Lebensmittelsicherheit, Oldenburg, Germany” (Permit Number: 33.9-42502-05-11A193).
Author Contributions
MB and LS conceived the project with input from AM, KS, RB, JN, and RW. YG, MT, MK, MB, and LS designed the experiments and analysis. YG performed all RNA-seq and ChIP-seq experiments and bioinformatic analysis. MT, YG, MK, PG, and MB prepared mouse tissues. YG, MK, and MT performed PCR experiments. HK and KS supported mouse breeding and bioinformatic analysis together with RW. CZ and SM provided Pttg1 transgenic mice. RH prepared the libraries and performed the sequencing. YG, MT, MK, MM, TS, MB, and LS analyzed the results. YG, MT, MB, and LS wrote the manuscript. All authors read and approved the final manuscript.
Funding
LS and MB would like to thank the Luxembourg National Research Fund (FNR) for the support (FNR CORE C15/BM/10406131 grant). MM would like to thank the Luxembourg National Research Fund (FNR) for the support (FNR PEARL P16/BM/11192868 grant). KS would like to thank the support by intra-mural grants from the Helmholtz-Association (Program Infection and Immunity).
Conflict of Interest
The authors declare that the research was conducted in the absence of any commercial or financial relationships that could be construed as a potential conflict of interest.
Acknowledgments
We would like to thank Drs. Aurélien Ginolhac and Anthoula Gaigneaux for their support with bioinformatic analysis EMBL Gene Core at Heidelberg for support with high-throughput sequencing, and Dr. Djalil Coowar (Animal Facility of University of Luxembourg) for help with breeding of experimental mice. KS would like to thank the animal caretakers at the Central Animal Facilities of the HZI for maintaining the mice. The computational analysis presented in this manuscript were carried out using the HPC facilities of the University of Luxembourg.
Supplementary Material
The Supplementary Material for this article can be found online at: https://www.frontiersin.org/articles/10.3389/fgene.2020.566734/full#supplementary-material
Abbreviations
DAns, dopaminergic neurons; DEGs, differentially expressed genes; EDTA, ethylenediamine tetraacetic acid; H3K4me3, histone H3 lysine 4 trimethylation; LCSB, Luxembourg Centre for Systems Biomedicine; log2FC, log2-fold change; NP-40, 4-Nonylphenyl-polyethylene glycol; PC, principle component; PCA, principle component analysis; PD, Parkinson’s disease; PI, Proteinase Inhibitor; Pttg1, Pituitary Tumor Transforming Gene 1; RPKM, Reads Per Kilobase Million; SDS, sodium odecylsulfate; SN:substantia nigra; TFs, transcription factors; TSS, transcription start site; VTA, ventral tegmental area.
Footnotes
References
Adams, M. D., Celniker, S. E., Holt, R. A., Evans, C. A., Gocayne, J. D., Amanatides, P. G., et al. (2000). The genome sequence of Drosophila melanogaster. Science 287, 2185–2195. doi: 10.1126/science.287.5461.2185
Allhoff, M., Seré, K., Pires, J. F., Zenke, M., and Costa, I. G. (2016). Differential peak calling of ChIP-seq signals with replicates with THOR. Nucleic Acids Res. 44:e153.
Andrews, S. (2010). FastQC: A Quality Control Tool for High Throughput Sequence Data. Available online at: https://www.bioinformatics.babraham.ac.uk/projects/fastqc/
Auton, A., Brooks, L. D., Durbin, R. M., Garrison, E. P., Kang, H. M., Korbel, J. O., et al. (2015). A global reference for human genetic variation. Nature 526, 68–74. doi: 10.1038/nature15393
Avramopoulos, D. (2018). Recent advances in the genetics of schizophrenia. Mol. Neuropsychiat. 4, 35–51. doi: 10.1159/000488679
Barski, A., Cuddapah, S., Cui, K., Roh, T.-Y., Schones, D. E., Wang, Z., et al. (2007). High-resolution profiling of histone methylations in the human genome. Cell 129, 823–837. doi: 10.1016/j.cell.2007.05.009
Bernal, J. A., Roche, M., Méndez-Vidal, C., Espina, A., Tortolero, M., and Pintor-Toro, J. A. (2008). Proliferative potential after DNA damage and non-homologous end joining are affected by loss of securin. Cell Death. Differ. 15, 202–212. doi: 10.1038/sj.cdd.4402254
Bottomly, D., Walter, N. A. R., Hunter, J. E., Darakjian, P., Kawane, S., Buck, K. J., et al. (2011). Evaluating gene expression in C57BL/6J and DBA/2J mouse striatum using RNA-Seq and microarrays. PLoS One 6:e17820. doi: 10.1371/journal.pone.0017820
Cabib, S., Puglisi-Allegra, S., and Ventura, R. (2002). The contribution of comparative studies in inbred strains of mice to the understanding of the hyperactive phenotype. Behav. Brain Res. 130, 103–109. doi: 10.1016/s0166-4328(01)00422-3
de Jong, S., Fuller, T. F., Janson, E., Strengman, E., Horvath, S., Kas, M. J. H., et al. (2010). Gene expression profiling in C57BL/6J and A/J mouse inbred strains reveals gene networks specific for brain regions independent of genetic background. BMC Genomics 11:20. doi: 10.1186/1471-2202-10-20
Dobin, A., Davis, C. A., Schlesinger, F., Drenkow, J., Zaleski, C., Jha, S., et al. (2013). STAR: ultrafast universal RNA-seq aligner. Bioinformatics 29, 15–21. doi: 10.1093/bioinformatics/bts635
Eisener-Dorman, A. F., Grabowski-Boase, L., and Tarantino, L. M. (2011). Cocaine locomotor activation, sensitization and place preference in six inbred strains of mice. Behav. Brain Funct. 7:29. doi: 10.1186/1744-9081-7-29
Gaglani, S. M., Lu, L., Williams, R. W., and Rosen, G. D. (2009). The genetic control of neocortex volume and covariation with neocortical gene expression in mice. BMC Neurosci. 10:44. doi: 10.1186/1471-2202-10-44
Gao, H.-M., and Hong, J.-S. (2011). Gene-environment interactions: key to unraveling the mystery of Parkinson’s disease. Prog. Neurobiol. 94, 1–19. doi: 10.1016/j.pneurobio.2011.03.005
Guenther, M. G., Levine, S. S., Boyer, L. A., Jaenisch, R., and Young, R. A. (2007). A chromatin landmark and transcription initiation at most promoters in human cells. Cell 130, 77–88. doi: 10.1016/j.cell.2007.05.042
Hamre, K., Tharp, R., Poon, K., Xiong, X., and Smeyne, R. J. (1999). Differential strain susceptibility following 1-methyl-4-phenyl-1,2,3,6-tetrahydropyridine (MPTP) administration acts in an autosomal dominant fashion: quantitative analysis in seven strains of Mus musculus. Brain Res. 828, 91–103. doi: 10.1016/s0006-8993(99)01273-1
Heinäniemi, M., Nykter, M., Kramer, R., Wienecke-Baldacchino, A., Sinkkonen, L., Zhou, J. X., et al. (2013). Gene-pair expression signatures reveal lineage control. Nat. Methods 10, 577–583. doi: 10.1038/nmeth.2445
Hodge, R. D., Bakken, T. E., Miller, J. A., Smith, K. A., Barkan, E. R., Graybuck, L. T., et al. (2019). Conserved cell types with divergent features in human versus mouse cortex. Nature 573, 61–68.
Hsu, Y.-H., Liao, L.-J., Yu, C.-H., Chiang, C.-P., Jhan, J.-R., Chang, L.-C., et al. (2010). Overexpression of the pituitary tumor transforming gene induces p53-dependent senescence through activating DNA damage response pathway in normal human fibroblasts. J. Biol. Chem. 285, 22630–22638. doi: 10.1074/jbc.m109.096255
Ingram, D. K., London, E. D., Reynolds, M. A., Waller, S. B., and Goodrick, C. L. (1981). Differential effects of age on motor performance in two mouse strains. Neurobiol. Aging 2, 221–227. doi: 10.1016/0197-4580(81)90025-7
Ishibashi, M., Ang, S. L., Shiota, K., Nakanishi, S., Kageyama, R., and Guillemot, F. (1995). Targeted disruption of mammalian hairy and Enhancer of split homolog-1 (HES-1) leads to up-regulation of neural helix-loop-helix factors, premature neurogenesis, and severe neural tube defects. Genes Dev. 9, 3136–3148. doi: 10.1101/gad.9.24.3136
Ishibashi, M., Moriyoshi, K., Sasai, Y., Shiota, K., Nakanishi, S., and Kageyama, R. (1994). Persistent expression of helix-loop-helix factor HES-1 prevents mammalian neural differentiation in the central nervous system. EMBO J. 13, 1799–1805. doi: 10.1002/j.1460-2075.1994.tb06448.x
Karunakaran, S., Diwakar, L., Saeed, U., Agarwal, V., Ramakrishnan, S., Iyengar, S., et al. (2007). Activation of apoptosis signal regulating kinase 1 (ASK1) and translocation of death-associated protein, Daxx, in substantia nigra pars compacta in a mouse model of Parkinson’s disease: protection by alpha-lipoic acid. FASEB J. 21, 2226–2236. doi: 10.1096/fj.06-7580com
Keeley, P. W., Zhou, C., Lu, L., Williams, R. W., Melmed, S., and Reese, B. E. (2014). Pituitary tumor-transforming gene 1 regulates the patterning of retinal mosaics. Proc. Natl. Acad. Sci. U.S.A. 111, 9295–9300. doi: 10.1073/pnas.1323543111
Kopylova, E., Noé, L., and Touzet, H. (2012). SortMeRNA: fast and accurate filtering of ribosomal RNAs in metatranscriptomic data. Bioinformatics 28, 3211–3217. doi: 10.1093/bioinformatics/bts611
Li, H., and Durbin, R. (2009). Fast and accurate short read alignment with Burrows-Wheeler transform. Bioinformatics 25, 1754–1760. doi: 10.1093/bioinformatics/btp324
Liao, Y., Smyth, G. K., and Shi, W. (2014). featureCounts: an efficient general purpose program for assigning sequence reads to genomic features. Bioinformatics 30, 923–930. doi: 10.1093/bioinformatics/btt656
Lin, H.-Y., Liu, Q., Li, X., Yang, J., Liu, S., Huang, Y., et al. (2017). Substantial contribution of genetic variation in the expression of transcription factors to phenotypic variation revealed by eRD-GWAS. Genome Biol. 18:192.
Lindgreen, S. (2012). AdapterRemoval: easy cleaning of next generation sequencing reads. BMC Res. Notes 5:337. doi: 10.1186/1471-2202-10-337
Link, V. M., Duttke, S. H., Chun, H. B., Holtman, I. R., Westin, E., Hoeksema, M. A., et al. (2018). Analysis of genetically diverse macrophages reveals local and domain-wide mechanisms that control transcription factor binding and function. Cell 173, 1796–1809.e17.
Liu, X., Li, Y. I., and Pritchard, J. K. (2019). Trans Effects on gene expression can drive omnigenic inheritance. Cell 177, 1022–1034.e6.
Love, M. I., Huber, W., and Anders, S. (2014). Moderated estimation of fold change and dispersion for RNA-seq data with DESeq2. Genome Biol. 15:550.
Lum, P. Y., Chen, Y., Zhu, J., Lamb, J., Melmed, S., Wang, S., et al. (2006). Elucidating the murine brain transcriptional network in a segregating mouse population to identify core functional modules for obesity and diabetes. J. Neurochem. 97 (Suppl. 1), 50–62. doi: 10.1111/j.1471-4159.2006.03661.x
Maheswaran, S., Barjat, H., Rueckert, D., Bate, S. T., Howlett, D. R., Tilling, L., et al. (2009). Longitudinal regional brain volume changes quantified in normal aging and Alzheimer’s APP x PS1 mice using MRI. Brain Res. 1270, 19–32. doi: 10.1016/j.brainres.2009.02.045
Maurano, M. T., Humbert, R., Rynes, E., Thurman, R. E., Haugen, E., Wang, H., et al. (2012). Systematic localization of common disease-associated variation in regulatory DNA. Science 337, 1190–1195. doi: 10.1126/science.1222794
Michaelson, J. J., Shin, M.-K., Koh, J.-Y., Brueggeman, L., Zhang, A., Katzman, A., et al. (2017). Neuronal PAS domain proteins 1 and 3 are master regulators of neuropsychiatric risk genes. Biol. Psychiatry 82, 213–223. doi: 10.1016/j.biopsych.2017.03.021
Mostafavi, S., Ortiz-Lopez, A., Bogue, M. A., Hattori, K., Pop, C., Koller, D., et al. (2014). Variation and genetic control of gene expression in primary immunocytes across inbred mouse strains. J. Immunol. 193, 4485–4496. doi: 10.4049/jimmunol.1401280
Newman, A. M., Steen, C. B., Liu, C. L., Gentles, A. J., Chaudhuri, A. A., Scherer, F., et al. (2019). Determining cell type abundance and expression from bulk tissues with digital cytometry. Nat. Biotechnol. 37, 773–782. doi: 10.1038/s41587-019-0114-2
Pearson-Fuhrhop, K. M., Minton, B., Acevedo, D., Shahbaba, B., and Cramer, S. C. (2013). Genetic variation in the human brain dopamine system influences motor learning and its modulation by L-Dopa. PLoS One 8:e61197. doi: 10.1371/journal.pone.061197
Pei, L., and Melmed, S. (1997). Isolation and characterization of a pituitary tumor-transforming gene (PTTG). Mol. Endocrinol. 11, 433–441. doi: 10.1210/mend.11.4.9911
Santos-Rosa, H., Schneider, R., Bannister, A. J., Sherriff, J., Bernstein, B. E., Emre, N. C. T., et al. (2002). Active genes are tri-methylated at K4 of histone H3. Nature 419, 407–411. doi: 10.1038/nature01080
Saunders, A., Macosko, E. Z., Wysoker, A., Goldman, M., Krienen, F. M., de Rivera, H., et al. (2018). Molecular diversity and specializations among the cells of the adult mouse brain. Cell 174, 1015–1030.e16.
Schubert, M., Ermini, L., Sarkissian, C. D., Jónsson, H., Ginolhac, A., Schaefer, R., et al. (2014). Characterization of ancient and modern genomes by SNP detection and phylogenomic and metagenomic analysis using PALEOMIX. Nat. Protoc. 9, 1056–1082. doi: 10.1038/nprot.2014.063
Vlotides, G., Eigler, T., and Melmed, S. (2007). Pituitary tumor-transforming gene: physiology and implications for tumorigenesis. Endocr. Rev. 28, 165–186. doi: 10.1210/er.2006-0042
Vogt Weisenhorn, D. M., Giesert, F., and Wurst, W. (2016). Diversity matters - heterogeneity of dopaminergic neurons in the ventral mesencephalon and its relation to Parkinson’s disease. J. Neurochem. 139, (Suppl. 1), 8–26. doi: 10.1111/jnc.13670
Wahlsten, D., Bachmanov, A., Finn, D. A., and Crabbe, J. C. (2006). Stability of inbred mouse strain differences in behavior and brain size between laboratories and across decades. Proc. Natl. Acad. Sci. U.S.A. 103, 16364–16369. doi: 10.1073/pnas.0605342103
Wang, J., Geisert, E. E., and Struebing, F. L. (2019). RNA sequencing profiling of the retina in C57BL/6J and DBA/2J mice: Enhancing the retinal microarray data sets from GeneNetwork. Mol. Vis. 25, 345–358.
Wang, Z., Moro, E., Kovacs, K., Yu, R., and Melmed, S. (2003). Pituitary tumor transforming gene-null male mice exhibit impaired pancreatic beta cell proliferation and diabetes. Proc. Natl. Acad. Sci. U.S.A. 100, 3428–3432. doi: 10.1073/pnas.0638052100
Wilk, E., Pandey, A. K., Leist, S. R., Hatesuer, B., Preusse, M., Pommerenke, C., et al. (2015). RNAseq expression analysis of resistant and susceptible mice after influenza A virus infection identifies novel genes associated with virus replication and important for host resistance to infection. BMC Genomics 16:655. doi: 10.1186/1471-2202-10-655
Williams, R. W. (2000). Mapping genes that modulate mouse brain development: a quantitative genetic approach. Results Probl. Cell Differ. 30, 21–49. doi: 10.1007/978-3-540-48002-0_2
Yoshimoto, K., and Komura, S. (1987). Reexamination of the relationship between alcohol preference and brain monoamines in inbred strains of mice including senescence-accelerated mice. Pharmacol. Biochem. Behav. 27, 317–322. doi: 10.1016/0091-3057(87)90575-2
Zhang, Y., Liu, T., Meyer, C. A., Eeckhoute, J., Johnson, D. S., Bernstein, B. E., et al. (2008). Model-based analysis of ChIP-Seq (MACS). Genome Biol. 9:R137.
Ziółkowska, B., Korostyński, M., Piechota, M., Kubik, J., and Przewłocki, R. (2012). Effects of morphine on immediate-early gene expression in the striatum of C57BL/6J and DBA/2J mice. Pharmacol. Rep. 64, 1091–1104. doi: 10.1016/s1734-1140(12)70906-4
Keywords: Pttg1, mouse strains, regulatory variation, midbrain, aging
Citation: Gui Y, Thomas MH, Garcia P, Karout M, Halder R, Michelucci A, Kollmus H, Zhou C, Melmed S, Schughart K, Balling R, Mittelbronn M, Nadeau JH, Williams RW, Sauter T, Buttini M and Sinkkonen L (2020) Pituitary Tumor Transforming Gene 1 Orchestrates Gene Regulatory Variation in Mouse Ventral Midbrain During Aging. Front. Genet. 11:566734. doi: 10.3389/fgene.2020.566734
Received: 28 May 2020; Accepted: 27 August 2020;
Published: 23 September 2020.
Edited by:
Iiris Hovatta, University of Helsinki, FinlandReviewed by:
Camron D. Bryant, Boston University, United StatesHelen Kamens, Pennsylvania State University (PSU), United States
Copyright © 2020 Gui, Thomas, Garcia, Karout, Halder, Michelucci, Kollmus, Zhou, Melmed, Schughart, Balling, Mittelbronn, Nadeau, Williams, Sauter, Buttini and Sinkkonen. This is an open-access article distributed under the terms of the Creative Commons Attribution License (CC BY). The use, distribution or reproduction in other forums is permitted, provided the original author(s) and the copyright owner(s) are credited and that the original publication in this journal is cited, in accordance with accepted academic practice. No use, distribution or reproduction is permitted which does not comply with these terms.
*Correspondence: Manuel Buttini, bWFudWVsLmJ1dHRpbmlAdW5pLmx1; Lasse Sinkkonen, bGFzc2Uuc2lua2tvbmVuQHVuaS5sdQ==
†These authors have contributed equally to this work