 Alessandra Zito1,2
 Marta Lualdi1
 Paola Granata2
 Dario Cocciadiferro3
 Antonio Novelli3
 Tiziana Alberio1
 Rosario Casalone2
 Mauro Fasano1*
- 1Department of Science and High Technology, Center of Bioinformatics, University of Insubria, Busto Arsizio, Italy
- 2Unit of Cytogenetics and Medical Genetics, ASST dei Sette Laghi, Varese, Italy
- 3Laboratory of Medical Genetics, Ospedale Pediatrico Bambino Gesù, Rome, Italy
Gene set enrichment analysis (GSEA) is a powerful tool to associate a disease phenotype to a group of genes/proteins. GSEA attributes a specific weight to each gene/protein in the input list that depends on a metric of choice, which is usually represented by quantitative expression data. However, expression data are not always available. Here, GSEA based on betweenness centrality of a protein–protein interaction (PPI) network is described and applied to two cases, where an expression metric is missing. First, personalized PPI networks were generated from genes displaying alterations (assessed by array comparative genomic hybridization and whole exome sequencing) in four probands bearing a 16p13.11 microdeletion in common and several other point variants. Patients showed disease phenotypes linked to neurodevelopment. All networks were assembled around a cluster of first interactors of altered genes with high betweenness centrality. All four clusters included genes known to be involved in neurodevelopmental disorders with different centrality. Moreover, the GSEA results pointed out to the evidence of “cell cycle” among enriched pathways. Second, a large interaction network obtained by merging proteomics studies on three neurodegenerative disorders was analyzed from the topological point of view. We observed that most central proteins are often linked to Parkinson’s disease. The selection of these proteins improved the specificity of GSEA, with “Metabolism of amino acids and derivatives” and “Cellular response to stress or external stimuli” as top-ranked enriched pathways. In conclusion, betweenness centrality revealed to be a suitable metric for GSEA. Thus, centrality-based GSEA represents an opportunity for precision medicine and network medicine.
Introduction
High-throughput data consist in a wide amount of information obtained as the output of last-generation technologies. Nowadays, data from omics approaches are obtained to systematically explore human biology at a cellular or molecular level. This leads to a significant advantage in the study of a biological system in its complexity (Tebani et al., 2016). On the other hand, an analytical method capable of reading, prioritizing, and interpreting such large set of information is needed. The integration of the medical/biological language and the mathematical/computational language in a cross-disciplinary approach represents a challenge (Barabási, 2007). For this reason, new theories and new algorithms have now been generated, and a strong support of bioinformatics tools becomes necessary (Al-Haggar et al., 2013).
Gene set enrichment analysis (GSEA) is a powerful tool for the interpretation of high-throughput expression studies such as mass spectrometry-based proteomics or Next-Generation Sequencing, in order to identify insights into biological processes or pathways underlying a given phenotype. Thanks to the acquisition of an expression profile, the list of differentially expressed genes is ranked in terms of a metric associated to the observed expression change. The ranked gene list is compared to a gene set, i.e., a list of genes known to be associated with a certain biological process, gene ontology (GO), molecular function or pathway. The metric is needed to calculate the enrichment score (ES) that indicates the degree by which a gene set is overrepresented at the extremes of the ranked list (Subramanian et al., 2005).
In the Big Data era, meaningful models and impactful results may only be achieved at the network complexity level. In particular, genomics and quantitative approaches to network-based analysis are combined to advance the frontiers of network medicine (Sonawane et al., 2019). Indeed, the multifactorial approach of network medicine is based on the multiplicity of factors that can alter a system to identify functional connections that link the clinical phenotype to multiple factors (Piñero et al., 2016).
Usually, protein networks are built starting from a list of query proteins and by retrieving the protein–protein interaction (PPI) information from a suitable database. The resulting network may be further enriched by looking for first interactors that might join isolated or distant nodes. The rationale of this approach is that proteins that were identified as phenotype-correlated by chance are likely excluded from the network, whereas proteins that for several reasons were not detected as phenotype-correlated are now reconnected to the network (Fasano et al., 2016). A standard functional analysis of the resulting network usually consists in an over-representation analysis based on the Fisher’s exact test or a GSEA (Monti et al., 2019).
The Graph Theory provides tools to analyze the connectivity structure and the topology of a network. Node centrality and edge betweenness are among the most useful parameters to identify hotspots in a network. The importance of a node is the extent of its involvement in a network, and this can be measured in multiple ways. Common measures include degree, closeness, betweenness and eigenvector centralities (Ashtiani et al., 2018). The latter is at the core of the PageRank and the hypertext-induced topics search (HITS) algorithms for ranking networks (Kleinberg, 1999). The betweenness centrality of a given node takes into account the number of geodesics, or shortest paths, between any couple of nodes that include the considered node over the total number of geodesics that connect any couple of nodes of the graph. When nodes are in distinct components, the geodesic pathway is not defined. Otherwise, the betweenness centrality ranges from 0 to 1. On the other hand, the closeness centrality is inversely proportional to the sum of the shortest paths between the given node and any other node in the network.
Several algorithms have been proposed to combine pathway enrichment analysis with network topological information and their performance has been recently reviewed (Ma et al., 2019). Some of them take into account interconnectivity or adjacency information, whereas other consider centrality measures such as degree or betweenness centrality. Nevertheless, all topology-based pathway enrichment analysis methods require an expression metric that indicate whether a gene is differentially expressed in a group comparison.
Since whole genome sequencing (WGS) and whole exome sequencing (WES) are useful genomics tools to identify genes showing alterations (e.g., single nucleotide variants – SNVs, Indels, larger duplications or deletions), the results generated by these techniques can be used to generate personalized networks for each individual (Suwinski et al., 2019). More generally, altered genes can be considered as constituting the input list for generating a PPI network that reflects a disease network model in a single individual, thus allowing for the comparison between personalized networks of patients with the same phenotype and a distinct genetic background.
Here, we propose a GSEA approach to analyze PPI networks based on betweenness centrality values as ranking metrics. The proposed analysis was applied to two case paradigms. In the first case, the network was obtained from genomics data, where quantitative expression metrics are not available. In the second case, the network represents the result of a secondary data analysis, where proteomics data are scraped from the literature and quantitative information is not always available.
Materials and Methods
Definition of Gene Signatures From Genomics Analysis
The patients and their parents came from the cohort of medical genetics clinics of the ASST Sette Laghi showing clinical phenotypes related to neurodevelopmental disorders. A written informed consent to perform array-based comparative genomic hybridization (aCGH) and WES, and a consent for use of anonymous data for research were provided by the parents and relatives of the patients. The consent model and procedure were approved by the Institutional Review Board (ASST Sette Laghi Cod MOD09 IOS01SSDGM). Neurocognitive tests were based on WISC-IV (Wechsler Intelligence Scale for Children). Language skills were assessed with Boston and TROG-2 tests. No bias selection of gender, family history or age was performed. To identify submicroscopic chromosomal rearrangements, the aCGH technology was performed after DNA extraction from peripheral blood cells (QIAmp DNA blood Maxi Kit, Qiagen, Hilden, Germany). The four patients were selected on the basis of the presence of 16p13.11 microdeletion.
For exome results, genes involved in neurodevelopmental disorders and genes related to rare diseases were considered according to literature. Among these, genes with variants in hemizygosity, homozygosity, compound heterozygosity and simple heterozygosity inherited from the healthy non-carrier parent of the 16p13.11 deletion were selected.
Array-based comparative genomic hybridization was performed using CytoSure ISCA V2 4x180K platform with a backbone resolution of 1 probe/25 Kb and 1 probe/19 Kb in critical regions, human genome reference hg19/GRCh37 and sex matched normal human DNA pool (Kreatech, Amsterdam, Holland) as control. InnoScan 710 Microarray Scanner (Carbonne, France) and Mapix (Innopsys, Carbonne, France) were used to detect and analyze fluorescence levels. Results were interpreted using Cytosure Interpret Software (Oxford Gene Technology, Begbroke, Oxfordshire, United Kingdom).
Whole exome sequencing was performed on probands and parents DNA using the Twist Human Core Exome Kit (Twist Bioscience, San Francisco, CA, United States), according to the manufacturer’s protocol and sequenced on the Illumina NovaSeq 6000 platform. The BaseSpace pipeline (Illumina, San Diego, CA, United States) and the TGex software (LifeMap Sciences, Alameda, CA, United States) were used for the variant calling and annotation, respectively. Sequencing data were aligned to the hg19/GRCh37 human reference genome. Variants with a lower coverage than 10×, quality score (GQ) <15, and gnomAD minor allele frequency (MAF) >5% have been excluded.
Protein–Protein Interaction Networks From Genomics Analysis
Cytoscape 3.7.21 was used to generate networks (Su et al., 2014). The public database IMEx2 was queried through Cytoscape using the PSICQUIC standard (the Proteomics Standard Initiative Common QUery InterfaCe). Each list of altered genes, obtained by aCGH and WES as described above, was used to generate a network encompassing all first interactors of the gene products. The network was filtered for taxonomy ID 9606 (Homo sapiens) to remove homology inferences. A first interactors list was generated and used to query the IMEx database again, thus including second interactors too. All self loops and duplicated edges were removed. Node degrees were calculated using the NetworkAnalyzer plugin. Isolated (degree = 0) and terminal (degree = 1) nodes were removed to reduce the network size, with the only exception for isolated/terminal nodes included in the input list of altered genes.
Protein–Protein Interaction Network From Secondary Data Analysis
Proteins reported to be associated to Parkinson’s disease (PD), amyotrophic lateral sclerosis (ALS) and Alzheimer’s disease (AD) were extracted from a secondary data analysis by Monti et al. (2018). Using a pubmed scraping procedure, authors obtained lists of proteins reported to be quantitatively altered in the three neurodegenerative disorders considered and built a network that encompasses all selected proteins and their common interactors using PPI spider (Antonov et al., 2009). The network was then exported as a.xgmml file.
Topological Analysis in Cytoscape
Betweenness centrality was calculated for each node in networks by using the NetworkAnalyzer utility in the Cytoscape Environment. Both size and border width of all nodes were mapped onto their betweenness centrality values. The betweenness centrality of node ni is given by where N is the total number of nodes, σjk is the number of geodesics between nodes nj and nk, and σjk(ni) is the number of geodesic pathways containing node ni. Networks were reduced in size by selecting nodes having betweenness centrality ≥10–4 for display clarity only. For each network, betweenness centralities were transformed with a Hill function in order to enhance the weight of nodes with higher values, as follows hereafter: .
Gene Set Enrichment Analysis Using R
Gene set enrichment analysis was performed using the ReactomePA package (Yu and He, 2016) in the R environment for statistical analysis (R Core Team, 2017). Normalized enrichment score (NES), p-value, and false discovery rate (FDR) for all variables and signatures were obtained in the R environment. The database for biological processes/pathways Reactome was used for the analysis (Fabregat et al., 2017). Hill-transformed betweenness centralities were used as a suitable ranked list metric instead of those usually considered in expression studies. The list was then resampled by randomly assigning observed values to gene IDs and the analysis was performed again to identify pathways in common with those arising from the analysis of values that were obtained from the topological analysis of the networks. The R code is reported in the Supplementary Material.
Over-Representation Analysis
Over-representation analysis was performed for comparison using the WEB-based GEne SeT AnaLysis Toolkit3 (Liao et al., 2019) using Reactome as the functional database and “human genome, protein coding” as the reference set.
Results
Personalized Signatures From aCGH and WES Analysis
Four patients were referred to genetic investigations for diagnostic purposes and counseling for developmental disorders ranging from learning delay to intellectual disability, with or without associated congenital malformations. By aCGH screening, a microdeletion on 16p13.11 was identified. The deletion on 16p13.11 was either inherited from the healthy mother (two patients) or from the healthy father (one patient), or it was a de novo unbalance (one patient). Several mutations inherited from both healthy parents were found in the four patients by WES analysis. By merging aCGH and WES results, lists of altered genes were generated and used as personalized signatures for each patient (Table 1).
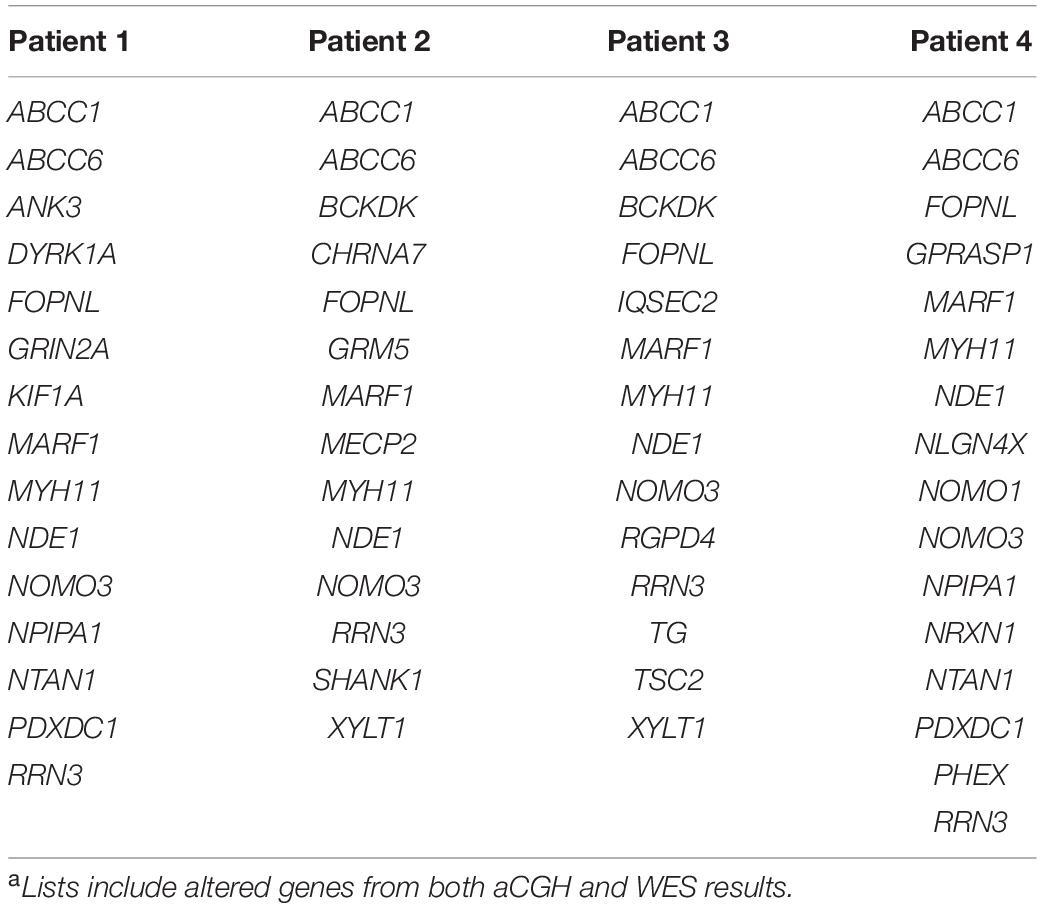
Table 1. Gene signatures for the four patients.a
The datasets presented in this study can be found in online repositories. The names of the repository/repositories and accession number(s) are listed hereafter. For aCGH data: DECIPHER4 350680 (Patient 1), 414066 (Patient 2), 414078 (Patient 3) and 318359 (Patient 4). For WES data: European Variation Archive Project: PRJEB41629, Analyses: ERZ1687005.
Genomics Networks Without Expression Metrics
The four lists of altered genes were used to generate personalized networks. Supplementary Figure 1 shows an overview of the four networks encompassing first and second interactors after filtering out isolated and terminal nodes (i.e., nodes with degree = 0 and degree = 1, respectively) and nodes with betweenness centrality ≤10–4, except for genes in the signature lists. Signature genes display different betweenness centrality values in the four personalized models with three orders of magnitude among different genes (Table 2). None of the interaction networks has nodes with high values. Genes MYH11 and NDE1 are present in all four networks with relatively high centralities, whereas ANK3, CHRNA7, DYRK1A, KIF1A, SHANK1, and TSC2, although they are present in single networks, also have high centrality. On the other hand, several signature genes have negligible centrality, although they are present in all four networks (e.g., ABCC1, ABCC6, FOPNL, MARF1, NOMO3, and RRN3).
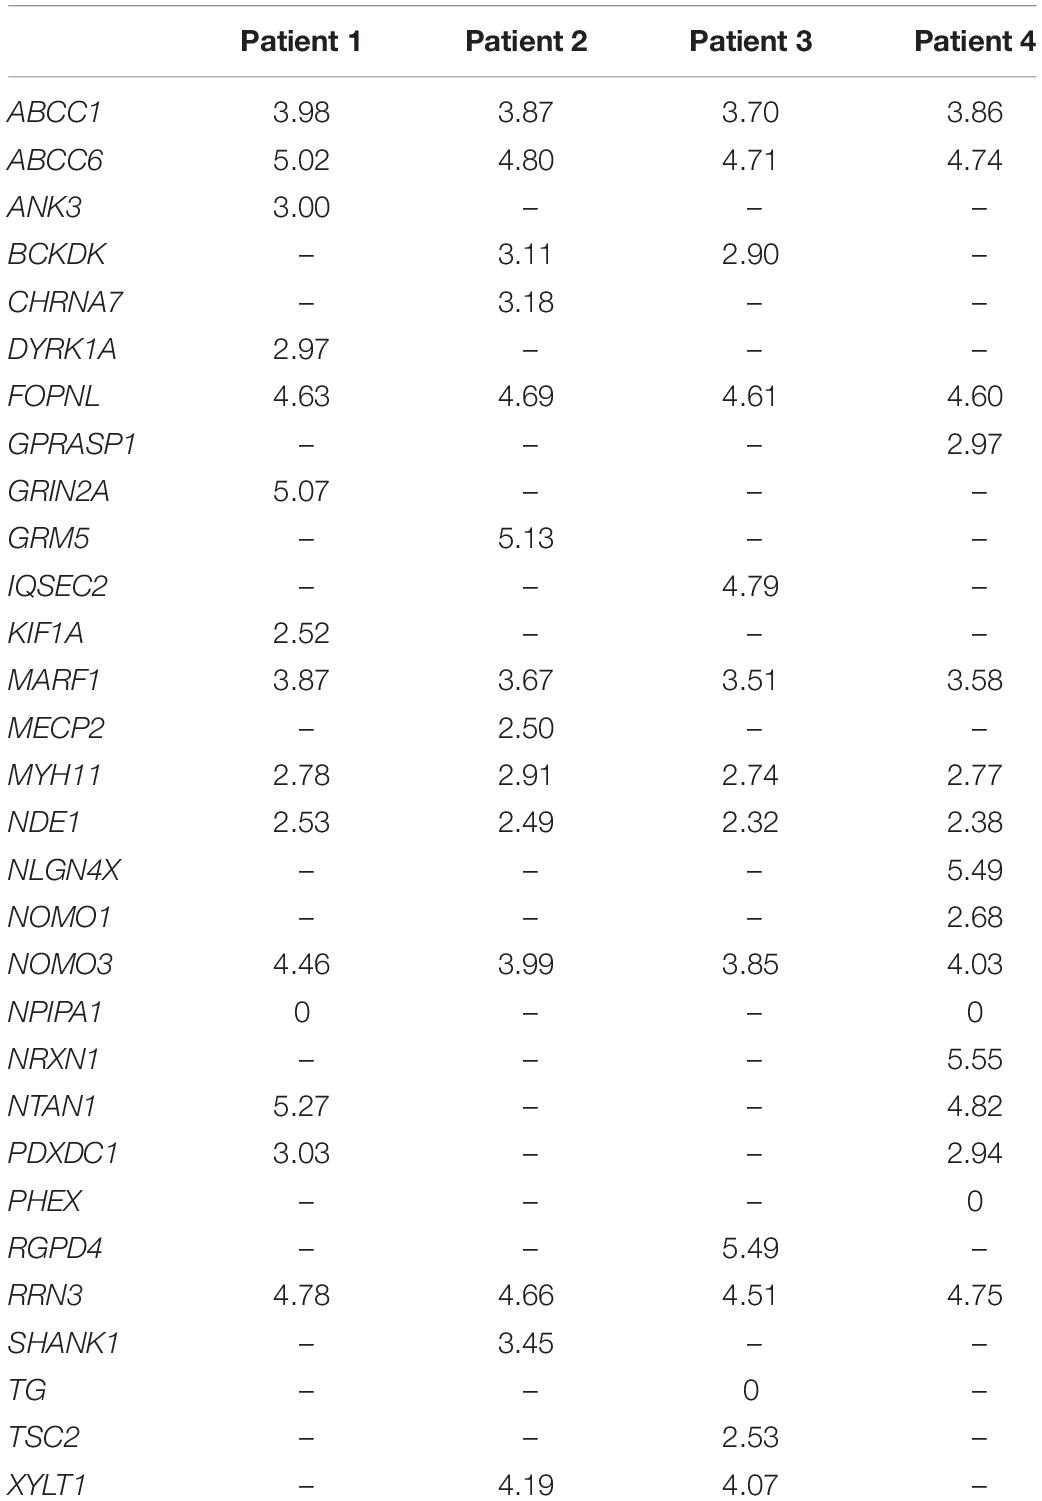
Table 2. Betweenness centrality values (−log10) of all signature genes.
Figure 1 shows the 10 most central nodes in each personalized network together with interacting signature genes. In all cases, top 10 nodes are among the first interactors of signature genes, with six out of 10 genes in common among patients (i.e., DISC1, ESR1, GOLGA2, GRB2, JUN, and HSCB). No signature genes displayed centrality values comparable to first interactors represented in Figure 1. An over-representation analysis of these clusters, including top 10 genes and interacting signature genes, did not lead to any significantly over-represented pathway.
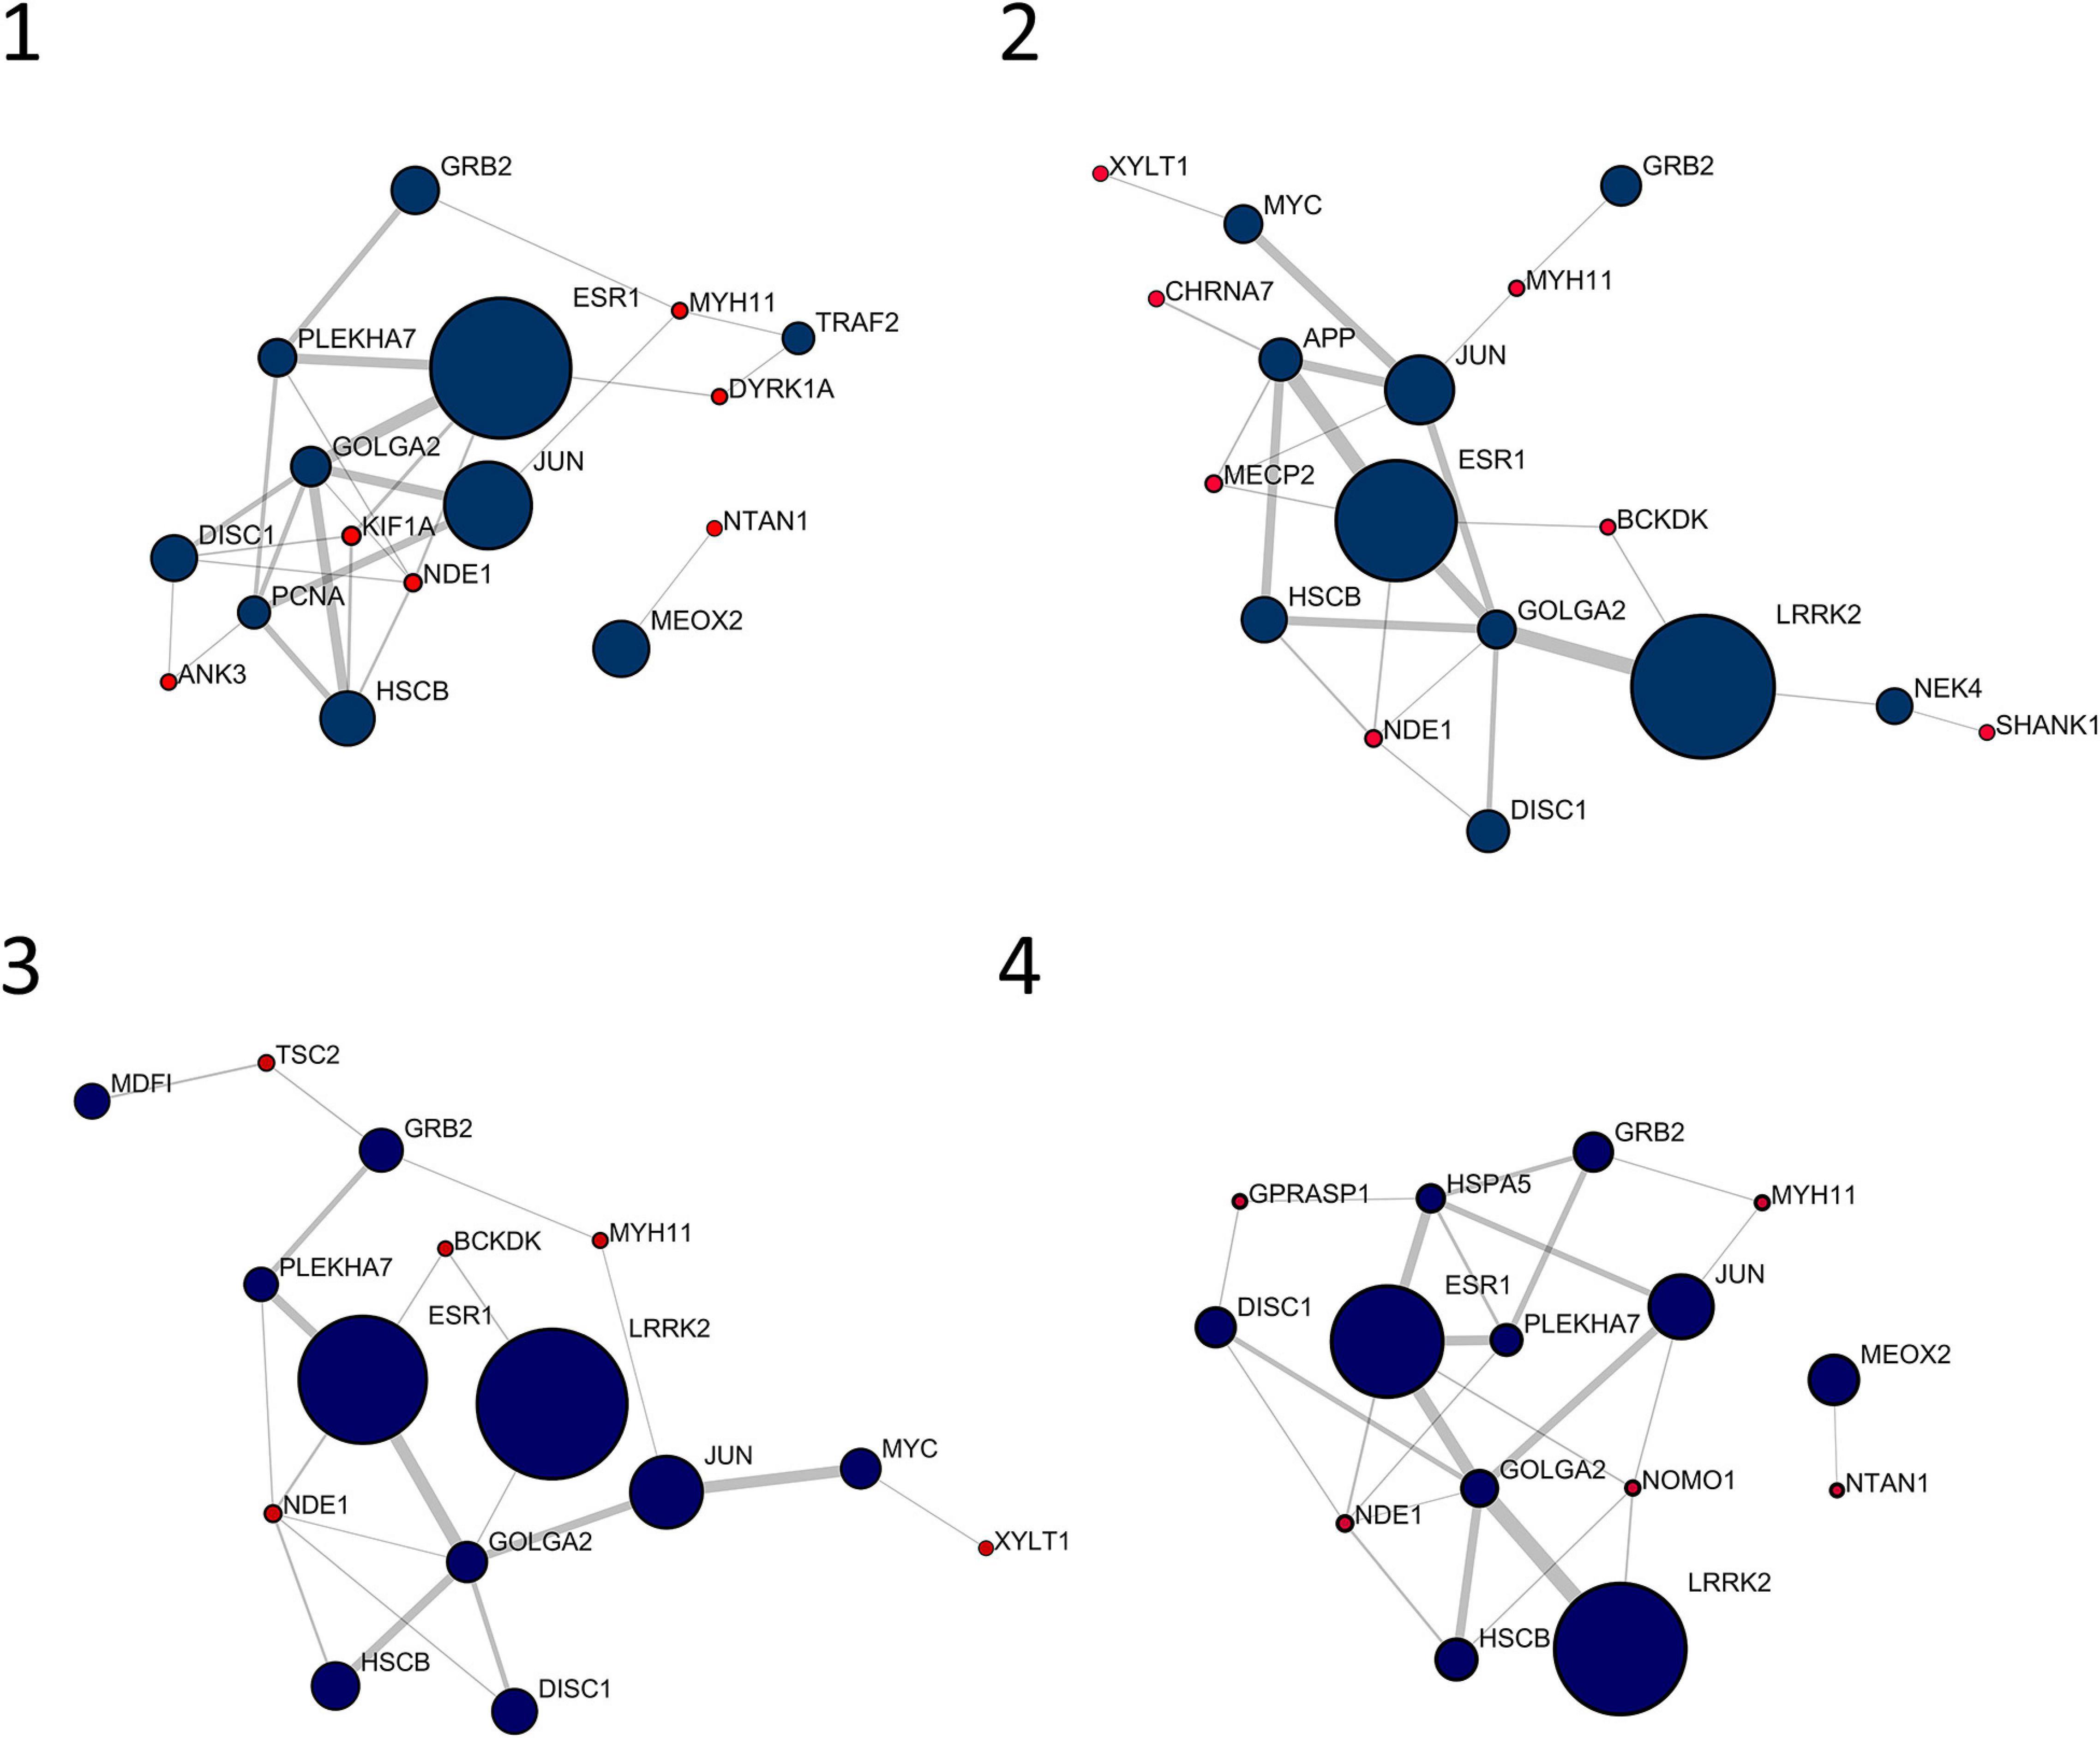
Figure 1. Top 10 nodes in terms of betweenness centrality and interacting signature nodes. Red nodes are genes from the individual gene signature and navy-blue nodes are their first interactors. Diameter and border width of nodes are proportional to betweenness centrality, whereas edge width is proportional to edge betweenness.
In order to enrich the functional analysis with nodes with higher centrality, original betweenness centrality values were transformed with a Hill function. Figure 2 shows ranked centrality values before and after the transformation. In this way, nodes with low centrality have a negligible contribution to the ES, whereas nodes with high centrality represent leading edges. As an example, patient 1 network had 8,101 nodes. Among them, 579 nodes had a score (i.e., betweenness centrality after Hill transformation) greater than 0.2, 318 greater than 0.5, and 192 greater than 0.8. Therefore, this transformation dramatically reduced the dimensionality of the dataset by selecting less than 10% of the original network genes. As a comparison, we performed the same transformation using closeness centrality. As shown in Supplementary Figure 2, closeness centrality values are distributed in a narrow range even after Hill transformation.
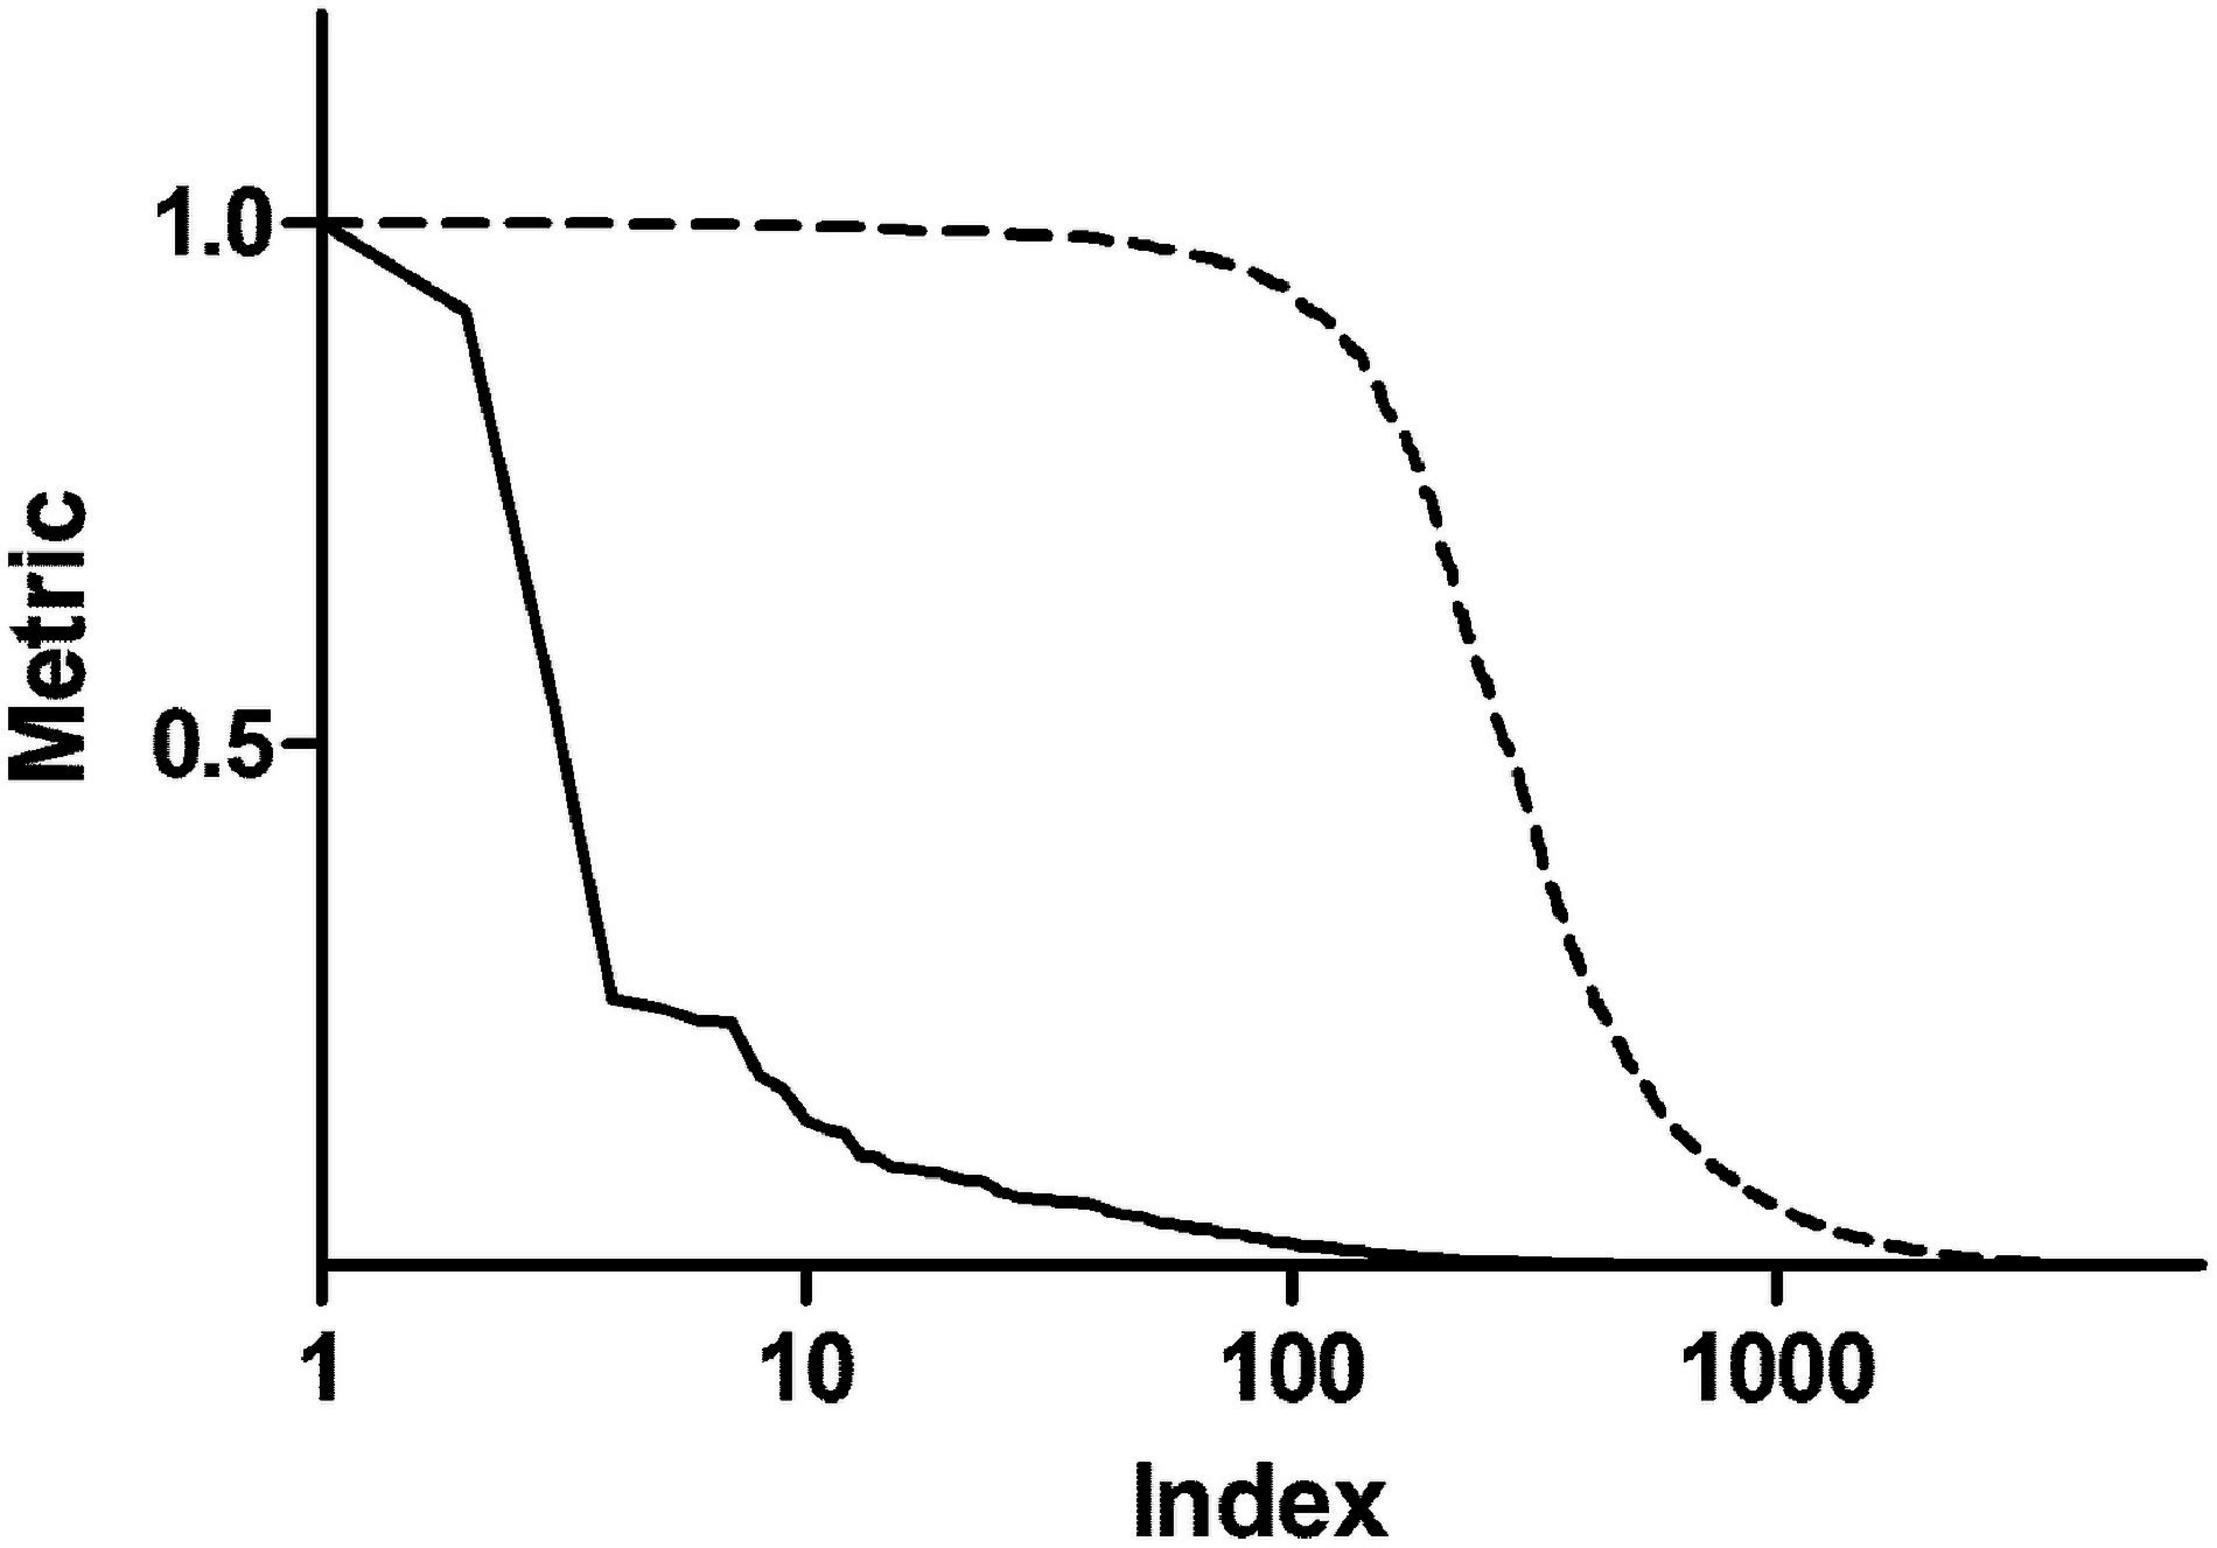
Figure 2. Centrality metrics before and after Hill transformation. The solid line shows betweenness centrality obtained from the topological analysis of a representative personalized network. The dashed line represents centrality values after transformation with a Hill function.
Gene set enrichment analysis was performed for the four networks using transformed betweenness centrality values as the scoring metric, with Reactome as gene set database. Figure 3 shows enriched categories as a dot plot, with dot size proportional to the number of overlapping genes. All patients displayed the enrichment of one or more pathways related to cell cycle and to Rho GTPases in a different ranking in terms of statistically significant gene ratio, i.e., the ratio between the number of genes related to each pathway and the total number of genes in the network. These pathways were not identified after resampling of scores obtained from betweenness centrality values (Supplementary Figure 3). Moreover, classic over-representation analysis of the whole network without ranking measures led to a different set of enriched pathways. Table 3 summarizes enriched pathways found by classic over-representation analysis of patient 1 network as a whole and by selecting subsets of nodes by their ranking (8,101, 579, 318, and 192 genes, respectively) (see Supplementary Materials).
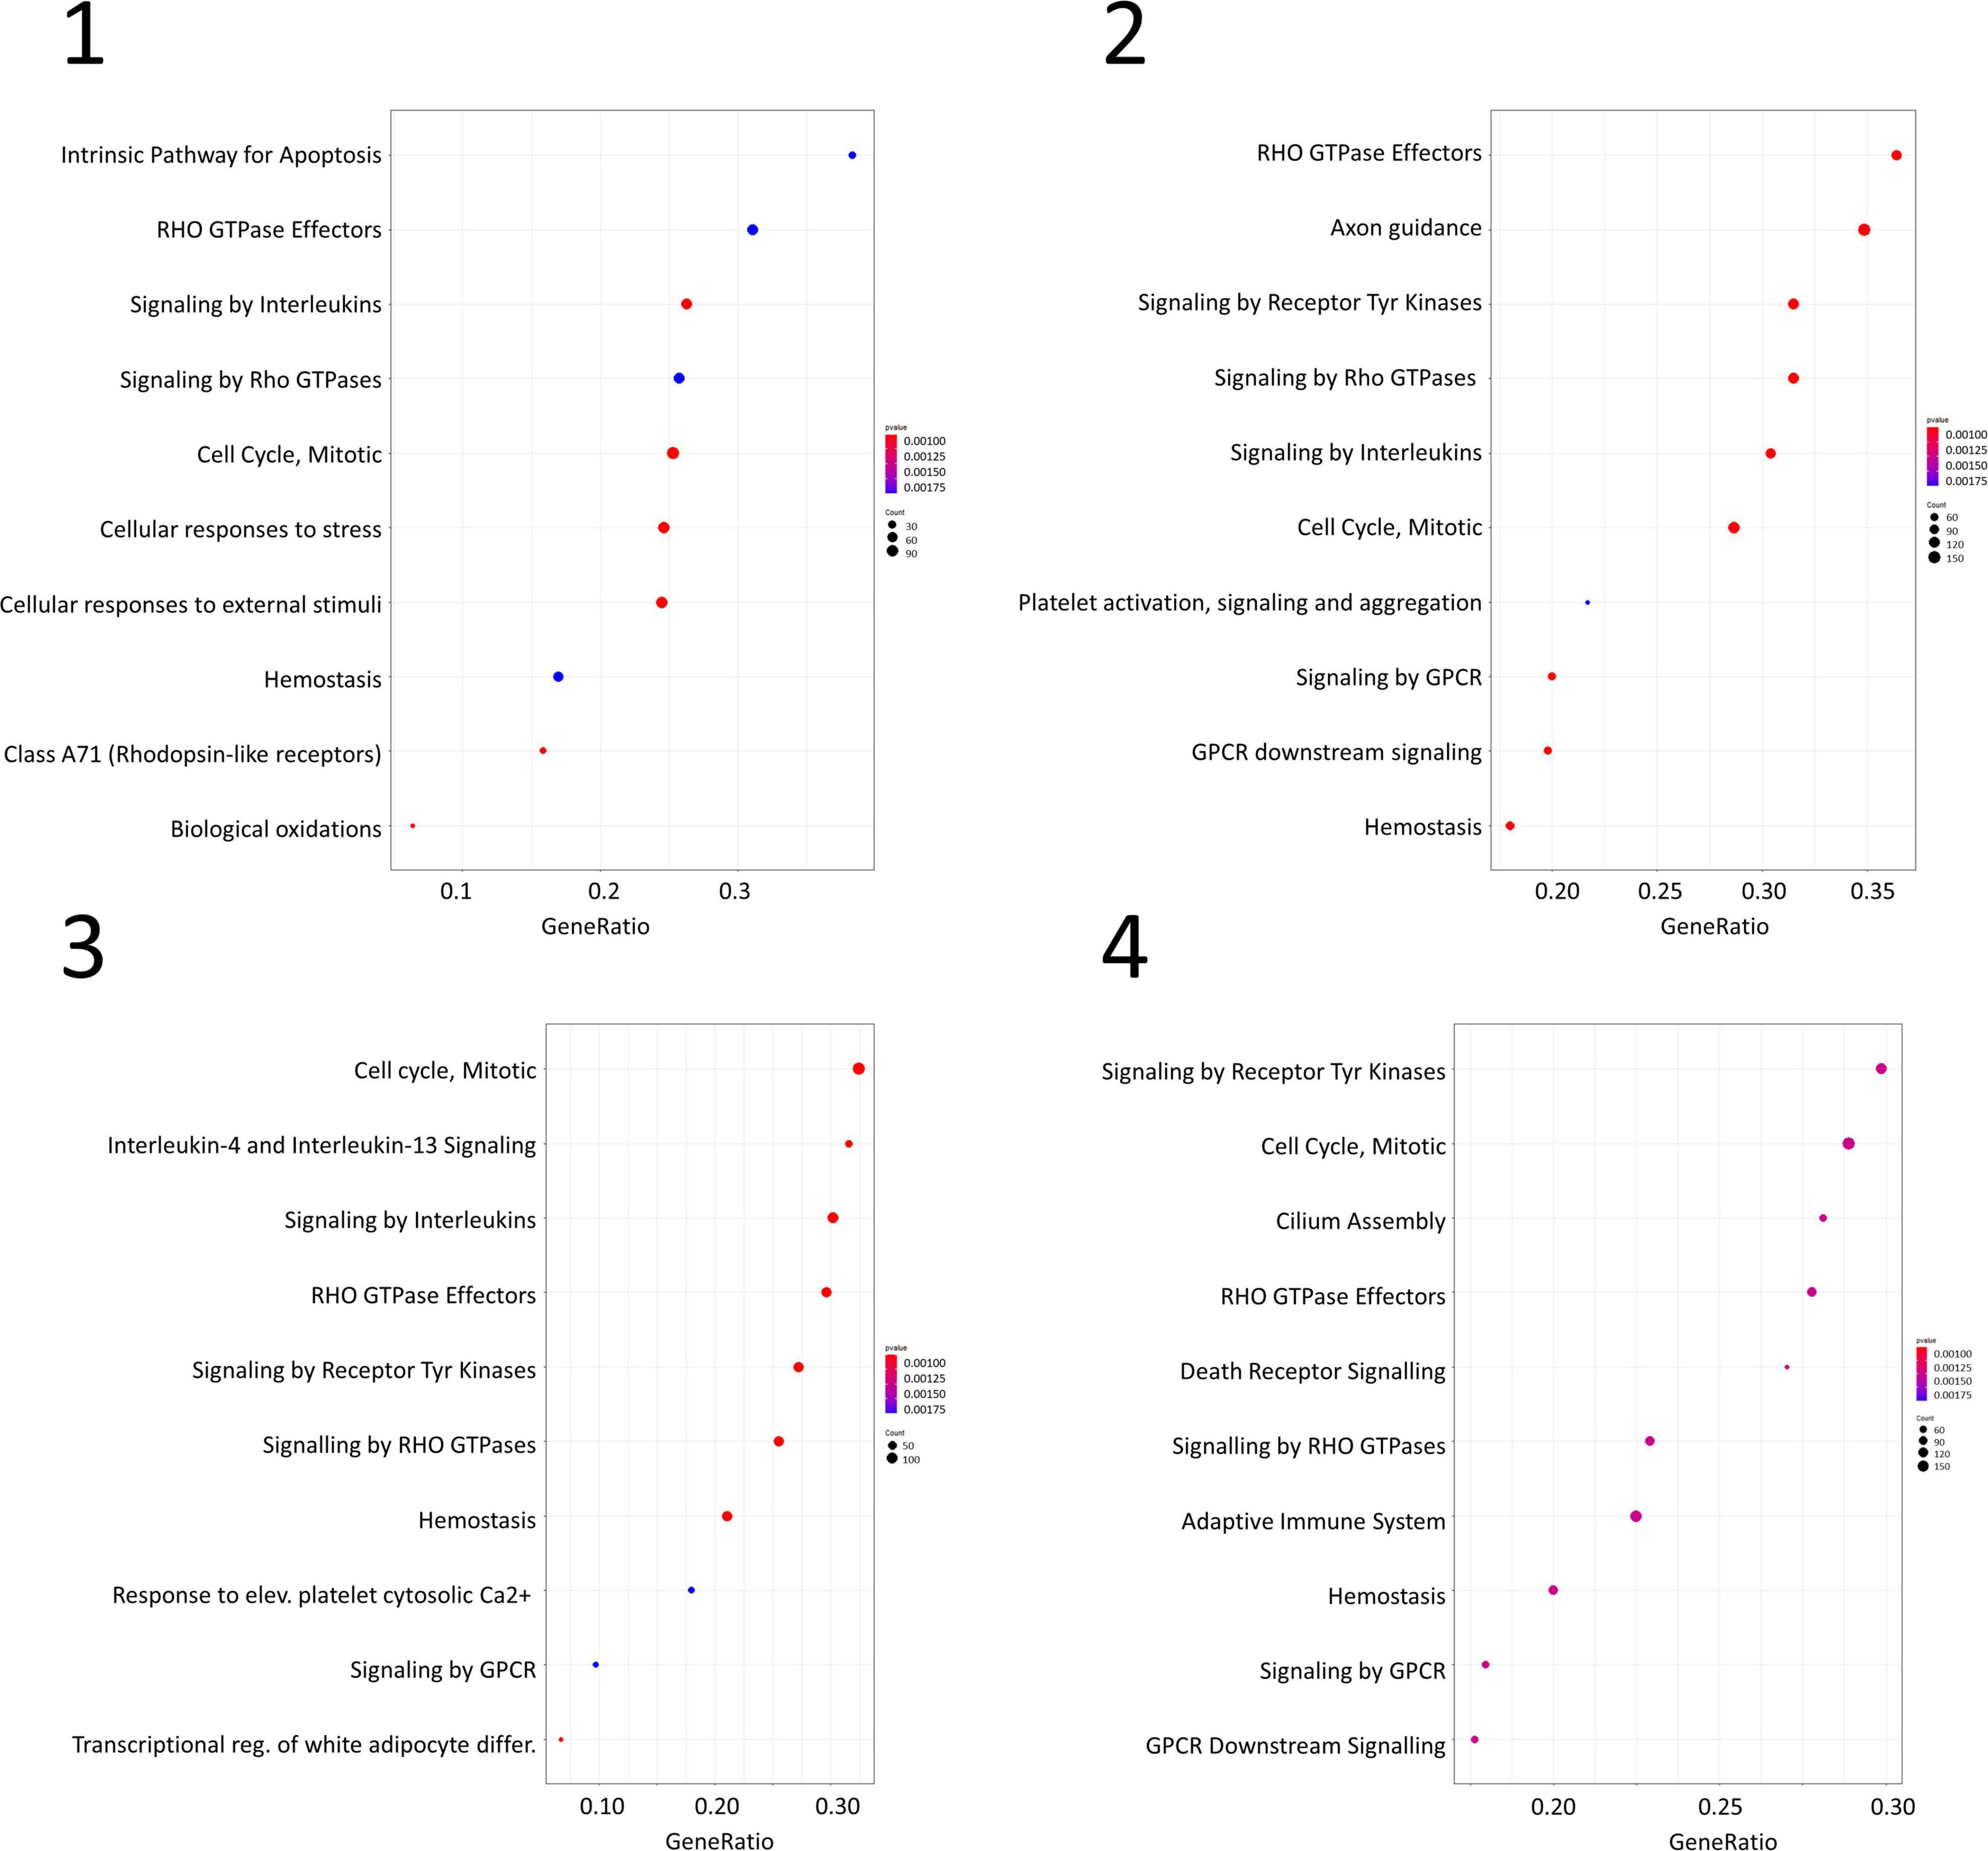
Figure 3. Dot plots for the four GSEA results. Numbers refer to patients as indicated in Table 1. Dot size is proportional to the number of overlapping genes. p-values are color-coded according to the color scale.
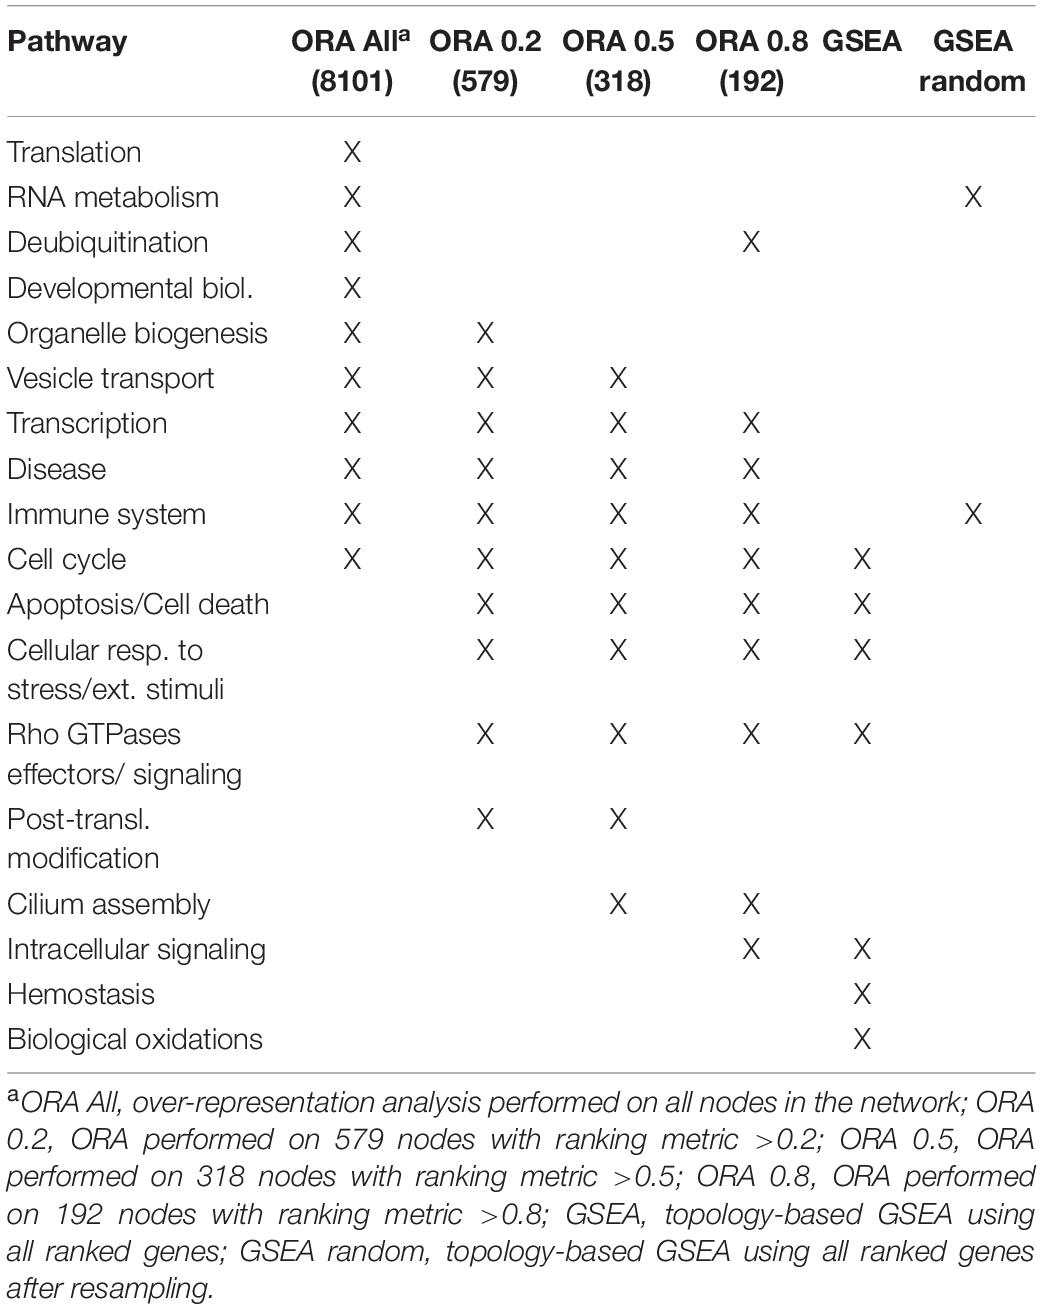
Table 3. Comparison of enriched pathways.
Consensus Networks From Secondary Data Analysis
The centrality-based GSEA approach was then applied on a consensus network already available in the literature. In a previous paper by Monti et al. (2018), authors retrieved full-text proteomics original articles focused on the development of three neurodegenerative diseases and extracted three input lists including 928 proteins for AD, 1,155 proteins for PD, and 387 proteins for ALS. The input lists were used to generate a consensus network representing interactions among proteins in the lists (Monti et al., 2018). We performed the topological analysis of the consensus network, whose results are shown in Figure 4A, where node size and border width are proportional to betweenness centrality. This network encompasses 483 nodes and 659 edges. Noteworthy, among the 95 nodes with the highest betweenness centrality (i.e., the top 20% central nodes), 78 are linked to PD, either in common or not with other diseases (Figure 4B). Most central genes are TIMP2 and EIF3A, both associated to PD only, and GABARAPL2, associated to PD and AD. However, these three genes did not lead to any significant association with PD pathogenesis, when taken alone. All nodes related to PD were then extracted from the whole network for further topological analysis and GSEA (Figure 4C).
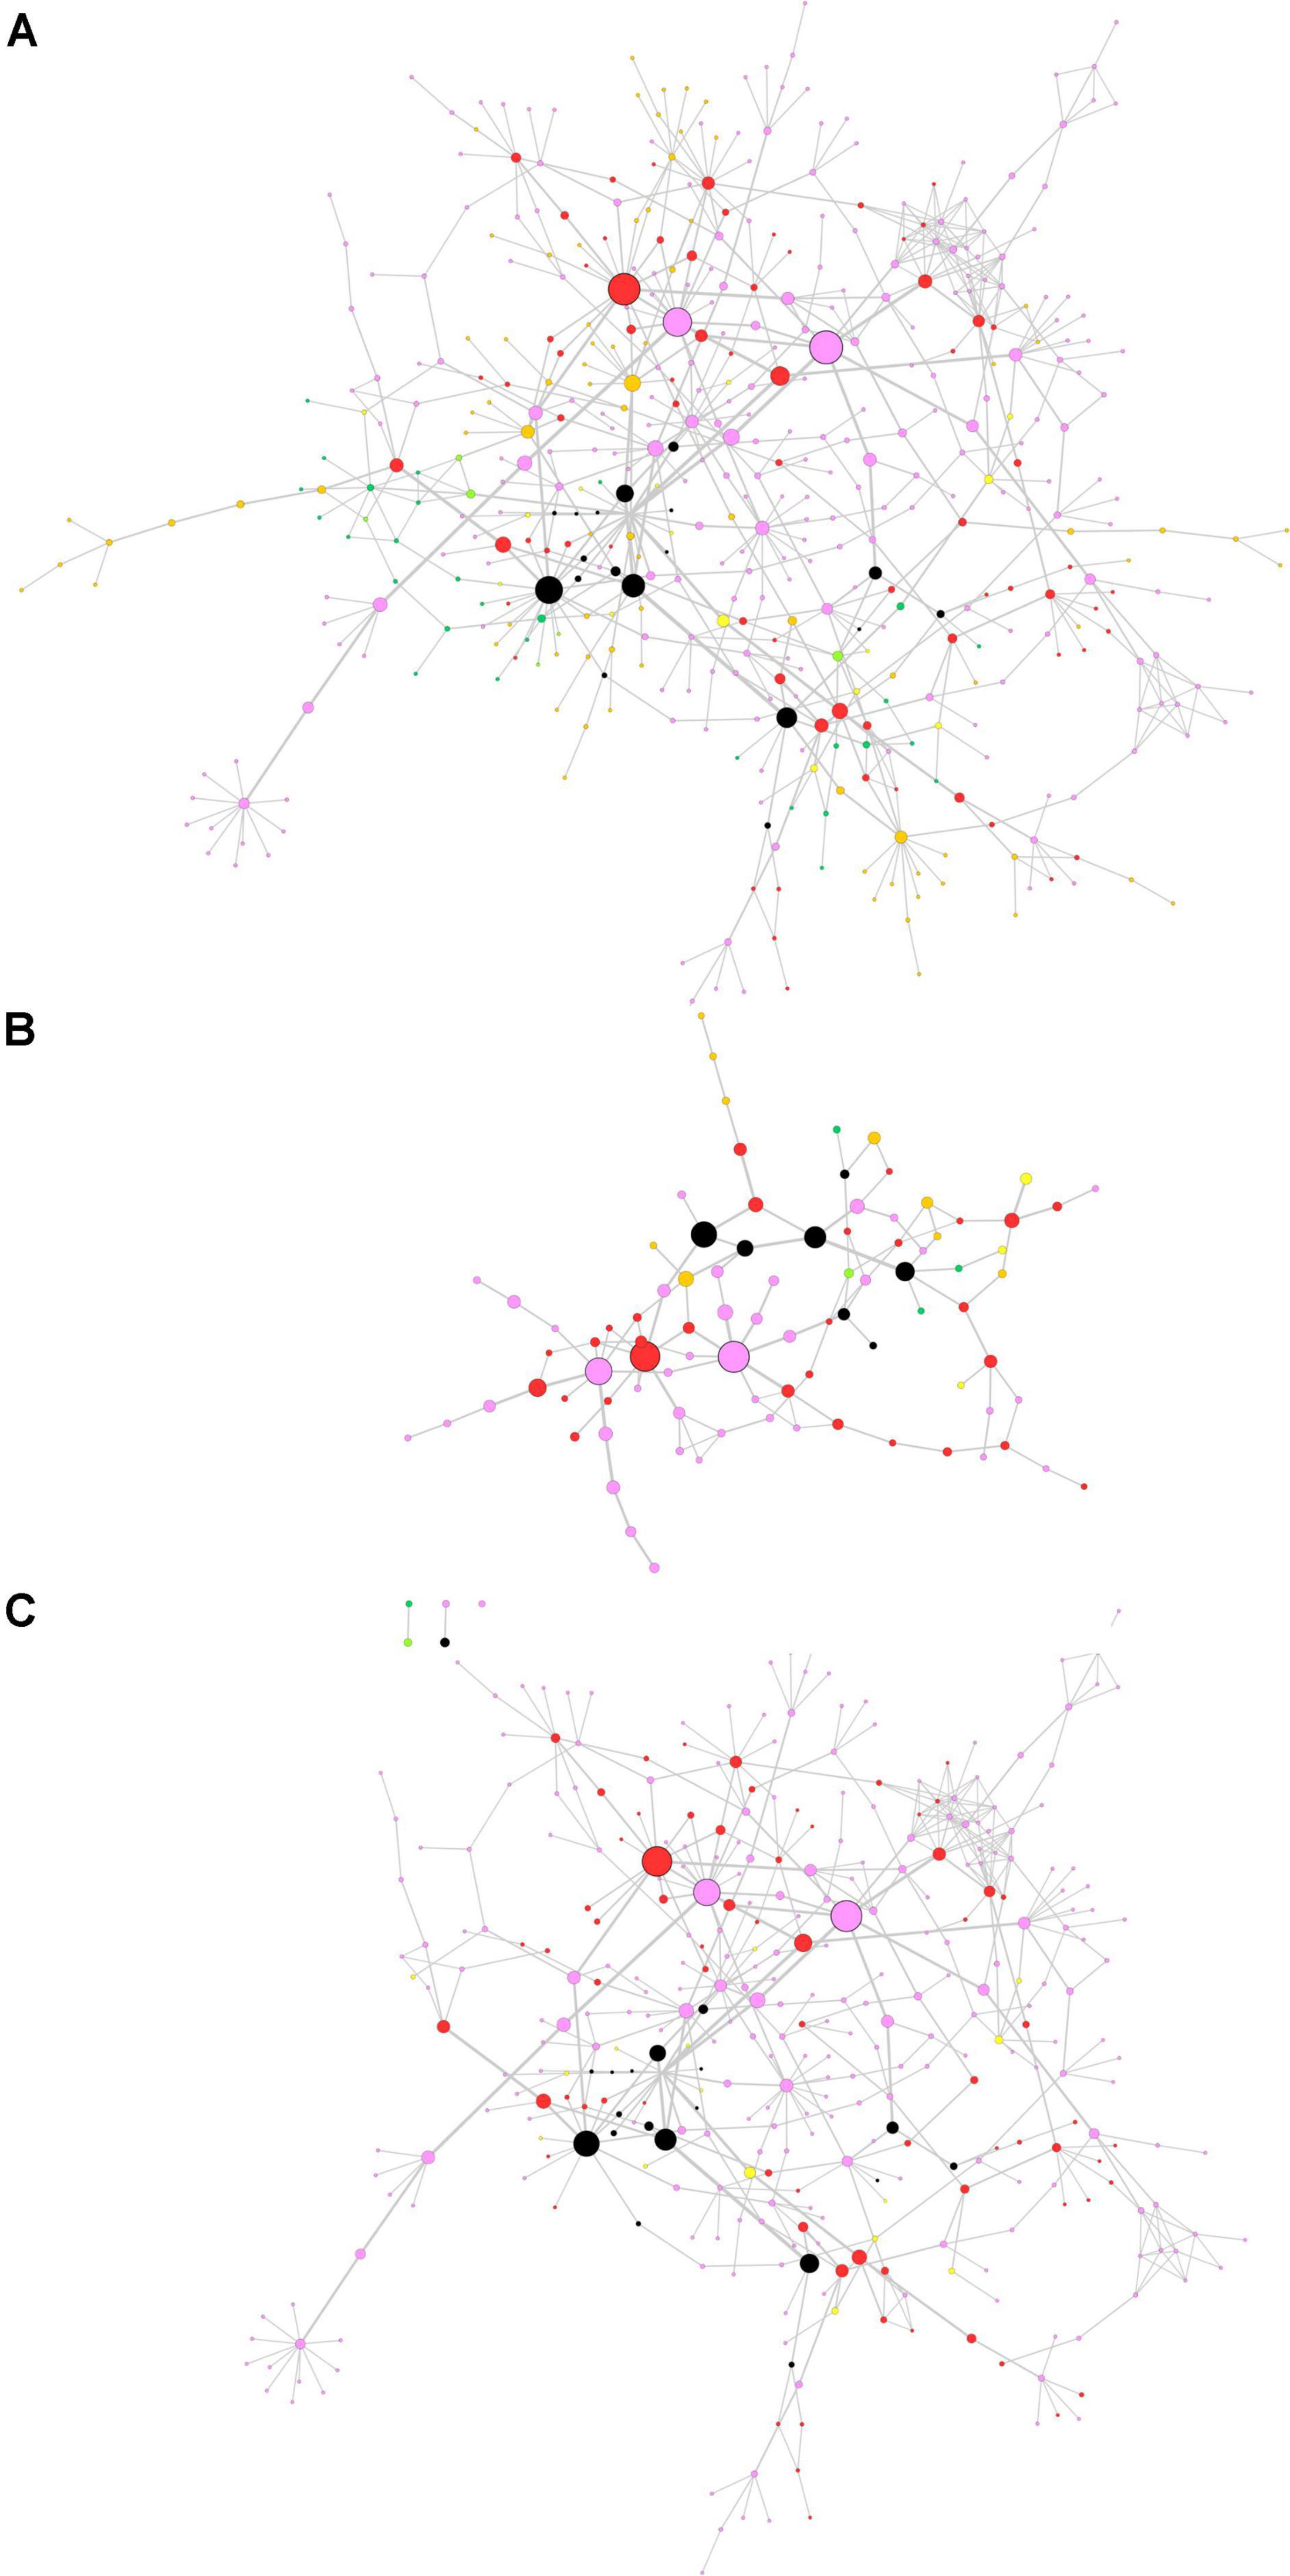
Figure 4. Topological analysis of the proteomics neurodegeneration network from secondary data analysis. (A) Whole network; (B) top 20% most central nodes; (C) selection from the whole network of nodes altered in Parkinson’s disease (PD) patients. Nodes are color-coded as follows. Pink, PD; dark green, amyotrophic lateral sclerosis (ALS); orange, Alzheimer’s disease (AD); yellow, PD and ALS; light green, ALS and AD; red, PD and AD; black, PD, ALS and AD (adapted from Monti et al., 2018). Node size and border width are proportional to betweenness centrality, whereas edge width is proportional to edge betweenness.
Gene set enrichment analysis was performed for the whole network (Figure 4A) and for the PD network (Figure 4C) using Hill-transformed betweenness centrality values as the scoring metrics, with Reactome as gene set reference database. Figure 5 shows enriched categories as a dot plot, with dot size proportional to the number of overlapping genes. For the whole network, enriched pathways mainly refer to catabolic pathways. Immune system appeared to be significantly enriched; however, it was also found after resampling of centrality metrics (Supplementary Figure 4). On the other hand, most significantly enriched pathways for the PD network were “Metabolism of amino acids and derivatives” and “Cellular response to stress or external stimuli,” that were not observed in the analysis of the resampled dataset.
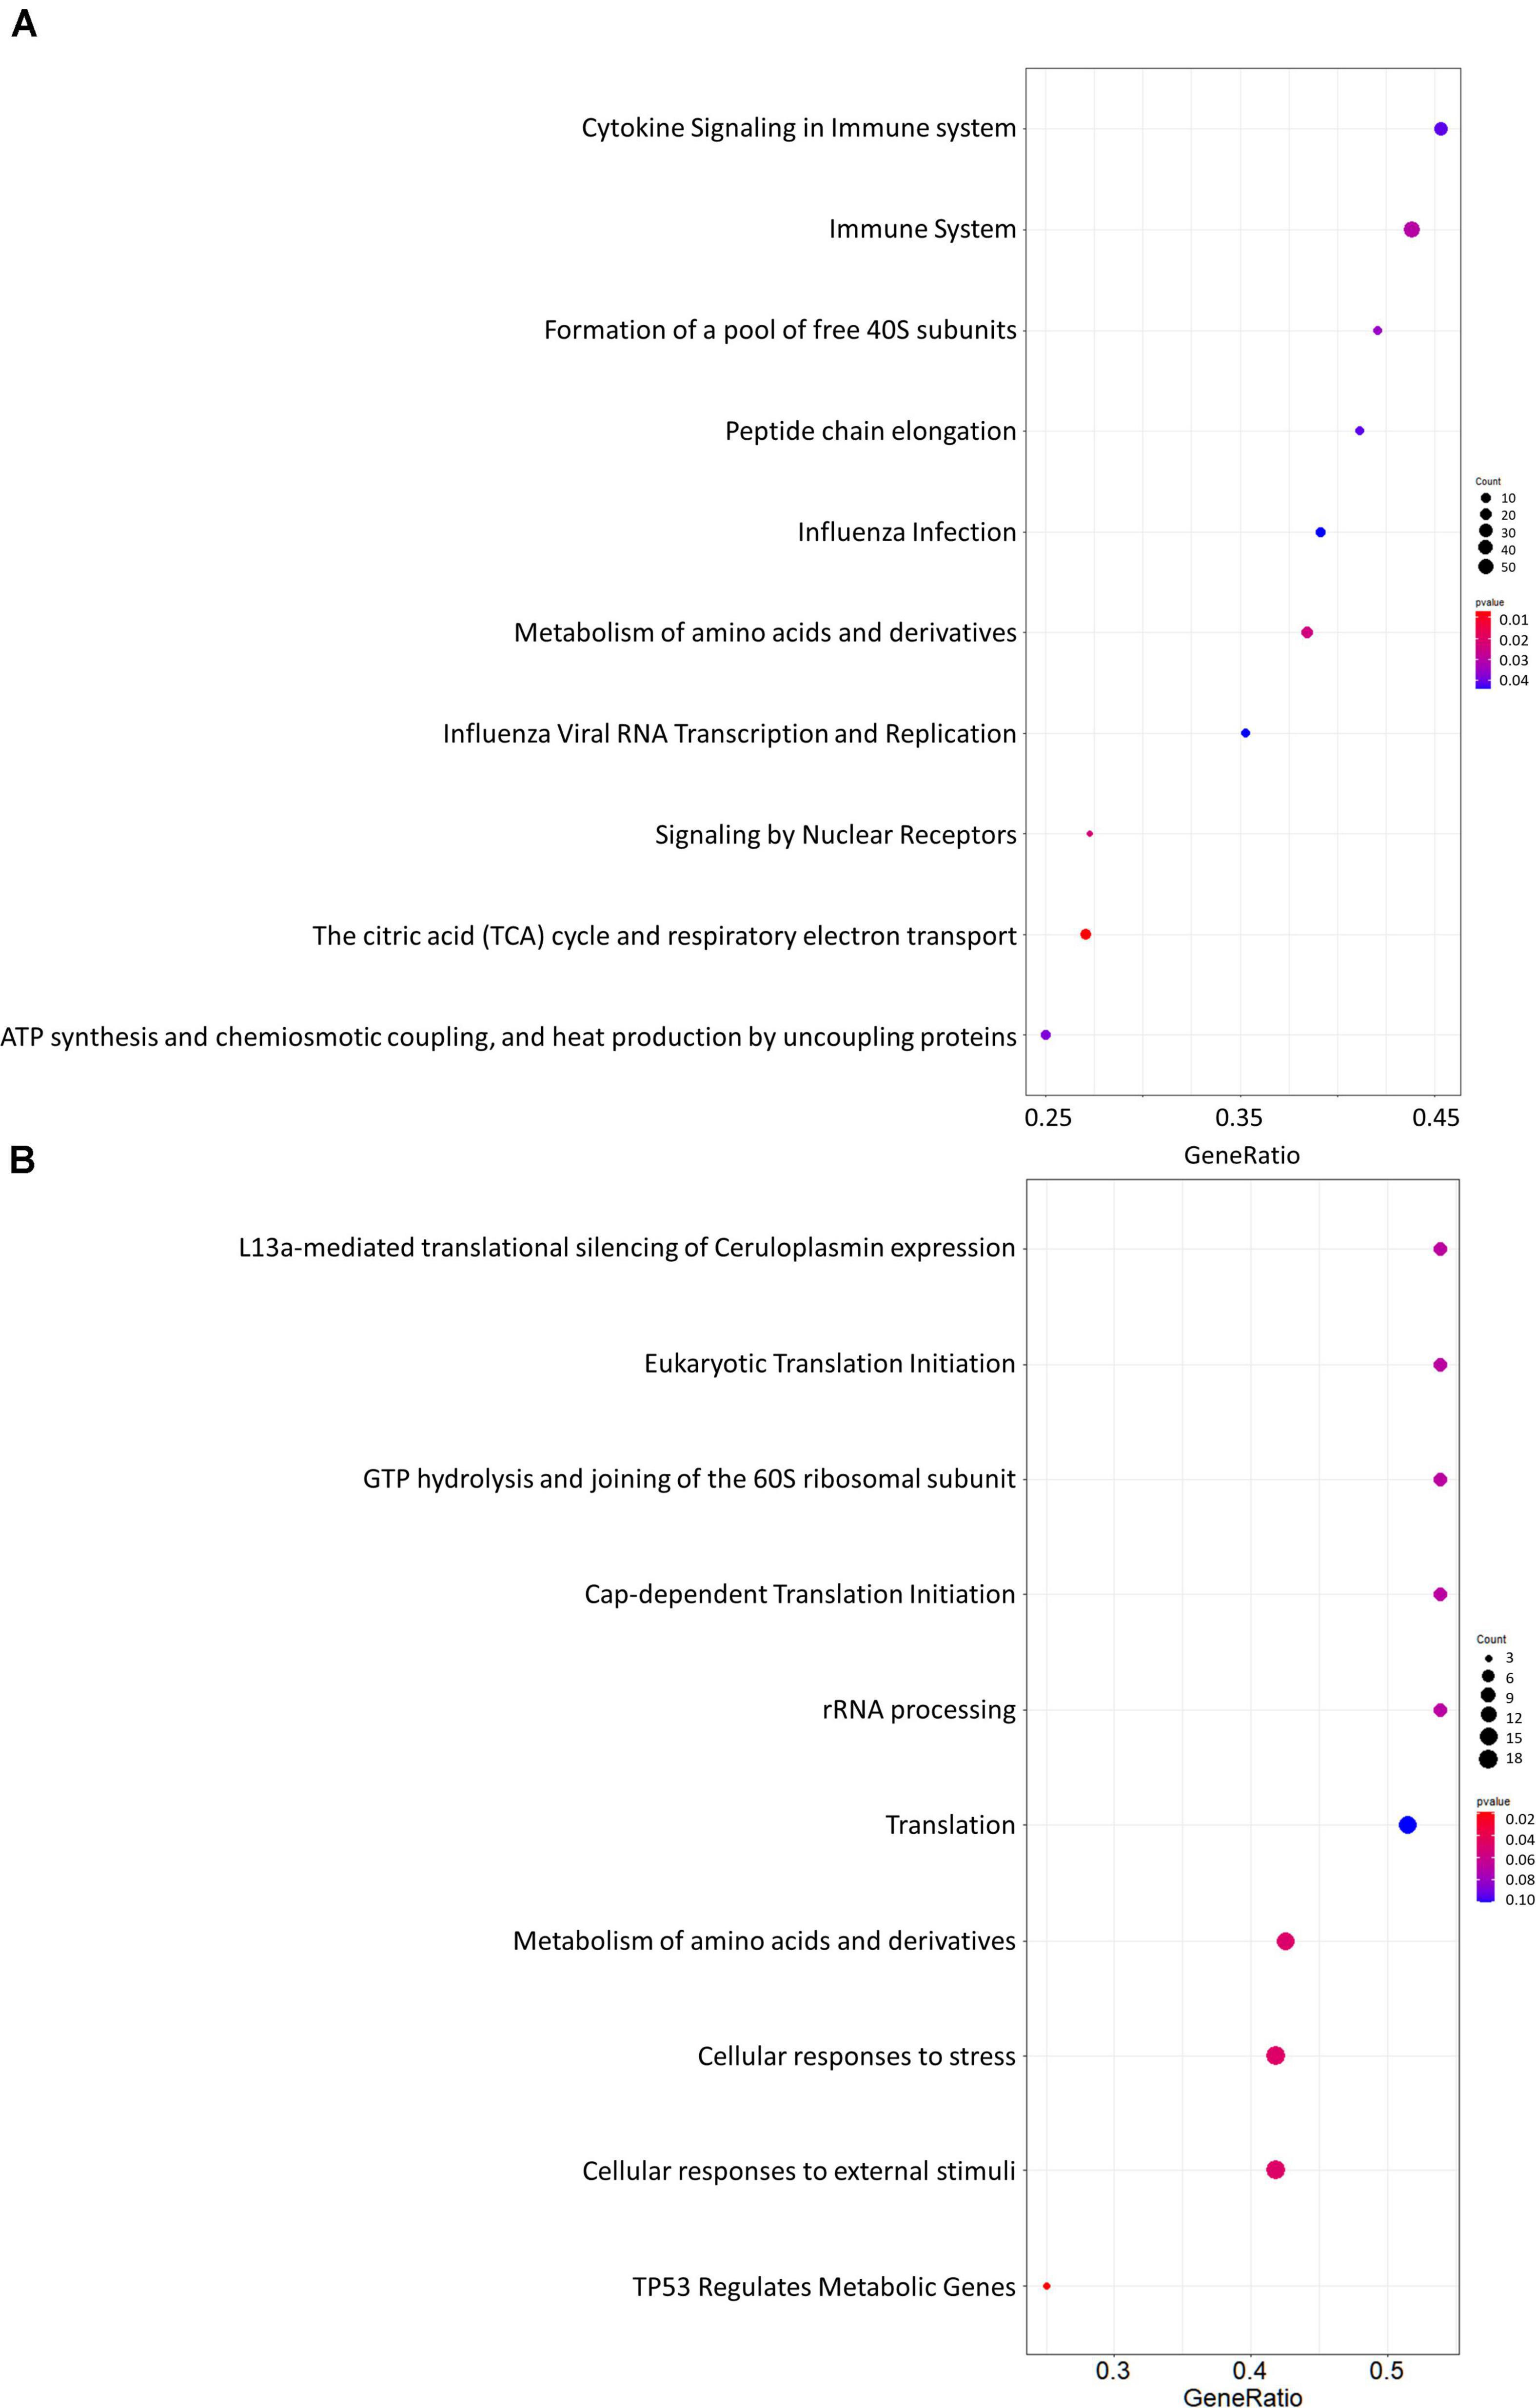
Figure 5. Dot plots for the GSEA results. (A) Whole network; (B) selection of nodes altered in Parkinson’s disease patients. Dot size is proportional to the number of overlapping genes. P-values are color-coded according to the color scale.
Discussion
Gene set enrichment analysis is usually performed to associate a disease phenotype to a group of genes by using quantitative expression data. Unlike over-representation analysis, GSEA has the advantage of considering the role of each gene by taking into account its correlation to the clinical phenotype or any other categorical variable (treatment, stage, time, and other experimental conditions) (Subramanian et al., 2005). Nevertheless, a quantitative metric is not always available in a dataset. Here, GSEA based on betweenness centrality of a PPI network is described and applied to two cases, where an expression metric is missing.
Actually, building a network starting from a list of entities such as genes or proteins is based on publicly available evidence of interaction, and the topology of the network accounts for the specific role each protein plays in the network itself. The degree of each node (i.e., the number of interactions with other nodes) is clearly a measure of how much this node is integrated in the network. We decided to consider the betweenness centrality as a suitable metric to rank network nodes in terms of the role they play in the disease represented by the network. Among other centrality measures, betweenness centrality discriminates centrality of nodes over a range that spans orders of magnitudes, unlike closeness centrality values that are distributed in a narrow range and therefore are slightly affected by the resampling procedure. Signature genes of the first case analyzed here showed very different centrality values in a range from 10–6 to 10–3. Worthy of note, several genes showing high centrality values are involved in neurodevelopmental disorders. Indeed, some of them (ANK3, BCKDK, CHRNA7, DYRK1A, MECP2, SHANK1, and TSC2) are included in the database SFARI (Banerjee-Basu and Packer, 2010) with high scores, supporting that the gene contributes to the disorder pathogenesis or it is a strong candidate.
The personalized networks are assembled around a cluster of very central genes, whose composition is partially overlapping. Interestingly, the top 10 clusters never include signature genes, and the weight of every member of the clusters may change among patients. As an example, the leucine-rich repeat kinase 2 (LRRK2) is present in all four networks. However, its centrality is low in patient 1 (CB = 7.56 × 10⁻³), whereas it has the top value in the other three patients. Recently, a role for LRRK2 in cognitive development has been proposed, thus linking LRRK2 to intellectual disability and autism (Labonne et al., 2020). Another gene present with very high centrality in all four networks, ESR1, has been related to the pathogenesis of autism and autism related symptoms (Wang et al., 2016).
We used the tools included in the ReactomePA package (Yu and He, 2016) to associate a topological parameter to each gene in the dataset in place of commonly used expression data. However, we observed that betweenness centrality values show a steep decrease within the first nodes in the ranked list. To select a sub-population of central nodes, betweenness centrality values were transformed with a Hill function that assigns high scores to less than 10% nodes. In this way, a drastic change in the weight associated to each gene is expected. Using Hill-transformed betweenness centrality values, GSEA of the four personalized networks yielded a different ranking of enriched pathways or even different pathways. As an example, the pathway “Cell Cycle, Mitotic” is enriched in all four patient networks. However, its ranking differs in the four dot plots. From the pathogenetic point of view, all patients share a neurodevelopmental impairment that is brought to evidence by the present analysis (e.g., “Mitotic G1-G1/S phase” pathway). It is known from literature that neurodevelopmental disorders are related to alterations of the cell cycle, and a central role is played by genes involved in neurogenesis regulation and cell adhesion processes (Pramparo et al., 2015). Moreover, our evidence supports the conclusions obtained so far on NDE1, the candidate gene for the susceptibility to the neurocognitive disorder given by the deletion on 16p13.11. Using a bottom-up approach, NDE1 and NDEL1 (its paralogue) were deeply characterized (i.e., biochemistry, PPIs, role in neuronal differentiation and cortical development, pathology caused by their alterations) (Bradshaw and Hayashi, 2017). In particular, the role of NDE1 and NDEL1 in cell cycle progression, neurite outgrowth and development and neuronal migration has been highlighted, thus supporting our results.
As a second application of the proposed approach, we analyzed a PPI network previously published by our group (Monti et al., 2018). This network encompasses proteins that were reported to quantitatively change in three neurodegenerative diseases by independent articles. Two of them are movement disorders (PD and ALS) and one is a cognitive disorder (AD). The original aim of the work was to distinguish between proteins that are specifically associated to a single neurodegenerative disease and proteins generically linked to neurodegeneration. Topological analysis of the network adds substance to this purpose. We observed that most central proteins are often linked to PD, either standalone or associated to other disorders. Indeed, the most evident colors in Figure 4B are pink (PD), red (PD and AD) and black (PD, AD and ALS). To gain more evidence to pathways associated to most central nodes, we extracted a subnetwork to represent all proteins that were altered in PD. This selection, together with the topological analysis, allowed us to improve the specificity of GSEA.
The use of a topological parameter to perform GSEA in the absence of any quantitative expression metric was never done before. This application of GSEA has been performed on two datasets, where expression metrics were not available. Although we decided to consider betweenness centrality as a ranking metric, further analyses could be performed by identifying other candidate topological parameters and using these data to obtain new pathway networks and new information.
Conclusion
The centrality-based GSEA procedure is another powerful tool to investigate personalized networks or disease networks, in order to unveil hidden information and to specifically plan experimental investigations. This analysis can be applied to a wide variety of networks, also in combination with clustering tools. Since biological networks are usually too large and are characterized by high modularity, topological descriptors could assist the identification of functional modules (Sharma et al., 2017; Choobdar et al., 2019). Altogether, the functional analysis of networks by weighting nodes in terms of their centrality could also provide a valuable tool to explore pathogenetic mechanisms and to precisely identify sensitive targets for drug development or repositioning. In this view, centrality-based GSEA represents an opportunity for precision medicine and network medicine.
Data Availability Statement
The datasets presented in this study can be found in online repositories. The names of the repository/repositories and accession number(s) can be found below: aCGH data: DECIPHER https://decipher.sanger.ac.uk/350680 (Patient 1), 414066 (Patient 2), 414078 (Patient 3) and 318359 (Patient 4). WES data: European Variation Archive Project: PRJEB41629, Analyses: ERZ1687005.
Ethics Statement
The studies involving human participants were reviewed and approved by ASST Sette Laghi ethical committee. Written informed consent to participate in this study was provided by the participants’ legal guardian/next of kin.
Author Contributions
AZ performed the cytogenetic analysis, bioinformatics analysis and wrote the manuscript. ML and TA revised the GSEA results and the manuscript. PG performed the cytogenetic analysis and contributed to the interpretation of whole exome sequencing results. DC and AN performed the whole exome sequencing analysis. RC enrolled the patients, carried out medical genetics visits, supervised genetics analysis, and revised the manuscript. MF supervised the project, wrote the code, and wrote the manuscript. All authors approved the final version of the manuscript.
Funding
This study was supported by the Volunteer Association “la gemma rara.”
Conflict of Interest
The authors declare that the research was conducted in the absence of any commercial or financial relationships that could be construed as a potential conflict of interest.
Acknowledgments
We gratefully thank the patients and their families who participated to the 16p13.11 microdeletion project.
Supplementary Material
The Supplementary Material for this article can be found online at: https://www.frontiersin.org/articles/10.3389/fgene.2021.577623/full#supplementary-material
Abbreviations
aCGH, array-based comparative genomic hybridization; AD, Alzheimer’s disease; ALS, amyotrophic lateral sclerosis; ES, enrichment score; GO, gene ontology; GSEA, gene set enrichment analysis; HITS, hypertext-induced topics search; MAF, minor allele frequency; NES, normalized enrichment score; PD, Parkinson’s disease; PPI, protein–protein interaction; SNV, single nucleotide variant; WES, whole exome sequencing.
Footnotes
- ^ https://cytoscape.org/
- ^ https://www.imexconsortium.org/
- ^ www.webgestalt.org
- ^ https://decipher.sanger.ac.uk/
References
Al-Haggar, M. M., Khair-Allaha, B. A., Islam, M. M., and Mohamed, A. S. A. (2013). Bioinformatics in high throughput sequencing: application in evolving genetic diseases. J. Data Mining Genomics Proteomics 4:131. doi: 10.4172/2153-0602.1000131
Antonov, A. V., Dietmann, S., Rodchenkov, I., and Mewes, H. W. (2009). PPI spider: a tool for the interpretation of proteomics data in the context of protein-protein interaction networks. Proteomics 9, 2740–2749. doi: 10.1002/pmic.200800612
Ashtiani, M., Salehzadeh-Yazdi, A., Razaghi-Moghadam, Z., Hennig, H., Wolkenhauer, O., Mirzaie, M., et al. (2018). A systematic survey of centrality measures for protein-protein interaction networks. BMC Syst. Biol. 12:80. doi: 10.1186/s12918-018-0598-2
Banerjee-Basu, S., and Packer, A. (2010). SFARI gene: an evolving database for the autism research community. Dis. Model Mech. 3, 133–135. doi: 10.1242/dmm.005439
Barabási, A. L. (2007). Network medicine – from obesity to the “Diseasome”. New Engl. J. Med. 357, 404–407. doi: 10.1056/NEJMe078114
Bradshaw, N. J., and Hayashi, M. A. (2017). NDE1 and NDEL1 from genes to (mal)functions: parallel but distinct roles impacting on neurodevelopmental disorders and psychiatric illness. Cell. Mol. Life Sci. 74, 1191–1210. doi: 10.1007/s00018-016-2395-7
Choobdar, S., Ahsen, M. E., Crawford, J., Tomasoni, M., Fang, T., Lamparter, D., et al. (2019). Assessment of network module identification across complex diseases. Nat. Methods 16, 843–852. doi: 10.1038/s41592-019-0509-5
Fabregat, A., Sidiropoulos, K., Viteri, G., Forner, O., Marin-Garcia, P., Arnau, V., et al. (2017). Reactome pathway analysis: a high-performance in-memory approach. BMC Bioinformatics 18:142. doi: 10.1186/s12859-017-1559-2
Fasano, M., Monti, C., and Alberio, T. (2016). A systems biology-led insight into the role of the proteome in neurodegenerative diseases. Expert Rev. Proteomics 13, 845–855. doi: 10.1080/14789450.2016.1219254
Kleinberg, J. M. (1999). Authoritative sources in a hyperlinked environment. J. ACM 46, 604–632. doi: 10.1145/324133.324140
Labonne, J., Driessen, T. M., Harris, M. E., Kong, I. K., Brakta, S., Theisen, J., et al. (2020). Comparative genomic mapping Implicates LRRK2 for intellectual disability and autism at 12q12, and HDHD1, as well as PNPLA4, for X-Linked intellectual disability at Xp22.31. J. Clin. Med. 9:274. doi: 10.3390/jcm9010274
Liao, Y., Wang, J., Jaehnig, E. J., Shi, Z., and Zhang, B. (2019). WebGestalt 2019: gene set analysis toolkit with revamped UIs and APIs. Nucleic Acids Res. 47, W199–W205. doi: 10.1093/nar/gkz401
Ma, J., Shojaie, A., and Michailidis, G. (2019). A comparative study of topology-based pathway enrichment analysis methods. BMC Bioinformatics 20:546. doi: 10.1186/s12859-019-3146-1
Monti, C., Colugnat, I., Lopiano, L., Chiò, A., and Alberio, T. (2018). Network analysis identifies disease-specific pathways for Parkinson’s disease. Mol. Neurobiol. 55, 370–381. doi: 10.1007/s12035-016-0326-0
Monti, C., Zilocchi, M., Colugnat, I., and Alberio, T. (2019). Proteomics turns functional. J. Proteomics 198, 36–44. doi: 10.1016/j.jprot.2018.12.012
Piñero, J., Berenstein, A., Gonzalez-Perez, A., Chernomoretz, A., and Furlong, L. I. (2016). Uncovering disease mechanisms through network biology in the era of next generation sequencing. Sci. Rep. 6:24570. doi: 10.1038/srep24570
Pramparo, T., Lombardo, M. V., Campbell, K., Barnes, C. C., Marinero, S., Solso, S., et al. (2015). Cell cycle networks link gene expression dysregulation, mutation, and brain maldevelopment in autistic toddlers. Mol. Syst. Biol. 11:841. doi: 10.15252/msb.20156108
R Core Team (2017). R: A Language and Environment for Statistical Computing. Vienna: R Foundation for Statistical Computing.
Sharma, A., Cinti, C., and Capobianco, E. (2017). Multitype network-guided target controllability in phenotypically characterized osteosarcoma: role of tumor microenvironment. Front. Immunol. 8:918. doi: 10.3389/fimmu.2017.00918
Sonawane, A. R., Weiss, S. T., Glass, K., and Sharma, A. (2019). Network medicine in the age of biomedical big data. Front. Genet. 10:294. doi: 10.3389/fgene.2019.00294
Su, G., Morris, J. H., Demchak, B., and Bader, G. D. (2014). Biological network exploration with Cytoscape 3. Curr. Protoc. Bioinformatics 47, 8.13.1–8.13.24. doi: 10.1002/0471250953.bi0813s47
Subramanian, A., Tamayo, P., Mootha, V. K., Mukherjee, S., Ebert, B. L., Gillette, M. A., et al. (2005). Gene set enrichment analysis: a knowledge-based approach for interpreting genome-wide expression profiles. Version 2. Proc. Natl. Acad. Sci. U.S.A. 102, 15545–15550. doi: 10.1073/pnas.0506580102
Suwinski, P., Ong, C. K., Ling, M. H. T., Poh, Y. M., Khan, A. M., and Ong, H. S. (2019). Advancing personalized medicine through the application of whole exome sequencing and big data analytics. Front. Genet. 10:49. doi: 10.3389/fgene.2019.00049
Tebani, A., Afonso, C., Marret, S., and Bekri, S. (2016). Omics-based strategies in precision medicine: toward a paradigm shift in inborn errors of metabolism investigations. Int. J. Mol. Sci. 17:1555. doi: 10.3390/ijms17091555
Wang, X., Liang, S., Fujisawa, T. X., Nishitani, S., Tomoda, A., Zou, M., et al. (2016). Association of estrogen receptor alpha polymorphisms with symptoms of autism among Chinese Han children. Neuro Endocrinol. Lett. 37, 439–444.
Keywords: systems medicine, network medicine, gene set enrichment analysis, topological analysis, neurodevelopment, neurodegeneration
Citation: Zito A, Lualdi M, Granata P, Cocciadiferro D, Novelli A, Alberio T, Casalone R and Fasano M (2021) Gene Set Enrichment Analysis of Interaction Networks Weighted by Node Centrality. Front. Genet. 12:577623. doi: 10.3389/fgene.2021.577623
Received: 02 July 2020; Accepted: 04 February 2021;
Published: 24 February 2021.
Edited by:
Angelo Facchiano, Institute of Food Sciences, National Research Council (CNR), ItalyReviewed by:
Juilee Thakar, University of Rochester, United StatesAnkush Sharma, University of Oslo, Norway
Copyright © 2021 Zito, Lualdi, Granata, Cocciadiferro, Novelli, Alberio, Casalone and Fasano. This is an open-access article distributed under the terms of the Creative Commons Attribution License (CC BY). The use, distribution or reproduction in other forums is permitted, provided the original author(s) and the copyright owner(s) are credited and that the original publication in this journal is cited, in accordance with accepted academic practice. No use, distribution or reproduction is permitted which does not comply with these terms.
*Correspondence: Mauro Fasano, bWF1cm8uZmFzYW5vQHVuaW5zdWJyaWEuaXQ=