 Jie Wang1
 Peng Lei2
 Amr Ahmed Abdelrahim Gamil1
 Leidy Lagos2
 Yang Yue1
 Kristin Schirmer3,4,5
 Liv Torunn Mydland2
 Margareth Øverland2
 Åshild Krogdahl1
 Trond M. Kortner1*
- 1Department of Basic Sciences and Aquatic Medicine, Faculty of Veterinary Medicine, Norwegian University of Life Sciences (NMBU), Oslo, Norway
- 2Department of Animal and Aquacultural Sciences, Faculty of Biosciences, Norwegian University of Life Sciences (NMBU), Oslo, Norway
- 3Eawag, Swiss Federal Institute of Aquatic Science and Technology, Dübendorf, Switzerland
- 4EPF Lausanne, School of Architecture, Civil and Environmental Engineering, Lausanne, Switzerland
- 5ETH Zürich, Institute of Biogeochemistry and Pollutant Dynamics, Zurich, Switzerland
The objective of this study was to evaluate the suitability of the rainbow trout intestinal epithelial cell line (RTgutGC) as an in vitro model for studies of gut immune function and effects of functional feed ingredients. Effects of lipopolysaccharide (LPS) and three functional feed ingredients [nucleotides, mannanoligosaccharides (MOS), and beta-glucans] were evaluated in RTgutGC cells grown on conventional culture plates and transwell membranes. Permeation of fluorescently-labeled albumin, transepithelial electrical resistance (TEER), and tight junction protein expression confirmed the barrier function of the cells. Brush border membrane enzyme activities [leucine aminopeptidase (LAP) and maltase] were detected in the RTgutGC cells but activity levels were not modulated by any of the exposures. Immune related genes were expressed at comparable relative basal levels as these in rainbow trout distal intestine. LPS produced markedly elevated gene expression levels of the pro-inflammatory cytokines il1b, il6, il8, and tnfa but had no effect on ROS production. Immunostaining demonstrated increased F-actin contents after LPS exposure. Among the functional feed ingredients, MOS seemed to be the most potent modulator of RTgutGC immune and barrier function. MOS significantly increased albumin permeation and il1b, il6, il8, tnfa, and tgfb expression, but suppressed ROS production, cell proliferation and myd88 expression. Induced levels of il1b and il8 were also observed after treatment with nucleotides and beta-glucans. For barrier function related genes, all treatments up-regulated the expression of cldn3 and suppressed cdh1 levels. Beta-glucans increased TEER levels and F-actin content. Collectively, the present study has provided new information on how functional ingredients commonly applied in aquafeeds can affect intestinal epithelial function in fish. Our findings suggest that RTgutGC cells possess characteristic features of functional intestinal epithelial cells indicating a potential for use as an efficient in vitro model to evaluate effects of bioactive feed ingredients on gut immune and barrier functions and their underlying cellular mechanisms.
Introduction
The fish intestine is a multifunctional organ responsible for key physiological processes such as digestion, absorption of nutrients, and osmoregulation (1). Furthermore, the intestine has an important immunological role and constitutes a physical barrier against pathogens (1). In order to secure optimal gut health and function in farmed fish, there is now particular focus on various feed additives including functional feed ingredients that are branded not only in terms of their nutritional value, but also based on their health promoting and disease preventing properties. These functional feed ingredients could include intact microbes (e.g., probiotic organisms), mixed or purified extracts from microbial or plant structural components [e.g., mannanoligosaccarides (MOS), beta-glucans], metabolites (e.g., nucleotides) or even conventional nutrients, if their dietary inclusion is higher than the animal's requirement. Functional feeds are typically applied during predicted stressful events or challenging farming conditions, such as grading, sea water transfer, vaccination, and during critical life stages to help the animal ward off pathogens and secure good health (2). Functional feed ingredients are generally believed to exert their main actions locally within the gut, and may have direct modulatory effects on gut microbiota (3), gut barrier, immune, and/or metabolic functions (4–7). For example, nucleotides are of crucial importance for a whole range of normal intestinal functions, such as growth, nutrient metabolism, immune system, tissue repair, and development (8). Beta-glucans can increase cellular and humoral immune responses in immune cells and epithelial tissues of fish (9–11). MOS as an immune modulator has a close relation to pathogen colonization blocking and immune system regulation, as well as improving intestinal morphology and the epithelial brush border (10, 12, 13).
Current knowledge regarding mechanisms underlying effects of functional feed ingredients on fish gut health and function is, however, limited largely due to a lack of targeted research tools. The use of in vitro approaches, such as appropriate cell lines, would facilitate further research on basic functions of the digestive tract and effects of functional feed ingredients on host intestinal immune, barrier and digestive function. It would also reduce the current dependence on large-scale feeding trials, thus contributing to a shift toward 3R studies within fish nutrition research. In mammalian research, intestinal cell lines have proven to be valuable tools for exploration of basic mechanisms of gut function and health and interactions with dietary components. For example, nucleotide supplements in human Caco-2 and rat IEC-6 cell lines have been observed to strengthen intestinal maturation and growth (14). Beta-glucans and plant flavonoids can suppress nuclear factor-kB transactivation, regulate immune response, and strengthen intestinal epithelial barrier function in human Caco-2 cells (15–17).
Until recently, no relevant intestinal cell lines from fish have been available, but promising cultures have been established based on the rainbow trout (Oncorhynchus mykiss) intestinal derived cell line RTgutGC (18). Since their initial isolation, RTgutGC cells have been relatively well-characterized and are now routinely grown as monolayers on permeable supports, leading to a two-compartment intestinal barrier model consisting of a polarized epithelium. The system is divided into an upper (apical) and a lower (basolateral) compartment, thereby mimicking the intestinal lumen and the portal blood, respectively. Reported structural and functional features of the RTgutGC cells include tight junction and desmosome formation between adjacent cells, development of transepithelial resistance and polarization over time to exhibit epithelial and brush border characteristics (18–20). The cell line has, as such, been proposed as a physiologically adequate fish intestinal epithelial model, equivalent to the Caco-2 cell line for human intestinal epithelium (20, 21), and has been used recently in studies on fish intestinal immune and barrier function (18, 22, 23).
The objective of this study was to evaluate the suitability of the RTgutGC cells as an in vitro model for studies of gut immune function and effects of functional feed ingredients. Effects of a prototype pathogen-associated molecular pattern (PAMP), lipopolysaccharide (LPS), and three functional ingredients commonly applied in commercial fish feeds (nucleotides, MOS, and beta-glucans) were evaluated by diverse analyses, including cell viability measurements and proliferation, brush border digestive enzyme activity, barrier function, ROS production, morphology, and relevant gene and protein expression.
Materials and Methods
RTgutGC Cell Culture
Routine RTgutGC cell cultivation was based on the description by Kawano et al. (18). Briefly, RTgutGC cells were cultured in 75-cm2 flasks (TPP, Trasadingen, Switzerland). L-15 complete medium (L-15/C), i.e., Leibovitz's L-15 medium without Phenolred (21083, Gibco Invitrogen, Basel, Switzerland) supplemented with 10% bovine serum (F7524, Sigma Aldrich, Buchs, Switzerland) and gentamicin (15710-049, Invitrogen, Basel, Switzerland) with a final concentration of 100 μg/mL, was used to culture cells in a 20°C incubator under normal atmosphere. Cells were split in a 1:2 ratio using trypsin (0.25% in PBS w/o Ca2+, Mg2+; L0910; Biowest; Nuaillé, France) after reaching confluency.
For cells grown on conventional culture plates without inserts, 1 mL or 3.5 mL cell suspensions (1.5 × 10⁵ cells/mL, 78,947 cells per cm2 for 24-well plates and 54,688 cells per cm2 for 6-well plates) were seeded in 24-well (No.662160, Greiner-Bio-one, Frickenhausen, Germany) or 6-well plates (No. 657960, Greiner-Bio-one, Frickenhausen, Germany), respectively, and were cultured to reach at least 80 % confluency before use (3–4 days).
For the two-compartment intestinal barrier model, RTgutGC cells were cultured as described previously (19, 20). Briefly, 24-well plates with 33.6 mm2 transwell inserts (No. 662 630, Greiner-Bio-one, Frickenhausen, Germany) and 6-well plates with 425.4 mm2 transwell inserts (No. 657 630, Greiner-Bio-one, Frickenhausen, Germany) with pore sizes of 3 μm were used to simulate gut lumen (apical /upper chamber) and portal blood (basolateral /lower chamber). Cells were seeded adding 300 μL or 3.5 mL cell suspension (8 × 10⁴ cells/mL, 71,429 cells per cm2 for 24-well plates and 65,820 cells per cm2 for 6-well plates) in the apical chamber of 24-well or 6-well plates, respectively. Then, 1 or 3.5 mL of L-15/C were added into the basolateral chamber of 24-well or 6-well plates, respectively. The apical and basolateral medium was changed once per week for a total of 28 days.
Exposure Design
Stock solutions were prepared for LPS and the functional ingredients. LPS (L2630, Sigma, Norway) stock solution was prepared to 1 mg/mL in L15/ex medium. The L15/ex medium contains only the inorganic salts, galactose, and pyruvate concentrations of L-15 (24). Nucleotides (T25-1KT, Sigma, Norway) stock solution was prepared to 10 mg/mL using milliQ water. MOS (Active MOS extracted from yeast, Biorigin, São Paulo, Brazil) stock solution was prepared to 20 mg/mL using sterile PBS, and then sonicated in a water bath (30 s/3 times) and centrifuged (500 × g/ 5 min). The supernatant was subsequently transferred into new vials and stored at −20°C according to previous descriptions (13). Beta-glucans (G5011, Sigma, Norway) stock solution was prepared to 2 mg/mL in sterile PBS according to previous reports (23).
For all exposure tests performed with the two-compartment intestinal barrier model, the stock solutions of LPS and the functional ingredients were diluted in mucosal saline, prepared according to Genz et al. (25) (Supplementary Table 1), and added to the apical chamber in order to mimic intestinal lumen conditions. Before performing the exposure tests with LPS and the functional ingredients, L-15/C and mucosal saline acted as exposure medium for RTgutGC cells to evaluate whether the mucosal saline affected cell viability. For exposure tests performed with conventional plates, working solutions were prepared by diluting in mucosal saline or L15 medium, depending on the analytical assay as specified below. To select final working concentrations for further analysis, LPS and the functional ingredients were tested at a range of different concentrations in 6 h exposures in 24-well-conventional plates without inserts (Supplementary Table 2).
Assessment of Cell Viability
Alamar Blue (AB, DAL1025, Invitrogen, Basel, Switzerland) and 5-carboxyfluorescein diacetate acetoxymethyl ester (CFDA-AM, C1345, Invitrogen, Basel, Switzerland) were used to measure cell viability (24, 26). AB was used to measure cell metabolic activity, whereas CFDA-AM was used to measure cell membrane integrity. After 6 h of incubation, stimulant working solutions were discarded, cells were washed twice using 1 mL PBS and subsequently, a volume of 400 μL of fresh AB and CFDA-AM were added to each well. The plates were then incubated at 20°C for 30 min in the dark before measurement. The Cytation 3 plate reader (Bio Tek Instruments, Winooski, USA) was used to measure the fluorescence of AB (λex = 530 nm; λex = 595 nm) and CFDA-AM (λex = 493 nm; λex = 541 nm).
Measurement of Transepithelial Electrical Resistance (TEER)
As a quality measure of monolayer formation, TEER was measured in RTgutGC cells grown in 24-well-culture plates with membrane inserts at day 1, 7, 14, and 28. Additionally, TEER was measured in RTgutGC cells exposed to LPS and the functional ingredients for 6 h after 28 days of culture on transwell membrane inserts in 6-well plates. TEER levels were measured using an EVOM Voltohmmeter with STX2 electrode and Endohm-6 electrode (World Precision Instruments, Berlin, Germany) as described by Geppert et al. (19). TEER was calculated by subtracting the values without cells from the values with cells. TEER values were given as Ω × cm2.
Brush Border Membrane Enzyme Activity
After 3–4 days of culture on conventional 24-well plates, RTgutGC cells were exposed to LPS and the functional ingredients for 6 h. After discarding the mucosal saline with LPS or functional ingredients, cells were harvested by trypsination and centrifugation. Cell pellets were reconstituted in 1 mL ice-cold 2 mM Tris/50 mM mannitol pH 7.1, containing phenyl-methyl-sulphonyl fluoride (P-7626, Sigma, Norway) as serine protease inhibitor. Brush border membrane enzyme activities, i.e., leucine amino peptidase (LAP) and maltase, were subsequently measured. LAP activity was analyzed colorimetrically with a commercial kit (NO. 251, Sigma, Norway) using L-leucine-β-naphthylamide as substrate according to the methods described by Krogdahl et al. (27). Maltase activity was measured using maltose as substrate according to the description of Dahlquist (28). Total protein concentrations were determined using a Bio-Rad Protein Assay (Bio-Rad Laboratories, Munich, Germany). Enzyme activities were expressed as mol substrate hydrolysed per hour per mg protein.
Albumin Translocation Assay
After 28 days of culture on transwell-membrane inserts in 6-well plates, RTgutGC cells with an initial seeding density of 8 × 10⁴ cells/mL (65,820 cells per cm2) were exposed to LPS and the functional ingredients for 6 h. The permeation of fluorescent-labeled albumin was then used to evaluate the barrier potential of the cells. 20 μL albumin (Alexa FluorTM 488 Bovine Serum Albumin, Thermo Fisher Scientific, USA) was added into the apical chamber of each well, and 250 μL of culture medium was collected from the basolateral chamber at the following intervals: 10, 30, 45, 60, and 90 min and temporary stored in the dark at 20 °C. After collecting all the samples, 100 μL of each sample was added to a 96- well black plate (M5061-40EA, Sigma, Norway) in duplicate, and fluorescence was measured using a Cytation 3 plate reader (Bio Tek Instruments, Winooski, USA) equipped with a 490 excitation and 525 emission filter.
Quantitative Real Time PCR (qPCR)
After 28 days of culture on transwell membrane inserts in 6-well plates, RTgutGC cells were exposed to LPS and the functional ingredients for 6 h, and subsequently harvested for gene expression profiling. After discarding the mucosal saline with LPS or functional ingredients, 1 mL of TRIzol (Invitrogen, Thermo Fisher Scientific, USA) was added to each apical chamber. Cells were collected by scarping and flushing the membrane inserts 10 times with the TRIzol solution. The cell homogenate was transferred into a 1.5 mL Eppendorf tube, snap frozen in liquid N2 and subsequently stored at −80 °C until RNA extraction. Gene expression levels in RTgutGC cells were compared with those of rainbow trout tissues by using total RNA samples from liver, pyloric, mid and distal intestine obtained from a fresh-water stage female rainbow trout as previously described (29). RNA was subsequently purified using a PureLink RNA mini Kit (Invitrogen, Thermo Fisher Scientific, USA). RNA purity and concentration were measured using an Epoch Microplate Spectrophotometer (BioTeK Instruments, Winooski, USA). The RNA integrity was verified using a 2100 Bioanalyzer in combination with RNA Nano Chip (Agilent Technologies, Santa Clara, USA). First-strand complementary DNA was synthesized from 1.0 μg total RNA from all samples using SuperScript IV VILO Master Mix (Invitrogen™, ThermoFisher Scientific). Negative controls were performed in parallel by omitting RNA or enzyme.
Twelve target genes with important functions related to immunity, barrier function and metabolism were profiled. The qPCR primers were designed using Primer3web software version 4.0.0 (http://primer3.ut.ee/) or obtained from the literature. Primer details are shown in Supplementary Table 3. All primer pairs were first used in gradient reactions in order to determine optimal annealing temperatures. To confirm amplification specificity, the PCR products from each primer pair were subjected to melting curve analysis and visual inspection of the PCR products by agarose gel electrophoresis. PCR efficiency for each gene assay was determined using 2-fold serial dilutions of randomly pooled complementary DNA. The expressions of individual gene targets were analyzed using the LightCycler 96 (Roche Diagnostics, Basel, Switzerland). Each 10 μl DNA amplification reaction contained 2 μl PCR grade water, 2 μl of 1:10 diluted complementary DNA template, 5 μl LightCycler 480 SYBR Green I Master (Roche Diagnostics) and 0.5 μl (10 mM) of each forward and reverse primer. Each sample was assayed in duplicate, including a no-template control. The three-step qPCR run included an enzyme activation step at 95°C (5 min), forty to forty-five cycles at 95°C (10 s), 60°C (10 s), and 72°C (15 s) and a melting curve step. Target gene expression was normalized to the geometric average of beta-actin (actb) and ribosomal protein s20 (rps20) after confirming reference gene intra- and interspecific stability (30). Mean normalized expression of the target genes was calculated from raw Cq values by relative quantification (31).
Cell Proliferation Assay
The ability of RTgutGC cells to close a gap during exposure to LPS, MOS and beta-glucans was investigated in a cell proliferation assay by using 2-well-culture inserts (80241, Ibidi GmbH, Martinsried, Germany). The inserts were placed on a conventional cell culture surface, i.e., a μ-Dish 35 mm (81156, Ibidi GmbH, Martinsried, Germany) creating two wells, which were separated by a rubber partition. Approximately 10,000 cells in 70 μL L-15/C were seeded into each well. The cultures were incubated at 20 °C for 2 days until confluence. Then, the rubber partition was removed to create a 500 μm gap between the cells. Immediately, LPS (50 μg/mL), MOS (4 mg/mL), beta-glucans (100 μg/mL) and PBS (control), all dissolved in L-15 medium, were added to the cultures and phase contrast pictures were captured at day 0, 1, 2, and 4 (or until the gap was closed) using a ZEISS Axio microscope (with Axiocam 105 color). The image were processed using ImageJ (32). In brief, all images were first adjusted using Adjust tool for achieving a clear contrast between the cell-free area and area covered by cells. Subsequently, the cell-free area was measured using Analyze particles tool. The cell proliferation rate was calculated by dividing the cell-free area at each time point with the cell-free area at day 0.
Oxidative Stress Detection and Substrate Uptake Assay
After 3–4 days of culture on conventional 6-well plates, RTgutGC cells were exposed to LPS and the functional ingredients for 6 h. After discarding the mucosal saline with LPS or functional ingredients, cells were harvested by trypsination and centrifugation. Cell pellets were reconstituted in 5% FBS in PBS for ROS generation measurement. CellROX® (C10444, Thermo Fisher, Waltham, USA) reagent was added to the cell suspensions at a final concentration of 5 mM, followed by incubation at room temperature for 30 min. After the incubation, cells were washed three times with ice-cold phosphate buffered saline (PBS) and ROS generation was analyzed by flow cytometry (Beckman Coulter Gallios). At least 10,000 events were collected for each sample. Data were analyzed using Kaluza software v.2.1 (Beckman Coulter) and gated using Side scatter (SSC) (granularity) and Forward scatter (FSC) (size) parameters. Discrimination of aggregates from single cells was performed using side scatter-W (SSC-W) vs. side scatter (SSC). ROS was measured at 650/675 nm (FL3).
Fluorescence conjugated Zymosan (Z23373, Thermo Fisher Scientific, USA) and albumin (Alexa FluorTM 488 Bovine Serum Albumin, Thermo Fisher Scientific, USA) were added into culture media at 20 and 12.5 μg/ml, respectively for cells growing in 6-well-conventional plates. Cells were trypsinized and centrifuged after 1, 1.5, and 3 h after adding substrates, respectively. Cell pellets were reconstituted in 5% FBS in PBS before flow cytometry (Beckman Coulter Gallios) was performed to analyze the cells with or without fluorescence at 495/519 nm.
Immunocytochemistry of F-actin Content
For morphological characterization, confocal laser microscopy was used for imaging. RTgutGC cells in L-15/C were seeded in an 8 chamber tissue cultured treated glass Falcon CultureSlide® (Corning, New York, USA) at a density of 150,000 cells per chamber. When reaching 80% confluence, cells were washed with Dulbecco's Phosphate-Buffered Saline (DPBS) and treated with LPS (50 μg/mL), MOS (4 mg/mL), beta-glucans (100 μg/mL), and PBS (control), all dissolved in L-15 medium. After 6 h, cells were washed with DPBS and fixed with 3% paraformaldehyde (Sigma-Aldrich) for 20 min at 4°C. Following fixation, the cells were permeabilized with 0.1% Triton X-100 (Sigma-Aldrich, St. Louis, USA) for 10 min at room temperature. Cells were then incubated in blocking buffer (BB) (10% goat serum, 3% bovine serum albumin, and 0.1% Triton X-100 in DPBS) for 1 h at room temperature. Afterwards, cells were incubated with phalloidin (R425, Thermo Fisher) for F-acin staining according to the manufacturer's instruction. After staining, cells were washed three times for 3 min with DBPS and left to air dry. Once dry, plastic chambers were removed from the slides. Three drops of mounting medium, Fluoroshield (Sigma-Aldrich), containing DAPI were added to the slides, followed by covering with coverslip. The image was analyzed by ImageJ software to investigate the morphology change of the cells under different treatments. Three random pictures were taken from cells under respective treatments. Individual cell numbers were counted based on DAPI-stained nuclear numbers manually. F-actin contents were subsequently calculated by the total fluorescence intensity of phalloidin divided by number of the cells.
Protein Expression of E-cadherin, Aquaporin 8, and Hsp70 by Western Blot Analysis
RTgutGC cells were seeded on 6-well plates and grown until confluence before 6 h exposure to LPS (50 μg/mL), MOS (4 mg/mL), beta-glucans (100 μg/mL), and PBS (control), all dissolved in L-15 medium. Cells were harvested by trypsinization and centrifugation and protein was extracted using PARIS Kit (AM 1921, Thermo Fisher) according to the manual. Protein concentrations were measured using Bradford protein assay kit (Bio-Rad, Hercules, California, United States) and 10 or 20 μg of the protein were loaded on SDS page gels. After 40 min electrophoresis at 100 voltage, proteins were transferred to PVDF membranes, blocked with 5% dry milk for 1 h at room temperature, and incubated consecutively with E-cadherin monoclonal antibody (#701134, Thermo Fisher), Heat shock protein 70 (Hsp70) monoclonal antibody (MA3-008, Thermo Fisher), or Aquaporin 8 (Aqp8) polyclonal antibody (kindly provided by Prof. Steffen S. Madsen, Institute of Biology, University of Southern Denmark). After 3 times washing in PBS and incubation of HRP conjugated secondary antibody, the signal was visualized with Bio-Rad Gel Doc system after adding ECL detection reagents (GERPN2209, Sigma-Aldrich) to the membrane. Due to the potential influence of treatments on candidate reference protein expression, the total membrane protein content was visualized with Ponceau S (P3504, Sigma) and used as a qualitative loading control.
Statistical Analysis
All data were tested for normality and variance homogeneity using histogram and “residual by predicted” plot, respectively, using JMP Pro 13.0.0 (SAS Institute, United States). When necessary, the data were transformed to achieve normal distribution. Further statistical analyses and graphics were made using GraphPad Prism 7 (GraphPad Software, La Jolla, California, United States). The flow cytometry figures were made by Kaluza (Beckman Coulter). Data of albumin translocation and cell proliferation rate were analyzed using two-way ANOVA using time and treatment as class variables followed by Dunnett multiple comparisons tests. Other data were analyzed using one-way ANOVA followed by Dunnett multiple comparisons tests. Data were calculated as mean ± SEM of two or three independent experiments with 3 or 4 technical well or insert replicates (depending on analytical assays, see specifications in figure legends). Asterisks denote the level of statistical significance (*P < 0.05, **P < 0.01, *** P < 0.001).
Results
Key Features of RTgutGC Cells Exposed in Mucosal Saline in Conventional Culture Plates and Transwell Membranes
Compared with RTgutGC cells cultivated in L-15/C medium, cells cultivated in mucosal saline maintained above 80% cell viability after 12 h exposure (Figure 1A). When RTgutGC cells were grown on transwell membrane inserts in 24-well plates, TEER levels increased steadily and reached about 26 Ω × cm2 after 4 weeks of culture (Figure 1B). After addition of fluorescent albumin to mucosal saline solution in the apical chamber, basolateral fluorescence levels increased steadily with time when no cells were seeded on the membrane whereas with cells, low fluorescence was observed over the 90 min observation period, demonstrating that the RTgutGC cells formed a barrier and strongly attenuated albumin translocation from the apical to the basolateral chamber (Figure 1C). Confocal fluorescence microscopy images of RTgutGC cells grown on conventional culture plates illustrated presence of the tight junction protein Claudin 3 (red) and the nuclei (blue) (Figure 1D).We also investigated the uptake of albumin and zymozan in RTgutGC cells, grown on conventional support, as a character of functional enterocytes. During a time course of 3 h, albumin uptake into RTgutGC cells increased (Figure 1E). However, RTgutGC cells did not take up zymosan as shown in Figure 1F.
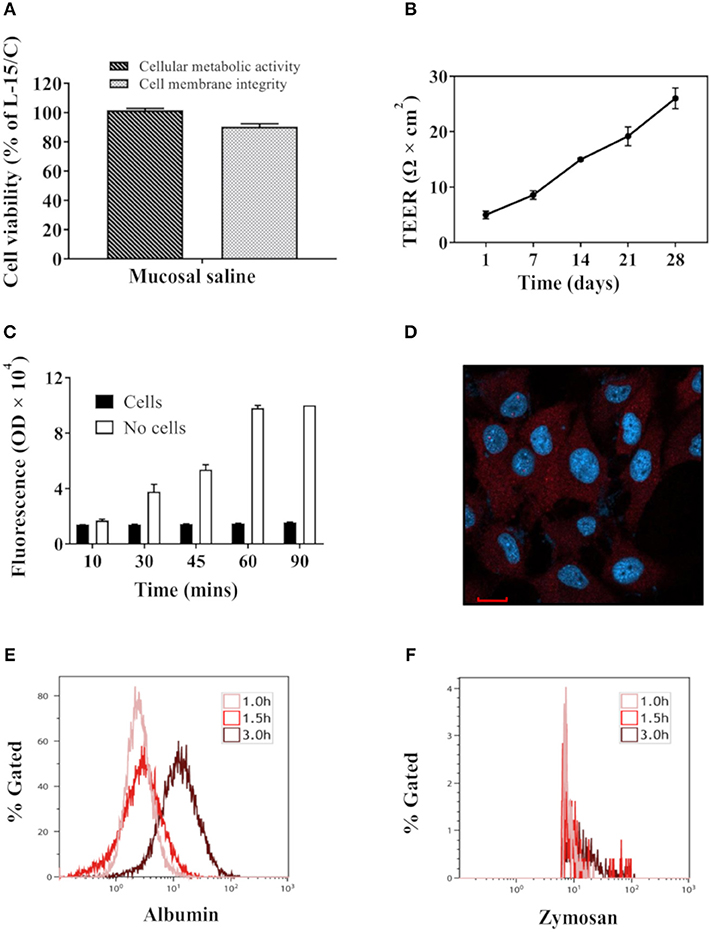
Figure 1. Key features of RTgutGC cells grown on conventional culture plates or transwell membranes. (A) Viability of RTgutGC cells in 24-well-culture plates with 1.5 × 10⁵ cells/mL (78,947 cells per cm2) exposed to mucosal saline for 12 h. (B) TEER of RTgutGC cells grown up to 4 weeks in 24-well-culture plates with membrane inserts at initial density of 8 × 10⁴ cells/mL (71,429 cells per cm2). (C) Fluorescent levels in basolateral media after fluorescent albumin exposure into apical chamber in 24-well-transwell membrane plates with or without RTgutGC cells. (D) Confocal fluorescence microscopy images of the tight junction protein claudin 3 (red) and the nuclei (blue) in RTgutGC cells grown on conventional culture plates. (E,F) Uptake of albumin (E) and zymosan (F) during the 3 h exposure time with cells cultured in conventional 6-well plates. For both panels (E,F), X axis shows the fluorescence signal from albumin or zymosan in cells. Y axis shows the percentage of albumin/zymosan positive cells out of total live cell population. Data represent mean ± SEM of two independent experiments with 3–4 technical replicates each (wells or inserts). Scale bar = 100 μm.
Effects of LPS and Functional Ingredients
Cell Viability
Using a cell viability cut-off level of 80% compared to control cells, 6 h of exposure to 50 μg/mL LPS (Figure 2A), 75 μg/mL nucleotides (Figure 2B), 4 mg/mL MOS (Figure 2C) and 100 μg/mL beta-glucans (Figure 2D) were selected as final working concentration for further analysis.
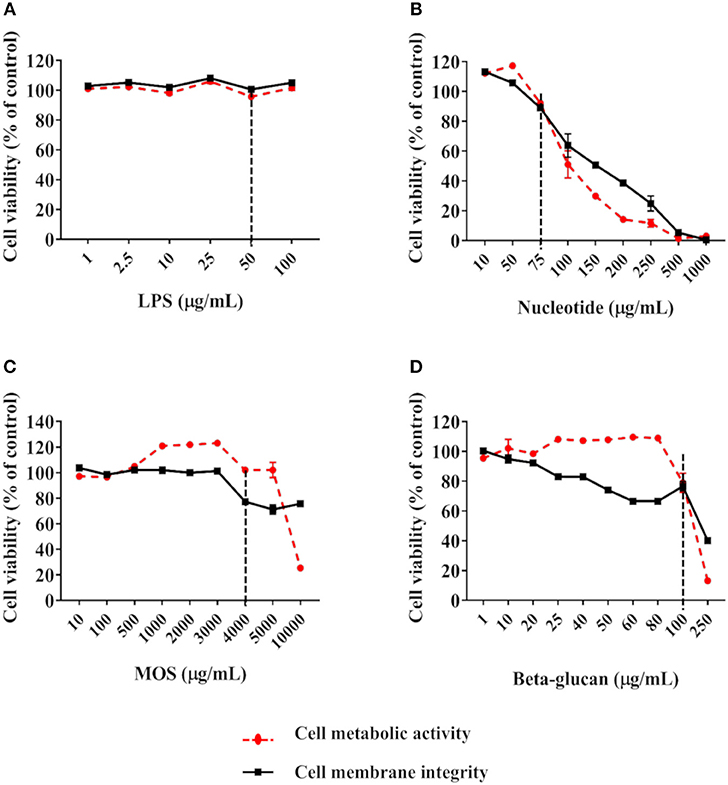
Figure 2. Viability of RTgutGC cells exposed to LPS (A), nucleotides (B), MOS (C), and beta-glucan (D). Breaking lines indicate cut-off level of about 80% cell viability compared to control cells. For LPS, data represent mean ± SEM of two independent experiments with 3 technical well-replicates. For nucleotides, MOS and beta-glucan, two independent experiments with 3 technical well-replicates each and concentrations as shown in Supplementary Table 1 were conducted. For concentrations evaluated in both experiments, data represent mean ± SEM of the two experiments. For concentrations only evaluated in one of the experiments, single mean values are plotted.
TEER and Albumin Translocation
After 6 h of exposure to beta-glucans, TEER levels increased significantly compared to control (Figure 3, P < 0.05). Other treatments had no effect on TEER levels (Figure 3, original TEER values seen in Supplemental Figure 1).
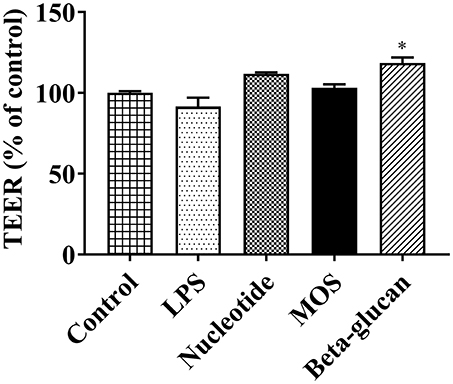
Figure 3. TEER levels of RTgutGC cultures exposed to LPS and functional ingredients in 6-well-transwell membrane inserts for 6 h. Data are expressed as percent of control cells and represent mean + SEM of two independent experiments with 3 technical insert replicates each. Asterisks denote treatment groups statistically different to the control (*P < 0.05).
After 6 h of exposure to MOS increases in basolateral albumin fluorescent levels were observed compared to control cells, significantly at 30 and 60 min time points (P < 0.05). No significant effects on the fluorescent level were observed for other treatments (Figure 4, P > 0.05).
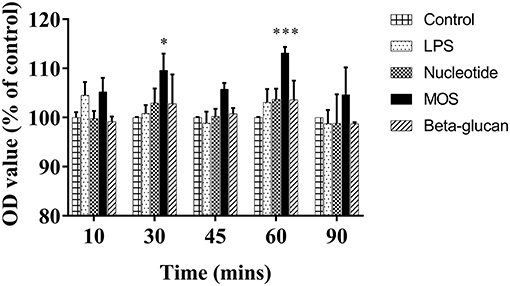
Figure 4. Fluorescent levels in basolateral media after fluorescent albumin exposure into apical chamber in 24-well transwell membrane with RTgutGC cells exposed to LPS and functional ingredients for 6 h. Data are expressed as percent of control cells and represent mean + SEM of two independent experiments with 3 technical insert replicates each. Asterisks denote treatment groups statistically different to the control at the same time point (*P < 0.05, ***P < 0.001).
Brush Border Membrane Enzymatic Activity
Brush border membrane enzyme activities (LAP and maltase) were detected in the RTgutGC cells. There were no significant effects of LPS or any of the functional ingredients on LAP (Figure 5A) or maltase (Figure 5B) activities (P > 0.05).
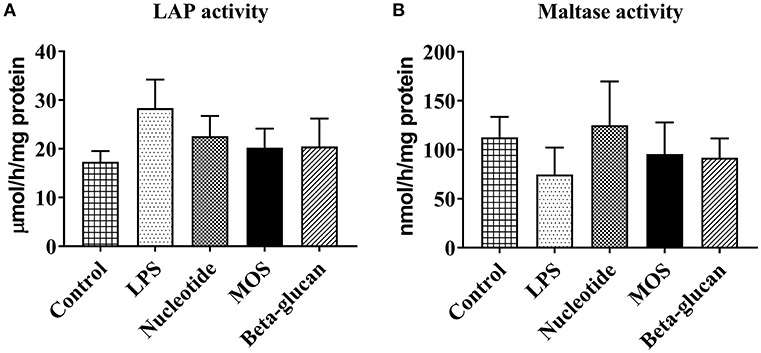
Figure 5. Brush border membrane leucine aminopeptidase (LAP, A) and maltase (B) activity of RTgutGC cells grown on 24-well-conventional culture plates exposed to LPS and functional ingredients. Data represent mean + SEM of two independent experiments with 3 technical well replicates each.
Gene Expression
LPS exposure resulted in markedly increased mRNA levels of several pro-inflammatory cytokines, including interleukin 1β (il1b), interleukin 6 (il6), interleukin 8 (il8), and tumor necrosis factor alpha (tnfa). Furthermore, LPS up-regulated the expression of the tight junction gene Claudin 3 (cldn3, P < 0.001), but suppressed the intestinal alkaline phosphatase (ialp) expression (Figure 6, P < 0.05).
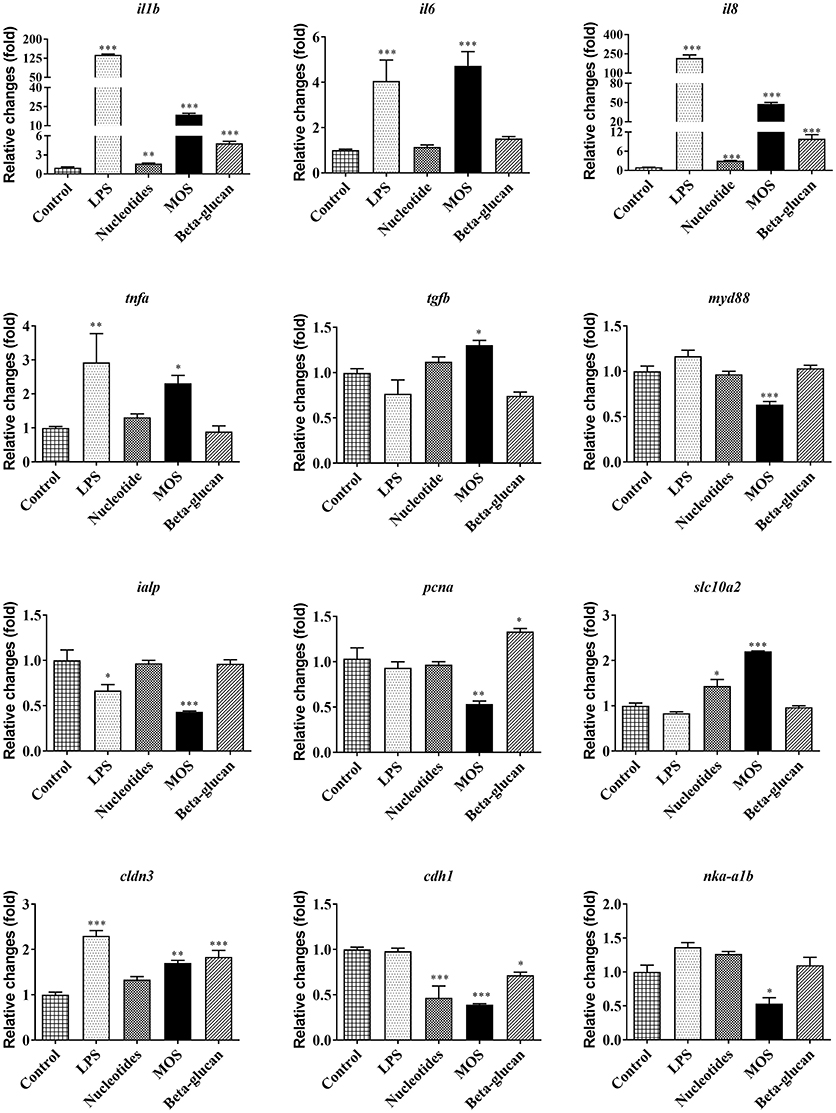
Figure 6. Immune, barrier, and metabolic gene expression in RTgutGC cells grown on 6-well transwell membranes exposed to LPS and functional ingredients. Data are expressed relative to control cell levels and represent mean + SEM of two independent experiments with 3 technical insert replicates each. Asterisks denote treatment groups statistically different to the control (*P < 0.05, **P < 0.01, ***P < 0.001).
Pro-inflammatory cytokine genes (il1b and il8) were significantly increased after exposing cells to functional ingredients, especially MOS (P < 0.01). MOS also produced a significant up-regulation of transforming growth factor beta (tgfb) following 6 h of exposure (P < 0.05) while expression of myeloid differentiation factor 88 (myd88) and proliferating cell nuclear antigen (pcna) were significantly decreased (Figure 6, P < 0.01).
Compared to control, MOS and beta-glucans up-regulated the expression of cldn3 (P < 0.01) while the expression of ialp and Na/K-ATPase (nkaα1b) decreased significantly following exposure to MOS (Figure 6, P < 0.05). There was also a significant decrease in the expression of E-cadherin (cdh1) after exposure to the different functional ingredients (P < 0.05). Gene expression levels of the bile acid transporter solute carrier family 10 member 2 (slc10a2) in RTgutGC cells increased significantly after exposure to nucleotides and MOS (P < 0.05).
In general, immune genes were expressed at comparable relative basal levels in RTgutGC cells as in rainbow trout distal intestinal tissue, whereas most genes related to barrier function and metabolism showed lower relative expression (Supplementary Table 3). Overall, nucleotides produced little or no effect on analytical endpoints related to barrier function and gene expression. In order to reduce costs, we therefore chose to omit nucleotide exposures in the additional analyses outlined below.
Cell Proliferation
In control cells, the gap area of the culture wells was fully closed by day 4 (Figure 7). When treated with LPS or beta-glucans, cells were able to close the gap in a similar pace as in the control cells. In contrast, MOS treatment reduced the cell proliferation and consequently the gap closure rate to < 50% at day 4 as shown in Figure 7.
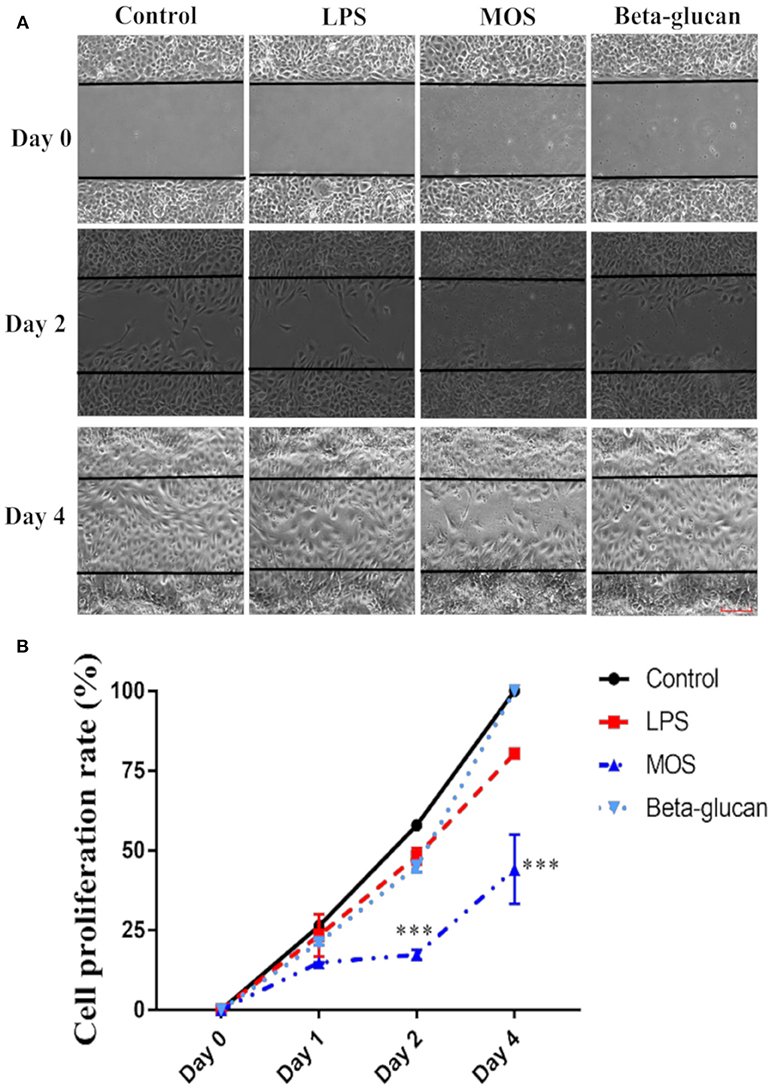
Figure 7. Cell proliferation assay of RTgutGC cells. (A) Cells treated with LPS, MOS and beta-glucan at day 0, 2, and 4 after removal of the gap insert. Representative images of three independent experiments are shown. (B) Quantification of cell proliferation rate at different time points during treatment. Data represent mean ± SEM of three independent experiments with 3 technical well-replicates each. Asterisks denote treatment groups statistically significant different to the control at the same time point (***P < 0.001). Scale bar = 100 μm.
ROS Generation
As shown in Figures 8A–C, viable cell numbers were not affected by treatments, while MOS diminished ROS positive cells markedly (96% decreased, P < 0.001). Moreover, mean fluorescence intensity of ROS in cells were significantly smaller than in other groups (P < 0.001).
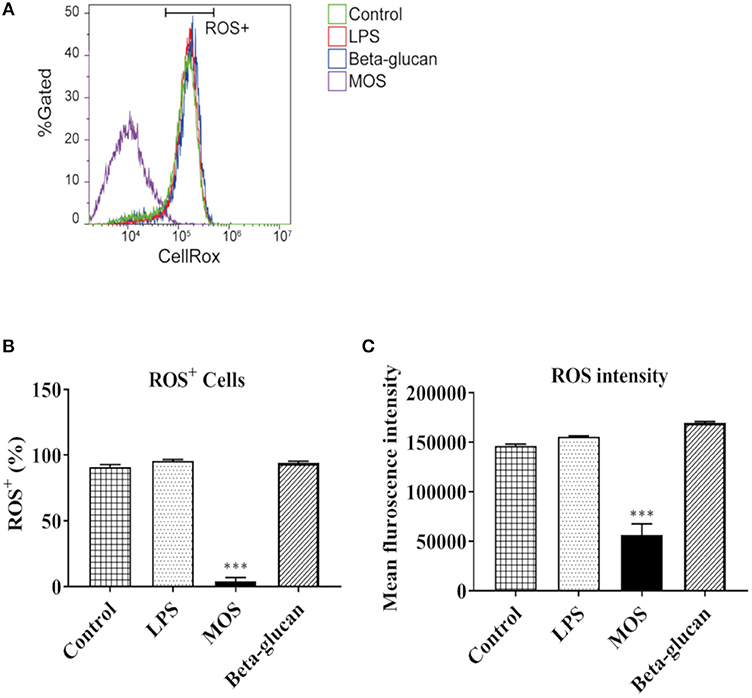
Figure 8. Flow cytometry analysis of reactive oxygen species (ROS) production in RTgutGC cells grown on 6-well conventional plates and exposed to LPS, MOS and beta-glucan for 6 h. (A) Representative histograms of ROS dye fluorescence intensity. X axis shows the CellRox fluorescence signal in cells. Y axis shows the percentage of total live cell population. Horizontal bar indicate ROS positive (ROS+) cells. (B) Statistical analysis of ROS+ cell number under different treatments (C) Mean Fluorescent Intensities of ROS dye in cells under different treatments. Data represent mean + SEM of two independent experiments with 3 technical well-replicates each. Asterisks denote treatment groups statistically significant different to the control (***P < 0.001).
F-actin Content and E-cadherin, Aquaporin 8, and Hsp70 Protein Expression
As shown in Figures 9A,B, intracellular F-actin contents were significantly increased in LPS and beta-glucan groups (P < 0.01), while MOS treated cells remained at control levels. Western blot analyses demonstrated that expressions levels of Aqp8 and Hsp70 were not influenced by any of the treatments. E-cadherin expression was increased in cells treated with LPS, but decreased in beta-glucan and MOS treated groups (P < 0.01) (Figure 10).
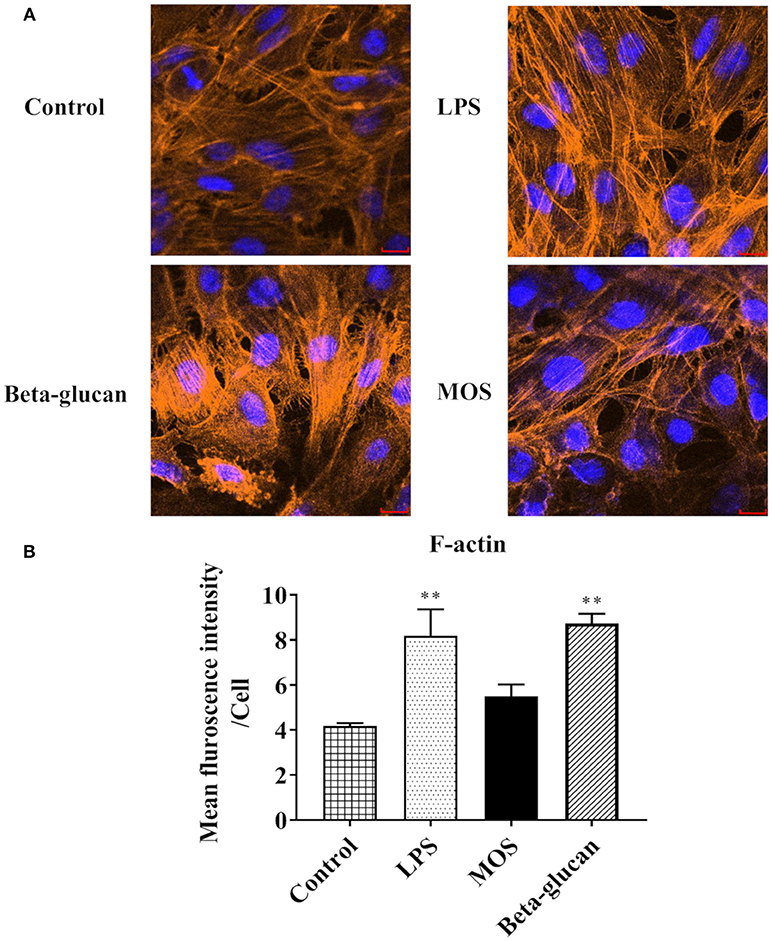
Figure 9. RTgutGC cell morphology after treatments with LPS, MOS, and beta-glucan. (A) Staining of cell nuclei (blue) and skeleton (orange) after 6 h exposure to stimulants. (B) Mean Fluorescent Intensities (MFI) of RTgutGC skeleton (F-actin). Data represent mean + SEM of three independent experiments, with 3 technical replicates each. Asterisks denote treatment groups statistically significant different to the control (**P < 0.01). Scale bar = 100 μm.
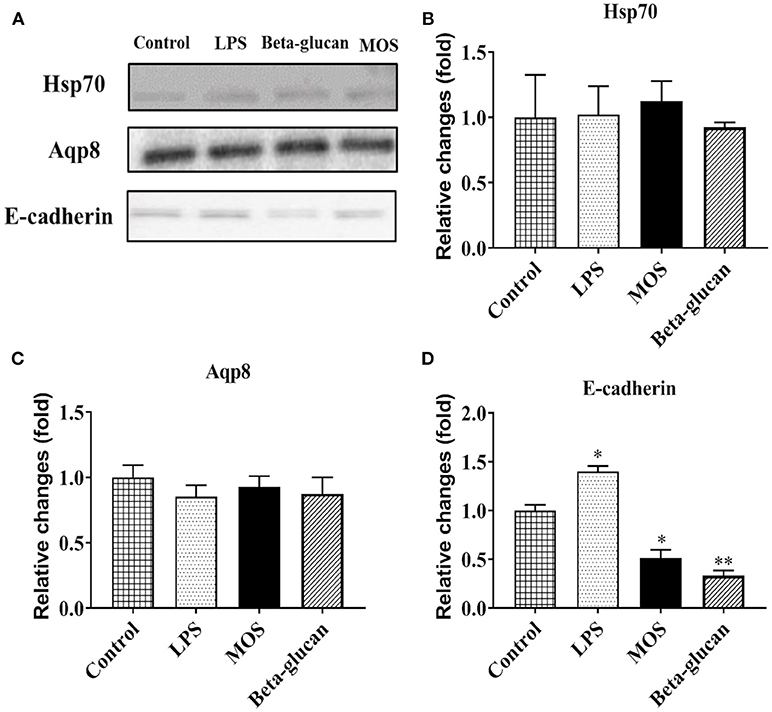
Figure 10. (A) Representative Western blot pictures for target proteins. Statistical analysis of protein expression levels of heat shock protein 70 (hsp70, B), aquaporin 8 (Aqp8, C), and e-cadherin (D). Data represent mean + SEM from two or three independent experiments with 3 technical replicates each. Asterisks denote treatment groups statistically significant different to the control (*P < 0.05, **P < 0.01). Full scans of the entire original blots are shown in Supplementary Figure 2.
Discussion
Well-characterized in vitro model systems offer many benefits for screening purposes, given their simplicity and relative inexpensiveness compared to experiments using live animals. They could also serve as essential tools to increase the knowledge of cellular and molecular mechanisms underlying effects observed in animal trials. In the present work, we have continued the ongoing characterization of the first established intestinal epithelial cell line from fish, RTgutGC (18) and evaluated its suitability as an in vitro model for studies of effects of LPS and functional feed ingredients.
Functional Characterization of RTgutGC Cells
Based on previously established RTgutGC cell features (18–23, 33), we first confirmed the viability and barrier function of the RTgutGC cells when grown on transwell membranes. Barrier formation was assessed by TEER measurements and fluorescent albumin translocation from the apical to basolateral cell chamber. TEER levels in the present study were comparable to those reported previously (19, 20). We also observed a strong and time-dependent increase in basolateral fluorescence of albumin in wells without cells, whereas low and stable values were observed for wells with cells. Thus, our observations confirmed earlier reports (20, 33) demonstrating that RTgutGC cells grown on permeable inserts strongly attenuate fluorescent model molecules' translocation from apical to basolateral chamber. RTgutGC barrier function was further supported by related gene and protein expression (cldn3, cdh1, Claudin 3) as previously demonstrated (19, 20, 22). We also confirmed the findings by Minghetti and co-workers (20) by demonstrating the viability of the RTgutGC cells when exposed to a buffer designed to mimic the intestinal lumen (25), i.e., mucosal saline. Another indication that the RTgutGC cells function as enterocytes is the presence of brush border membrane enzymatic activity. Previous studies have demonstrated that RTgutGC cells possess alkaline phosphatase activity (18). In the current work, we continued to explore RTgutGC brush border features by measuring activity levels of two important brush border digestive enzymes, i.e., LAP and maltase. Activity of both these enzymes were detected in the RTgutGC cells. Higher LAP activity, but very low maltase activity, were found compared to the results of in vivo tests (34). Altogether, the current re-establishment of key barrier and brush border features demonstrates the robustness of the RTgutGC transwell system and shows that RTgutGC cells develop certain intestinal functions similar to the in vivo situation.
Effects of LPS Exposure on RTgutGC
We continued to explore RTgutGC cell immune function by detailed exposures to a prototype PAMP, i.e., LPS. LPS showing no effect on cell viability at concentrations up to 100 μg/mL is in line with previous reports suggesting that fish cells without TLR4/CD14 signaling system may be less responsive to LPS compared to mammalian cells (18, 35, 36). The LPS used in the present study was derived from E. coli, and it is possible that LPS isolated from a fish pathogen could be more potent in RTgutGC cells. Anyhow, the final working concentration (50 μg/mL LPS) was clearly sufficient to induce immune-related gene expression responses and influence cell proliferation and F-actin contents of RTgutGC cells in this study.
The epithelial cells of the intestinal tract are in direct contact with the external environment of the gut lumen and must be prepared to mount an immune response against antigens and infections agents of dietary origin. It is well-known that intestinal epithelial cells of teleost fish produce several innate immune defense factors, and they can over-express pro-inflammatory cytokines following a bacterial infection (23). In the present study, LPS produced markedly elevated levels of pro-inflammatory cytokine gene expression (il1b, il6, il8, and tnfa). The data point toward RTgutGC immunocompetence, and demonstrate that RTgutGC cells possess the ability and transcriptional apparatus to mount an innate immune response against LPS, a common model PAMP. There are, to our knowledge, no published studies on spatial immune gene expression patterns along the rainbow trout intestinal tract. Given that the RTgutGC cell line was initially isolated from the distal intestine (18), which is believed to be a specific intestinal region for certain mucosal immune functions (29), it is interesting to note that RTgutGC relative immune gene expression were found at comparable levels as in the distal intestine of rainbow trout (Supplementary Table 3). Induced immune transcriptional responses to pathogen infection have previously been observed in human intestinal epithelial cells (37). In fish, similar effects of LPS on innate immune related gene expression have been observed also in head kidney leukocytes of rainbow trout (9). Moreover, LPS has been reported to up-regulate tnfa gene expression in RTgutGC cells grown on conventional culture plates (18). Intestinal alkaline phosphatase (Ialp) is an important apical brush border enzyme, which has been found to lower the expression of pro-inflammatory cytokines by inhibiting the activation and translocation of their master transcription factor NF-κB (38). LPS is a reported substrate for Ialp (38), and in the current work, LPS suppressed ialp expression. This response could reflect the interplay between LPS, Ialp and pro-inflammatory cytokine signaling.
Effects of Functional Feed Ingredients on RTgutGC
Our strategy for determining the final exposure concentrations of the functional ingredients was based on measurements of cell viability. When applied at high concentration, all functional ingredients significantly reduced cell viability in RTgutGC cells. We chose our final exposure concentrations at levels that maintained 80% cell viability as compared to control cells, with the underlying assumption that these cells were in a healthy state and could exert true physiological responses to the functional ingredients. It should be noted that the cell viability assays were performed with cells grown on conventional plates, and we therefore assume similar responses to the stimulants in cell grown on membrane inserts.
In two-compartment epithelial cell in vitro systems, increased TEER levels are interpreted as an increase in epithelial barrier tightness. In the present study, beta-glucans increased TEER values, whereas no significant effects were observed for nucleotides or MOS exposure. In contrast, MOS treatment increased albumin translocation across the RTgutGC monolayer, indicative of a reduced barrier function that could be attributed to alterations in both transcellular and paracellular routes. The relative proportion of trans- and paracellular translocation of albumin remains unknown, and should be explored in future studies, for example by detailed studies of albumin uptake kinetics into RTgutGC cells grown on permeable supports. Of note, we demonstrated that albumin was indeed taken up by the RTgutGC cells when grown on conventional supports, whereas no uptake of the larger molecule zymosan was detected. For junction barrier related gene expression, all functional ingredients suppressed cdh1 levels and all ingredients except nucleotides increased cldn3. The suppressed cdh1 levels in cells treated with MOS and beta-glucan were also mirrored by decreases at the protein expression level. In Caco-2 cells, decreases in cldn3 mRNA levels were observed in concert with increase in paracellular permeability and a reduction in TEER (39). Similarly, the observed decreases in adherence junction-related cdh1 expression would be expected to loosen the junction barrier and increase paracellular permeability. In vivo, MOS supplementation to fish has in several independent studies been found to improve microvilli integrity in terms of microvilli density (12) and length (12, 40, 41). In European seabass, MOS treatment enlarged intestinal fold height and reduced gut bacterial translocation, demonstrative of MOS effects on epithelial barrier function (42). Furthermore, beneficial physiological effects on epithelial cells of fish fed MOS could be a result of increasing mucus secretion (43), viscoelasticity of the mucus (44) or induced tight junction closure (ZO-1, occluding or E-cadherin) (45). To our knowledge, there are no published studies of effects of MOS on gut epithelial barrier or tight junction function in rainbow trout. The findings of TEER, albumin translocation, and junction barrier related gene and protein expression in the present study may point to how MOS can act as homeostatic balancer of barrier function in vivo and in vitro (46).
RTgutGC cell proliferation was assessed by a previously established cell proliferation assay (22). RTgutGC cells had the ability to close the cell free gap in 4 days in this study, which was faster than in a previous report, possibly due to different culture conditions (22). During the 4-day period, MOS strongly reduced the cell proliferation speed compared to control. In addition, MOS significantly suppressed ROS production compared with control cells. ROS plays important roles in homeostasis and cell signaling, and ROS levels typically increase during periods of environmental stress and may cause significant damage to cell structures (47). Whether the MOS-induced decrease in RTgutGC proliferation ability could be a result of reduction in stress fibers and suppressed ROS production as previously reported (48, 49) warrants further investigation. Pcna plays an important role in cell proliferation (50). MOS also down-regulated pcna gene expression in the present study, confirming the cell proliferation assay results indicating that MOS inhibited cell proliferation (50).
Functional ingredients are expected to exert immune-modulatory effects in the intestine by regulating the expression of cytokines (2, 7, 10, 51). Among the functional ingredients evaluated in the present work, MOS seemed to be the most potent modulator of RTgutGC immune responses. Specifically, MOS treatment induced levels of pro-inflammatory (il1b, il6, il8, and tnfa) and tgfb cytokine transcripts, but suppressed myd88 expression. In particular, the alterations of pro-inflammatory cytokine gene expression and the suppression of ialp mirrored the effect of LPS. In vivo, dietary MOS in European sea bass can provide protection against Vibrio alginolyticus infection (52) and counteract the side effects of soybean meal oil by increasing the mucus cell density and area in the distal intestine and regulating GALT-related genes (i.e. il6, il10, and tgfb) (46). MOS supplementation to rainbow trout was also found to improve lysozyme concentration, classical pathway of complement (APCA and CPCA) (53), microvilli structure and absorptive surface area (12). Whether the immune-modulatory effects induced by MOS in the present study having any relation to the increase in epithelial permeability is a question that clearly warrants attention in future studies. Possibly, the increased permeability could lead to an increased antigen influx that would trigger mucosal immune responses, including modulation of cytokine expression.
Beta-glucan is one of the potent and promising immunostimulants in aquaculture which could be beneficial for growth, disease resistance and immune response of a range of fish species including rainbow trout (54–56). In vitro, beta-glucans were found to have positive effects on neutrophil degranulation of fathead minnows (57) and respiratory burst activity of Atlantic salmon (58). In the present study, beta-glucan treatment also produced increased mRNA levels of pro-inflammatory cytokine genes (il1b and il8). This observation is in agreement with previous studies demonstrating that beta-glucans up-regulated pro-inflammatory cytokine expression in head kidney cells of rainbow trout (9) and increased il1b expression in Atlantic cod after challenged with Vibrio anguillarum (10). A previous report also found that il1b production was induced by cathelicidin-2 variants and il1b expression upregulation was elicited by a synergic effect of zymosan and cathelicidin-2 variants in RTgutGC cells (23). Beta-glucan lowered transactivation of NF-κB to stimulate immune response was also found in Caco-2 cells (15). Whether the expression of il1b and il8 is affected by the cathelicidin-2 variants or the activation of NF-κB in RTgutGC still needs to be explored in future studies. In vivo, the expression of il8 was not affected significantly in the distal intestine of Atlantic cod fed beta-glucans (10), which is different from our findings. Available literature suggests that beta-glucans may regulate inflammatory effects in an inconsistent pattern, possibly depending on the differences of composition, dosage, quality, route, and exposure time (11, 23, 54, 59). Nucleotides also produced elevated levels of il1b and il8, but the degree of response was minor compared to the other functional ingredients evaluated in the current study. Previous in vivo tests have found that dietary nucleotides might improve growth, disease resistance against S. iniae and pancreatic necrosis, serum alternative complement activity, serum lysozyme activity and crowding stress of rainbow trout (60–62) and influence macrophage activity, respiratory burst activity and expression of il1b, il8, and tnfa in turbot (63). However, the mechanism of growth and immune promotion by nucleotides still need to be identified in vitro or in vivo tests.
Conclusion
An increasing body of literature demonstrates that functional feed ingredients can support intestinal health and reduce disease susceptibility via multiple mechanisms, including direct effects on a variety of intestinal functions, e.g., barrier function, nutrient transport and immune responses (7, 23, 64–66). In fish, knowledge about basic mechanisms of functional ingredients and their interactions with the intestinal tissue is weak and fragmentary. The present study has provided new information on how functional ingredients commonly applied in aquafeeds can affect intestinal epithelial function in fish. Additionally, our study demonstrates the suitability of the RTgutGC transwell system as an alternative to fish feeding experiments for prediction of health effects of functional feeds.
Author Contributions
JW, PL, AG, YY, ÅK, and TK: experiment design; JW, PL, AG, LL, YY, and TK: analyses; KS, LM, MØ, ÅK, and TK: supervision; JW and TK: writing, original draft; JW, PL, AG, LL, YY, KS, LM, MØ, ÅK, and TK: writing, review, and editing.
Funding
JW was funded by China Scholarship Council (CSC). YY was funded by a Post-Doctoral fellowship issued by the Norwegian University of Life Sciences. The work was also funded by Foods of Norway, a Center for Research-based Innovation by the Research Council of Norway: grant no. 237841/030.
Conflict of Interest Statement
The authors declare that the research was conducted in the absence of any commercial or financial relationships that could be construed as a potential conflict of interest.
Acknowledgments
We wish to thank Ellen Hage and Kirsti Præsteng for technical assistance in enzyme activity measurements.
Supplementary Material
The Supplementary Material for this article can be found online at: https://www.frontiersin.org/articles/10.3389/fimmu.2019.00152/full#supplementary-material
References
1. Grosell M, Farrell AP, Brauner CJ. Fish Physiology: The Multifunctional Gut of Fish: London: Academic Press (2010)
2. Kiron V. Fish immune system and its nutritional modulation for preventive health care. Anim Feed Sci Tech. (2012) 173:111–33. doi: 10.1016/j.anifeedsci.2011.12.015
3. Ringø E, Zhou Z, Vecino JLG, Wadsworth S, Romero J, Krogdahl Å , et al. Effect of dietary components on the gut microbiota of aquatic animals. A never-ending story? Aquacul Nutr. (2016) 22:219–82. doi: 10.1111/anu.12346
4. Torrecillas S, Montero D, Izquierdo M. Improved health and growth of fish fed mannan oligosaccharides: potential mode of action. Fish Shellfish Immunol. (2014) 36:525–44. doi: 10.1016/j.fsi.2013.12.029
5. Carbone D, Faggio C. Importance of prebiotics in aquaculture as immunostimulants. Effects on immune system of Sparus aurata and Dicentrarchus labrax. Fish Shellfish Immunol. (2016) 54:172–8. doi: 10.1016/j.fsi.2016.04.011
6. Merrifield DL, Dimitroglou A, Foey A, Davies SJ, Baker RTM, Bøgwald J , et al. The current status and future focus of probiotic and prebiotic applications for salmonids. Aquaculture (2010) 302:1–18. doi: 10.1016/j.aquaculture.2010.02.007
7. Tacchi L, Bickerdike R, Douglas A, Secombes CJ, Martin SA. Transcriptomic responses to functional feeds in Atlantic salmon (Salmo salar). Fish Shellfish Immunol. (2011) 31:704–15. doi: 10.1016/j.fsi.2011.02.023
8. Gil A. Modulation of the immune response mediated by dietary nucleotides. Eur J Clin Nutr. (2002) 56:S1–4. doi: 10.1038/sj.ejcn.1601475
9. Chettri JK, Raida MK, Holten-Andersen L, Kania PW, Buchmann K. PAMP induced expression of immune relevant genes in head kidney leukocytes of rainbow trout (Oncorhynchus mykiss). Dev Comp Immunol. (2011) 35:476–82. doi: 10.1016/j.dci.2010.12.001
10. Lokesh J, Fernandes JM, Korsnes K, Bergh O, Brinchmann MF, Kiron V. Transcriptional regulation of cytokines in the intestine of Atlantic cod fed yeast derived mannan oligosaccharide or beta-glucan and challenged with Vibrio anguillarum. Fish Shellfish Immunol. (2012) 33:626–31. doi: 10.1016/j.fsi.2012.06.017
11. Skov J, Kania PW, Holten-Andersen L, Fouz B, Buchmann K. Immunomodulatory effects of dietary beta-1,3-glucan from Euglena gracilis in rainbow trout (Oncorhynchus mykiss) immersion vaccinated against Yersinia ruckeri. Fish Shellfish Immunol. (2012) 33:111–20. doi: 10.1016/j.fsi.2012.04.009
12. Dimitroglou A, Merrifield DL, Moate R, Davies SJ, Spring P, Sweetman J , et al. Dietary mannan oligosaccharide supplementation modulates intestinal microbial ecology and improves gut morphology of rainbow trout, Oncorhynchus mykiss (Walbaum) J Anim Sci. (2009) 87:3226–34. doi: 10.2527/jas.2008-1428
13. Hermes RG, Manzanilla EG, Martin-Orue SM, Perez JF, Klasing KC. Influence of dietary ingredients on in vitro inflammatory response of intestinal porcine epithelial cells challenged by an enterotoxigenic Escherichia coli (K88). Comp Immunol Microbiol Infect Dis. (2011) 34:479–88. doi: 10.1016/j.cimid.2011.08.006
14. He Y, Chu SH, Walker WA. Nucleotide supplements alter proliferation and differentiation of cultured human (Caco-2) and rat (IEC-6) intestinal epithelial cells. J Nutr. (1993) 123:1017–27. doi: 10.1093/jn/123.6.1017
15. Volman JJ, Helsper JP, Wei S, Baars JJ, van Griensven LJ, Sonnenberg AS , et al. Effects of mushroom-derived beta-glucan-rich polysaccharide extracts on nitric oxide production by bone marrow-derived macrophages and nuclear factor-kappaB transactivation in Caco-2 reporter cells: can effects be explained by structure? Mol Nutr Food Res. (2010) 54:268–76. doi: 10.1002/mnfr.200900009
16. Amasheh M, Salah S, Amasheh S, Joachim M, Zeitz M, Fromm M. Quercetin enhances epithelial barrier function and increases claudin-4 expression in Caco-2 cells. J Nutr. (2008) 138:1067–73. doi: 10.1093/jn/138.6.1067
17. Amasheh M, Andres S, Amasheh S, Fromm M, Schulzke JD. Barrier effects of nutritional factors. Ann NY Acad Sci. (2009) 1165:267–73. doi: 10.1111/j.1749-6632.2009.04063.x
18. Kawano A, Haiduk C, Schirmer K, Hanner R, Lee LEJ, Dixon B , et al. Development of a rainbow trout intestinal epithelial cell line and its response to lipopolysaccharide. Aquacul Nutr. (2011) 17:e241–e52. doi: 10.1111/j.1365-2095.2010.00757.x
19. Geppert M, Sigg L, Schirmer K. A novel two-compartment barrier model for investigating nanoparticle transport in fish intestinal epithelial cells. Environ Sci Nano (2016) 3:388–95. doi: 10.1039/c5en00226e
20. Minghetti M, Drieschner C, Bramaz N, Schug H, Schirmer K. A fish intestinal epithelial barrier model established from the rainbow trout (Oncorhynchus mykiss) cell line, RTgutGC. Cell Biol Toxicol. (2017) 33:539–55. doi: 10.1007/s10565-017-9385-x
21. Kawano A. (2009) Developing and Characterizing a Salmonid Intestinal Epithelial Cell Line for Use in Studies of Inflammation in the Fish Gastrointestinal Tract. Master's thesis. University of Waterloo.
22. Pumputis PG. (2017) Development of RTgutGC as a Tool for Fish Feed Development. Master′s thesis. University of Waterloo.
23. Schmitt P, Wacyk J, Morales-Lange B, Rojas V, Guzman F, Dixon B , et al. Immunomodulatory effect of cathelicidins in response to a beta-glucan in intestinal epithelial cells from rainbow trout. Dev Comp Immunol. (2015) 51:160–9. doi: 10.1016/j.dci.2015.03.007
24. Schirmer K, Chan A, Greenberg B, Dixon D, Bols N. Methodology for demonstrating and measuring the photocytotoxicity of fluoranthene to fish cells in culture. Toxi in vitro (1997) 11:107–19.
25. Genz J, Esbaugh AJ, Grosell M. Intestinal transport following transfer to increased salinity in an anadromous fish (Oncorhynchus mykiss). Comp Biochem Physiol A Mol Integr Physiol. (2011) 159:150–8. doi: 10.1016/j.cbpa.2011.02.011
26. Schirmer K, Dixon D, Greenberg B, Bols N. Ability of 16 priority PAHs to be directly cytotoxic to a cell line from the rainbow trout gill. Toxicology (1998) 127:129–41.
27. Krogdahl A, Bakke-McKellep AM, Baeverfjord G. Effects of graded levels of standard soybean meal on intestinal structure, mucosal enzyme activities, and pancreatic response in Atlantic salmon (Salmo salar L.). Aquaculture Nutr. (2003) 9:361–71. doi: 10.1046/j.1365-2095.2003.00264.x
29. Venold FF, Penn MH, Krogdahl A, Overturf K. Severity of soybean meal induced distal intestinal inflammation, enterocyte proliferation rate, and fatty acid binding protein (Fabp2) level differ between strains of rainbow trout (Oncorhynchus mykiss). Aquaculture (2012) 364:281–92. doi: 10.1016/j.aquaculture.2012.08.035
30. Kortner TM, Valen EC, Kortner H, Marjara IS, Krogdahl A, Bakke AM. Candidate reference genes for quantitative real-time PCR (qPCR) assays during development of a diet-related enteropathy in Atlantic salmon (Salmo salar L.) and the potential pitfalls of uncritical use of normalization software tools. Aquaculture (2011) 318:355–63. doi: 10.1016/j.aquaculture.2011.05.038
31. Muller PY, Janovjak H, Miserez AR, Dobbie Z. Processing of gene expression data generated by quantitative real-time RT-PCR. Biotechniques (2002) 32:1372–4.
32. Schneider CA, Rasband WS, Eliceiri KW. NIH Image to ImageJ: 25 years of image analysis. Nat Methods (2012) 9:671–5. doi: 10.1038/nmeth.2089
33. Drieschner C, Minghetti M, Wu SM, Renaud P, Schirmer K. Ultrathin alumina membranes as scaffold for epithelial cell culture from the intestine of rainbow trout. ACS Appl Mater Inter. (2017) 9:9496–505. doi: 10.1021/acsami.7b00705
34. Krogdahl Å, Sundby A, Olli JJ. Atlantic salmon (Salmo salar) and rainbow trout (Oncorhynchus mykiss) digest and metabolize nutrients differently. Effects of water salinity and dietary starch level. Aquaculture (2004) 229:335–60. doi: 10.1016/s0044-8486(03)00396-x
35. Iliev DB, Roach JC, Mackenzie S, Planas JV, Goetz FW. Endotoxin recognition: in fish or not in fish? FEBS Lett. (2005) 579:6519–28. doi: 10.1016/j.febslet.2005.10.061
36. Chin AC, Flynn AN, Fedwick JP, Buret AG. The role of caspase-3 in lipopolysaccharide-mediated disruption of intestinal epithelial tight junctions. Can J Physiol Pharmacol. (2006) 84:1043–50. doi: 10.1139/y06-056
37. Baldwin DN, Vanchinathan V, Brown PO, Theriot JA. A gene-expression program reflecting the innate immune response of cultured intestinal epithelial cells to infection by Listeria monocytogenes. Genome Biol. (2002) 4:R2. doi: 10.1186/gb-2002-4-1-r2
38. Fawley J, Gourlay DM. Intestinal alkaline phosphatase: a summary of its role in clinical disease. J Surg Res. (2016) 202:225–34. doi: 10.1016/j.jss.2015.12.008
39. McLaughlin J, Padfield PJ, Burt JPH, O'Neill CA. Ochratoxin A increases permeability through tight junctions by removal of specific claudin isoforms. Am J Physiol-Cell Physiol. (2004) 287:C1412–C7. doi: 10.1152/ajpcell.00007
40. Yilmaz E, Genc MA, Genc E. Effects of dietary mannan oligosaccharides on growth, body composition, and intestine and liver histology of rainbow trout, Oncorhynchus mykiss. Isr J Aqua–Bam. (2007) 59:182.e8.
41. Salze G, McLean E, Schwarz M, Craig S. Dietary mannan oligosaccharide enhances salinity tolerance and gut development of larval cobia. Aquaculture (2008) 274:148–52. doi: 10.1016/j.aquaculture.2007.11.008
42. Torrecillas S, Makol A, Benitez-Santana T, Caballero MJ, Montero D, Sweetman J , et al. Reduced gut bacterial translocation in European sea bass (Dicentrarchus labrax) fed mannan oligosaccharides (MOS). Fish Shellfish Immunol. (2011) 30:674–81. doi: 10.1016/j.fsi.2010.12.020
43. Torrecillas S, Makol A, Caballero MJ, Montero D, GinÉS R, Sweetman J , et al. Improved feed utilization, intestinal mucus production and immune parameters in sea bass (Dicentrarchus labrax) fed mannan oligosaccharides (MOS). Aquaculture Nutr. (2011) 17:223–33. doi: 10.1111/j.1365-2095.2009.00730.x
44. Schroers V, van der Marel M, Neuhaus H, Steinhagen D. Changes of intestinal mucus glycoproteins after peroral application of Aeromonas hydrophila to common carp (Cyprinus carpio). Aquaculture (2009) 288:184–9. doi: 10.1016/j.aquaculture.2008.12.013
45. Torrecillas S, Makol A, Betancor MB, Montero D, Caballero MJ, Sweetman J , et al. Enhanced intestinal epithelial barrier health status on European sea bass (Dicentrarchus labrax) fed mannan oligosaccharides. Fish Shellfish Immunol. (2013) 34:1485–95. doi: 10.1016/j.fsi.2013.03.351
46. Torrecillas S, Montero D, Caballero MJ, Pittman KA, Custodio M, Campo A , et al. Dietary mannan oligosaccharides: counteracting the side effects of soybean meal oil inclusion on european sea bass (Dicentrarchus labrax) gut health and skin mucosa mucus production? Front Immunol. (2015) 6:397. doi: 10.3389/fimmu.2015.00397
47. Faggio C, Pagano M, Alampi R, Vazzana I, Felice MR. Cytotoxicity, haemolymphatic parameters, and oxidative stress following exposure to sub-lethal concentrations of quaternium-15 in Mytilus galloprovincialis. Aquat Toxical. (2016) 180:258–65. doi: 10.1016/j.aquatox.2016.10.010
48. Vallenius T. Actin stress fibre subtypes in mesenchymal-migrating cells. Open Biol. (2013) 3:130001. doi: 10.1098/rsob.130001
49. Zimmerman NP, Kumar SN, Turner JR, Dwinell MB. Cyclic AMP dysregulates intestinal epithelial cell restitution through PKA and RhoA. Inflamm Bowel Dis. (2012) 18:1081–91. doi: 10.1002/ibd.21898
50. Dezfuli BS, Giari L, Lui A, Squerzanti S, Castaldelli G, Shinn AP , et al. Proliferative cell nuclear antigen (PCNA) expression in the intestine of Salmo trutta trutta naturally infected with an acanthocephalan. Parasit Vectors (2012) 5:198. doi: 10.1186/1756-3305-5-198.
51. Iswarya A, Vaseeharan B, Anjugam M, Gobi N, Divya M, Faggio C. beta-1, 3 glucan binding protein based selenium nanowire enhances the immune status of Cyprinus carpio and protection against Aeromonas hydrophila infection. Fish Shellfish Immunol. (2018) 83:61–75. doi: 10.1016/j.fsi.2018.08.057
52. Torrecillas S, Makol A, Caballero MJ, Montero D, Dhanasiri AK, Sweetman J , et al. Effects on mortality and stress response in European sea bass, Dicentrarchus labrax (L.), fed mannan oligosaccharides (MOS) after Vibrio anguillarum exposure. J Fish Dis. (2012) 35:591–602. doi: 10.1111/j.1365-2761.2012.01384.x
53. Staykov Y, Spring P, Denev S, Sweetman J. Effect of a mannan oligosaccharide on the growth performance and immune status of rainbow trout (Oncorhynchus mykiss). Aquaculture Inter. (2007) 15:153–61. doi: 10.1007/s10499-007-9096-z
54. Meena DK, Das P, Kumar S, Mandal SC, Prusty AK, Singh SK , et al. Beta-glucan: an ideal immunostimulant in aquaculture (a review). Fish Physiol Biochem. (2013) 39:431–57. doi: 10.1007/s10695-012-9710-5
55. Verlhac V, Gabaudan J, Obach A, Schuep W, Hole R. Influence of dietary glucan and vitamin C on non-specific and specific immune responses of rainbow trout (Oncorhynchus mykiss). Aquaculture (1996) 143:123–33. doi: 10.1016/0044-8486(95)01238-9
56. Sealey WM, Barrows FT, Hang A, Johansen KA, Overturf K, LaPatra SE , et al. Evaluation of the ability of barley genotypes containing different amounts of beta-glucan to alter growth and disease resistance of rainbow trout Oncorhynchus mykiss. Anim Feed Sci Tec. (2008) 141:115–28. doi: 10.1016/j.anifeedsci.2007.05.022
57. Palic D, Andreasen CB, Herolt DM, Menzel BW, Roth JA. Immunomodulatory effects of beta-glucan on neutrophil function in fathead minnows (Pimephales promelas Rafinesque, 1820). Dev Comp Immunol. (2006) 30:817–30. doi: 10.1016/j.dci.2005.11.004
58. Bridle A, Carter C, Morrison R, Nowak B. The effect of β-glucan administration on macrophage respiratory burst activity and Atlantic salmon, Salmo salar L., challenged with amoebic gill disease–evidence of inherent resistance. J Fish Dis. (2005) 28:347–56. doi: 10.1111/j.1365-2761.2005.00636.x
59. Ringø E, Erik Olsen R, Gonzalez Vecino JL, Wadsworth S. Use of Immunostimulants and nucleotides in aquaculture: a review. J Marine Sci Res Dev. (2012) 2:104. doi: 10.4172/2155-9910.1000104
60. Tahmasebi-Kohyani A, Keyvanshokooh S, Nematollahi A, Mahmoudi N, Pasha-Zanoosi H. Dietary administration of nucleotides to enhance growth, humoral immune responses, and disease resistance of the rainbow trout (Oncorhynchus mykiss) fingerlings. Fish Shellfish Immunol. (2011) 30:189–93. doi: 10.1016/j.fsi.2010.10.005
61. Leonardi M, Sandino AM, Klempau A. Effect of a nucleotide-enriched diet on the immune system, plasma cortisol levels and resistance to infectious pancreatic necrosis (IPN) in juvenile rainbow trout (Oncorhynchus mykiss). Bull Eur Assoc Fish Pathol. (2003) 23:52–9.
62. Tahmasebi-Kohyani A, Keyvanshokooh S, Nematollahi A, Mahmoudi N, Pasha-Zanoosi H. Effects of dietary nucleotides supplementation on rainbow trout (Oncorhynchus mykiss) performance and acute stress response. Fish Physiol Biochem. (2012) 38:431–40. doi: 10.1007/s10695-011-9524-x
63. Low C, Wadsworth S, Burrells C, Secombes CJ. Expression of immune genes in turbot (Scophthalmus maximus) fed a nucleotide-supplemented diet. Aquaculture (2003) 221:23–40. doi: 10.1016/S0044-8486(03)00022-X
64. Wismar R, Brix S, Frokiaer H, Laerke HN. Dietary fibers as immunoregulatory compounds in health and disease. Ann NY Acad Sci. (2010) 1190:70–85. doi: 10.1111/j.1749-6632.2009.05256.x
65. Volman JJ, Ramakers JD, Plat J. Dietary modulation of immune function by beta-glucans. Phys Behav. (2008) 94:276–84. doi: 10.1016/j.physbeh.2007.11.045
Keywords: RTgutGC, in vitro model, lipopolysaccharide, functional feed ingredients, mucosal immune responses, gut barrier
Citation: Wang J, Lei P, Gamil AAA, Lagos L, Yue Y, Schirmer K, Mydland LT, Øverland M, Krogdahl Å and Kortner TM (2019) Rainbow Trout (Oncorhynchus Mykiss) Intestinal Epithelial Cells as a Model for Studying Gut Immune Function and Effects of Functional Feed Ingredients. Front. Immunol. 10:152. doi: 10.3389/fimmu.2019.00152
Received: 31 October 2018; Accepted: 17 January 2019;
Published: 06 February 2019.
Edited by:
Roy Ambli Dalmo, UiT The Arctic University of Norway, NorwayReviewed by:
Caterina Faggio, Università degli Studi di Messina, ItalyLaura M. Langan, Plymouth University, United Kingdom
Copyright © 2019 Wang, Lei, Gamil, Lagos, Yue, Schirmer, Mydland, Øverland, Krogdahl and Kortner. This is an open-access article distributed under the terms of the Creative Commons Attribution License (CC BY). The use, distribution or reproduction in other forums is permitted, provided the original author(s) and the copyright owner(s) are credited and that the original publication in this journal is cited, in accordance with accepted academic practice. No use, distribution or reproduction is permitted which does not comply with these terms.
*Correspondence: Trond M. Kortner, trond.kortner@nmbu.no