 Julia Seyfarth1*
 Nathalie Mütze1Jennifer Antony Cruz1Sebastian Kummer1Christina Reinauer1Ertan Mayatepek1
 Thomas Meissner1,2
 Marc Jacobsen1
- 1Department of General Pediatrics, Neonatology and Pediatric Cardiology, University Children's Hospital, Medical Faculty, Düsseldorf, Germany
- 2German Center for Diabetes Research (DZD), Partner Düsseldorf, Düsseldorf, Germany
The common gamma chain (γc) contributes to the formation of different cytokine receptors [e.g., IL-2 receptor (IL-2R), IL-7R, and IL-15R], which are important for generation of self-reactive T-cells in autoimmune diseases, like in type 1 diabetes (T1D). Whereas, the roles of membrane and soluble IL-2Rα and IL-7Rα variants in T1D disease pathogenesis are well-described, effects of γc expression and availability for dependent receptors remain elusive. We investigated expression of the γc and dependent receptors on T-cells and soluble γc concentrations in serum from patients with T1D (n = 34) and healthy controls (n = 27). Effector T-cell cytokines as well as IL-2, IL-7, and IL-15 induced STAT5 phosphorylation were analyzed to determine functional implications of differential γc expression of CD4+ T-cell subsets classified by t-distributed Stochastic Neighbor Embedding (t-SNE) analyses. We found increased γc and IL-7Rα expression of CD4+ T-cells from T1D patients as compared to controls. t-SNE analyses assigned differential expression to subsets of memory T-cells co-expressing γc and IL-7Rα. Whereas, γc expression was positively correlated with IL-2Rα in memory T-cells from healthy controls, no dependency was found for patients with T1D. Similarly, the effector T-cell cytokine, IL-21, correlated inversely with γc expression in healthy controls, but not in T1D patients. Finally, T1D patients with high γc expression had increased proportions of IL-2 sensitive pSTAT5+ effector T-cells. These results indicated aberrantly high γc expression of T-cells from T1D patients with implications on dependent cytokine receptor signaling and effector T-cell cytokine production.
Introduction
Type 1 diabetes (T1D) is an autoimmune disease characterized by destruction of pancreatic beta islet cells. Self-reactive effector T-cells are found in T1D and contribute to disease pathogenesis. Mainly T helper type (TH) 1 cells, producing the key cytokines IFN-γ and TNF-α, were detected in T1D-specific pancreas islet inflammation (1), but also other CD4+ T-cell subsets, e.g., producing IL-17 or IL-21, have been found at higher frequencies in peripheral blood from patients with T1D (2, 3). IL-21 is a key cytokine of T follicular helper (TFH) cells, which are central for B-cell support and may play a role for generation of auto-antibodies in T1D (2).
The T-cell repertoire of patients with T1D is generally prone to increased basic activation (4, 5). Possible explanations for this are increased regulation resistance of effector T-cells and/or impaired regulatory T-cell (Treg) functions (6, 7). Members of the γc cytokine family, namely IL-2, IL-7, and IL-15 are crucially involved in T-cell regulation and the generation of effector T-cells. IL-2 and IL-7 exert largely contrary roles with IL-2 promoting Treg cells and IL-7 being essential for generation of effector and memory T-cells (8). Especially the generation of self-reactive T-cells depends on IL-7 potentially by lowering the T-cell activation threshold (9). IL-15 is an IL-7 related cytokine with similar functions for CD8+ T-cells and NK cells and potential relevance for autoimmunity (10).
Membrane IL-2Rα and IL-7Rα expression of T-cells affect their response to respective cytokines and both receptors are strongly regulated during T-cell activation and maturation (8). The relevance of IL-2Rα and IL-7Rα regulation for development of autoimmune diseases including T1D has been clearly shown (11–13). Both, IL-2R and IL-7R, are members of the γc cytokine receptor family, characterized by γc chain dependency for receptor formation and cytokine signaling. Only limited evidence for regulation of γc expression has been found so far. The majority of previous studies reported stable γc expression in T-cells and assumed that differences in γc availability are functionally irrelevant (14). However, there is some evidence for γc upregulation during T-cell activation and differential γc expression in T-cell subpopulations (15, 16). In addition, modified availability of γc, e.g., due to occupation of individual receptor chains, has been assumed to affect the response against γc cytokines (17, 18). In this regard, observations from patients with γc gene deficiency demonstrated that IL-7, IL-2 and IL-15 require different levels of γc for optimal signaling (19, 20). In support of these findings, Monti et al. showed that disengagement of the IL-2Rα chain with daclizumab enhanced T-cell responses for IL-7 and demonstrated the functional relevance of γc availability (21).
Evidence for a potential role of γc in T1D pathology comes from the study of Demirci et al. who showed that antibodies against γc prevented T1D disease onset in animal models (22). Chronic inflammatory diseases may also be affected by γc expression since increased serum concentrations of the soluble (s)γc variant were reported in human inflammatory bowel disease (23) and rheumatoid arthritis (24, 25).
In the present study, we compared expression of γc cytokine receptor chains between patients with T1D and matched healthy controls. Associations between individual chain expression and phenotype of different T-cell subpopulations were examined by t-distributed Stochastic Neighbor Embedding (t-SNE) analyses. Finally, T-cell activation induced intracellular cytokine expression pattern and cytokine induced STAT5 phosphorylation were characterized.
Results
γc and IL-7Rα Expression Levels Are Higher in CD4+ Memory T-Cells From T1D Patients as Compared to Healthy Controls
We determined expression of IL-2R, IL-7R, and IL-15R chains on CD4+ T-cells from children with T1D (n = 34) as well as healthy controls (“controls”; n = 27). Donor characteristics are summarized in Table 1. No differences in mean expression were detected for the IL-2Rα, the IL-2Rβ, and the IL-15Rα chain between the study groups (Figure 1A, upper graphs; for gating strategy see Supplementary Figure 1A). Interestingly, children with T1D had higher mean expression of IL-7Rα (p = 0.006) and γc (p = 0.044) on CD4+ T-cells as compared to healthy controls (Figure 1A, bottom graphs). To further characterize affected T-cell subsets, we applied the unbiased approach of t-distributed Stochastic Neighbor Embedding (t-SNE) analysis for two-dimensional visualization of high-dimensional data (26). Figure 1B shows combined flowcytometry data of CD4+ T-cells from T1D patients and controls (for gating strategy see Supplementary Figures 1A,B). Naïve and memory T-cells were classified by CD45RAhigh and CD45RAlow expression, respectively (Figure 1B, left graph). γc high T-cells (top 10% according to mean γc expression) clustered almost exclusively within the memory CD4+ T-cell subset (Figure 1B, right graph). This suggested higher γc expression in memory CD4+ T-cells. Hence, we next compared γc expression between naïve and memory T-cells from both study groups. As expected, γc expression was generally higher in memory T-cells as compared to naïve T-cells (Figure 1C, p < 0.001, for T1D patients and controls). Study group comparisons revealed that higher γc expression was exclusively detected for memory T-cells of T1D patients (p = 0.036).
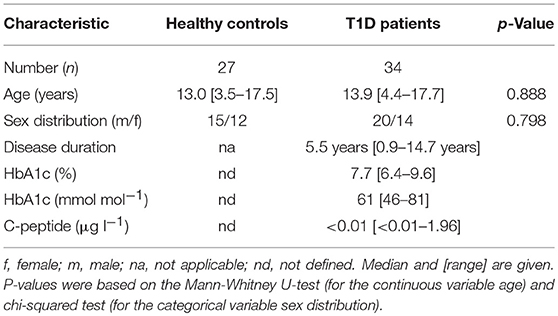
Table 1. Baseline characteristics of children with T1D and healthy controls.
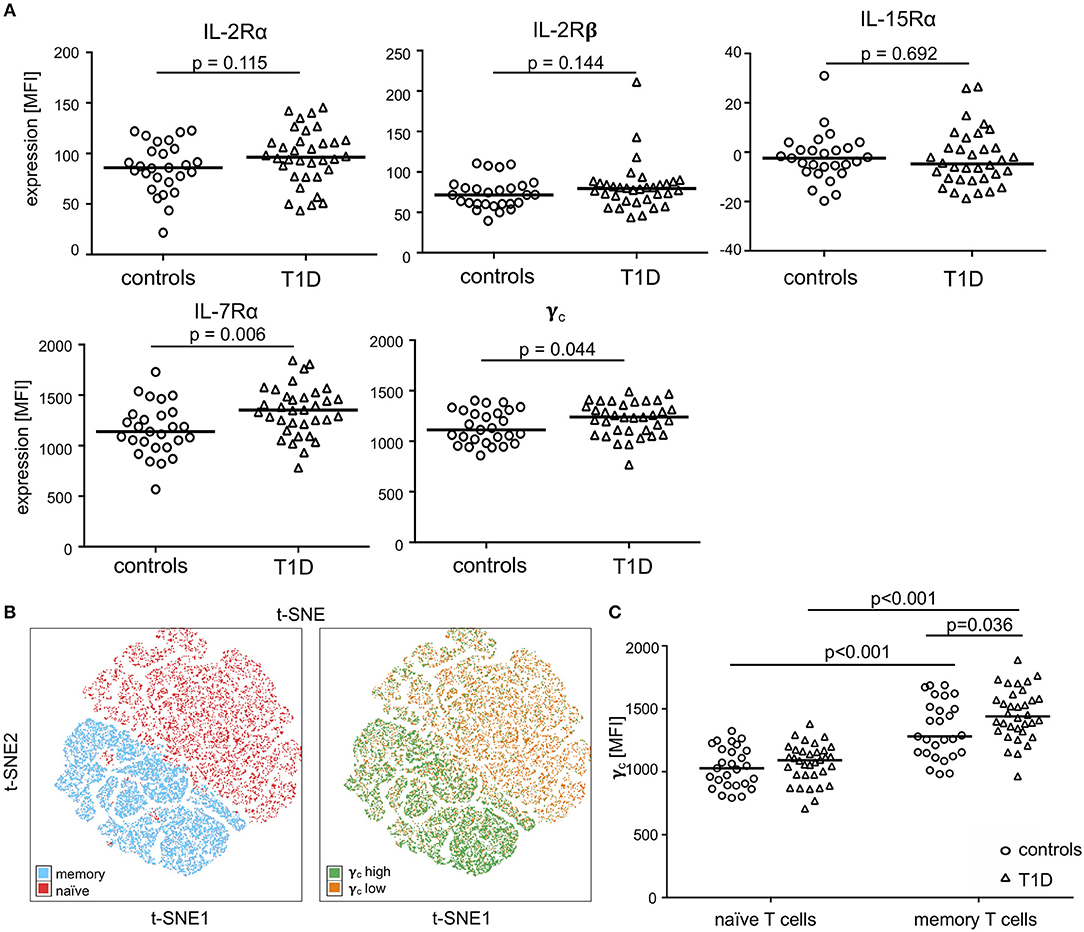
Figure 1. Expression of the γc cytokine receptor chains on naïve and memory CD4+ T-cells. (A) Expression of γc, IL-7Rα, IL-2Rα, IL-2Rß and IL-15Rα on CD4+ T-cells of healthy children (controls, n = 27, open circles) and children with T1D (T1D, n = 34, open triangles) are shown as (geometric) mean fluorescence intensity (MFI). Each symbol represents the mean of triplicates for an individual donor. Median values of groups are indicated and nominal p-values of the two-tailed Mann-Whitney U-test are provided. (B) Unbiased t-distributed Stochastic Neighbor Embedding (t-SNE) analysis of a concatenated subgroup of CD4+ T-cells from healthy controls (n = 11) and T1D patients (n = 19) illustrate distribution of naïve CD45RAhigh and memory CD45RAlow (red and blue, respectively; left panel) and γc high (top 10% mean fluorescence of all CD4+ cells; green) and γc low (bottom 90% mean fluorescence; orange) (right panel) CD4+ T-cells. t-SNE calculates two-dimensional depiction of multi-factorial similarity. These two dimensions are characterized by t-SNE1 and t-SNE2 in given graphs. (C) γc expression of naïve CD45RAhigh and memory CD45RAlow CD4+ T-cells are shown for healthy controls (n = 27, open circles) and T1D patients (n = 34, open triangles). Median values of groups and statistically significant nominal p-values for the Mann-Whitney U-test (two-tailed) are indicated.
Identification of a γc and IL-7Rα High Expressing CD4+ Memory T-Cell Subset Enriched in T1D Patients
To further characterize γc high memory T-cell subsets and to compare study groups, we performed t-SNE analyses for subgroups of patients with T1D and controls separately. Three main populations were identified with high γc expression (top 10% according to mean γc expression; for gating strategy see Supplementary Figure 1B) within CD4+ memory T-cells for both study groups (Figure 2A, t-SNE plots). Higher similarity, indicated by distance in t-SNE principal component analyses, was suggested for high γc expressing subpopulations 1 and 2 in controls whereas subpopulations 2 and 3 were more similar in T1D patients (Figure 2A). In accordance, subpopulation 2 clustered in a region of IL-7Rα high expressing memory T-cells from patients (Figure 2A, upper right plot) whereas lower IL-7Rα expression characterized subpopulation 2 in healthy controls (Figure 2A, upper left plot; for gating strategy see Supplementary Figure 1B). γc high subpopulations showed comparable expression of IL-2Rα and IL-2Rβ between both study groups (Figure 2A; histograms), whereas higher IL-7Rα mean expression of γc high memory T-cells—especially for subpopulation 2—was detected for T1D patients (Figure 2A; histograms). Hence, we compared γc high and low T-cells for IL-7Rα expression between patients and controls. γc low T-cells expressed generally less IL-7Rα in both study groups as compared to γc high T-cells (p < 0.001 for patients and controls) and no differences were found for γc low T-cells between study groups (Figure 2B). In contrast γc high T-cells from patients with T1D expressed significantly higher IL-7Rα levels as compared to healthy controls (p = 0.037; Figure 2B). These results indicated that γc/IL-7Rα high co-expressing T-cell proportions were enriched in T1D patients.
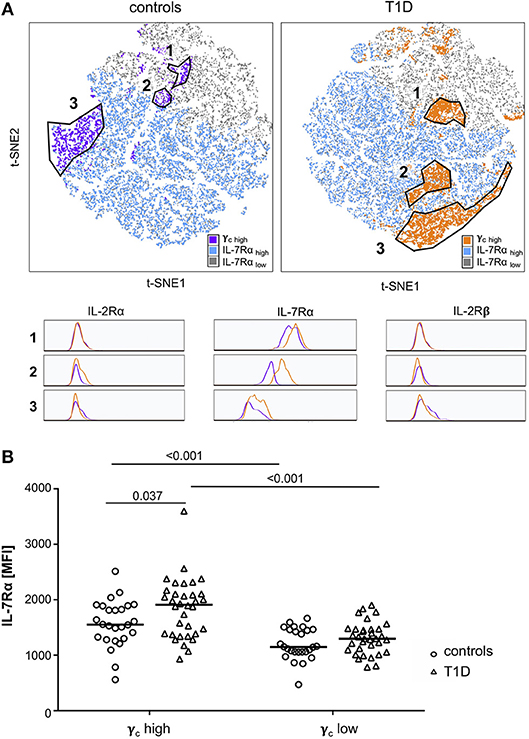
Figure 2. Characterization of γc high expressing memory T-cell populations. (A) Unbiased t-distributed Stochastic Neighbor Embedding (t-SNE) analysis of memory CD4+ T-cells (i.e., CD45RAlow) from healthy controls (n = 20, left graph) and T1D patients (n = 25, right graph). IL-7Rα high cells (blue), IL-7Rα low cells (gray), and γc high cells (purple for controls; orange for T1D patients) are illustrated. γc high populations (top10% mean fluorescence of all CD4+/CD45RAlow cells) of controls and patients were gated (populations 1, 2, and 3) and compared for the respective IL-2Rα, IL-7Rα and IL-2Rβ expression (histograms). (B) IL-7Rα expression of γc high and γc low cells is shown for healthy controls (n = 27, open circles) and T1D patients (n = 34, open triangles). Median values of groups and statistically significant nominal p-values for the Mann-Whitney U-test (two-tailed) are indicated.
Loss of Correlation of γc With IL-2Rα on Memory CD4+ T-Cells From Patients With T1D
Availability of γc has been shown to affect T-cell cytokine signaling for γc family members (19, 21). Therefore, we next measured relative expression of γc cytokine receptor chains in individual donors. γc did not show significant correlation with IL-7Rα expression for CD4+ T-cells from controls or patients with T1D (Figure 3A, upper graphs). Similar results were gained for the IL-2Rβ chain (Supplementary Figure 2). In contrast, γc correlated positively with IL-2Rα chain expression for healthy controls (r = 0.52, p = 0.006), whereas no correlation between γc and IL-2Rα was detectable for patients (r = 0.16, p = 0.379) (Figure 3A, lower graphs). Since differential γc expression was only found for memory T-cells, we next compared γc and IL-2Rα on CD4+ naïve and memory subsets. We found significant correlation between γc and IL-2Rα for both naïve and memory T-cells of healthy controls (r = 0.47, p = 0.015; r = 0.54, p = 0.004, respectively) (Figure 3B, left graphs). In patients, however, only naive T-cells showed a moderate correlation (r = 0.35, p = 0.044) whereas no correlation was detectable for memory CD4+ T-cells (r = 0.10, p = 0.591) (Figure 3B, right graphs). We concluded that differential γc expression of patients with T1D abrogated positive correlation with IL-2Rα on memory T-cells found in healthy controls.
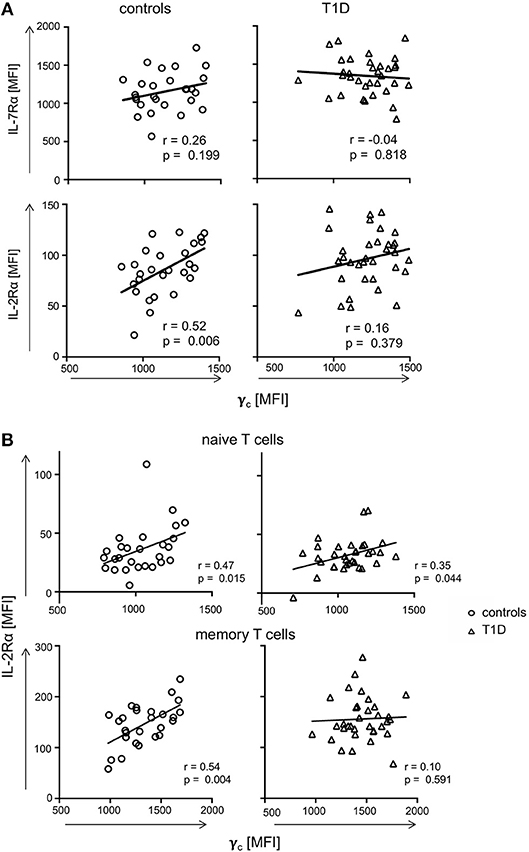
Figure 3. Correlations of γc with IL-7Rα and IL-2Rα. (A) Correlations of IL-7Rα (upper panels) and IL-2Rα (lower panels) with γc on CD4+ T-cells are shown for healthy controls (left graphs, n = 27, open circles) and T1D patients (right graphs, n = 34, open triangles). (B) Correlations of IL-2Rα with γc on naïve (i.e., CD45RAhigh CCR7high) (upper panels) and memory CD45RAlow (lower panels) CD4+ T-cells are shown for healthy controls (left panels, n = 27, open circles) and T1D patients (right panels, n = 34, open triangles). (A,B) Spearman rank correlation coefficients r and p-values are indicated. A trend line was fitted by linear regression analysis.
Negative Correlation of γc With Cytokine Expression of CD4+ Memory T-Cells Is Absent in Patients With T1D
To evaluate if dysregulated γc expression in memory T-cells from T1D patients affects CD4+ T-cell function, we next assessed in vitro T-cell activation induced cytokine production for T1D patients and controls. IFNγ, IL-21, TNFα, and IL-2 expressing CD4+ memory T-cell proportions (see Supplementary Figure 3A for gating procedures) were compared with individual γc expression on memory CD4+ T-cells. For healthy controls, we detected negative correlation of γc expression with IL-21 producing CD4+ memory T-cells (r = −0.48, p = 0.027) and a tendency for IFNγ (r = −0.37, p = 0.087) (Figure 4, left panel). In contrast, patients showed no correlation of γc expression with IL-21 or IFNγ producing CD4+ memory T-cells (Figure 4, right panel). No correlations were found for γc expression and TNFα/IL-2 expression, neither for controls nor for T1D patients (Supplementary Figure 3B). This suggested that the high γc expression in T1D abrogated the negative association between γc expression of CD4+ memory T-cells and IL-21 production found in controls.
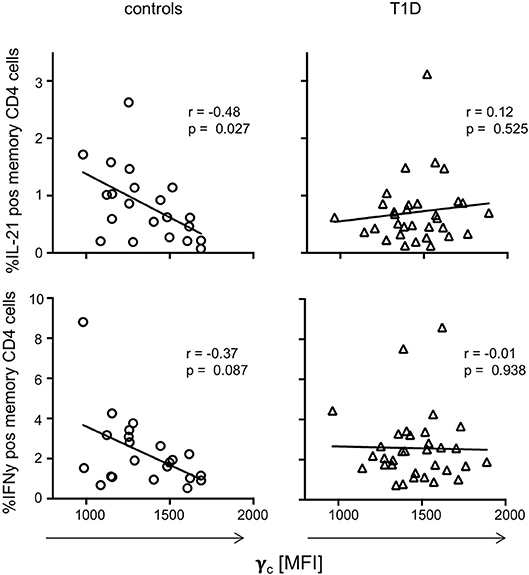
Figure 4. γc expression and cytokine production on T cell receptor stimulation. Correlation between γc expression on CD4+ memory T-cells and in vitro activated cytokine expressing memory CD4+ T-cells (upper graphs: IL-21, bottom graphs: IFNy) are shown for healthy controls (n = 21, left graphs) and patients with T1D (n = 33, right graphs). Spearman rank correlation coefficients (r) and respective p-values are indicated. A trend line was fitted by linear regression analysis.
Type 1 Diabetes Patients With High γc Expression on CD4+ T-Cells Have Increased Proportions of IL-2 Induced pSTAT5 Positive T-Cells
To address the question of functional impacts on cytokine signaling, we measured IL-2, IL-7, and IL-15 induced STAT5 phosphorylation of CD4+ T-cells from both study groups. The gating procedure of cytokine induced pSTAT5 expression is depicted in Supplementary Figure 4A. IL-7 induced pSTAT5 in the vast majority of CD4+ T-cells (median: 92.6%) and no differences between the study groups were detected (Figure 5A, left graph). In contrast, IL-2 increased the proportion of pSTAT5 positive T-cells in T1D patients as compared to healthy controls (Figure 5, middle graph; p = 0.045) whereas proportions were not significantly different after IL-15 stimulation (Figure 5A, right graph). Interestingly, mean pSTAT5 expression of positive T-cells was similar between the study groups independent of the respective cytokine (Figure 5B). This suggested that patients with T1D have more IL-2 sensitive CD4+ T-cells than controls but no differences in the IL-2 induced signaling intensity as compared to control T-cells.
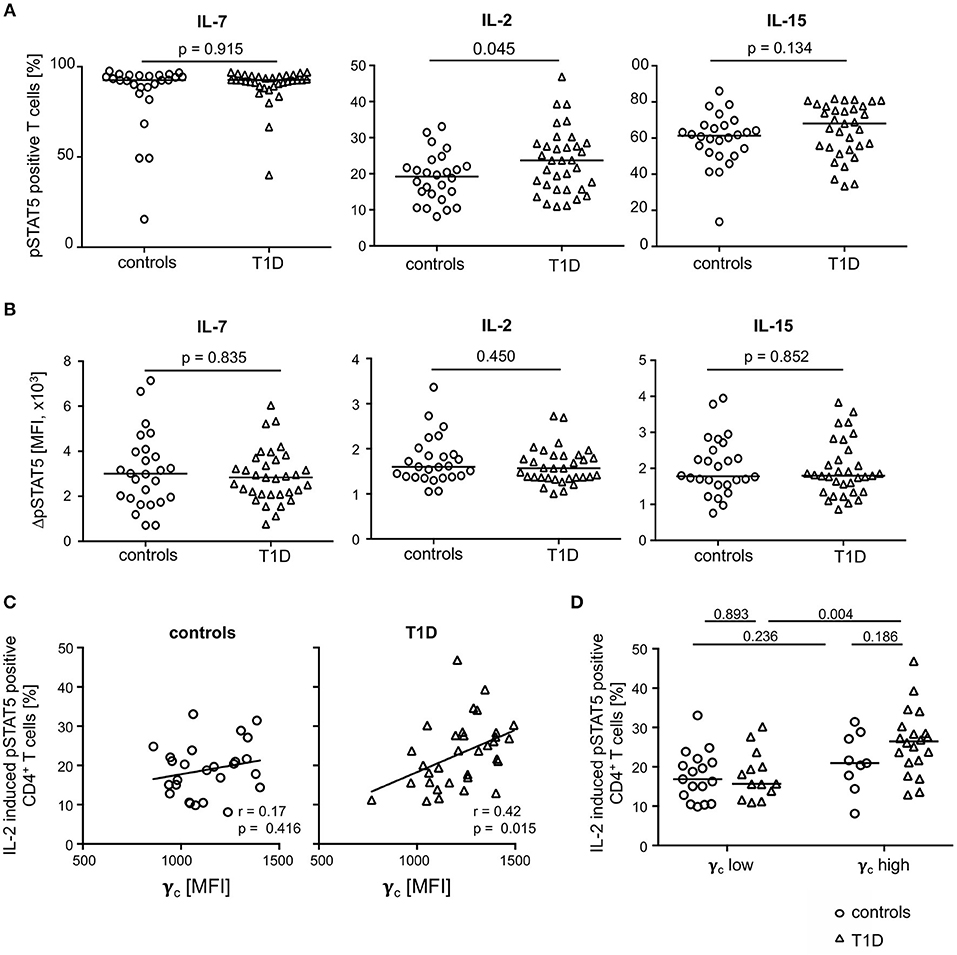
Figure 5. Cytokine induced STAT5 phosphorylation in CD4+ T-cells from healthy controls and patients with T1D. Proportions of pSTAT5 positive CD4+ T-cells (A) and ΔpSTAT5 mean fluorescence intensity (MFI) of CD4+ T-cells (B) induced by IL-7 (left graph), IL-2 (middle graph) and IL-15 (right graph) are shown for healthy controls (n = 26) and T1D patients (n = 34). ΔpSTAT5 MFI was calculated as follows: MFI (pSTAT5 positive cells)—MFI (unstimulated cells). Every symbol represents the mean of duplicates measured for an individual donor. Median values of groups and nominal p-values for the Mann-Whitney U-test (two-tailed) are indicated. (C) Correlations between γc expression on CD4+ T-cells and proportions of IL-2 induced pSTAT5 positive CD4+ T-cells are shown for controls (left panel) and children with T1D (right panel). Spearman rank correlation coefficients (r) and respective p-values are indicated. A trend line was fitted by linear regression analysis. (D) Study participants were stratified into a “γc low” and a “γc high” subgroup according to γc expression (below or above the median γc MFI expression) on CD4+ T-cells. Proportions of pSTAT5 positive CD4+ T-cells were compared between healthy controls and T1D and between both subgroups. Median values of groups and nominal p-values for the Mann-Whitney U-test (two-tailed) are indicated.
Procedures used for measurement of phosphorylated proteins by flow cytometry rendered concomitant cytokine receptor analyses not feasible. However, to identify potential effects of differential γc expression between the study groups on IL-2 induced signaling, we correlated both in patients with T1D patients and controls. Whereas, no correlation of γc expression and IL-2 induced signaling was found for healthy controls (Figure 5C; left graph), a significant positive correlation was found for γc expression and IL-2 induced pSTAT5 proportions for patients (r = 0.42; p = 0.015; Figure 5C, right graph).
These findings may be caused by different proportions of γc low or high T-cells. To address this question, we classified T1D patients and healthy controls as γc low or high (for details see Methods) and compared subgroups for pSTAT5 positive T-cell proportions. Comparisons of IL-2 induced pSTAT5 positive T-cells showed increased proportions in CD4+ T-cells from γc high as compared to γc low T1D patients (p = 0.004) (Figure 5D) and a similar tendency was seen for IL-15 (p = 0.068) (Supplementary Figure 4B, right graph). Notably, no differences were seen when comparing IL-2/IL-15 induced γc high and γc low healthy controls (Figure 5D). IL-7 induced pSTAT5 proportions were also similar between γc high and low individuals as well as between both study groups (Supplementary Figure 4B, left graph). Differences between the study groups were not due to differential mean γc since γc high and γc low from the study groups had comparable values (Supplementary Figure 5A). Furthermore, regulatory T (Treg) cells were likely not causative for differential IL-2/IL-15 response since Treg proportions (for gating strategy see Supplementary Figure 5B) were similar between γc high and γc low subgroups (Supplementary Figure 5B). These results argued for an increased number of CD4+ T-cells with increased sensitivity for IL-2 (partly IL-15) in type 1 diabetes patients with higher γc expression.
No Differences of Soluble γc Serum Levels Between T1D Patients and Controls and No Correlation With Membrane-Associated γc Expression
In previous studies, soluble γc levels in serum were shown to be affected in autoimmune pathologies (23, 24). Hence, we compared soluble γc concentrations in serum from T1D patients and healthy controls. Soluble γc concentrations differed strongly between individuals and the vast majority of individuals from both study groups (16/27 = 59.3%, 16/33 = 48.5% of patients and controls, respectively) had no detectable soluble γc concentrations in serum (Figure 6A). No significant differences between study groups were found (p = 0.357) (Figure 6A). Finally, membranous γc expression was not correlated with soluble γc concentrations (r = 0.21, p = 0.115) (Figure 6B). These results indicated no association between membranous γc expression and soluble γc serum levels.
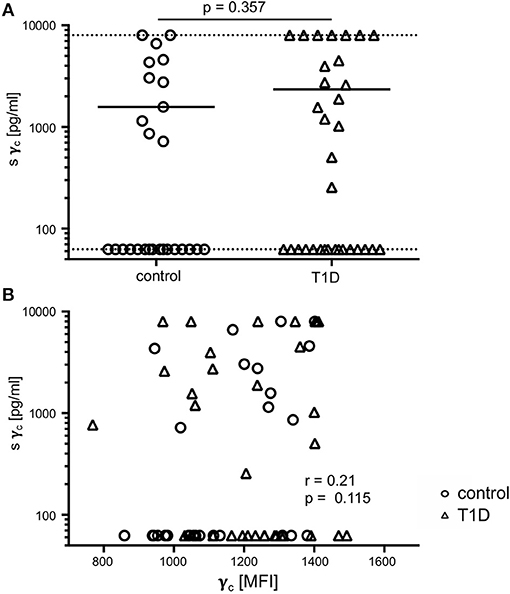
Figure 6. Soluble (s) and membrane-associated γc expression. (A) Serum concentrations of sγc measured by ELISA are shown for healthy controls (n = 27, open circles) and T1D patients (n = 33, open triangles). The dotted lines indicate the upper and lower detection limit. Every symbol represents the mean of duplicates measured for an individual donor. Mean values of groups and the nominal p-value for the Mann-Whitney U-test (two-tailed) are indicated. (B) Correlation of serum concentrations of sγc with membrane-associated γc on CD4+ T-cells are shown (open circles: healthy controls, open triangles: patients with T1D). Spearman rank correlation coefficient (r) and p-value are indicated.
Discussion
T1D-specific differences in cytokine expression and activation pattern of memory T-cell populations have been described and a role of γc cytokines IL-2 as well as IL-7 is likely. T-cell sensitivity for IL-2 and IL-7 depends on IL-2Rα and IL-7Rα receptor expression levels (8). Furthermore, initial studies indicated a role of the shared γc receptor and its soluble variant in autoimmune pathogenesis (22, 25, 27). Therefore, we performed a case-control study and identified higher γc and IL-7Rα chain expression on CD4+ T-cells from T1D patients. Notably, γc expression of memory CD4+ T-cells from patients with T1D was accompanied by the absence of positive correlation with the IL-2Rα found for healthy controls. Since this positive correlation was preserved in naïve T-cells from patients with T1D, we concluded that T1D-specific changes of γc expression occur during effector and memory T-cell generation. The absence of correlation between γc and IL-2Rα together with generally increased γc expression suggested T1D-specific γc up-regulation in IL-2Rα low or medium T-cells. In accordance, t-SNE analysis pointed toward γc up-regulation in memory T-cells with moderate IL-2Rα expression and concomitantly high IL-7Rα and γc expression of memory T-cells from T1D patients.
So far, only few studies focused on γc expression of T-cells in autoimmune and inflammatory diseases. This may be explained by the prevailing assumption that γc expression is constitutive and not transcriptionally regulated (14). However, several studies report upregulation of γc expression after cytokine and T-cell receptor activation (15, 16, 27) or during infections (16, 28). Mechanistically, γc was shown to be stored intracellularly and to be translocated to the plasma membrane after T-cell activation (16, 29). Causative mechanisms underlying higher γc expression of memory T-cells from patients with T1D could not be addressed in the present study since cytokine receptor chains were only measured on the plasma membrane. Comparison of intracellular γc expression levels as well as on the mRNA level would be needed to reveal potential causes.
To elucidate the impact of increased γc expression on T-cell function, we correlated γc expression with memory CD4+ T-cell cytokine production in T1D patients and healthy controls. We found a negative association of γc expression with IL-21 production exclusively in healthy controls whereas no correlation was found for children with T1D. Although not significant, similar results were gained for IFN-γ positive T-cells. These results suggested that, under “healthy” conditions, high γc expression levels are found in donors with low IL-21 expression, indicating negative effects of γc high expressing cells on IL-21 cytokine production. Abrogation of γc negative correlation could indicate that γc high IL7Rα co-expressing T-cells produce IL-21 or promote IL-21 producing T-cells in T1D patients. Accordingly, previous studies suggested that IL-21 significantly contributes to T1D development (30). Direct proof for IL-21 promoting effects of γc high T-cells from T1D patients would have required FACS-based sorting of γc high and low T-cell subsets from children with T1D and healthy controls. This approach and additional experiments to elucidate underlying mechanisms were not feasible because of the limited blood sample volume available from participating children.
Indication of a potential functional impact of differential γc expression is provided by pSTAT5 analyses and identification of higher IL-2 (partly IL-15) sensitivity in a subset of CD4+ T-cells from T1D patients characterized by high γc expression. Own previous studies had indicated higher IL-7 sensitivity of effector memory T-cells from T1D patients leading to increased T-cell activation in the presence of IL-7 (31). Hence, we assumed that enhanced IL-7 mediated T-cell responses in T1D patients could be due to higher γc levels. However, no differences in IL-7 induced STAT5 phosphorylation were found between the study groups and similar pSTAT5 levels were seen for subgroups classified for differential γc within T1D patients and controls. Although IL-7Rα was increased in T cells from T1D patients, these results did not suggest an association between γc expression and IL-7 mediated T-cell responses. In contrast, we detected increased IL-2 (and a tendency for IL-15) sensitive γc high CD4+ T-cell proportions in T1D patients. Although direct association analyses were not possible in STAT5 phosphorylation assays, we concluded that cytokine sensitivity of γc high T-cell proportions promoted IL-2 (IL-15) rather than IL-7. Evidence for a role of differential γc-dependent γc cytokine signaling come from several animal models including experimental autoimmune encephalitis (EAE) and rheumatoid arthritis (25, 27, 32–34). Hong et al. assessed implications of the sγc chain on cytokine signaling and found that this inhibitory variant especially blocked IL-2R signaling probably by binding to the IL-2Rß chain and preventing the association with membrane γc proteins (27). Sγc mediated impaired IL-2 response of T cells caused increased IL-17 production and worsening of EAE and arthritis symptoms (25, 27). Here we detected a promoted IL-2 response in T1D patients with high membrane γc expression. Since Th17 differentiation is negatively regulated by IL-2 signaling (35), future studies will address the question if IL-17 expression is impaired in high γc expressing T cells. This may contribute to the recent assumption that Th17 cells may be increased, but also decreased in the context of T1D (36).
Previous studies focused on limiting membrane γc expression levels and competition of γc family cytokines under such circumstances. Smyth et al. showed, that under conditions where the availability of γc is limiting (in patients with x-SCID and trace amounts of correctly spliced γc), IL-2 and IL-15 stimulation was preserved. In contrast, IL-7 stimulation did not induce pSTAT5, suggesting that IL-2/IL-15 signaling needs less γc expression as compared to IL-7R-mediated signaling (19). Hierarchies of cytokine responses may be due to differential capacity to bind γc and thereby reduce γc availability for other family members (18). Future studies are necessary to address the question, how increased γc expression differentially favors γc cytokine signaling.
Since previous reports indicated a role of soluble γc in autoimmunity, we measured soluble γc concentrations in the serum of patients with T1D and healthy controls. In accordance with previous studies, marked variability in soluble γc serum concentrations was found (23), however, no differences between T1D patients and controls were detected.
In summary, our study suggests a potential role of membranous γc expression in memory T-cells for T1D pathophysiological mechanisms. Future studies will have to shed light on the question, how dysregulated γc expression is involved in T1D development and maintenance.
Methods
Donor Characteristics
We recruited children and adolescents with T1D (n = 34) and healthy controls (n = 27) at the University Children‘s Hospital, Duesseldorf, Germany. Children with T1D had clinical manifestation more than 11 months ago. The control group consisted of children with negative history for autoimmune and systemic inflammatory diseases. Study group characteristics are given in Table 1.
Surface Staining of γc Receptor Chains
For ex vivo surface staining, 100 μl of blood was immediately diluted in equal parts with DPBS. After centrifugation, the cell pellet was stained with an antibody mixture containing the following antibodies: For identification of T helper cells, we included CD4-BV510 (OKT4, Biolegend) and CD8-BV785 (RPA-T8, Biolegend). For identification of naïve, central and effector memory T-cells, we used CD45RA-FITC (HI100, Biolegend) and CCR7-PE-Cy7 (3D12, BD). In addition, the γc cytokine receptors IL-7Rα AF700 (clone A019D5, Biolegend), IL-2Rα-PerCP/Cy5.5 (BC96, Biolegend), IL-2Rβ (CD122)-PE (TU27, Biolegend), IL-15Rα (CD215)-APC (JM7A4, Biolegend), and γc (CD132)-PE-CF594 (TUGh4, BD) were included. Fixable viability dye eFluor780 (Thermo Fisher Scientific) was used to exclude dead cells. Staining was performed in triplicates. Sample measurement was performed on a LSR Fortessa flow cytometer (BD Biosciences). For data analysis FlowJo software (Miltenyi Biotech) was used. The gating procedure is depicted as Supplementary Figures 1A,B. Dead cells (viability marker positive cells) were excluded.
t-SNE Analysis
t-distributed Stochastic Neighbor Embedding (t-SNE) analysis (26) was done by using a plugin in FlowJo v10.4. t-SNE calculations were performed with 1,000 iterations, a perplexity of 20, an Eta (learning rate) of 200 and a Theta of 0.5. t-SNE visualizes similarities of cells in a 2D plot, illustrating their proximity by their distances in the t-SNE map. This method has been previously used to visualize different cellular subpopulations (24). In other words, each dot in the t-SNE plot represents a cell from an individual study participant and the distance between two dots/cells indicates their similarity. E.g., each T-cell population marked in Figure 2A because of high γc expression contains memory CD4+ T-cells with high similarity. In contrast, different populations (i.e., 1, 2, and 3) share features (here high γc expression) but are different in other parameters (here IL-7Rα) expression.
t-SNE calculates two-dimensional depiction of multi-factorial similarity. These two dimensions are characterized by t-SNE1 and t-SNE2 in given graphs. γc expression was classified as ‘high’ or ‘low’ by an arbitrary threshold of top 10% or bottom 90% of γc mean fluorescence expressing CD4+ (Figures 1B,C) or CD4+/CD45RAlow (Figure 2) cells (for gating strategy see Supplementary Figure 1B).
For t-SNE analysis of a concatenated subgroup of CD4+ T-cells from healthy controls (n = 11) and T1D patients (n = 19) (Figure 1B) the following parameters were included: CD45RA and CCR7 (to identify naïve and memory T-cell subsets); IL-2Rα, IL-7Rα, IL-2Rβ, γc (to assess γc cytokine receptor expression and classify regulatory and effector T-cells). In a second step, t-SNE analysis was performed separately for CD45RAlow memory CD4+ T-cells from healthy controls (n = 20) and T1D patients (n = 25) (Figure 2A, left and right graph) and the following parameters were included: IL-2Rα, IL-7Rα, IL-2Rβ, γc (to assess γc cytokine receptor expression); CCR7 (to distinguish central memory and effector memory subpopulations).
T-Cell Restimulation and Intracellular Cytokine Analysis
PBMC were immediately isolated by density gradient centrifugation with Biocoll (Biochrom AG) according to manufacturer's instructions. Without cryopreservation or batching, 2 × 10⁵ PBMC were cultured for a period of 14 h to harmonize experimental conditions between donors. This allowed sample processing on the next day independent of the respective bleeding time point and avoided suboptimal long in vitro restimulation for intracellular cytokine detection. Indirect effects of non-T cells during the pre-incubation period cannot be excluded, but since both groups were treated the same, a bias between T1D patients and controls is not likely. PBMC were then stimulated with 1μl/well human T-activator CD3/CD28 Dynabeads (Gibco) for 6 h. Golgi inhibitor Brefeldin A was added after 1 h. Thereafter cells were harvested and stained with Viability Dye dFluor e780 (eBioscience) following manufacturer‘s instructions. For intracellular cytokine analysis, cells were fixed and permeabilized using Cytokix/Cytoperm Buffer (BD Biosciences) according to manufacturer‘s instruction. Cells were stained using the following antibodies: CD4-BV510 (OKT4, Biolegend), CD8-BV785 (RPA-T8, Biolegend), CD45RA-FITC (HI100, Biolegend), CCR7-PeCy7 (3D12, BD), IFNγ-V450 (B27, BD), IL-21-PE (3A3-N2, Biolegend), TNFα-AF700 (Mab11, BD), and IL-2-PerCPCy5.5 (MQ1-17H12, Biolegend). Staining was performed in triplicates. Proportions of cytokine positive CD45RAneg CD4+ memory T-cells were determined. Naïve CD4+ T-cells hardly produced cytokines after CD3/CD28 re-stimulation (data not shown). For data analysis FlowJo software (Miltenyi Biotech) was used. The gating procedure is depicted as Supplementary Figure 3A. Viability dye positive T-cells were excluded from further analyses. However, the proportion of these dead cells were low indicating no negative effects of the 14 h pre-incubation on cellular viability. Generally, T-cell proportions are calculated. Cytokine-producing T-cells in the present study were based on considerable T-cell numbers per well (median CD4+ T cell count: 9,577 cells) and CD3/28 induced cytokine-producing T-cell proportions ranged from 0.6% (median for IL-21) to 7.5% (median for IL-2). Therefore, cell numbers used for frequency calculations are sufficient to exclude overestimation of differences. The investigator was blinded to the group allocation when analyzing the data.
STAT5 Phosphorylation
2 × 10⁵ PBMC were cultured for a period of 14 h. Afterwards, PBMC were stimulated with IL-2 (10IU/ml) or IL-7 (1ng/ml) for 15 min at 37°C and 5%CO2. Then, cells were fixed using true nuclear fixation buffer and permeabilized with methanol as described previously (37). Samples were then centrifuged, washed and stained with the following antibodies: CD4-AF700 (clone RPA-T4, Biolegend) and pSTAT5-PE (eBioscience). Stimulation and staining were performed in duplicates. For data analysis FlowJo software (Miltenyi Biotech) was used. After gating on CD4+ T-cells, the following gating procedure is depicted as Figure 4A. ΔpSTAT5 MFI was calculated as follows: MFI (pSTAT5 positive cells)—MFI (unstimulated cells). To assess STAT phosphorylation against the background of γc expression, study participants were stratified into “γc low” and a “γc high” subgroups according to γc expression on CD4+ T-cells: γc low (below the median γc MFI expression), γc high: (≥median γc MFI expression of all study participants).
Measurement of Soluble γc
Study participants serum was harvested and immediately stored at −80°C. After simultaneous thawing, soluble γc was measured using the Human Common gamma Chain/IL-2R gamma Duo Set ELISA kit (R&D) according to the manufacturer's instructions. All samples were analyzed in duplicates using an Infinite M200 ELISA reader (Tecan). Concentrations were calculated from respective standard curves on every plate by applying 4-parametric logistic regression. Samples outside the detection range were set to the corresponding lower (62.5 pg/ml) or upper range (8,000 pg/ml) value.
Statistical Analysis
Graph Pad Prism 7 (Version 7.0a, GraphPad Software, La Jolla, CA) software was used for statistical analyses and figure preparation. Because of moderate study group sizes non-parametric distributions were assumed and statistical tests were chosen accordingly. The non-parametric Mann-Whitney U-test (two-tailed) was used to compare continuous characteristics of two study groups, the chi-squared test was used for categorical variables. For correlation analyzes, Spearman‘s correlation was used. P-values below 0.05 were considered statistically significant.
Ethics Statement
This study was carried out in accordance with the recommendations of the Ethical Committee of the Medical Faculty of the Heinrich-Heine-University Duesseldorf, Germany (ID 4844) with written informed consent from all subjects. All subjects (older than 14 years) and their legal guardians gave written informed consent in accordance with the Declaration of Helsinki. The protocol was approved by the Ethical Committee of the Medical Faculty of the Heinrich-Heine-University Duesseldorf, Germany.
Author Contributions
JS designed the study, performed experiments, analyzed and interpreted data, and wrote the manuscript. NM performed experiments, analyzed data, reviewed, and edited the manuscript. JAC, SK, and CR recruited patients and revised the manuscript. TM and EM contributed to the conceptualization and reviewed/edited the manuscript. MJ designed the study, analyzed and interpreted data, and wrote the manuscript. All of the contributing authors approved the final version of the manuscript. JS is the guarantor of this work, and as such, had full access to all the data in the study and takes responsibility for the integrity of the data and the accuracy of the data analysis.
Funding
This work was supported in part by a grant from the German Federal Ministry of Education and Research (BMBF) to the DZD (Pediatric diabetes biomaterial bank 2.0, grant number 82DZD01802). This study was supported in part by a grant from the Elternitiative Kinderkrebsklinik e.V. to JS.
Conflict of Interest Statement
The authors declare that the research was conducted in the absence of any commercial or financial relationships that could be construed as a potential conflict of interest.
Supplementary Material
The Supplementary Material for this article can be found online at: https://www.frontiersin.org/articles/10.3389/fimmu.2019.00820/full#supplementary-material
References
1. Kent SC, Chen Y, Bregoli L, Clemmings SM, Kenyon NS, Ricordi C, et al. Expanded T cells from pancreatic lymph nodes of type 1 diabetic subjects recognize an insulin epitope. Nature. (2005) 435:224–8. doi: 10.1038/nature03625
2. Liu SM, King C. IL-21-producing Th cells in immunity and autoimmunity. J Immunol. (2013) 191:3501–6. doi: 10.4049/jimmunol.1301454
3. Baharlou R, Ahmadi-Vasmehjani A, Davami MH, Faraji F, Atashzar MR, Karimipour F, et al. Elevated levels of T-helper 17-associated cytokines in diabetes type i patients: indicators for following the course of disease. Immunol Invest. (2016) 45:641–51. doi: 10.1080/08820139.2016.1197243
4. Petersen LD, Duinkerken G, Bruining GJ, van Lier RA, de Vries RR, Roep BO. Increased numbers of in vivo activated T cells in patients with recent onset insulin-dependent diabetes mellitus. J Autoimmun. (1996) 9:731–7. doi: 10.1006/jaut.1996.0095
5. Bian ML, Haigh O, Munster D, Harris M, Cotterill A, Miles JJ, et al. Reactivated CD4+Tm cells of T1D patients and siblings display an exaggerated effector phenotype with heightened sensitivity to activation-induced cell death. Diabetes. (2015) 64:2161–71. doi: 10.2337/db14-1151
6. Schneider A, Rieck M, Sanda S, Pihoker C, Greenbaum C, Buckner JH. The effector T cells of diabetic subjects are resistant to regulation via CD4+ FOXP3+ regulatory T cells. J Immunol. (2008) 181:7350–5. doi: 10.4049/jimmunol.181.10.7350
7. Long SA, Cerosaletti K, Bollyky PL, Tatum M, Shilling H, Zhang S, et al. Defects in IL-2R signaling contribute to diminished maintenance of FOXP3 expression in CD4(+)CD25(+) regulatory T-cells of type 1 diabetic subjects. Diabetes. (2010) 59:407–15. doi: 10.2337/db09-0694
8. Read KA, Powell MD, McDonald PW, Oestreich KJ. IL-2, IL-7, and IL-15: multistage regulators of CD4(+) T helper cell differentiation. Exp Hematol. (2016) 44:799–808. doi: 10.1016/j.exphem.2016.06.003
9. Deshpande P, Cavanagh MM, Le Saux S, Singh K, Weyand CM, Goronzy JJ. IL-7- and IL-15-mediated TCR sensitization enables T cell responses to self-antigens. J Immunol. (2013) 190:1416–23. doi: 10.4049/jimmunol.1201620
10. Kim HR, Hwang KA, Park SH, Kang I. IL-7 and IL-15: biology and roles in T-Cell immunity in health and disease. Crit Rev Immunol. (2008) 28:325–39. doi: 10.1615/CritRevImmunol.v28.i4.40
11. Todd JA, Walker NM, Cooper JD, Smyth DJ, Downes K, Plagnol V, et al. Robust associations of four new chromosome regions from genome-wide analyses of type 1 diabetes. Nat Genet. (2007) 39:857–64. doi: 10.1038/ng2068
12. Svejgaard A. The immunogenetics of multiple sclerosis. Immunogenetics. (2008) 60:275–86. doi: 10.1007/s00251-008-0295-1
13. Tang W, Cui D, Jiang L, Zhao L, Qian W, Long SA, et al. Association of common polymorphisms in the IL2RA gene with type 1 diabetes: evidence of 32,646 individuals from 10 independent studies. J Cell Mol Med. (2015) 19:2481–8. doi: 10.1111/jcmm.12642
14. Waickman AT, Park JY, Park JH. The common gamma-chain cytokine receptor: tricks-and-treats for T cells. Cell Mol Life Sci. (2016) 73:253–69. doi: 10.1007/s00018-015-2062-4
15. Nakarai T, Robertson MJ, Streuli M, Wu Z, Ciardelli TL, Smith KA, et al. Interleukin 2 receptor gamma chain expression on resting and activated lymphoid cells. J Exp Med. (1994) 180:241–51. doi: 10.1084/jem.180.1.241
16. Sasson SC, Zaunders JJ, Zanetti G, King EM, Merlin KM, Smith DE, et al. Increased plasma interleukin-7 level correlates with decreased CD127 and increased CD132 extracellular expression on T cell subsets in patients with HIV-1 infection. J Infect Dis. (2006) 193:505–14. doi: 10.1086/499309
17. Vignali D, Gurth CM, Pellegrini S, Sordi V, Sizzano F, Piemonti L, et al. IL-7 Mediated homeostatic expansion of human CD4+CD25+FOXP3+ regulatory T cells after depletion with anti-CD25 monoclonal antibody. Transplantation. (2016) 100:1853–61. doi: 10.1097/TP.0000000000001276
18. Gonnord P, Angermann BR, Sadtler K, Gombos E, Chappert P, Meier-Schellersheim M, et al. A hierarchy of affinities between cytokine receptors and the common gamma chain leads to pathway cross-talk. Sci Signal. (2018) 11:eaal1253. doi: 10.1126/scisignal.aal1253.
19. Smyth CM, Ginn SL, Deakin CT, Logan GJ, Alexander IE. Limiting {gamma}c expression differentially affects signaling via the interleukin (IL)-7 and IL-15 receptors. Blood. (2007) 110:91–8. doi: 10.1182/blood-2006-11-055442
20. Orr SJ, Roessler S, Quigley L, Chan T, Ford JW, O'Connor GM, et al. Implications for gene therapy-limiting expression of IL-2R gamma c delineate differences in signaling thresholds required for lymphocyte development and maintenance. J Immunol. (2010) 185:1393–403. doi: 10.4049/jimmunol.0903528
21. Monti P, Brigatti C, Heninger AK, Scirpoli M, Bonifacio E. Disengaging the IL-2 receptor with daclizumab enhances IL-7-mediated proliferation of CD4(+) and CD8(+) T cells. Am J Transplant. (2009) 9:2727–35. doi: 10.1111/j.1600-6143.2009.02825.x
22. Demirci G, Strom TB, Li XC. Islet allograft rejection in nonobese diabetic mice involves the common gamma-chain and CD28/CD154-dependent and -independent mechanisms. J Immunol. (2003) 171:3878–85. doi: 10.4049/jimmunol.171.7.3878
23. Nielsen OH, Kirman I, Johnson K, Giedlin M, Ciardelli T. The circulating common gamma chain (CD132) in inflammatory bowel disease. Am J Gastroenterol. (1998) 93:323–8. doi: 10.1111/j.1572-0241.1998.00323.x
24. Nishio J, Kohsaka H, Shimamura T, Hamuro J, Miyasaka N. Abundant expression of common cytokine receptor gamma chain (CD132) in rheumatoid joints. J Rheumatol. (2001) 28:240–4.
25. Lee B, Jo Y, Kim G, Ali LA, Sohn DH, Lee SG, et al. Specific inhibition of soluble gammac receptor attenuates collagen-induced arthritis by modulating the inflammatory T Cell responses. Front Immunol. (2019) 10:209. doi: 10.3389/fimmu.2019.00209
26. Mair F, Hartmann FJ, Mrdjen D, Tosevski V, Krieg C, Becher B. The end of gating? An introduction to automated analysis of high dimensional cytometry data. Eur J Immunol. (2016) 46:34–43. doi: 10.1002/eji.201545774
27. Hong C, Luckey MA, Ligons DL, Waickman AT, Park JY, Kim GY, et al. Activated T cells secrete an alternatively spliced form of common gamma-chain that inhibits cytokine signaling and exacerbates inflammation. Immunity. (2014) 40:910–23. doi: 10.1016/j.immuni.2014.04.020
28. Kalia V, Sarkar S, Subramaniam S, Haining WN, Smith KA, Ahmed R. Prolonged interleukin-2Ralpha expression on virus-specific CD8+ T cells favors terminal-effector differentiation in vivo. Immunity. (2010) 32:91–103. doi: 10.1016/j.immuni.2009.11.010
29. Bani L, David D, Moreau JL, Cayota A, Nakarai T, Ritz J, et al. Expression of the IL-2 receptor gamma subunit in resting human CD4 T lymphocytes: mRNA is constitutively transcribed and the protein stored as an intracellular component. Int Immunol. (1997) 9:573–80. doi: 10.1093/intimm/9.4.573
30. Walker LS, von Herrath M. CD4 T cell differentiation in type 1 diabetes. Clin Exp Immunol. (2016) 183:16–29. doi: 10.1111/cei.12672
31. Seyfarth J, Fortsch K, Ahlert H, Laws HJ, Karges B, Deenen R, et al. Dominant TNFalpha and impaired IL-2 cytokine profiles of CD4+ T cells from children with type-1 diabetes. Immunol Cell Biol. (2017) 95:630–9. doi: 10.1038/icb.2017.24
32. Lee B, Ko E, Lee J, Jo Y, Hwang H, Goh TS, et al. Soluble common gamma chain exacerbates COPD progress through the regulation of inflammatory T cell response in mice. Int J Chron Obstruct Pulmon Dis. (2017) 12:817–27. doi: 10.2147/COPD.S123405
33. Kim G, Hwang H, Jo Y, Lee B, Lee YH, Kim CH, et al. Soluble gammac receptor attenuates anti-tumor responses of CD8(+) T cells in T cell immunotherapy (2018). Int J Cancer 143:1212–23. doi: 10.1002/ijc.31402
34. Kim G, Jo Y, Lee B, Ali LA, Lee B, Hong C. The potential role of a soluble gamma-chain cytokine receptor as a regulator of IL-7-induced lymphoproliferative disorders. Int J Mol Sci. (2018) 19:3375. doi: 10.3390/ijms19113375
35. Laurence A, Tato CM, Davidson TS, Kanno Y, Chen Z, Yao Z, et al. Interleukin-2 signaling via STAT5 constrains T helper 17 cell generation. Immunity. (2007) 26:371–81. doi: 10.1016/j.immuni.2007.02.009
36. Fabbri M, Frixou M, Degano M, Fousteri G. Type 1 diabetes in STAT protein family mutations: regulating the Th17/Treg equilibrium and beyond. Diabetes. (2019) 68:258–65. doi: 10.2337/db18-0627
Keywords: biomarker, immunology, common gamma chain, interleukin-2, interleukin-7, type 1 diabetes, interleukin-15
Citation: Seyfarth J, Mütze N, Antony Cruz J, Kummer S, Reinauer C, Mayatepek E, Meissner T and Jacobsen M (2019) CD4+ T-Cells With High Common γ Chain Expression and Disturbed Cytokine Production Are Enriched in Children With Type-1 Diabetes. Front. Immunol. 10:820. doi: 10.3389/fimmu.2019.00820
Received: 11 December 2018; Accepted: 28 March 2019;
Published: 24 April 2019.
Edited by:
Hideki Ueno, Icahn School of Medicine at Mount Sinai, United StatesReviewed by:
Sun Jung Kim, Northwell Health, United StatesChangwan Hong, Pusan National University, South Korea
Copyright © 2019 Seyfarth, Mütze, Antony Cruz, Kummer, Reinauer, Mayatepek, Meissner and Jacobsen. This is an open-access article distributed under the terms of the Creative Commons Attribution License (CC BY). The use, distribution or reproduction in other forums is permitted, provided the original author(s) and the copyright owner(s) are credited and that the original publication in this journal is cited, in accordance with accepted academic practice. No use, distribution or reproduction is permitted which does not comply with these terms.
*Correspondence: Julia Seyfarth, anVsaWEuc2V5ZmFydGhAbWVkLnVuaS1kdWVzc2VsZG9yZi5kZQ==