 Manuel Soto-Dávila1
 Katherinne Valderrama1
 Sabrina M. Inkpen2
 Jennifer R. Hall3
 Matthew L. Rise2
 Javier Santander1*
- 1Marine Microbial Pathogenesis and Vaccinology Lab, Department of Ocean Sciences, Memorial University of Newfoundland, St. John's, NL, Canada
- 2Department of Ocean Sciences, Memorial University of Newfoundland, Ocean Science Centre, St. John's, NL, Canada
- 3Aquatic Research Cluster, CREAIT Network, Ocean Sciences Centre, Memorial University of Newfoundland, St. John's, NL, Canada
Vitamin D2 (ergocalciferol) and vitamin D3 (cholecalciferol) are fat-soluble secosteroid hormones obtained from plant and animal sources, respectively. Fish incorporates vitamin D2 and D3 through the diet. In mammals, vitamin D forms are involved in mineral metabolism, cell growth, tissue differentiation, and antibacterial immune response. Vitamin D is an essential nutrient in aquafeeds for finfish. However, the influence of vitamin D on fish cell immunity has not yet been explored. Here, we examined the effects of vitamin D2 and vitamin D3 on Salmo salar primary macrophage immune response to A. salmonicida subspecies salmonicida infection under in vitro conditions. We determined that high concentrations of vitamin D2 (100,000 ng/ml) and D3 (10,000 ng/ml) affect the growth of A. salmonicida and decrease the viability of S. salar primary macrophages. In addition, we determined that primary macrophages pre-treated with a biologically relevant concentration of vitamin D3 for 24 h showed a decrease of A. salmonicida infection. In contrast, vitamin D2 did not influence the antibacterial activity of the S. salar macrophages infected with A. salmonicida. Vitamin D2 and D3 did not influence the expression of canonical genes related to innate immune response. On the other hand, we found that A. salmonicida up-regulated the expression of several canonical genes and suppressed the expression of leukocyte-derived chemotaxin 2 (lect-2) gene, involved in neutrophil recruitment. Primary macrophages pre-treated for 24 h with vitamin D3 counteracted this immune suppression and up-regulated the transcription of lect-2. Our results suggest that vitamin D3 affects A. salmonicida attachment to the S. salar primary macrophages, and as a consequence, the A. salmonicida invasion decreased. Moreover, our study shows that the positive effects of vitamin D3 on fish cell immunity seem to be related to the lect-2 innate immunity mechanisms. We did not identify positive effects of vitamin D2 on fish cell immunity. In conclusion, we determined that the inactive form of vitamin D3, cholecalciferol, induced anti-bacterial innate immunity pathways in Atlantic salmon primary macrophages, suggesting that its utilization as a component of a healthy aquafeed diet in Atlantic salmon could enhance the immune response against A. salmonicida.
Introduction
Vitamin D is a fat-soluble secosteroid hormone that plays a crucial role in calcium and phosphorus homeostasis, cardiovascular physiology, cell proliferation and differentiation, among other functions (1–6). In fish, vitamin D is involved in the endocrine control of calcium and phosphorus homeostasis, similar to mammals (4). Also, it has been shown that vitamin D can act as an immunomodulatory agent in mammals (7, 8).
In contrast to terrestrial vertebrates, fish are not able to obtain vitamin D through the photochemical pathway, thus fish must ingest vitamin D from dietary sources (9). In freshwater and marine environments, the main dietary sources of vitamin D are phytoplankton and zooplankton (9). Phytoplankton provide fish with vitamin D2 (ergocalciferol), while zooplankton provide them with vitamin D3 (cholecalciferol) (10).
The beneficial stimulatory effects of vitamins D2 and D3 on innate immunity have been described in humans and other mammals (5, 8, 11–14). The positive effects of vitamins in fish are well-established, and currently vitamins D2 and D3 are essential components of aquafeed diets (4). Additionally, vitamin D is utilized as an adjuvant in aqua-vaccine preparations (15). However, the role of vitamin D in fish physiology is still enigmatic, and the immune stimulant mechanisms against infectious diseases are unknown.
Atlantic salmon (Salmo salar) is a high-value cultured finfish species, and the main species cultured in Canada, Chile, UK, and Norway (16–18). Infectious diseases caused by bacterial pathogens such as Renibacterium salmoninarum, Piscirickettsia salmonis, Vibrio anguillarum, and Aeromonas salmonicida subsp. salmonicida (19–24), have affected this industry since its origin (25, 26). Currently, several measures are utilized to prevent infectious diseases in the Atlantic salmon aquaculture industry, including a healthy diet that includes immunostimulants (27–29).
Functional constituents of healthy aquafeed diets like essential nutrients (such as vitamins, probiotics, prebiotics, and immunostimulants) are currently being considered to improve not only fish growth and stress tolerance, but also the resistance to diseases by enhancing non-specific defense mechanisms (30, 31). These essential nutrients are capable of directly activating immune mechanisms, such as phagocytic activity (e.g., macrophages and neutrophils), complement system, lysozyme activity, and others (32–34). Phagocytosis is an active host defense mechanism, involving the action of monocytes, dendritic cells, neutrophils, and macrophages (34–36). From these phagocytic leukocytes, the macrophages play an important role linking the innate and adaptive immune responses, and previous studies have shown that immunostimulants (i.e., fructooligosaccharides, mannanoligosaccharides) can successfully enhance the phagocytic activity in rainbow trout and European sea bass (34, 37, 38).
Immunostimulants are natural compounds that have been shown to be safe and effective for fish (30, 33, 39). In humans, vitamin D plays an important role in the suppression of pro-inflammatory cytokines such as il-17, il-1b, and tnf-α in individuals affected by type 2 diabetes and autoimmune diseases, preventing chronic inflammation (40, 41). Additionally, vitamin D significantly reduces Staphylococcus aureus infection in pre-treated bovine epithelial cells and modulates the expression of innate immune related genes (8, 13, 14). These studies suggest that vitamin D could trigger similar protective effects in fish. Here, we evaluate the effects of vitamins D2 and D3 on the innate immune responses of Atlantic salmon primary macrophages to A. salmonicida infection.
Materials and Methods
Aeromonas salmonicida Growth Conditions
A. salmonicida was grown in accordance to the protocol used by Soto-Dávila et al. (42). Briefly, a single colony of A. salmonicida J223 (24) was incubated in 3 ml of Trypticase Soy Broth (TSB, Difco, Franklin Lakes, NJ) at 15°C in a 16 mm diameter glass tube and placed in a roller for 24 h. After growth, 300 μl of the overnight culture was added to 30 ml of TSB media using a 250 ml flask and incubated for 24 h at 15°C with aeration (180 rpm). After bacteria reached an O.D. 600 nm ~0.7 (1 × 10⁸ CFU ml−1), the bacterial culture was centrifuged at 6,000 rpm at room temperature for 10 min. The pellet was washed twice with phosphate buffered saline [PBS; 136 mM NaCl, 2.7 mM KCl, 10.1 mM Na2HPO4, 1.5 mM KH2PO4 (pH 7.2)] and centrifuged at 6,000 rpm at room temperature for 5 min, and finally resuspended in 300 μl of PBS (~5 × 10¹⁰ CFU ml−1). The concentrated bacterial inoculum was serially diluted and quantified by plating onto TSA supplemented with Congo red (50 μg ml−1) for 4 days.
Vitamin D2 and D3 Inhibitory Effects on A. salmonicida Growth
To determine whether vitamin D2 or vitamin D3 have inhibitory effect on A. salmonicida growth, 30 μl of the overnight growth bacteria were placed in 3 ml of TBS containing different concentrations of vitamin D2 (10; 100; 1,000; 10,000; and 100,000 ng ml−1; Sigma-Aldrich) or vitamin D3 (10; 100; 1,000; and 10,000 ng ml−1; Sigma-Aldrich). Bacterial growth was measured by O.D. 600 nm until 48 h. The effect of each vitamin concentration on A. salmonicida growth was measured in triplicate, and TSB media containing the respective vitamin D concentration was utilized as a blank.
Fish Holding
Adult specimens of Atlantic salmon 4.0 ± 0.1 kg (mean ± SE) were obtained from the Dr. Joe Brown Aquatic Research Building (JBARB) at the Department of Ocean Sciences, Memorial University of Newfoundland, Canada. The animals were kept in 37 m3 tanks, with flow-through (100 l min−1) seawater (6.5°C) and ambient photoperiod. The individuals were fed twice per day with commercial salmonid dry pellets (Skretting Optiline Microbalance 3000 EP, 12.0 mm pellets: 38% protein, 33% fat, 1.6% calcium, 1.5% fiber, 1% phosphorus) with a ration of 0.5% of body weight per day. The experiment was performed in accordance with the guidelines of the Canadian Council on Animal Care and approved by Memorial University of Newfoundland's Institutional Animal Care Committee (protocols #17-01-JS; #17-02-JS).
Macrophage Isolation
Primary macrophages were isolated from Atlantic salmon head kidney. Tissues from 6 fish were aseptically removed and individually minced through 100 μm nylon sterile cell strainers (Fisher Scientific, Thermo Fisher Scientific, Waltham, MA, USA) in isolation media [(Leibovitz-15 (Gibco®, Gran Island, NY, USA) supplemented with 250 μg ml−1 heparin, 100 U ml−1 penicillin, 100 μg ml−1 streptomycin, and 0.1% Fetal Bovine Serum (FBS)]. After this period, 4 ml of cell suspension were centrifuged (1,000 × g at 4°C) for 30 min in a 34/51% Percoll gradient (GE Healthcare, Uppsala, Sweden). Macrophages collected from the macrophage-enriched interface were washed with PBS twice and the number and viable cells were determined using the Countness™ cell counter (Invitrogen), and trypan blue stain (Invitrogen). After determining the cell concentration (number of cells per ml−1) of each sample, the primary macrophages were seeded in 22 mm 12-well or 35 mm 6-well cell-culture multidishes (Thermo Scientific, Roskilde, Denmark) at a concentration of 1 x 10⁷ cells ml−1. The plates were incubated at 15°C for 24 h in isolation media. After this period the cells were washed with PBS and incubated at 15°C for an additional 4 days in 1 ml of culture media (Leibovitz-15 (Gibco®), supplemented with 0.1% 2-Mercaptoethanol, 100 U ml−1 penicillin, 100 μg ml−1 streptomycin, and 5% FBS) to allow cell attachment until the assays were performed.
Vitamin D2 and D3 Toxicity in Atlantic Salmon Primary Macrophages
Atlantic salmon primary macrophages were seeded in 12-well cell-culture multidishes at a concentration of 1 x 10⁷ cells ml−1. After 4 days of incubation the culture media was removed, cells washed with PBS, and 1 ml of culture media containing different concentrations of vitamin D2 (10; 100; 1,000; 10,000; and 100,000 ng ml−1) or vitamin D3 (10; 100; 1,000; and 10,000 ng ml−1) was added. Twenty-four hours and 48 h post-vitamin treatment, cells were treated with 500 μl of trypsin-EDTA (0.5%; Gibco) for 10 min, and then trypsin was inactivated with 500 μl of culture media. The cells were stained with trypan blue (0.4%; Invitrogen) in a ratio of 1:1 (10 μl: 10 μl) and quantified using Countess™ Cell Counting Chamber Slides (Invitrogen) and Countess® Automated Cell Counter (Invitrogen) according to the manufacturer's instructions. Viability of cells was determined for each vitamin D2 and D3 concentration and the control group. All samples were taken from 6 individual fish.
Gentamicin Exclusion Assay
Infections of primary macrophages with A. salmonicida were performed according to the protocol used by Soto-Dávila et al. (42) with modifications. Briefly, after 4 days, the primary macrophages were washed with 1 ml of PBS and inoculated with 1 ml of culture media without antibiotics containing either 100 ng ml−1 of vitamin D2 or D3 for 24 h. After this period, media was removed, cells washed with 1 ml of PBS, and pre-treated primary macrophage monolayers were infected with 10 μl of bacterial suspension [~1 × 10⁷ cells ml−1; Multiplicity of Infection (MOI) 1:1 (bacteria:macrophage)] and incubated at 15°C. For attachment, after 1 h of infection, the infected primary macrophage monolayers were washed twice with 1 ml of PBS and then lysed using 400 μl of Triton X100 (0.01%; Sigma) for 10 min (43). After this 600 μl of PBS was added to complete 1 ml of lysed macrophage suspension. Then, the lysed macrophage suspensions were serially diluted (1:10) and plate/counted on TSA plates supplemented with Congo red to determine the number of viable A. salmonicida per monolayer. The plates were incubated at 15°C for 5 days to determine the CFU per well.
For invasion, the primary macrophages were infected for 1 h, washed twice with 1 ml of PBS, and 1 ml of fresh culture media supplemented with gentamicin (10 μg ml−1, a higher concentration than the minimal inhibitory concentration) (24) was added. Gentamicin treatment was applied to kill remaining extracellular bacteria. After 2, 3, and 4 h of infection, the infected primary macrophage monolayers were washed twice with PBS and then lysed using 400 μl of Triton X100 (0.01%) for 10 min (43). After this, 600 μl of PBS was added to complete 1 ml of lysed macrophage suspension. Then, the lysed macrophage suspensions were serially diluted (1:10) and plate/counted on TSA plates supplemented with Congo red to determine the number of viable intracellular A. salmonicida per monolayer. The plates were incubated at 15°C for 5 days to determine the CFU per well. All samples were taken from 6 individual fish.
Vitamin D2 and D3 Pre-treated Primary Macrophage Viability After A. salmonicida Infection
To determine the viability of infected primary macrophages, the cells were seeded in 12 wells plates, pre-treated with 100 ng ml−1 of vitamin D2 or vitamin D3, infected with A. salmonicida, and processed following the method used during the gentamicin exclusion assay. Cells were washed with 1 ml of PBS and then treated with 500 μl of trypsin-EDTA (0.5%; Gibco) for 10 min. After this period, the trypsin was inactivated with 500 μl of culture media. The primary macrophages were stained using trypan blue (0.4%; Invitrogen) in a ratio of 1:1 (10 μl: 10 μl) and quantified using Countess™ Cell Counting Chamber Slides (Invitrogen) and the Countess® Automated Cell Counter (Invitrogen) according to the manufacturer's instructions. The numbers of alive and dead cells were determined at each time point post-infection. All the primary macrophages were isolated from 6 individual fish and technical triplicates were utilized.
RNA Extraction
RNA samples were obtained from head kidney primary macrophages inoculated with either PBS; live A. salmonicida (J223); formalin-killed A. salmonicida (FK J223); 100 ng ml−1 vitamin D2 or D3; 1,000 ng ml−1 vitamin D2 or D3, or 100 ng ml−1 vitamin D2 or D3 + live A. salmonicida (J223). The treatments that included vitamin D (D2 or D3) were pre-treated with the respective concentration 24 h before the challenge, meanwhile treatments without vitamin D were pre-treated only with the control vehicle 24 h before the challenge. Each sample was obtained 3 h post-inoculation.
Total RNA from Atlantic salmon primary macrophages was extracted using 1 ml of TRIzol Reagent (Invitrogen), and purified using the RNeasy® Mini Kit (QIAGEN) following the manufacturer's instructions (44). RNA samples were treated with 2 U of TURBO DNase (TURBO DNA-free™ Kit, Invitrogen) following the manufacturer's instructions to degrade any residual genomic DNA. Briefly, samples were incubated at 37°C for 30 min, 2.5 μl of DNase Inactivation Reagent was added, and samples incubated 5 min at room temperature. Then, samples were centrifuged at 10,000 x g for 1.5 min and the supernatant containing the RNA carefully transferred to a new tube. Purified RNA samples were quantified and evaluated for purity (A260/280 and A260/230 ratios) using a Nano-quant spectrophotometer (Genway, UK), and evaluated for integrity using 1% agarose gel electrophoresis (45). Column purified RNA samples had A260/280 ratios between 1.9 and 2.1 and A260/230 ratios between 1.9 and 2.2. A PCR test was conducted using the reference genes' primers [60S ribosomal protein L32 (rpl32) and β-actin] and the RNA as template to rule out the presence of DNA. All RNA samples did not show presence of DNA.
First-strand cDNA templates for qPCR were synthesized from 500 ng of DNaseI-treated, column-purified total RNA using SuperScript™ IV VILO™ Master Mix (Invitrogen) following the manufacturer's instructions. Each sample was incubated at 25°C for 10 min, at 50°C for 10 min, and at 85°C for 5 min.
Gene Paralogue Discovery and qPCR
All qPCR reactions were performed in a 20 μl reaction, containing 1 × PowerUp SYBR Green Master Mix (Applied BioSystems, Foster City, CA, USA), 500 nM (final concentration) of both the forward and reverse primer and the indicated cDNA quantity. All samples were amplified and detected using the QuantStudio 3 Real Time PCR System (Applied BioSystems). The reaction mixtures were incubated for 2 min at 50°C, then 2 min at 95°C, followed by 40 cycles of 1 s at 95°C, 30 s at 60°C, and finally 15 s at 95°C, 1 min at 60°C, and 15 s at 95°C.
The primer sequences of interleukin 1 beta (il-1b), interleukin 8 (il-8), tumor necrosis factor alpha (tnf-α), soluble toll-like receptor 5 (stlr5), and leukocyte-derived chemotaxin 2 (lect-2) are listed in Table 1. Gene paralogue discovery, qPCR primer design and initial quality testing were performed as described in Caballero-Solares et al. (49). Since the reagents, cycling conditions and samples were different in the current study, primer efficiencies (Table 1) were reassessed. Briefly, a 7-point 1:3 dilution series starting with cDNA representing 40 ng of input total RNA was generated, and efficiencies then calculated using the formula E = 10(−1/slope) (50).
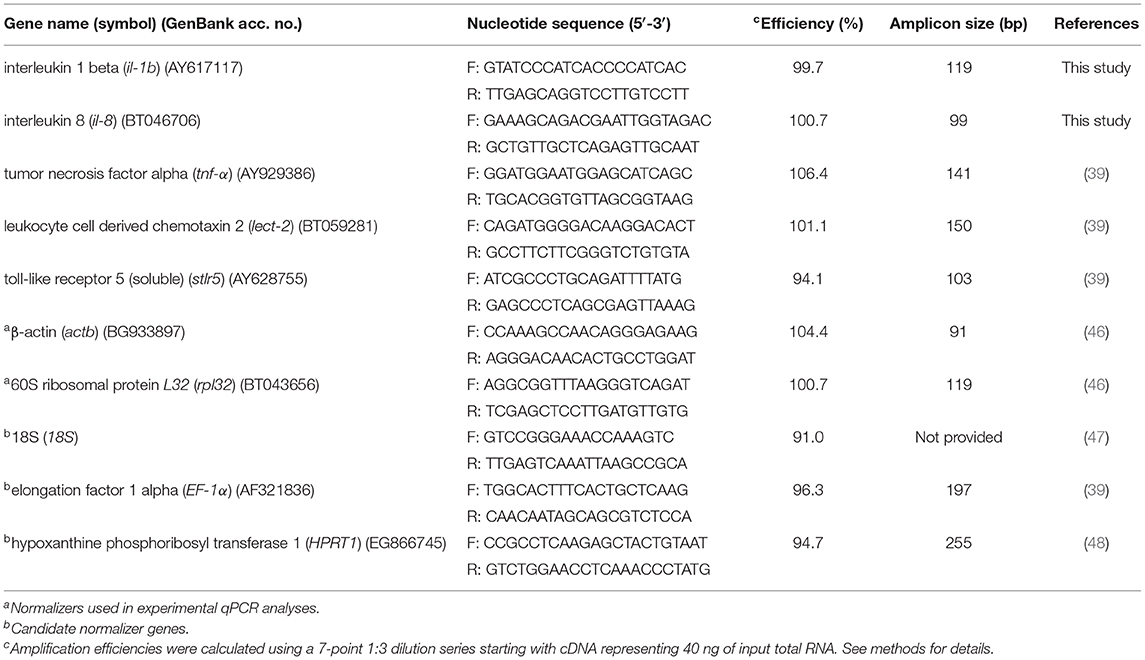
Table 1. Primers used in qPCR studies.
Transcripts levels of the genes of interest (il-1b, il-8, tnf-α, stlr5, and lect-2) were normalized to transcript levels of two endogenous control genes. Levels of five candidate normalizers (60S ribosomal protein 32; β-actin, 18S, elongation factor 1 alpha, and hypoxanthine phosphoribosyl transferase 1) were assessed in 50% of the samples (i.e., in 3 random samples per treatment) using cDNA representing 40 ng of input total RNA. Reference gene stability was then analyzed using both geNorm and BestKeeper (Supplementary Table 1). Both analyses identified β-actin (geNorm M = 0.592; BestKeeper value = 0.263) and 60S ribosomal protein L32 (geNorm M = 0.592; BestKeeper value = 0.364) and as the most stably expressed genes (Supplementary Table 1).
After normalizer testing was completed, transcript levels of the genes of interest were analyzed in the individual study samples, with normalization to both β-actin and 60S ribosomal protein L32. In all cases, levels were assessed (in triplicate) in six individuals per treatment using cDNA representing 40 ng of input total RNA. On each gene a no RT control was included. Gene expression was determined using the comparative 2−ΔΔCt method (51).
Phagocytosis Assay
The phagocytosis assay was performed following the protocol used by Smith et al. (39) with modifications. Cells were incubated for 3 days and inoculated with vehicle control (2 μl of ethanol in 1 ml of culture media without antibiotics), 100; 1,000; or 10,000 ng ml−1 of either vitamin D2 or D3 for 24 h. After this time, cells were washed twice with PBS, and inoculated with 1 μm of Fluoresbrite YG microspheres at a ratio of ~1:30 macrophage:microsphere (Polysciences, Warrington, PA, USA) (39, 52). Twenty-four hours after microsphere addition, primary macrophages were washed with PBS and posteriorly cells treated with trypsin-EDTA (0.5%; Gibco) for 10 min. Then, cells were resuspended in 500 μl of FACS buffer (PBS + 1% FBS). Fluorescence was detected from 10,000 cells using a BD FACS Aria II flow cytometer and analyzed using BD FACS Diva v7.0 software (BD Biosciences, San Jose, CA, USA). The control pre-treated macrophages were used to compare with the FITC positive cells in vitamin D pre-treated cells. Percentages of FITC positive cells were determined for each condition. The experiments were conducted using macrophages isolated from 3 independent fish.
Statistical Analysis
All data are shown as the mean ± standard error (SE). Assumptions of normality and homoscedasticity were tested for the detected variances. A Kruskal-Wallis non-parametric test was performed for A. salmonicida growth curve and gene expression results. Macrophages viability, gentamicin exclusion assay, and phagocytosis assay data were analyzed using a repeated measures two-way ANOVA test, followed by Sidak multiple comparisons post hoc test to identify significant differences of each treatment in different times or concentrations and between treatments in the same time point. Differences were considered significant at P < 0.05. All statistical analyses were performed using GraphPad Prism (GraphPad Software, La Jolla California USA, www.graphpad.com).
Results
Inhibitory Effects of Vitamin D2 and D3 on A. salmonicida Growth
Growth of A. salmonicida at different concentrations of vitamin D2 and D3 was determined by O.D. 600 nm at different time points until 48 h. Bacteria growth was not affected in concentrations of 10, 100, 1,000, and 10,000 ng ml−1 of vitamin D2 (vitamin D2) (Figure 1A). In contrast, A. salmonicida growth was significantly reduced in the presence of 100,000 ng ml−1 of vitamin D2 (Figure 1A). A. salmonicida growth was not affected by 10 and 100 ng ml−1of vitamin D3 (vitamin D3) (Figure 1B). However, A. salmonicida growth was significantly affected by 1,000 and 10,000 ng ml−1 of the vitamin D3 (Figure 1B).
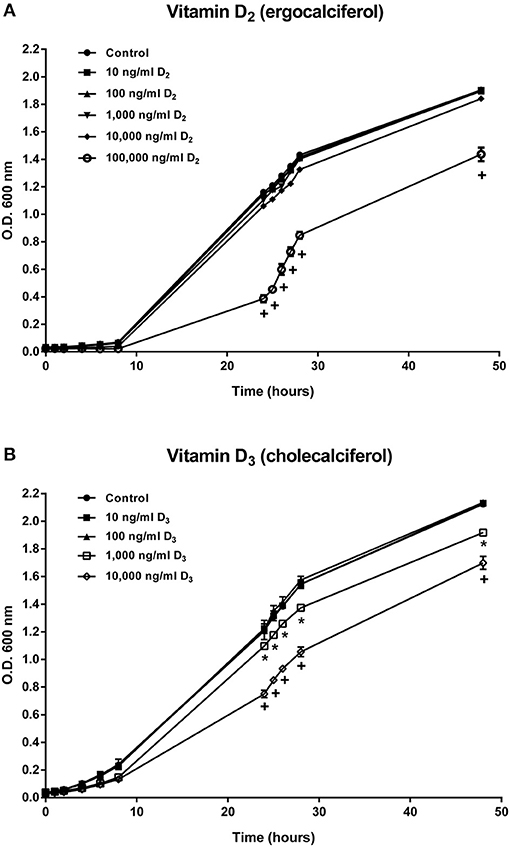
Figure 1. Aeromonas salmonicida subsp. salmonicida growth curve in TSB media supplemented with (A) 10, 100, 1,000, 10,000, and 100,000 ng ml−1 of vitamin D2 and (B) 10, 100, 1,000, and 10,000 ng ml−1of vitamin D3. Growth was determined by reading O.D. 600 nm at different time points until 48 h. Each value is the mean ± S.E.M (n = 3). Symbols (*, +) indicate differences between each group at different time points of measure, p < 0.05.
Evaluation of the Toxicity of Vitamin D2 and D3 in Atlantic Salmon Primary Macrophages
Atlantic salmon primary macrophage viability was determined after 24 and 48 h of exposure to concentrations of 0, 10, 100, 1,000, 10,000, and 100,000 ng ml−1 of vitamin D2. Results obtained did not show significant differences in viability between the control group, compared with the cells treated with 10, 100, 1,000, and 10,000 ng ml−1 of vitamin D2. However, a significant difference was observed in cells inoculated with the media containing a concentration of 100,000 ng ml−1 of vitamin D2 after 24 h (1.67 × 10⁴ ± 6.67 × 10³) and 48 h (6.67 × 10³ ± 6.67 × 10³) (Figure 2A).
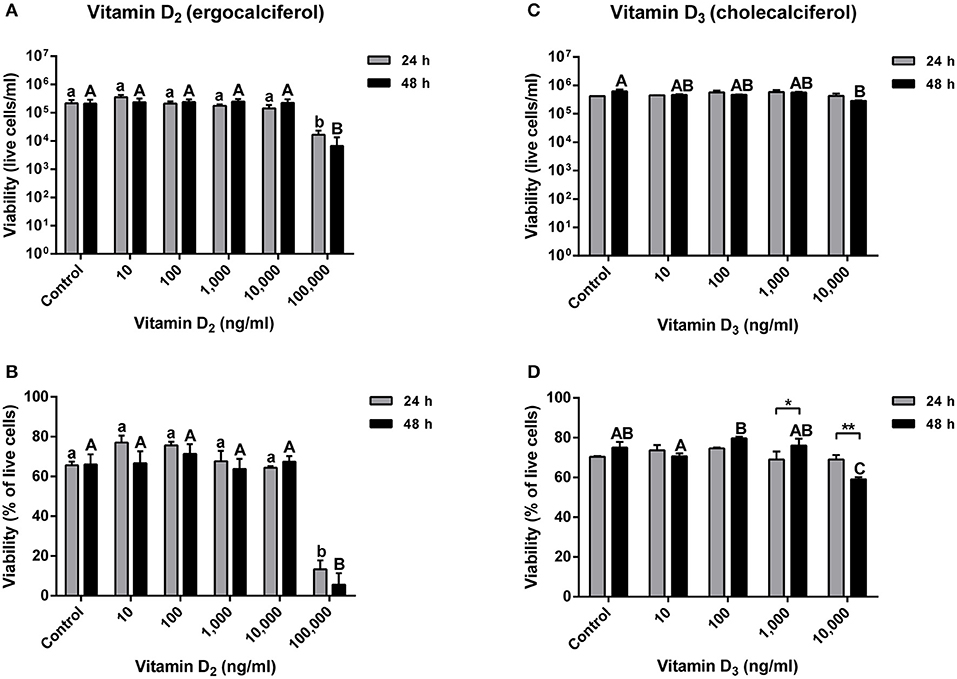
Figure 2. Atlantic salmon primary macrophages treated with vitamin D2 or D3. (A) Live cells and (B) percentage of viability of primary macrophages treated with 10, 100, 1,000, 10,000, and 100,000 of vitamin D2, were measured after 24 and 48 h of treatment. (C) Live cells and (D) percentage of viability of primary macrophages treated with 10, 100, 1,000, and 10,000 ng ml−1 of vitamin D3 were measured after 24 and 48 h of treatment. Each value represents the mean ± S.E.M (n = 6). Lower case letters (a, b) show differences between treatments after 24 h. Upper case letters (A,B,C) show differences between treatments after 48 h. Asterisks (*) represent significant differences between treatments (*p < 0.05, **p < 0.01).
The percentage of viability did not show significant differences between the control group and the primary macrophages treated with 10, 100, 1,000, and 10,000 ng ml−1 of vitamin D2. Nevertheless, a highly significant decrease in macrophage viability was observed at a concentration of 100,000 ng ml−1 of vitamin D2 after 24 h (13.33 ± 4.48%) and 48 h (5.67 ± 5.67%) (Figure 2B).
The viability of Atlantic salmon primary macrophages was also determined at 24 and 48 h post-treatment with vitamin D3 in concentrations of 10, 100, 1,000, and 10,000 ng ml−1. The number of live cells per ml did not show significant differences in primary macrophages treated with 10, 100, and 1,000 ng ml−1 (Figure 2C). Moreover, no significant differences were observed in the viability of primary macrophages treated with 10,000 ng ml−1 of vitamin D3 after 24 h compared with the control (Figure 2C). Nevertheless, in cells exposed to 10,000 ng ml−1 of vitamin D3, a significant decrease in the viability was observed after 48 h of treatment (2.85 × 10⁵ ± 1.44 × 10⁴) (Figure 2C).
The percentage of viability in vitamin D3 treated cells did not show significant differences after 24 h of exposure to concentrations of 10, 100, 1,000, and 10,000 ng ml−1 compared with the control group (Figure 2D). Also, no significant differences were observed in Atlantic salmon macrophages treated during 48 h with vitamin D3 in a concentration of 10, 100, and 1,000 ng ml−1 compared with the control (Figure 2D). However, a significant decrease was observed in cells incubated with a concentration of 10,000 ng ml−1 of vitamin D3 compared with the control and all the lower doses of vitamin D3 at the 48 h time point (59.00 ± 1.15%) (Figure 2D). Moreover, in the group incubated at a concentration of 1,000 ng ml−1 of vitamin D3, a significant higher percentage of viability was observed in cells treated for 48 h compared with the 24 h group (Figure 2D). Also, in the primary macrophages treated with 10,000 ng ml−1 of vitamin D3, a significant difference was observed at different times, showing a decrease in the viability of cells treated for 48 h with vitamin D3 compared with the cells incubated for only 24 h (Figure 2D).
Gentamicin Exclusion Assay in Vitamin D2 and D3 Pre-treated Cells Infected With A. salmonicida
The effects of vitamins D2 and D3 on the growth of A. salmonicida (Figure 1) and the effects on the viability of primary macrophages (Figure 2) were used to determine the concentration to be utilized in the gentamicin exclusion assays. Based on these results, the primary macrophages were pre-treated with 100 ng ml−1 (vitamin D2 or D3) for the gentamicin exclusion assay.
Cells pre-treated for 24 h with 100 ng ml−1 of vitamin D2 and then infected with A. salmonicida, did not show significant differences in cell numbers at 1, 2, 3, and 4 h post-infection compared with the control group (Figure 3A). Also, no significant differences were observed in the viability of primary macrophages pre-treated and then infected with A. salmonicida at 1, 2, 3, and 4 h post-infection compared with the control group (Figure 3B).
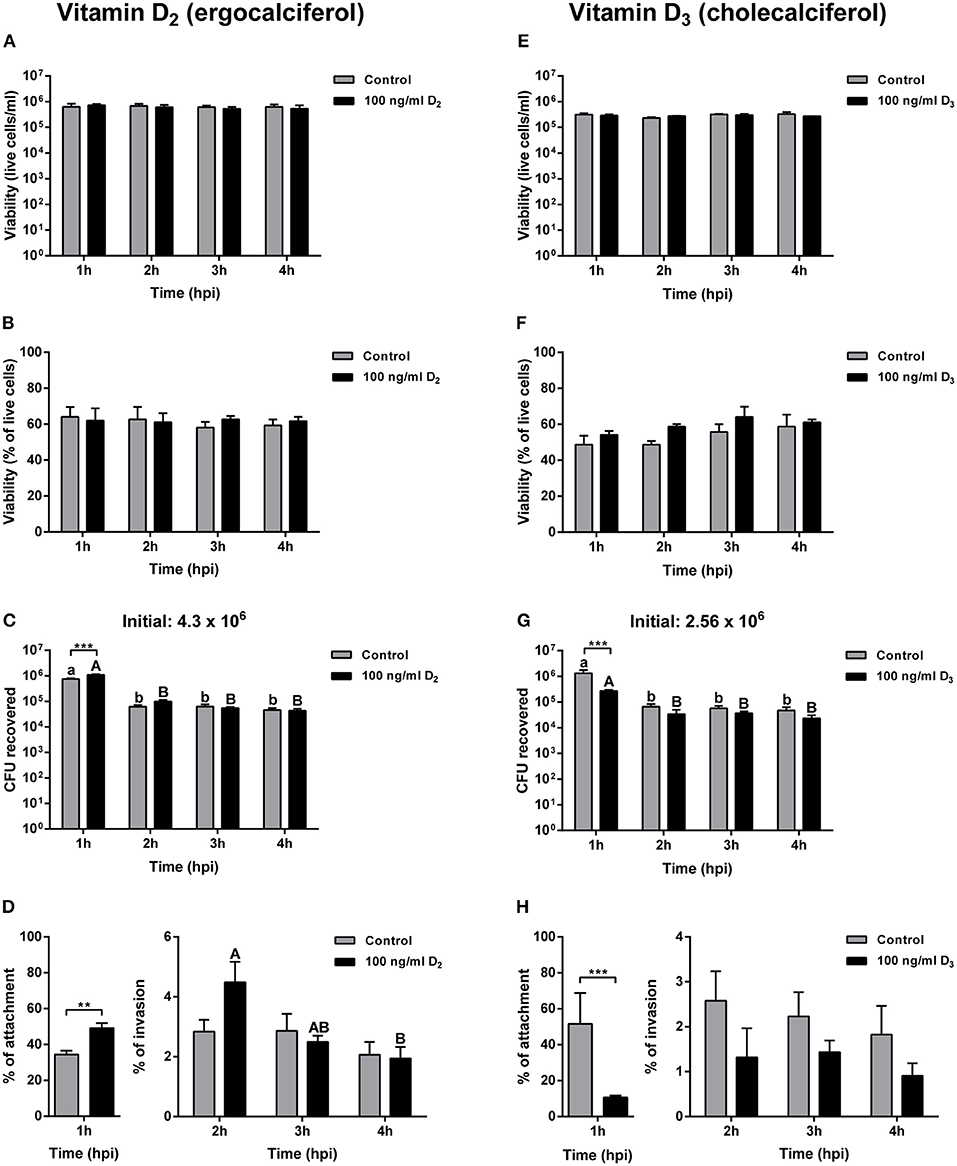
Figure 3. Gentamicin exclusion assay in Atlantic salmon primary macrophages pre-treated for 24 h with either control or 100 ng ml−1 of vitamin D2 or vitamin D3, and then infected with Aeromonas salmonicida subsp. salmonicida. Live cells of primary macrophages pre-treated with vitamin D2 (A), or vitamin D3 (E); percentage of viability of primary macrophages pre-treated with vitamin D2 (B), or vitamin D3 (F), Colony forming unit (CFU) of A. salmonicida in Atlantic salmon primary macrophages pre-treated with vitamin D2 (C), or vitamin D3 (G); and percentage of attachment and invasion of A. salmonicida in Atlantic salmon primary macrophages pre-treated with vitamin D2 (D), or vitamin D3 (H), were measured 1, 2, 3, and 4 h post-infection. Initial A. salmonicida inoculum calculated in TSA Congo red plates are shown above the CFU figures. Each value represents the mean ± S.E.M (n = 6). Asterisks (*) represent significant differences between treatments on each time-point (**p < 0.01, ***p < 0.001). Lower case letters (a, b) show differences in the control at different time points post-infection. Upper case letters (A, B) show differences in vitamin D2 or D3 pre-treated cells in different time points post-infection.
The primary macrophages were infected with a total of 4.3 × 10⁶ CFU per ml at a MOI of 1. The percentage of A. salmonicida attached was significantly higher in primary macrophages pre-treated with vitamin D2 (49.09 ± 2.76%) compared with the control group (34.39 ± 2.12%) (Figure 3D). At invasion time-points, after 2 h of infection no significant differences were observed in cells pre-treated with vitamin D2 compared with the control group at the same time point (Figure 3D). Moreover, no significant differences were observed in the control group and the vitamin D2 pre-treated primary macrophages after 3 h of infection with A. salmonicida (Figure 3D). No significant differences were also found between the control and the vitamin D2 treatment 4 h post-infection. However, a significant decrease in bacterial invasion was observed between 2 and 4 h in the primary macrophages pre-treated with vitamin D2 (Figure 3D).
A similar response was obtained in cells pre-treated for 24 h with vitamin D3 and then infected with A. salmonicida. For instance, no significant differences were found in the percentage of viability between the control group after 1, 2, 3, and 4 h of infection and the vitamin D3 pre-treated macrophages at 1, 2, 3, and 4 h (Figure 3F).
Atlantic salmon primary macrophages pre-treated with vitamin D3 were infected with a total of 2.56 × 10⁶ bacterial cells per ml−1 (Figure 3G). The percentage of attachment (1 h post-infection) was significantly lower in the primary macrophages pre-treated for 24 h with vitamin D3 (10.61 ± 0.97%) compared with the control group (51.56 ± 17.12%) (Figure 3H). In contrast, even when a tendency of lower invasion is observed, no significant differences were observed between the control group after 2, 3, and 4 h of infection compared with the fish cells pre-treated with vitamin D3 (Figure 3H).
Atlantic Salmon Primary Macrophages Gene Expression
Transcript levels of innate immune response-related genes were evaluated by qPCR in Atlantic salmon primary macrophages after 3 h of the aforementioned treatments.
In the experiments conducted for both vitamin D2 and D3, a significant increase in the transcript expression of il-1b (Figures 4A,F), il-8 (Figures 4B,G), tnf-α (Figures 4C,H), and stlr5 (Figures 4E,J) was observed in cells inoculated with live A. salmonicida, formalin-killed A. salmonicida, and in cells pre-treated with either vitamin D2 or D3 and then infected, compared to the PBS inoculated primary macrophages. In contrast, no differences in the expression of il-1b, il-8, tnf-α, and stlr5 were observed in Atlantic salmon cells inoculated only with 100 ng ml−1 or 1,000 ng ml−1 of each vitamin D form compared with the control (Figures 4A–C,E–H,J).
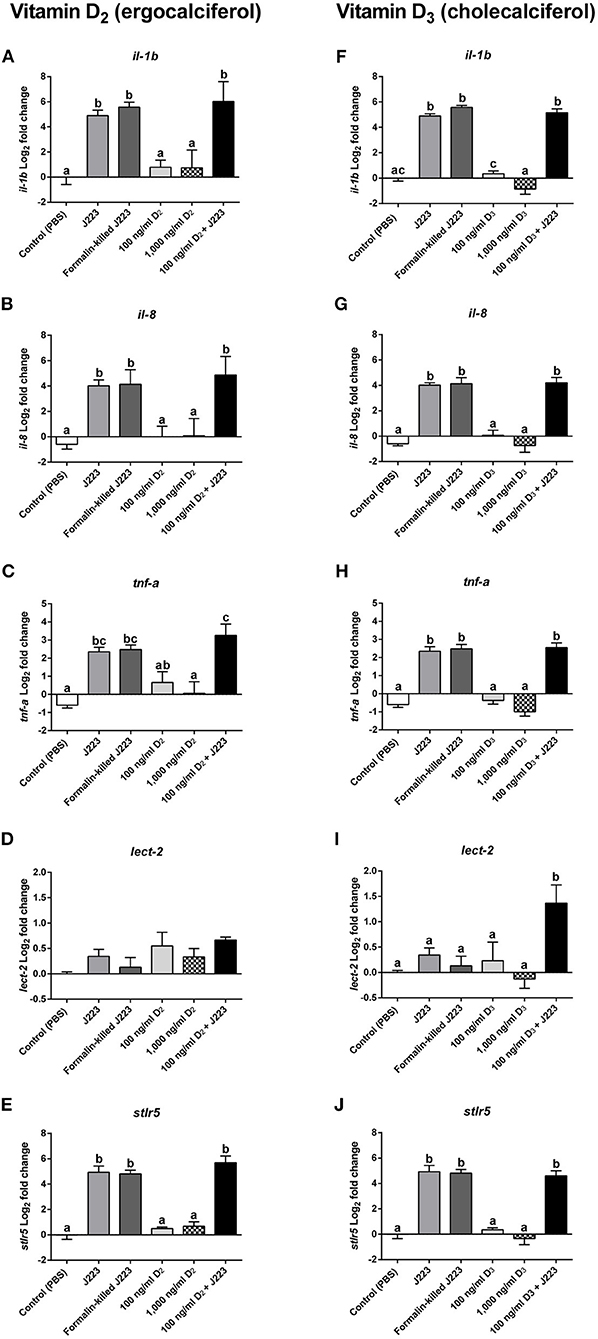
Figure 4. Gene expression of (A,F) Interleukin 1b (il-1b), (B,G) Interleukin 8 (il-8), (C,H) Tumor necrosis factor alpha (tnf-α), (D,I) Leukocyte-derived chemotaxin 2 (lect-2), and (E,J) soluble toll-like receptor 5 (stlr5) in Atlantic salmon primary macrophages isolated from head kidney pre-treated 24 h with either the control, vitamin D2 (100 and 1,000 ng ml−1) or vitamin D3 (100 and 1,000 ng ml−1), and then inoculated with PBS (control) or infected with live (J223) or exposed to formalin-killed A. salmonicida for 3 h. Relative expression was calculated using the 2(−ΔΔCt) method and Log2 converted using β-actin and 60S ribosomal protein L32 (rpl32) as internal reference genes. Each value is the mean ± S.E.M (n = 6). Different letters represent significant differences between treatments, p < 0.05.
A different pattern was observed in the expression of lect-2 transcript between both treatments. For instance, in cells pre-treated with vitamin D2, no significant differences were observed in the expression of lect-2 in any of the treatments compared with the PBS inoculated primary macrophages (Figure 4D). In contrast, lect-2 was significantly up-regulated compared with the control in primary macrophages pre-treated with vitamin D3 and then challenged with A. salmonicida (Figure 4I). The primary macrophages treated with live A. salmonicida, formalin-killed A. salmonicida, 100 ng ml−1 of vitamin D3, and 1,000 ng ml−1 of vitamin D3 did not show significant differences in the expression of lect-2 compared with the control (Figure 4I).
Phagocytosis Assay
Atlantic salmon primary macrophages did not show significant differences in phagocytosis after 24 h of treatment with 100 ng ml−1 of vitamin D2 (4.80 ± 1.62%) and vitamin D3 (4.93 ± 1.56%), 1,000 ng ml−1 of vitamin D2 (3.33 ± 0.67%) and vitamin D3 (2.67 ± 0.41%), and 10,000 ng ml−1 of vitamin D2 (0.97 ± 0.20%) and vitamin D3 (0.87 ± 0.09%) compared with the control cells (4.80 ± 1.08%) (Supplementary Figure 1).
Discussion
Vitamin D is involved in important processes including mineral metabolism, cell growth, and cardiovascular physiology, among others (1–6). Moreover, it has been observed that vitamin D can stimulate the antibacterial immune response in mammals (7, 8). However, these effects and mechanisms have not been explored in fish cells. The two major sources of vitamin D in natural environments are vitamin D2 and D3, being obtained in fish after the ingestion of phytoplankton and zooplankton, respectively (9, 10). Different from terrestrial vertebrates that rely on the conversion of 7-dehydrocholesterol to vitamin D by using solar ultraviolet light (wavelength 380–500 nm) through the skin, fish seems to have alternative mechanims to obtaining vitamin D (4). For instance, it has been hypothesized that bony scales that are part of the fish skin are able to focus and convert the photons obtained from the blue light to breakdown the 7-dehydrocholesterol into vitamin D (53). This does not mean that fish lack of the mechanisms for photosynthesis of vitamin D through the skin. For instance, has been reported that rainbow trout (Oncorhynchus mykiss) and Mozambique tilapia (Tilapia mossambicus) have the mechanisms to convert 7-dehydrocholesterol into vitamin D, however, authors concluded that in natural environments photosynthesis of vitamin D does not play a significant role (4, 9, 54).
Initially it was thought that both vitamin D forms had the same impact on physiology (55), however, several studies have shown that vitamin D3 is much more potent compared with vitamin D2 (55, 56). This evidence suggests a differential modulation on the physiology of fish (i.e., innate immune system) in the presence of the specific vitamin D forms. Also, the effect that vitamin D forms can have on the growth of A. salmonicida has not yet been described.
To evaluate if A. salmonicida is able to grow in the presence of vitamin D2 and D3, a growth curve experiment was conducted in the presence of different concentrations of vitamin D2 and vitamin D3 for 48 h. Our results showed that only high concentrations of vitamin D2 and D3 reduced the growth of A. salmonicida after 48 h (Figures 1A,B). Normally, A. salmonicida is able to reach the stationary growth phase in ~36 h (24, 57, 58). We observed a similar pattern of growth previously observed in A. salmonicida J223 strain (24) in culture media containing low concentrations of vitamin D3 (100 and 1,000 ng ml−1). Nevertheless, A. salmonicida seemed to tolerate higher concentrations of vitamin D2 since only the highest concentration (100,000 ng ml−1) reduced its growth rate. A previous study showed that high doses of vitamin C (128, 512, and 2048 mg/ml) can inhibit the growth of Helicobacter pylori, a risk factor for gastric carcinoma in mammals, during in vitro and in vivo experiments (59). Additionally, it has been reported that high concentrations of vitamin C (90 μM) can also inhibit the growth of S. aureus in in vitro conditions (60). High concentrations of vitamin D2 and D3 decreased the growth rate of S. aureus strain A1 after 24 h (14, 61). However, no significant differences were observed in the growth rate of S. aureus subsp. aureus (ATCC 27543) in the presence of different concentrations of vitamin D3 after 48 h (8, 62). These results indicate that in the bacterial strains studied, vitamin D can inhibit growth when it is utilized in concentrations over 1,000 ng ml−1, affecting both Gram negative and Gram positive bacteria.
The primary Atlantic salmon macrophage viability decreased after 24 and 48 h of exposure to 100,000 ng ml−1 of vitamin D2, and a lower viability compared with the control was observed after 48 h with 10,000 ng ml−1 of vitamin D3 (Figure 2). Similar to our results, it has been observed that low concentrations of vitamin D3 (1, 10, and 50 nM) did not affect the viability of bovine mammary epithelial cells at 24 h (8). However, it has been reported that a decrease in the viability of bovine mammary epithelial cells in the presence of high concentrations of vitamin D2 (6,000, 8,000, 10,000, 12,000, and 14,000 ng ml−1) and D3 (8,000, 10,000, 12,000, and 14,000 ng ml−1) occurred after 24 h of exposure, suggesting that vitamin D can induce cell cycle arrest, apoptosis, or both (14, 63).
In Atlantic salmon, the estimated concentration of vitamin D in flesh varies between 2.9 μg to 18.5 μg per 100 g−1 (64). In our studies, the vitamin D concentrations utilized were similar to other studies conducted in mammalian cells used as a reference (8, 13, 14). The values obtained in the A. salmonicida growth curve and Atlantic salmon primary macrophages exposed to different concentrations of vitamin D2 and D3 (Figures 1, 2), were utilized to determine the final non-toxic vitamin concentration (100 ng ml−1) for further infection assays. The number of live cells and percentage of viability of Atlantic salmon primary macrophages after 1, 2, 3, and 4 h of infection did not show significant differences between the control and the vitamin D2 or D3 pre-treated cells (Figures 2A,B,E,F). Our findings agree with previous infection assays using A. salmonicida J223 in Atlantic cod primary macrophages, where no significant differences were observed in macrophage viability after 6 h of infection (42). This indicated that Atlantic salmon and Atlantic cod primary macrophages were not killed during this period by A. salmonicida J223. We previously suggested (42) that A. salmonicida controls the macrophages machinery to prevent cell apoptosis. As mentioned previously, vitamin D3 in high concentration (8,000, 10,000, 12,000, and 14,000 ng ml−1) could induce apoptosis (14, 63), perhaps in opposition to this suggested prevention of apoptosis produced by A. salmonicida (42). These results agree with the lower attachment and infection rates of A. salmonicida in cells pre-treated with D3, where vitamin D3 might interfere with the infection.
One of the most interesting findings of our results is related to the bacterial attachment and invasion. For instance, a significant increase in A. salmonicida infection was observed at 1 h post-infection in primary macrophages pre-treated with vitamin D2 compared with the control (Figures 3C,D). In contrast, a significant decrease in A. salmonicida attachment at 1 h was observed in cells pre-treated with vitamin D3 compared with the control (Figures 3G,H). Previous studies indicated that vitamin D3 has a stronger activity compared to vitamin D2 in terrestrial mammals (55, 56). This agrees with our results where pre-treatment of primary macrophages with vitamin D3 decreased A. salmonicida infection; while vitamin D2 in contrast, seems to increase it infection. Our findings agree with the beneficial utilization of vitamin D3 in aquafeeds (4, 65, 66) and with vitamin D3 potentially having a broad positive effect in all vertebrates, including fish.
To complement our results described above, we explored part of the immune mechanism behind the beneficial effects of vitamin D by profiling the expression of specific innate immune genes using qPCR. An up-regulation of il-1b, il-8, tnf-α, and stlr5 occurred in primary macrophages inoculated with either live or formalin-killed A. salmonicida (Figures 4A–C,E–H,J). These results were expected, since cytokines and chemokines, such as il-1b, il-8, tnf-α, and the pattern recognition receptor (PRR) stlr5, play essential roles controlling both acute and chronic inflammation in fish tissues mediated by macrophages (39). In Atlantic salmon, the evidence shows that this canonical macrophage innate immune response can be triggered rapidly by either a bacterial pathogen-associated molecular pattern (PAMP), such as lipopolysaccharide (LPS), or pathogens like Yersinia ruckeri, Aeromonas salmonicida, Pseudomonas aeruginosa, and Flavobacterium psychrophilum, among others (39, 67–70).
Some viruses, bacteria, and parasites can modify the expression of genes related with the host immune response as part of a mechanism of evading its defense mechanisms (71). In humans, three important infectious diseases (e.g., HIV, tuberculosis, and malaria) have developed highly effective mechanisms to subvert the immune response (71), making it difficult to control these diseases and develop effective vaccines. Further examples of this are Yersinia pseudotuberculosis and Y. enterocolitica which are able to control human macrophage immune response and induce apoptosis after the translocation of effector molecules through the type III secretion system (72–74).
In fish head kidney, a modulation of the expression of il-1b and the major histocompatibility complex class 1 (mhc-I) has been observed in Atlantic salmon after being infested by the sea louse Lepeophtheirus salmonis (75). Moreover, Lewis et al. (76) showed in an Atlantic salmon head kidney (SHK-1) cell line that L. salmonis produces substances that modify the expression of genes encoding inflammatory mediators. Here, our results obtained during the infection with live A. salmonicida in Atlantic salmon primary macrophages showed no significant differences in the expression of leukocyte-derived chemotaxin 2 (lect-2) compared with the control (Figures 4D,I). When the fish cells were pre-treated with vitamin D2 and then infected with live bacteria, the gene expression also did not increase, suggesting that lect-2 is not involved in the first line of defense against A. salmonicida in Atlantic salmon. However, the expression of lect-2 in Atlantic salmon macrophages pre-treated with vitamin D3 and challenged with live A. salmonicida was significantly up-regulated compared to the control (Figure 4I). lect-2 is a chemotactic factor involved in the recruitment of neutrophils to the site of infection (39, 77). In the study conducted by Smith et al. (39), an up-regulation of lect-2 was observed only in treatments with LPS, confirming that its role in the presence of external pathogenic agents is active in Atlantic salmon. Comparing the expression of lect-2 in primary macrophages treated with live A. salmonicida and the samples pre-treated with vitamin D3 and then inoculated with A. salmonicida, our results suggest that A. salmonicida prevent the transcriptional response of lect-2, perhaps to prevent neutrophil recruitment during infection. Our results suggest that pre-treatments with vitamin D3 can counteract the effect of A. salmonicida on this particular gene, and up-regulate the expression of lect-2 during A. salmonicida infection (Figure 4I).
To determine if vitamin D2 and D3 can also cause an effect on the phagocytosis of Atlantic salmon primary macrophages, the phagocytic activity was tested using fluorescent latex beads (Supplementary Figure 1). Phagocytosis is used by organisms to eliminate external agents such as bacteria in a highly efficient way (42, 52, 78, 79). The effect of vitamins on macrophages' phagocytic activity has been previously tested in Atlantic salmon, however, no significant variations were observed after treatments with vitamin C or vitamin E (80, 81). We found similar results in Atlantic salmon primary macrophages after 24 h pre-treatments with either vitamin D2 or D3, suggesting that, independent of the vitamin D used, the phagocytic activity of Atlantic salmon macrophages is not modulated by its action.
Conclusion
In this study we evaluated the effects of vitamin D2 and D3 on A. salmonicida growth, Atlantic salmon primary macrophage viability, and the fish cells' immune response. We determined that only high concentrations of vitamin D2 (100,000 ng ml−1) and vitamin D3 (1,000 and 10,000 ng ml−1) decreased the growth rate of A. salmonicida. Moreover, we determined that 100,000 ng ml−1of vitamin D2 and 10,000 ng ml−1 of vitamin D3 decreased the viability of Atlantic salmon primary macrophages after 24 and 48 h. These results suggest that high doses of D2 and D3 are toxic for the bacterial and the eukaryotic cells.
Pre-treatment of primary macrophages with 100 ng ml−1of either vitamin D2 or D3 did not have effects on cell viability. Nevertheless, one of the remarkable findings of our study was that pre-treatment with vitamin D3 reduced A. salmonicida attachment, meanwhile, pre-treatment with vitamin D2 increased attachment, and as a consequence also increased bacterial invasion.
Gene expression of il-1b, il-8, tnf-α, and stlr5 was up-regulated during A. salmonicida infection, agreeing with a canonical innate immune response. However, our results suggested that A. salmonicida was able to suppress the expression of lect-2, a gene involved in neutrophil recruitment, key in the fight against pathogen clearance. After the addition of vitamin D2, no variation in the transcriptional expression of this gene was observed. However, cells pre-treated with vitamin D3 and then inoculated with live A. salmonicida, showed an up-regulation of lect-2, suggesting that vitamin D3 can be useful to counteract the suppression triggered by the pathogen.
Altogether, our results show that vitamin D3 seems to be a good candidate to be used as an immunostimulant in Atlantic salmon against A. salmonicida infection. The mechanisms on how vitamin D3 modulates the S. salar macrophage immunity and its relation to specific receptors, like the vitamin D receptor, deserve future attention. In contrast, vitamin D2 did not appear to have an effect on the modulation of the immune system of Atlantic salmon, suggesting that vitamin D2 may not play an important role in the fish innate antibacterial immune response.
Data Availability Statement
All datasets generated for this study are included in the article/Supplementary Material.
Ethics Statement
The animal study was reviewed and approved by the Memorial University Institutional Animal Care Committee.
Author Contributions
MS-D and JS: conception and design of research, prepared figures, and drafted the manuscript. MS-D: macrophage isolation. JH: primer design. MS-D, KV, and SI: performed the experiments. MS-D, MR, and JS: interpreted the results of the experiments. MS-D, KV, SI, JH, MR, and JS: edited and revised the manuscript and approved the final version of the manuscript. MR and JS: funding support.
Funding
The authors are grateful to the support provided by Vitamin Initiative—Ocean Frontier Institute; Canada First—Ocean Frontier Institute (Module J.3); Memorial University Seed, Bridge and Multidisciplinary Funds; and NSERC-Discovery grants (2018-05942 to JS and 341304-2012 to MR).
Conflict of Interest
The authors declare that the research was conducted in the absence of any commercial or financial relationships that could be construed as a potential conflict of interest.
Acknowledgments
The authors thank the Dr. Joe Brown Aquatic Research Building (JBARB) staff for their assistance with the fish. We would like to thank Ma. Ignacia Diaz (Marine Microbial Pathogenesis and Vaccinology Laboratory) for her logistic support.
Supplementary Material
The Supplementary Material for this article can be found online at: https://www.frontiersin.org/articles/10.3389/fimmu.2019.03011/full#supplementary-material
References
1. Zittermann A. Vitamin D in preventive medicine: are we ignoring the evidence? Br J Nutr. (2003) 89:552–72. doi: 10.1079/BJN2003837
2. Grant W. Epidemiology of disease risks in relation to vitamin D insufficiency. Prog Biophys Mol Bio. (2006) 92:65–79. doi: 10.1016/j.pbiomolbio.2006.02.013
3. Lips P. Vitamin D physiology. Prog Biophys Mol Bio. (2006) 92:4–8. doi: 10.1016/j.pbiomolbio.2006.02.016
4. Lock EJ, Waagbø R, Wendelaar-Bonga S, Flick G. The significance of vitamin D for fish: a review. Aquac Nutr. (2010) 16:100–16. doi: 10.1111/j.1365-2095.2009.00722.x
5. Borges M, Martini L, Rogero M. Current perspectives on vitamin D, immune system, and chronic diseases. Nutrition. (2011) 27:399–404. doi: 10.1016/j.nut.2010.07.022
6. Wang L, Xu H, Wang Y, Wang C, Li J, Zhao Z, et al. Effects of the supplementation of vitamin D3 on the growth and vitamin D metabolites in juvenile Siberian sturgeon (Acipenser baerii). Fish Physiol Biochem. (2017) 43:901–9. doi: 10.1007/s10695-017-0344-5
7. Miller J, Gallo R. Vitamin D and innate immunity. Dermatol Ther. (2010) 23:13–22. doi: 10.1111/j.1529-8019.2009.01287.x
8. Téllez-Pérez A, Alva-Murillo N, Ochoa-Zarzosa A, López-Meza J. Cholecalciferol (vitamin D) differentially regulates antimicrobial peptide expression in bovine mammary epithelial cells: Implications during Staphylococcus aureus internalization. Vet Microbiol. (2012) 160:91–8. doi: 10.1016/j.vetmic.2012.05.007
9. Rao DS, Raghuramulu N. Food Chain as Origin of Vitamin D in Fish. Comp Biochem Physiol A Mol Integr Physiol. (1996) 114:15–9. doi: 10.1016/0300-9629(95)02024-1
10. Darias M, Mazurais D, Koumoundouros G, Cahu C, Zambonino-Infante J. Overview of vitamin D and C requirements in fish and their influence on the skeletal system. Aquaculture. (2011) 315:49–60. doi: 10.1016/j.aquaculture.2010.12.030
11. Mora JR, Iwata M, von Andrian U. Vitamin effects on the immune system: vitamins A and D take centre stage. Nat Rev Immunol. (2008) 8:685–98. doi: 10.1038/nri2378
12. Prentice A, Goldberg G, Schoenmakers I. Vitamin D across the lifecycle: physiology and biomarkers. Am J Clin Nutr. (2008) 88:500S−6. doi: 10.1093/ajcn/88.2.500S
13. Alva-Murillo N, Téllez-Pérez A, Medina-Estrada I, Álvarez-Aguilar C, Ochoa-Zarzosa A, López-Meza J. Modulation of the inflammatory response of bovine mammary epithelial cells by cholecalciferol (vitamin D) during Staphylococcus aureus internalization. Microb Pathog. (2014) 77:24–30. doi: 10.1016/j.micpath.2014.10.006
14. Yue Y, Hymøller L, Jensen S, Lauridsen C, Purup S. Effects of vitamin D and its metabolites on cell viability and Staphylococcus aureus invasion into bovine mammary epithelial cells. Vet Microbiol. (2017) 203:245–51. doi: 10.1016/j.vetmic.2017.03.008
15. Sadarangani S, Whitaker J, Poland G. “Let There Be Light”: The role of Vitamin D in the immune response to vaccines. Expert Rev Vaccines. (2015) 14:1427–40. doi: 10.1586/14760584.2015.1082426
16. Asche F, Roll K, Sandvold H. Sørvig A, Zhang D. Salmon aquaculture: Larger companies and increased production. Aquacult Econ Manage. (2013) 17:322–39. doi: 10.1080/13657305.2013.812156
17. Liu Y, Rosten T, Henriksen K, Hognes E, Summerfelt S, Vinci B. Comparative economic performance and carbon footprint of two farming models for producing Atlantic salmon (Salmo salar): Land-based closed containment system in freshwater and open net pen in seawater. Aquacult Eng. (2016) 71:1–12. doi: 10.1016/j.aquaeng.2016.01.001
18. FAO (2018). The State of World Fisheries and Aquaculture (SOFIA) - Meeting the Sustainable Development Goals, Food and Agriculture Organization, Rome, Italy.
19. Fryer J.L., Sanders JE. Bacterial kidney disease of salmonid fish. Ann. Rev. Microbiol. (1981) 35, 273–298. doi: 10.1146/annurev.mi.35.100181.001421
20. Cvitanich JD, Gárate O, Smith CE. The isolation of a Rickettsia-like organism causing disease and mortality in Chilean salmonids and its confirmation by Koch's postulate. J Fish Dis. (1991) 14:121–45. doi: 10.1111/j.1365-2761.1991.tb00584.x
21. Toranzo AE, Magariños B, Romalde JL. A review of the main bacterial fish diseases in mariculture systems. Aquaculture. (2005) 246:37–61. doi: 10.1016/j.aquaculture.2005.01.002
22. Higuera G, Bastías R, Tsertsvadze G, Romero J, Espejo R. Recently discovered Vibrio anguillarum phages can protect against experimentally induced vibriosis in Atlantic salmon, Salmo salar. Aquaculture. (2013) 392–395:128–33. doi: 10.1016/j.aquaculture.2013.02.013
23. Maisey K, Montero R, Christodoulides M. Vaccines for Piscirickettsiosis (salmonid rickettsial septicaemia, SRS): The Chile perspective. Expert Rev Vaccines. (2016) 16:215–28. doi: 10.1080/14760584.2017.1244483
24. Valderrama K, Saravia M, Santander J. Phenotype of Aeromonas salmonicida sp. salmonicida cyclic adenosine 3',5'-monophosphate receptor protein (Crp) mutants and its virulence in rainbow trout (Oncorhynchus mykiss). J Fish Dis. (2017) 40:1849–56. doi: 10.1111/jfd.12658
25. Kaatari S, Tripp R. Cellular mechanisms of glucocorticoid immunosuppression in salmon. J Fish Biol. (1987) 31:129–32. doi: 10.1111/j.1095-8649.1987.tb05304.x
26. Robertson L, Thomas P, Arnold C, Trant J. Plasma cortisol and secondary stress responses of red drum to handling, transport, rearing density, and a disease outbreak. Prog Fish Cult. (1987) 49:1–12.
27. Siwicki AK, Anderson DP, Rumsey GL. Dietary intake of immunostimulants by rainbow trout affects non-specific immunity and protection against furunculosis. Vet Immunol Immunopathol. (1994) 41:125–39. doi: 10.1016/0165-2427(94)90062-0
28. Murray AL, Pascho RJ, Alcorn SW, Fairgrieve WT, Shearer KD, Roley D. Effects of various feed supplements containing fish protein hydrolysate or fish processing by-products on the innate immune functions of juvenile coho salmon (Oncorhynchus kisutch). Aquaculture. (2003) 220:643–53. doi: 10.1016/S0044-8486(02)00426-X
29. Dawood MA, Koshio S, Esteban MA. Beneficial roles of feed additives as immunostimulants in aquaculture: a review. Rev Aquacult. (2017) 10:950–74. doi: 10.1111/raq.12209
30. Sakai M. Current research status of fish immunostimulants. Aquaculture. (1999) 172:63–92. doi: 10.1016/S0044-8486(98)00436-0
31. Oliva-Teles A. Nutrition and health of aquaculture fish. J Fish Dis. (2012) 35:83–108. doi: 10.1111/j.1365-2761.2011.01333.x
32. Cook MT, Hayball PJ, Hutchinson W, Nowak BF, Hayball JD. Administration of a commercial immunostimulant preparation, EcoActivaTM as a feed supplement enhances macrophage respiratory burst and the growth rate of snapper (Pagrus auratus, Sparidae (Bloch and Schneider)) in winter. Fish Shellfish Immun. (2003) 14:333–45. doi: 10.1006/fsim.2002.0441
33. Bridle A, Carter C, Morrison R, Nowak B. The effect of β-glucan administration on macrophage respiratory burst activity and Atlantic salmon, Salmo salar L., challenged with amoebic gill disease – evidence of inherent resistance. J Fish Dis. (2005) 28:347–56. doi: 10.1111/j.1365-2761.2005.00636.x
34. Song SK, Beck BR, Kim D, Park J, Kim J, Kim HD, et al. Prebiotics as immunostimulants in aquaculture: a review. Fish Shellfish Immunol. (2014) 40:40–8. doi: 10.1016/j.fsi.2014.06.016
35. Secombes CJ, Fletcher TC. The role of phagocytes in the protective mechanisms of fish. Annu Rev Fish Dis. (1992) 2:53–71. doi: 10.1016/0959-8030(92)90056-4
36. Esteban MA, Cuesta A, Chaves-Pozo E, Meseguer J. Phagocytosis in Teleosts. Impl N Cells Involved Biol. (2015) 4:907–22. doi: 10.3390/biology4040907
37. Torrecillas S, Makol A, Benítez-Santana T, Caballero MJ, Montero D, Sweetman J, et al. Reduced gut bacterial translocation in European sea bass (Dicentrarchus labrax) fed mannan oligosaccharides (MOS). Fish Shellfish Immunol. (2011) 30:674–81. doi: 10.1016/j.fsi.2010.12.020
38. Vogt L, Ramasamy U, Meyer D, Pullens G, Venema K, Faas MM, et al. Immune modulation by different types of β2 → 1-fructans is toll-like receptor dependent. PLoS ONE. (2013) 8:e68367. doi: 10.1371/journal.pone.0068367
39. Smith NC, Christian SL, Taylor RG, Santander J, Rise ML. Immune modulatory properties of 6-gingerol and resveratrol in Atlantic salmon macrophages. Mol Immunol. (2018) 95:10–9. doi: 10.1016/j.molimm.2018.01.004
40. Szodoray P, Nakken B, Gaal J, Jonsson R, Szegedi A, Zold E, et al. The complex role of vitamin D in autoimmune diseases. Scand J Immunol. (2008) 68:261–9. doi: 10.1111/j.1365-3083.2008.02127.x
41. Chagas C, Borges MC, Martini L, Rogero M. Focus on Vitamin D, Inflammation and Type 2 Diabetes. Nutrients. (2012) 4:52–67. doi: 10.3390/nu4010052
42. Soto-Dávila M, Hossain A, Chakraborty S, Rise ML, Santander J. Aeromonas salmonicida subsp. salmonicida early infection and immune response of Atlantic cod (Gadus morhua L) primary macrophages. Front Immunol. (2019) 10:1237. doi: 10.3389/fimmu.2019.01237
43. Sung K, Khan SA, Nawaz MS, Khan AA. A simple and efficient Triton X-100 boiling and chloroform extraction method of RNA isolation from Gram-positive and Gram-negative bacteria. FEMS Microbiol Lett. (2003) 229:97–101. doi: 10.1016/S0378-1097(03)00791-2
44. Santander J, Kilbourne J, Park JY, Martin T, Loh A, Diaz I, et al. Inflammatory effects of Edwardsiella ictaluri lipopolysaccharide modifications in catfish gut. Infect Immun. (2014) 82:3394–404. doi: 10.1128/IAI.01697-14
45. Sambrook J, Russell DW. Molecular Cloning: A Laboratory Manual. 3 rd ed. Cold Spring Harbor, NY: Cold Spring Harbor Laboratory (2001).
46. Xue X, Hixson SM, Hori TS, Booman M, Parrish CC, Anderson DM, et al. Atlantic salmon (Salmo salar) liver transcriptome response to diets containing Camelina sativa products. Comp Biochem Physiol D Genomics Proteomics. (2015) 14:1–15. doi: 10.1016/j.cbd.2015.01.005
47. Pontigo JP, Agüero MJ, Sanchez P, Oyarzún R, Vargas-Lagos C, Mancilla J, et al. Identification and expressional analysis of NLRC5 inflammasome gene in smolting Atlantic salmon (Salmo salar). Fish Shellfish Immunol. (2016) 58:259–65. doi: 10.1016/j.fsi.2016.09.031
48. Heidaru Z, Tinsley J, Bickerdike R, McLoughlin MF, Zou J, Martin SAM. Antiviral and metabolic gene expression responses to viral infection in Atlantic salmon (Salmo salar). Fish Shellfish Immunol. (2015) 42:297–305. doi: 10.1016/j.fsi.2014.11.003
49. Caballero-Solares A, Hall JR, Xue X, Eslamloo K, Taylor RG, Parrish CC, et al. The dietary replacement of marine ingredients by terrestrial animal and plant alternatives modulates the antiviral immune response of Atlantic salmon (Salmo salar). Fish Shellfish Immunol. (2017) 64:24–38. doi: 10.1016/j.fsi.2017.02.040
50. Pfaffl MW. A new mathematical model for relative quantification in real-time RT–PCR. Nucleic Acids Res. (2001) 29:e45. doi: 10.1093/nar/29.9.e45
51. Livak KJ, Schmittgen TD. Analysis of relative gene expression data using real-time quantitative PCR and the 2−ΔΔCT method. Methods. (2001) 25:402–8. doi: 10.1006/meth.2001.1262
52. Øverland H, Pettersen EF, Rønneseth A, Wergeland HI. Phagocytosis by B-cells and neutrophils in Atlantic salmon (Salmo salar L.) and Atlantic cod (Gadus morhua L.). Fish Shellfish Immunol. (2010) 28:193–204. doi: 10.1016/j.fsi.2009.10.021
53. Pierens SL, Fraser DR. The origin and metabolism of vitamin D in rainbow trout. J Steroid Biochem Mol Biol. (2015) 145:58–6. doi: 10.1016/j.jsbmb.2014.10.005
54. Holick MF, Holick SA, Guillard RL. On the origin and metabolism of vitamin D in the sea. In: Oguro C, Pang PKT, editors. Comparative Endocrinology of Calcium Regulation. Tokyo: Japan Scientific Societies Press (1982). p. 85–91.
55. Trang HM, Cole DE, Rubin LA, Pierratos A, Siu S, Vieth R. Evidence that vitamin D3 increases serum 25-hydroxyvitamin D more efficiently than does vitamin D2. Am J Clin Nutr. (1998) 68:854–8. doi: 10.1093/ajcn/68.4.854
56. Ostermeyer U, Schmidt T. Vitamin D and provitamin D in fish. Eur Food Res Technol. (2006) 222:403–13. doi: 10.1007/s00217-005-0086-y
57. Cipriano RC, Bullock G. Furunculosis and other diseases caused by Aeromonas salmonicida. Fish disease leaflet 66. Kearneysville, WV: USGS/Leetown Science Center Fish Health Branch (2001).
58. Connors E, Soto-Dávila M, Hossain A, Vasquez I, Gnanagobal H, Santander J. Identification and validation of reliable Aeromonas salmonicida subspecies salmonicida reference genes for differential gene expression analyses. Infect Genet Evol. (2019) 73:314–21. doi: 10.1016/j.meegid.2019.05.011
59. Zhang H, Wakisaka N, Maeda O, Yamamoto T. Vitamin C inhibits the growth of a bacterial risk factor for gastric carcinoma: Helicobacter pylori. Cancer. (1997) 80:1897–903
60. Kallio J, Jaakkola M, Mäki M, Kilpeläinen P, Virtanen V. Vitamin C inhibits Staphylococcus aureus growth and enhances the inhibitory effect of quercetin on growth of Escherichia coli in vitro. Planta Med. (2012) 78:1824–30. doi: 10.1055/s-0032-1315388
61. Aarestrup FM, Scott NL, Sordillo LM. Ability of Staphylococcus aureus coagulase genotypes to resist neutrophil bactericidal activity and phagocytosis. Infect Immun. (1994) 62:5679–82.
62. Gutiérrez-Barroso A, Anaya-Lopez JL, Lara-Zárate L, Loeza-Lara PD, López-Meza JE, Ochoa-Zarzosa A. Prolactin stimulates the internalization of Staphylococcus aureus and modulates the expression of inflammatory response genes in bovine mammary epithelial cells. Vet Immunol Immunopathol. (2008) 121:113–22. doi: 10.1016/j.vetimm.2007.09.007
63. Samuel S, Sitrin MD. Vitamin D's role in cell proliferation and differentiation. Nutr Rev. (2008) 66:116–24. doi: 10.1111/j.1753-4887.2008.00094.x
64. Jakobsen J, Smith C, Bysted A, Kevin D. Cashman 3 vitamin D in wild and farmed Atlantic salmon (Salmo salar) – What do we know? Nutrients. (2019) 11:982. doi: 10.3390/nu11050982
65. Barnett BJ, Cho CY, Slinger SJ. The essentiality of cholecalciferol in the diets of rainbow trout (Salmo gairdneri). Comp Biochem Physiol. (1979) 63:291–7. doi: 10.1016/0300-9629(79)90162-2
66. Barnett BJ, Cho CY, Slinger SJ. Relative biopotency of dietary ergocalciferol and cholecalciferol and the role of and requirement for vitamin D in rainbow trout (Salmo gairdneri). J Nutr. (1982) 112:2011–9.
67. Martin S, Blaney S, Houlihan D, Secombes CJ. Transcriptome response following administration of a live bacterial vaccine in Atlantic salmon (Salmo salar). Mol Immunol. (2006) 43:1900–11. doi: 10.1016/j.molimm.2005.10.007
68. Bridle A, Nosworthy E, Polinski M, Nowak B. Evidence of an antimicrobial-immunomodulatory role of Atlantic salmon cathelicidins during infection with Yersinia ruckeri. PLoS ONE. (2011) 6:e23417. doi: 10.1371/journal.pone.0023417
69. Santana A, Salinas N, Álvarez C, Mercado L, Guzmán F. Alpha-helical domain from IL-8 of salmonids: mechanism of action and identification of a novel antimicrobial function. Biochem Biophys Res Commun. (2018) 498:803–9. doi: 10.1016/j.bbrc.2018.03.061
70. Hoare R, Jung S, Ngo TPH, Bartie K, Bailey J, Thompson KD, Adams A. Efficacy and safety of a non-mineral oil adjuvanted injectable vaccine for the protection of Atlantic salmon (Salmo salar L.) against Flavobacterium psychrophilum. Fish Shellfish Immun. (2019) 85:44–51. doi: 10.1016/j.fsi.2017.10.005
71. Finlay B, McFadden G. Anti-immunology: evasion of the host immune system by bacterial and viral pathogens. Cell. (2006) 124:767–82. doi: 10.1016/j.cell.2006.01.034
72. Monack D, Mecsas J, Bouley D, Falkow S. Yersinia-induced apoptosis in vivo aids in the establishment of a systemic infection of mice. J Exp Med. (1998) 216:2127–37. doi: 10.1084/jem.188.11.2127
73. Schesser K, Splik A, Dukuzumuremyi J, Neurath M, Petterson S, Wolf-Watz H. The yopJ locus is required for Yersinia-mediated inhibition of NF-kB activation and cytokine expression: YopJ contains a eukaryotic SH2- like domain that is essential for its repressive activity. Mol Microbiol. (1998) 28:1067–79. doi: 10.1046/j.1365-2958.1998.00851.x
74. Gao LY, Kwaik YA. The modulation of host cell apoptosis by intracellular bacterial pathogens. Trends Microbiol. (2000) 8:306–13. doi: 10.1016/S0966-842X(00)01784-4
75. Fast MD, Muise DM, Easy RE, Ross NW, Johnson SC. The effects of Lepeophtheirus salmonis infections on the stress response and immunological status of Atlantic salmon (Salmo salar). Fish Shellfish Immunol. (2006) 21:228–41. doi: 10.1016/j.fsi.2005.11.010
76. Lewis DL, Barker DE, McKinley RS. Modulation of cellular innate immunity by Lepeophtheirus salmonis secretory products. Fish Shellfish Immun. (2014) 38:175–83. doi: 10.1016/j.fsi.2014.03.014
77. Yamagoe S, Yamakawa Y, Matsuo Y, Minowada J, Mizuno S, Suzuki K. Purification and primary amino acid sequence of a novel neutrophil chemotactic factor LECT2. Immunol Lett. (1996) 51:9–13. doi: 10.1016/0165-2478(96)02572-2
78. Rabinovitch M. Professional and non-professional phagocytes: an introduction. Trends Cell Biol. (1995) 5:85–7. doi: 10.1016/S0962-8924(00)88955-2
79. Neumann NF, Stafford JL, Barreda D, Ainsworth AJ, Belosevic M. Antimicrobial mechanisms of fish phagocytes and their role in host defence. Dev Comp Immunol. (2001) 25:807–25. doi: 10.1016/S0145-305X(01)00037-4
80. Hardie LJ, Fletcher TC, Secombes CJ. The effect of vitamin E on the immune response of the Atlantic Salmon (Salmo salar L.). Aquaculture. (1990) 87:1–13. doi: 10.1016/0044-8486(90)90206-3
Keywords: Atlantic salmon, vitamin D3, vitamin D2, innate immunity, primary macrophages, Aeromonas salmonicida, Gram-negative
Citation: Soto-Dávila M, Valderrama K, Inkpen SM, Hall JR, Rise ML and Santander J (2020) Effects of Vitamin D2 (Ergocalciferol) and D3 (Cholecalciferol) on Atlantic Salmon (Salmo salar) Primary Macrophage Immune Response to Aeromonas salmonicida subsp. salmonicida Infection. Front. Immunol. 10:3011. doi: 10.3389/fimmu.2019.03011
Received: 24 September 2019; Accepted: 09 December 2019;
Published: 14 January 2020.
Edited by:
Kim Dawn Thompson, Moredun Research Institute, NorwayReviewed by:
Jorge Galindo-Villegas, Nord University, NorwayNawroz Kareem, Keele University, United Kingdom
Copyright © 2020 Soto-Dávila, Valderrama, Inkpen, Hall, Rise and Santander. This is an open-access article distributed under the terms of the Creative Commons Attribution License (CC BY). The use, distribution or reproduction in other forums is permitted, provided the original author(s) and the copyright owner(s) are credited and that the original publication in this journal is cited, in accordance with accepted academic practice. No use, distribution or reproduction is permitted which does not comply with these terms.
*Correspondence: Javier Santander, anNhbnRhbmRlckBtdW4uY2E=