 Martha A. L. Böning1,2,3
 Stephanie Trittel4
 Peggy Riese4
 Marco van Ham5
 Maxi Heyner5‡Martin Voss2Gerald P. Parzmair2,3‡
 Frank Klawonn5Andreas Jeron1,3
 Carlos A. Guzman4
 Lothar Jänsch5Burkhart Schraven2*†
 Annegret Reinhold2†
 Dunja Bruder1,3*†
- 1Infection Immunology Group, Institute of Medical Microbiology, Infection Control and Prevention, Health Campus Immunology, Infectiology and Inflammation, Otto-von-Guericke University Magdeburg, Magdeburg, Germany
- 2Institute of Molecular and Clinical Immunology, Health Campus Immunology, Infectiology and Inflammation, Otto-von-Guericke University Magdeburg, Magdeburg, Germany
- 3Immune Regulation Group, Helmholtz Centre for Infection Research, Braunschweig, Germany
- 4Vaccinology and Applied Microbiology, Helmholtz Centre for Infection Research, Braunschweig, Germany
- 5Cellular Proteome Research, Helmholtz Centre for Infection Research, Braunschweig, Germany
The adhesion and degranulation-promoting adaptor protein (ADAP) serves as a multifunctional scaffold and is involved in the formation of immune signaling complexes. To date only limited and moreover conflicting data exist regarding the role of ADAP in NK cells. To extend existing knowledge we investigated ADAP-dependency of NK cells in the context of in vivo infection with the intracellular pathogen Listeria monocytogenes (Lm). Ex vivo analysis of infection-primed NK cells revealed impaired cytotoxic capacity in NK cells lacking ADAP as indicated by reduced CD107a surface expression and inefficient perforin production. However, ADAP-deficiency had no global effect on NK cell morphology or intracellular distribution of CD107a-containing vesicles. Proteomic definition of ADAPko and wild type NK cells did not uncover obvious differences in protein composition during the steady state and moreover, similar early response patterns were induced in NK cells upon infection independent of the genotype. In line with protein network analyses that suggested an altered migration phenotype in naïve ADAPko NK cells, in vitro migration assays uncovered significantly reduced migration of both naïve as well as infection-primed ADAPko NK cells compared to wild type NK cells. Notably, this migration defect was associated with a significantly reduced expression of the integrin CD11a on the surface of splenic ADAP-deficient NK cells 1 day post-Lm infection. We propose that ADAP-dependent alterations in integrin expression might account at least in part for the fact that during in vivo infection significantly lower numbers of ADAPko NK cells accumulate in the spleen i.e., the site of infection. In conclusion, we show here that during systemic Lm infection in mice ADAP is essential for efficient cytotoxic capacity and migration of NK cells.
Introduction
The coupling of transmembrane receptors to intracellular signaling pathways is mediated by adapter proteins that are made up of various protein domains without enzymatic or transcriptional activity. Adaptor proteins are central players involved in a number of cellular processes including cell proliferation, migration, and cell cycle regulation (1). The Adhesion and degranulation-promoting adapter protein ADAP, also known as Fyn-binding protein (Fyb) or SLAP-130 serves, amongst others, as a scaffold adapter protein specific for the hematopoietic lineage that so far has been mainly studied in the context of the activation of and effector functions in T cells (2). ADAP consists of several domains that can associate with proteins involved in cell migration, cellular adhesion and re-arrangement of the cytoskeleton in T cells (3). Moreover, ADAP plays an important role in T cell receptor- and chemokine receptor-mediated activation of integrins (inside-out signaling) and mediates signals derived from the interaction of integrins on T cells with ligands on target cells (outside-in signaling) (4, 5). ADAP-deficient T cells show reduced migration toward chemokines (6), impaired formation of the immunological synapse (4, 5) and impaired activation, differentiation and resident memory formation during acute infections (6, 7).
Next to its well-documented expression in T cells, ADAP is also expressed in other cells of the hematopoietic lineage including platelets, myeloid cells (8, 9) unconventional T cells, such as NKT, CD8α, and TCRγδ T cells (10) as well as in Natural Killer (NK) cells (11–13). NK cells are large granular lymphocytes which play a crucial role in the innate immune responses toward tumors and intracellular pathogens (14, 15). NK cells are able to identify malignant and infected cells and their activation occurs following integration of signals delivered by multiple activating and inhibitory receptors expressed on their surface (16, 17). In case the activating signals predominate, target cell death is induced by delivery of the cytolytic effector molecules perforin and granzymes (18). In addition to their inherent cytotoxic function, NK cells exhibit the capacity to produce effector cytokines and chemokines (19, 20), with IFN-γ being the principal NK cell cytokine produced early on during infections (21, 22). IFN-γ plays a central role for the activation of other immune cells needed for effective immunity to pathogens (23, 24). Thus, NK cells act as important immune regulators during infection and inflammation (25). In order to effectively fulfill their immunological functions, numerous cytokines, such as Interleukin (IL)-15, IL-18 (26, 27), IL-2, IL-4, IL-21 (27), and type I interferons (28) secreted by other immune cells are needed to prime NK cell activation, proliferation, and their differentiation into fully armed effector cells (29, 30).
NK cells develop from the same common lymphoid precursor as CD8+ T cells (31) and both cell types share hallmark features like cytotoxicity and effector cytokine secretion. In light of their common ancestry, the fundamental role of ADAP in T cells and the usage of similar signaling pathways in T cells and NK cells, Fostel et al. proposed a similar requirement for ADAP in NK cell development and function. In direct contrast to their expectation, loss of ADAP in NK cells did neither affect NK cell development and function, nor cytotoxicity, IFN-γ production, anti-tumor response, and LFA-1-dependent conjugate formation with target cells (13). Several years later another study came to the opposite conclusion that NK cell activation would rely on ADAP. Here the authors demonstrated both impaired IFN-γ production and cytotoxicity of NK cells lacking ADAP (32). Only shortly later, Rajasekaran et al. uncovered a striking and ADAP-dependent uncoupling of cytokine secretion and cytotoxicity in NK cells (12). Using an experimental model system of CD137 and NKG2D induced in vitro stimulation of NK cells in combination with comprehensive analysis of the molecular signaling machinery utilized during NK cell activation the authors convincingly demonstrated that upon stimulation ADAP connects to the CBM signalosome consisting of the proteins Carma1, Bcl-10, and MALT1. This ADAP-CBM complex was essential for the production of cytokines and chemokines but not for cytotoxicity in murine and human NK cells (12). Taken together, available data regarding the role of ADAP in NK cells are conflicting ranging from a crucial role of ADAP in both pro-inflammatory cytokine production and cytotoxicity (32), an ADAP-dependent uncoupling of cytokine production and cytotoxicity with only cytokine production being dependent on ADAP (12) and the finding that ADAP in NK cells is fully dispensable for their function (13).
While the above mentioned studies utilized different experimental settings and NK cell stimulating ligands they all have in common that ADAP-dependency of principal NK cell functions was largely characterized either in primary or IL-2-activated NK cells following in vitro stimulation of selected NK cell activating receptors. To our knowledge no published data exist regarding the involvement of ADAP in NK cell functions in vivo. Given the fact that under physiological conditions NK cell activation is not induced by the stimulation of a single receptor but is the consequence of integration of signals derived by multiple activating and inhibitory receptors, NK cell activation in vivo is likely more complex than activation induced under in vitro conditions. Thus, we sought to extend existing knowledge regarding the role of ADAP in NK cell function to an in vivo setting. Lm is a facultative intracellular pathogen causing systemic infections that is frequently used as model pathogen. In vivo infection of mice with Lm is known to induce effective NK cell activation (33, 34) in a process involving a complex cellular network of macrophages, neutrophils, and dendritic cells as well as a plethora of soluble mediators derived from these cells (35, 36). Thus, Lm infection, that is well-established in our laboratory (6), represents a suitable tool to study the role of ADAP in NK cell priming, cytokine production and cytotoxicity during in vivo infection.
Materials and Methods
Mice
ADAP wild type and knock out (ADAPko) mice have been described before (37) and were bred in the animal facility at the Helmholtz Center for Infection Research in Braunschweig (Germany) or in the animal facility of the Medical Faculty of the Otto-von-Guericke University Magdeburg (Germany). Mice were kept under specific pathogen-free conditions in environmentally-controlled clean rooms and were used at 8–24 weeks of age. If not otherwise stated, experiments were performed using male mice and were approved by the local government agencies (Niedersächsisches Landesamt für Verbraucherschutz und Lebensmittelsicherheit and Landesamt für Verbraucherschutz, Sachsen-Anhalt). Mice containing the knockout first allele C57BL/6N-Fybtm1a(EUCOMM)Hmgu/Cnrm (38) were sourced from the EUCOMM project and were purchased from the European Mouse Mutant Archive EMMA. In this so called “knockout-first strategy” the ADAP allele is modified up- and downstream of its critical exon 2, the largest exon of ADAP. The lacZ and neomycin-resistance cassettes were both removed by breeding with transgenic mice expressing a Flp recombinase resulting in floxed alleles (containing loxP sites) and restoring the wild type (9). To generate conditional knockout mice with deletion of ADAP in the NK cell lineage, mice with floxed alleles were crossed with NKp46-iCre knock-in mice kindly provided by Prof. Eric Vivier (39). The presence or absence of the FRT sites, the loxP sites, the gene of interest, and the respective Cre transgene were checked routinely by PCR using genomic DNA isolated from ear tissue. To investigate specific effects of ADAP deletion and to exclude off-target effects of Cre recombinase, ADAPwt/wt × Crehet, and ADAPfl/fl × Crehet were always used as littermates. NK cell maturation in the bone marrow as well as distribution of mature NK cells in spleen and peripheral blood was similar in both genotypes (40).
Listeria Monocytogenes Infection
The Listeria monocytogenes (Lm) strain 10403S expressing ovalbumin was used for mouse infection experiments as described before (6, 41). Frozen stocks of Lm were thawed and subsequently diluted in brain heart infusion medium (BHI) followed by overnight growth on agar plates. One day before the infection, an overnight liquid culture (BHI) was prepared which was diluted with fresh medium (1:5) and cultivated at 37°C for 4 h before bacteria were harvested. Bacterial numbers were determined by measuring OD600 using a spectrophotometer and based on a previously established OD/cell-density correlation curve the suspension was further diluted in sterile PBS to the desired infection dose per mouse. Mice were infected by intravenous injection into the tail vein with the calculated dose of 2.5 × 10⁴ bacteria suspended in 100 μl of PBS. To determine the actual infectious dose serial dilutions were plated on BHI agar followed by an overnight incubation of the plate at 37°C. The colonies were counted on the next day which, corrected for the dilution factor, showed the actual number of bacteria that had been applied to the mice. Body weight loss (infection dose: 5 × 10⁴ bacteria) as an indicator for disease severity was measured daily over a period of 8 days. To determine colony forming units (CFU) in the organs of infected animals, mice were sacrificed at the indicated time points, spleens were collected and half of the spleens was homogenized in lysis buffer (PBS containing 0.2% IGEPAL CA-630). Ten microliters of 10-fold serial dilutions were plated on BHI agar plates. The bacterial count (CFU) was obtained by counting the colonies after incubation for 24 h at 37°C.
Quantitative RT-PCR
RNA was isolated from splenocytes using the RNeasy Mini Kit (Qiagen, Hilden, Germany) according to the manufacturer's instructions. RNA was eluted in 100 μl nuclease-free water. RNA content was determined with the NanoDrop ND-1000 spectrophotometer (Thermo Fisher Scientific, Massachusetts, USA). For cDNA synthesis ~1 μg of RNA was transcribed using the Maxima First Strand cDNA Synthesis Kit for RT-qPCR according to the manufactures instructions (Thermo Fisher Scientific). cDNA was used as a template for real-time PCR using SYBR Green I (Roche). RPS9 was used as a housekeeping gene for normalization. Quantitative RT-PCRs were run in duplicates in the LightCycler 480 system II using the primers summarized in Table 1. mRNA sequences were derived from ncbi gene database and intron spanning real time PCR primers were designed accordingly using the web based assay design center (https://lifescience.roche.com/en_de/brands/universal-probe-library.html#assay-design-center) tool from Roche company. All primers were used in a final concentration of 500 nmol/l. The relative expression of the investigated target genes was calculated in relation to the housekeeping gene with the aid of the ΔΔCt method and the LightCycler480 software.
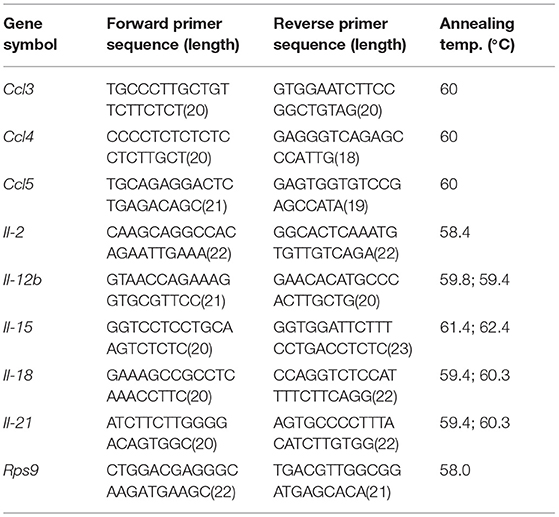
Table 1. Primers used for qRT-PCR.
Serum Preparation and Cytokine Analyses
Mice were sacrificed and blood was obtained by puncture of the heart. Samples were incubated for 30 min at room temperature and for another 30 min at 4°C. After short centrifugation (14,000 rpm) the supernatant was collected and stored at −20°C. For the detection of IL-1α, IL-1β, IL-2, IL-4, IL-10, IL-12p40, IL-12p70, IL-15, IL-18, IL-21, IFN-γ, TNF-α and IFN-β in serum samples a flow cytometry based custom multiplex detection assay (custom LegendPlex, mouse, BioLegend) was used according to the manufacturer's recommendations.
Proteome Analyzes
FACS-sorted NK cells (NKp46+) were lysed in a buffer containing 1% SDS, 1× Complete protease inhibitor cocktail (Roche), 50 mM HEPES pH 8.5, 10 mM DTT for 5 min at 95°C, and rested for 5 min on ice. Benzonase was added and samples were incubated at 37°C for 30 min. After incubation, 5 mM tris(2-carboxyethyl)phosphine (TCEP) was added for 30 min, and 10 mM methyl methanethiosulfonate (MMTS) for 5 min, to reduce and protect cysteine residues, respectively. Protein purification, protein digestion and peptide purification was performed according to a slightly adapted Single-Pot Solid-Phase-enhanced Sample Preparation (SP3) protocol (42, 43). Sequencing grade trypsin (Promega, Fitchburg, WI, USA) was added at a ratio of 1:20 weight per weight in 50 mM HEPES pH 8. After < 14 h incubation at 37°C, samples were slightly acidified using formic acid (FA) shaken and incubated overnight at RT after raising the acetonitrile concentration to at least 95%. Beads containing the adsorbed peptides were washed once with pure acetonitrile and were dried by air. Peptides were eluted in a first step with 20 μl 2% DMSO for 30 min, and in a second step with 20 μl 0.065% FA, 500 mM KCl in 30% acetonitrile (ACN) for 30 min. Peptides were vacuum dried and dissolved in 0.2% trifluoroacetic acid/3% ACN for subsequent ultracentrifugation (50,000× g, 30 min, RT). LC-MS/MS analyses of purified and desalted peptides were performed on a Dionex UltiMate 3000 n-RSLC system connected to an Orbitrap Fusion™ Tribrid™ mass spectrometer (Thermo Scientific, Waltham, MA, USA). Peptides of each sample were loaded onto a C18 precolumn (3 μm RP18 beads, Acclaim, 0.075 × 20 mm), washed for 3 min at a flow rate of 6 μl/min and separated on a C18 analytical column (3 mm, Acclaim PepMap RSLC, 0.075 mm × 50 cm, Dionex, Sunnyvale, CA, USA) at a flow rate of 200 nl/min via a linear 120 min gradient from 97% MS buffer A (0.1% FA) to 25% MS buffer B (0.1% FA, 80% ACN), followed by a 30 min gradient from 25% MS buffer B to 62% MS buffer B. The LC system was operated with the Chromeleon software (version 6.8, Dionex) embedded in the Xcalibur software suite (version 3.0.63, Thermo Scientific). The effluent was electro-sprayed by a stainless steel emitter (Thermo Scientific). Using the Xcalibur software, the mass spectrometer was controlled and operated in the “top speed” mode, allowing the automatic selection of as many doubly and triply charged peptides in a 3 s time window as possible, and the subsequent fragmentation of these peptides. Peptide fragmentation was carried out using the higher energy collisional dissociation mode and peptides were measured in the ion trap (HCD/IT). MS/MS raw data files were processed via the Proteome Discoverer program (version 2.3, Thermo Scientific) using Mascot (version 2.4.1, Matrix Science) as search machine and fasta files from the Swiss-Prot/UniProt database from January 2018. Used Mascot search parameters were: maximum missed cleavage site: 1, precursor mass tolerance: 10 ppm, fragment mass tolerance: 0.05 Da. Oxidation of methionine was set as a variable modification and modification of cysteine by MMTS was set as fixed modification. Filters used in Proteome Discoverer were peptide confidence: high, search engine rank: 1, and false discovery rate: 1%. The entire mass spectrometry proteomics data have been deposited to the ProteomeXchange Consortium via the PRIDE partner repository with the data set identifier PXD016305.
Microscopy
FACS sorted NK cells were seeded onto poly-L-lysine (Sigma) coated coverslips and allowed to adhere for 30 min. Cells were fixed by using 4% paraformaldehyde (Sigma) in PBS for 20 min followed by washing with PBS. Cells were permeabilized using 0.15% Triton-X100 (Sigma) in PBS for 5 min followed by blocking using 1% BSA (Sigma) in PBS containing 0.05% Tween-20 (Roth) for 1 h. Antibodies (anti-α-tubulin: ab52866/Abcam; FITC-labeled anti-CD107a: clone 1D4B/BioLegend; Alexa594-labeled anti-rabbit: A11037/Invitrogen) were applied in blocking solution and staining was performed for 2 h at RT. Cells were washed three times with PBS containing 0.05% Tween-20 followed by dehydration using first 70% and then 100% ethanol. Samples were dried by air and mounted using Mowiol (Roth). Light microscopy was carried out on an inverted microscope (ECLIPSE Ti-E; Nikon) with standard epifluorescence illumination (Intensilight C-HGFIE; Nikon) and 100×/NA1.4 plan-apochromatic objective. Images were acquired with a back-illuminated, cooled charge-coupled-device camera (DS2-Qi2; Nikon) driven by NIS-Elements (Nikon). Data acquisition was performed in NIS-Elements.
Flow Cytometry Analyzes
Spleens were flushed by heart perfusion with 10 ml PBS. Afterwards the spleens were meshed trough a cell strainer (100 μm) with a syringe plunger and splenocytes were pelleted by centrifugation (1,200 rpm, 10 min, 4°C). Erythrocyte lysis was performed with different concentration of sodium chloride (PBS containing 0.2 or 1.6% NaCl, respectively) and stopped with PBS. After centrifugation (see above) splenocytes were filtered through a cell strainer (30 μm), centrifuged and the single cell suspension was collected in IMDM-complete medium containing 10% FCS, 1% Penicillin/Streptavidin, 0.1% Gentamycin, and 0.1% 2-Mercaptoethanol. For flow cytometric analysis single cell suspensions were treated with anti-CD16/32 (BioLegend) to reduce unspecific antibody binding. For live/dead discrimination the Fixable Viability Dye (eFlour780, eBioscience) was used followed by staining with the following antibodies: anti-CD3ε (FITC, 145-2C11), anti-CD8a (FITC, 53-6.7), anti-Ly6C (PerCP-Cy5.5, HK1.4), anti-Ly6G (BV510, 1A8), anti-NK1.1 (PE-Cy7, PK136), anti-CD11b (BV421, M1/70), anti-CD49b (APC, DX5) (all Biolegend) as well as anti-CD27 (PE, LG.3A10, eBioscience). Afterwards, cells were fixed with 2% paraformaldehyde and analyzed with a BD FACSCanto II (BD Biosciences). Flow cytometric data were analyzed using the BD FACS Diva v6.1.3 software.
Integrin Expression on NK Cells
Spleens were harvested from Lm infected or naïve ADAPwt/wt × NKp46-Crehet and conditional ADAPfl/fl × NKp46-Crehet mice and processed into single cell suspension. For flow cytometric analysis single cell suspensions were treated with anti-CD16/32 (BioLegend). Cell suspensions were furthermore surface stained with a lineage mix (anti-CD3e, 145-2C11; anti-CD4, GK1.5; anti-CD8, 53-6.7; anti-CD19, 6D5; and anti-TER-119, TER-119; all FITC from BioLegend, except anti-TER-119 which was from Thermo Fisher). Furthermore, the following antibodies were used: anti-NK1.1 (APC-Cy7, PK136), anti-CD122 (PE-Cy7, TM-ß1), anti-CD11b (BV510, M1/70), anti-CD18 (AF647, M18/2), anti-CXCR4 (APC, L276F12), anti-CD29 (PE, HMß1-1) all from BioLegend as well as anti-NKp46 (V450, 29A1.4, BD Biosciences), and anti-CD11a (PE, 2D7, BD Pharmingen). Afterwards, cells were analyzed with a BD LSR Fortessa (BD Biosciences). Flow cytometric data were analyzed using the BD FACS Diva v6.1.3 software.
IL-10 Expression on NK Cells
Livers were harvested from Lm infected or naïve ADAPwt/wt × NKp46-Crehet and conditional ADAPfl/fl × NKp46-Crehet mice and cells were isolated using the mouse liver dissociation Kit (Miltenyi Biotech) and the gentleMACS dissociator device (Miltenyi Biotech) according to the manufactures instructions and processed into single cell suspension. Afterwards, each cell suspension was stimulated for 4 h at 37°C with phorbol myristate acetate (20 ng/ml, Sigma-Aldrich) and ionomycin (1 μg/ml, Sigma-Aldrich) in medium (IMDM-complete). After 1 h brefeldin A (1,000×, BioLegend) and Monensin (1,000×, BioLegend) were added. For flow cytometric analysis single cell suspensions were treated with anti-CD16/32 (BioLegend) after 4 h of stimulation. For live/dead discrimination the Fixable Viability Dye (eFlour780, eBioscience) was used followed by staining with the following antibodies: anti-B220 (FITC, RA3-6B2, BioLegend), anti-CD4 (FITC, RM4-5, BioLegend), anti-CD8 (FITC, 53-6.7, BioLegend), anti-CD3 (BV510, 17A2, BioLegend), anti-NK1.1 (PE, PK136, BD Pharmingen), anti-NKp46 (eFlour660, 29A1.4, Invitrogen). Cells were fixed with the Fixation/Permeabilization Kit (Thermo Fisher Scientific, Massachusetts, USA) and followed by intracellular staining for anti-IL-10 (BV421, JES5-16E3, BioLegend) for 30 min at 4°C. Cells were than analyzed using an Attune NxT Flow Cytometer (Thermo Fisher Scientific).
NK Cell Isolation
Spleens were harvested from Lm infected or naïve mice and processed into single cell suspension without erythrocyte lyses. Untouched NK cells were isolated using the mouse NK cell Isolation Kit (Miltenyi Biotech) and the autoMACS device (Miltenyi Biotech) according to the manufactures instructions or were sorted using a BD FACSAria (BD Biosciences) cell sorter. The purity of autoMACS isolated NK cells was >86 and >88% after FACSAria cell sorting. For untouched cell sorting, NK cells were stained for live/dead discrimination with Fixable Viability Dye (eFlour780, eBioscience) followed by staining with the following antibodies: anti-CD3ε (FITC, 145-2C11), anti-Ly6G (BV510, A18), anti-CD11b (BV421, M1/70), anti-NK1.1 (Biotin, PK136), anti-CD49b (APC, DX5) (all BioLegend), and anti-CD27 (PE, LG.3A10, eBioscience) or with anti-CD3ε (APC, 145-2C11, BioLegend), anti-CD8a (PerCP-Cy5.5, 53-6.7, BioLegend), anti-CD4 (BV510, RM4-5, BioLegend), and anti-NK1.1 (PE, PK136, BD Bioscience). Biotinylated antibodies were counterstained with streptavidin (PE-Cy7, BioLegend).
In vitro NK Cell Stimulation
Ninety-six-well U-bottom plates were coated overnight with anti-NK1.1 (1 μg/ml, Biotin, PK139, BioLegend) diluted in phosphate-buffered saline (PBS) at 4°C. Isolated NK cells (untouched) were added after removal of excessive anti-NK1.1 antibody. If indicated either IL-2 (3,000 Units/ml, BioLegend) and IL-12 (1 ng/ml, BioLegend) or phorbol myristate acetate (20 ng/ml, Sigma-Aldrich) and ionomycin (1 μg/ml, Sigma-Aldrich) were added to the wells and NK cells were stimulated for 4 h at 37°C. Controls were cultured in medium (IMDM-complete) without further stimulation. After 2 h brefeldin A (5 μg/ml, BioLegend) was added to all wells including the control wells. After 4 h in vitro stimulation NK cells were treated for live/dead discrimination with Fixable Viability Dye (eFlour780, eBioscience) and anti-CD16/32 (BioLegend) followed by staining with the following antibodies: anti-CD3ε (FITC, 145-2C11, BioLegend), anti-CD107a (Biotin, 1D4B, BioLegend), anti-CD49b (APC, DX5, BioLegend), anti-CD11b (PerCP-Cy5.5, M1/70, BioLegend). Cells were fixed with the Fixation/Permeabilization Kit (Thermo Fisher Scientific, Massachusetts, USA) followed by intracellular staining for anti-IFN-γ (BV421, XMG1.2, BioLegend) according to the manufacturer's instructions. Cells were than analyzed using an Attune NxT Flow Cytometer (Thermo Fisher Scientific). Biotinylated antibodies were counterstained with streptavidin (PE-Cy7, BioLegend).
In vitro NK Cell Migration Assay
For in vitro migration assay a transwell system (Costar; Corning, USA) was used. Here, the NK cell attracting chemokine CXCL12 (250 ng/ml, R&D Systems) was added to the lower chamber in a total volume of 600 μl chemotaxis medium (RPMI containing 25 mM HEPES and 0.5% BSA). Total splenocytes obtained from untreated and Lm infected mice, respectively, were loaded to the upper chamber at a density of 5 × 10⁵ cells in 100 μl chemotaxis medium. Cells were allowed to migrate across the pores of the transwell inserts (pore size 5 μm) at 37°C and 5% CO2. After 4 h, transmigrated cells from a pool of three wells were harvested by centrifugation (5 min, 300 ×g), resuspended in 100 μl PBS containing 2 mM EDTA, stained with trypan blue and counted using a hemocytometer. The percentage of NK cells before and after transmigration was analyzed by flow cytometry. Briefly, cells were first incubated with anti-CD16/CD32 (2.4G2, BD Pharmingen) for 10 min on ice followed by incubation with anti-CD3ε (FITC, 145-2C11, BD Pharmingen), anti-NK1.1 (APC-Cy7, PK136, BioLegend), anti-NKp46 (BV450, 29A1.4, BD Bioscience) for 30 min on ice. After washing, analysis was performed on a BD LSRFortessa (BD Biosciences) flow cytometer. Data are expressed as percentage of input calculated by the following equation: migrated NK cell number/input NK cell number.
Degranulation Assay
For the functional assessment of NK cells splenocytes were co-incubated with YAC-1 target cells at an effector:target ratio of 10:1 for a total incubation time of 6 h at 37°C and 5% CO2 in medium containing anti-CD107a antibody (BV421, 1D4B, BioLegend). After 1 h of the incubation, the co-culture was supplemented with 5 μg/ml monensin and brefeldin A (Sigma-Aldrich) to prevent receptor internalization and cytokine secretion, respectively. Subsequently, the cells were stained for the identification of NK cells (CD3−NK1.1+), perforin, granzyme B (GrB), and IFN-γ using the following antibodies: anti-CD3ε (BUV395, 17A2, BD Biosciences), anti-NK1.1 (APC, PK136, eBioscience), anti-perforin (PE, S16009B, BioLegend), anti-GrB (FITC, NGZB, eBioscience), and anti-IFN-γ (BV785, XMG1.2, BioLegend). For intracellular staining of perforin, GrB and IFN-γ, cells were permeabilized and fixed using the Cytofix/Cytoperm kit from BD according to the manufacturer's protocol. Briefly, cells were incubated in fixation buffer and subsequently stained with the antibodies diluted in permeabilization buffer.
Statistics
All statistical analyses were performed using the GraphPad Prism Software v5 and v8 (GraphPad Software, Inc., La Jolla, USA) and p < 0.05 was considered as significant.
Results
Cytotoxic Capacity of NK Cells Primed During In vivo Listeria monocytogenes Infection Requires ADAP
To first confirm the role of ADAP in cytokine production by naïve NK cells, they were isolated from the spleen of naïve wild type and conventional ADAPko mice and were stimulated in vitro with anti-NK1.1 alone or in combination with IL-2/IL-12 or with PMA/ionomycin followed by flow cytometric analysis of IFN-γ production. As shown in Figure 1A, secretion of the effector cytokine IFN-γ by NK cells from ADAPko mice was significantly impaired compared to NK cells from ADAP sufficient mice. Importantly, wild type mice did not only exhibit higher frequencies of IFN-γ+ NK cells (% IFN-γ+ NK cells, Figure 1A, middle panel), but NK cells from wild type mice as well produced higher levels of IFN-γ (MFI IFN-γ NK cells, Figure 1A, right panel). We next analyzed whether, in addition to effector cytokine production, ADAP deficiency would also affect the cytotoxic capacity of naïve NK cells. To this end, splenic NK cells from naïve wild type and ADAPko mice were stimulated in vitro as described before followed by the quantification of surface expression of CD107a on NK cells as an indicator for preceeding NK cell degranulation (44). While under these experimental conditions ADAP deficiency significantly impaired IFN-γ production, it did not affect the degranulation capacity of naïve NK cells (Figure 1B) which is well in line with published data (12). We next extended our analyses to an experimental setting allowing NK cell priming within their natural environment, i.e., during in vivo infection, and to a more physiological NK cell in vitro stimulation set-up using YAC-1 target cells. To this end, wild type and conventional ADAPko mice were sublethally infected with Lm. Subsequently, NK cells were isolated from the spleen of wild type and conventional ADAPko mice on day 3 post Lm infection, together with NK cells from uninfected mice (day 0) serving as internal control. In contrast to our data obtained with antibody/cytokine stimulation, YAC-1-mediated stimulation of naïve NK cells uncovered a striking and ADAP-dependent degranulation defect as indicated by significantly reduced CD107a expression on ADAPko compared to wild type NK cells (Figures 2A,B). This phenotype became evident not only in YAC-1 stimulated naïve NK cells but was detectable as well in NK cells that were primed during in vivo Lm infection. While in vitro re-stimulation of NK cells from infected wild type animals with YAC-1 target cells stimulated a highly significant degranulation of these cells, YAC-1 cells did not induce further degranulation of in vivo primed ADAPko NK cells (Figures 2A,B). Consistent with their increased degranulation capacity Lm infection triggered NK cells to produce elevated levels of perforin and strikingly, this acquisition of NK cell effector function was significantly impaired in mice lacking ADAP as indicated by the reduced frequency of perforinhigh ADAPko NK cells (Figures 2A,C). As for CD107a and perforin, there was a clear increase in the frequency of granzyme B (GrB) and IFN-γ producing NK cells on day 3 post-infection compared to uninfected controls, indicative for efficient in vivo priming, but no genotype-dependent differences were observed (Figures 2D,E).
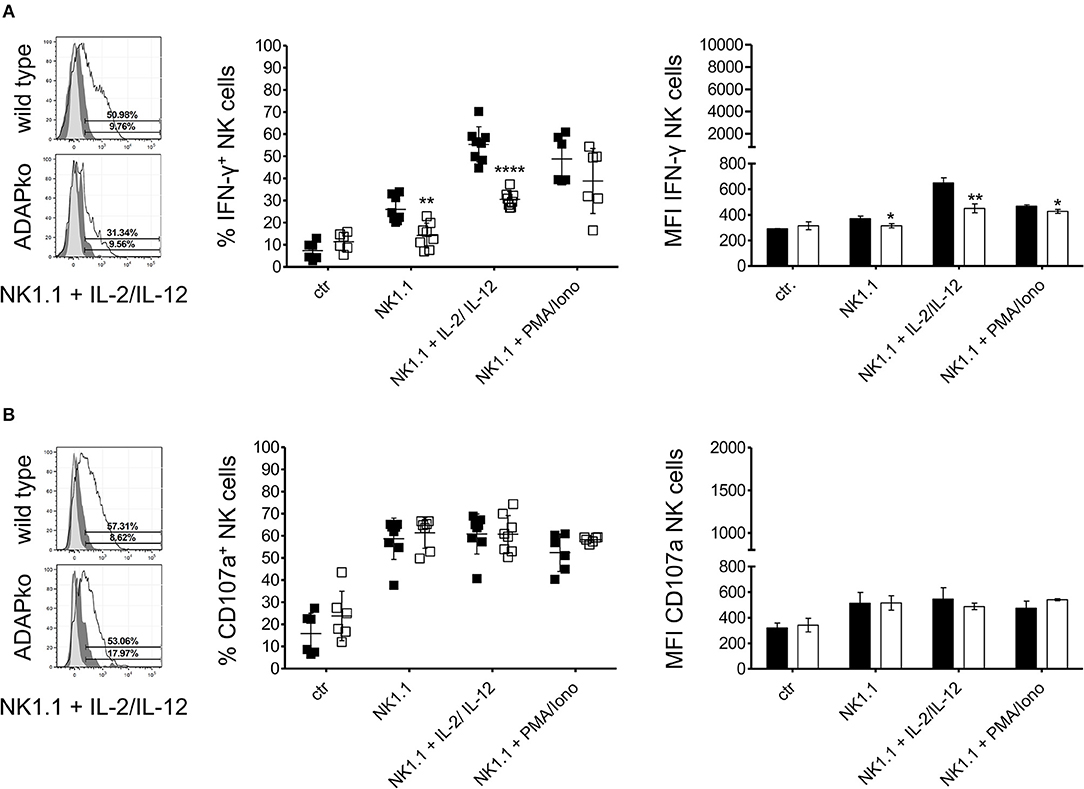
Figure 1. IFN-γ production in naïve NK cells depends on ADAP. Naïve NK cells from the spleen of wild type (black symbols) and ADAPko (open symbols) mice were either stimulated in vitro with anti-NK1.1 (plate bound) alone or in combination with IL-2/IL-12 or PMA/ionomycin for 4 h or were left unstimulated (ctr). Subsequently, frequency of (A) IFN-γ producing NK cells and (B) frequency of NK cells exhibiting CD107a surface expression as indicator for degranulation was analyzed by flow cytometry. Representative histograms (left panels) are shown for re-stimulation with anti-NK1.1 in combination with IL-2 and IL-12 (light gray: unstained and untreated; dark gray: stained and untreated; open: stained and treated). Mean ± SD of IFN-γ+ and CD107a+ CD3−CD49+ NK cells (middle panels) and mean fluorescence intensity (MFI, right panels) of IFN-γ in and CD107a on NK cells is shown with n = 6–8 individually analyzed mice per group out of three independent experiments. Groups were compared by unpaired two-tailed t-test with Welch's correction (*p < 0.05, **p < 0.01, ****p < 0.0001).
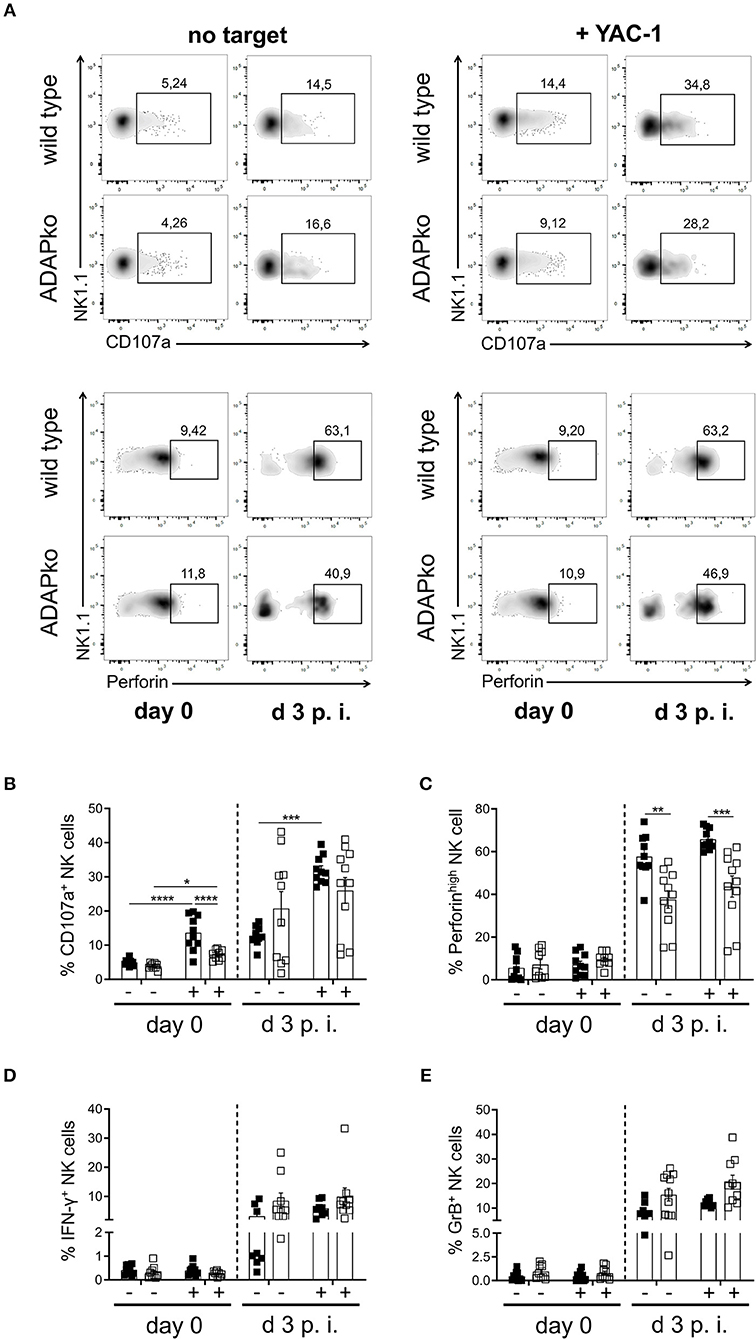
Figure 2. Degranulation capacity and perforin production by NK cells during Lm infection depend on ADAP. Wild type (black symbols) and ADAPko (open symbols) mice were either infected with 2.5 × 10⁴ CFU Lm or were left untreated (uninfected control, day 0) and were sacrificed at the indicated time points post infection. Splenocytes were isolated and incubated in vitro without targets (-) or with YAC-1 target cells (+). (A) Representative dot plots showing surface CD107a or intracellular perforin vs. NK1.1 expression on wild type and ADAPko splenocytes from naïve mice (day 0) as well as on day 3 post-Lm infection in the presence or absence of YAC-1 target cells. Frequency of (B) surface CD107a+, (C) perforinhigh, (D) IFN-γ+, and (E) granzyme B (GrB)+ CD3−NK1.1+ NK cells in spleen of uninfected mice (day 0) and day 3 post-Lm infection after in vitro co-incubation with YAC-1 target cells. Data are presented as mean ± SEM of n = 10 individual mice per group out of two independent experiments. Groups were compared by two-way ANOVA with Bonferroni correction for multiple hypothesis testing (*p < 0.05, **p < 0.01, ***p < 0.001, ****p < 0.0001).
To rule out the possibility that the striking differences observed for NK cell degranulation and perforin production was the consequence of inefficient NK cell priming in the ADAP-deficient host rather than an intrinsic effect of ADAP-deficiency in NK cells we compared serum concentrations of cytokines that have been described in the context of NK cell activation (26, 27, 45, 46). Serum cytokine levels on day 1 post-Lm infection were, with the exception of IL-1α, largely comparable in wild type and ADAPko mice. Interestingly, for several analytes known to be important for the stimulation of cytotoxicity in NK cells we even observed elevated serum concentrations in ADAPko mice on day 3 post-infection (Supplementary Figure 1A). Additionally performed quantitative gene expression analysis for the major NK cell activating cytokines IL-2, IL-12, IL-15, IL-18, and IL-21 in splenocytes from Lm infected mice revealed equal expression levels of these NK cell activating cytokines (Supplementary Figure 1B). Taken together, we show here that Lm infection in ADAP-deficient hosts induces a cytokine response largely comparable or even slightly stronger than in wild type animals and we thus conclude that the cytotoxic capacity of NK cells primed during in vivo Lm infection is intrinsically dependent on ADAP.
ADAP-Deficiency Does Not Affect NK Cell Morphology, Intracellular Vesicle Distribution and the Overall Pattern of Protein Abundances in NK Cells During Listeria monocytogenes Infection
While we observed a clear impact of ADAP-deficiency on NK cell degranulation this effect became apparent only after YAC-1-mediated but not after antibody- and cytokine-mediated in vitro stimulation of NK cells (Figures 1, 2). Since ADAP deficiency in T cells prevents microtubule-organizing center (MTOC) translocation upon activation (47), we wondered whether ADAP-deficiency per se would affect NK cell morphology, microtubule network structures and distribution of vesicles, and whether such effect would become visible early on during in vivo infection. To analyze this, NK1.1+ NK cells were sorted from the spleen of Lm infected mice (4 mice for each genotype) 1 day post-infection and analyzed by microscopy without any further in vitro stimulation. As shown in Figure 3A, independent of the genotype NK cells exhibited a well-structured microtubule network with single microtubules originating from the MTOC (visualized with a white arrow in Figure 3A). Interestingly, counterstaining for CD107a identified CD107a+ vesicles (in green) distributed in the periphery of the MTOC, and again we did not observe differences in NK cells isolated from infected wild type or ADAPko mice (Figure 3A). Quantification of polarized CD107a distribution toward the MTOC in NK cells from Lm infected mice revealed indeed no differences. For both wild type and ADAPko mice, ~65 to ~90% of the NK cells showed MTOC-oriented CD107a distribution (Figure 3B). Similarly, NK cells isolated from naïve wild type and ADAPko mice showed no differences in CD107a distribution (data not shown). Thus, ex vivo analysis of NK cells at an early phase of Lm infection did not uncover obvious ADAP-dependent differences regarding cellular morphology and CD107a localization in vesicle-like structures. In line with this, phalloidin staining of cytoskeletal F-actin in naïve NK cells stimulated in vitro with CXCL12 did not reveal any significant difference in terms of actin re-organization between the genotypes as well (data not shown).
Figure 3. CD107a distribution and global NK cell protein composition are similar in wild type and ADAPko NK cells. Wild type and ADAPko mice were either infected with 2.5 × 10⁴ CFU Lm or were left untreated (non-infected control, day 0). Mice were sacrificed and NK1.1+ NK cells were isolated by flow cytometry and prepared for microscopy or mass spectrometry. (A) NK cells were seeded onto poly-L-lysine coated coverslips and stained for CD107a (green) and α-tubulin (red). Representative images of NK cells from Lm infected mice are given as stacked images. Scale bars are 2 μm. (B) Quantification of CD107a distribution toward the MTOC in NK cells from Lm infected mice (n = 4; up to 25 cells per animal were analyzed). (C,D) NK cells were lysed and analyzed by high-resolution mass spectrometry after tryptic digestion. (C) Scatter plots depicting mean log10 abundances (n = 3; for wild type day 0: n = 2) of all detected proteins (circles and squares) and selected NK cell proteins are marked in colors (color code given on the right panel). (D) Dot plots depicting absolute abundances of selected NK cell proteins for each individual mouse in all four conditions.
We further extended our molecular phenotyping and applied unbiased high-resolution mass spectrometry in order to identify potential ADAP-dependent alterations of NK cell proteomes in infected and non-infected mice. As for confocal microscopy, splenic NK cells from wild type and ADAPko mice were isolated on day 1 post Lm infection and analyzed without further stimulation in comparison with corresponding NK cells from naïve wild type and ADAPko mice using a label-free quantitative proteomics approach (LC-MS). We analyzed NK cells of six individual ADAPko and five individual wild type mice and quantified relative abundance of in total 4,131 proteins. In the individual samples, we identified 3,365–3,705 proteins with a normal distribution in protein abundances indicating the robustness of our analytical workflow (Supplementary Figure 2A). As expected, mass spectrometry identified ADAP exclusively in NK cells derived from wild type but not ADAPko mice (data not shown) underlining the accuracy of our analysis. Moreover, as a proof-of-concept, SKAP1, a protein that is co-regulated with ADAP expression (48), was undetectable in NK cells from infected ADAPko mice.
Computational cluster analysis of total NK cell proteomes clearly discriminated NK cells from infected and non-infected mice, but did not differentiate between NK cells from wild type and ADAPko mice (Supplementary Figure 2B). Likewise, comparison of protein intensities exhibited higher variation in NK cells from infected vs. non-infected mice (Figure 3C), underscoring that the infection-related in vivo priming of NK cells, but not the presence or absence of ADAP is decisive for the global changes observed in the proteome composition of NK cells. This held true for a number of prototypic NK cell proteins that were generally detectable at similar abundance in NK cells from non-infected wild type and ADAPko mice (Figure 3D). Among those the abundance of granzyme A and granzyme B increased upon Lm infection, while other proteins related to NK cell functions including CD107a, perforin and the Killer cell lectin-like receptor (KLR) subfamily members Ly-49a, Ly-49g, Ly-55a, and Ly-55b were detected with reduced abundance in NK cells from the infected host independent of the genotype (Figure 3D). In conclusion, unbiased ex vivo proteome profiling of splenic naïve NK cells and NK cells analyzed on day 1 post infection clearly revealed in vivo responsiveness of NK cells to Lm infection but did not uncover any obvious ADAP-dependent alterations in the effector molecule inventory involved in this process.
NK Cell Migration, but Not Listeria monocytogenes-Induced IL-10 Production, Is Dependent on ADAP
We finally asked if and how ADAP-deficiency in NK cells would affect the overall course of Lm infection. To rule out any effect of ADAP-deficiency in immune cells other than NK cells we used conditional knock out mice lacking ADAP specifically in NK cells (ADAPfl/fl × NKp46-Crehet). Strikingly, health monitoring during infection revealed enhanced severity of the disease as indicated by a significantly higher body weight loss in conditional ADAPko mice compared to control animals (Figure 4A). This was, however, not due to impaired antibacterial immunity since both genotypes controlled pathogen growth equally well (Figure 4B). Since IL-10 produced by NK cells has been recently shown to enhance susceptibility of mice to Listeria infection (34) we analyzed whether ADAP-deficiency would affect the capacity of NK cells to produce IL-10. While NK cells from uninfected mice did not produce relevant concentration of IL-10, IL-10 production was induced in NK cells by day 3 following Lm infection (Figure 4C). This was however genotype independent, thus largely excluding the possibility that enhanced morbidity of conditional ADAPko mice is due to enhanced IL-10 production by ADAP-deficient NK cells.
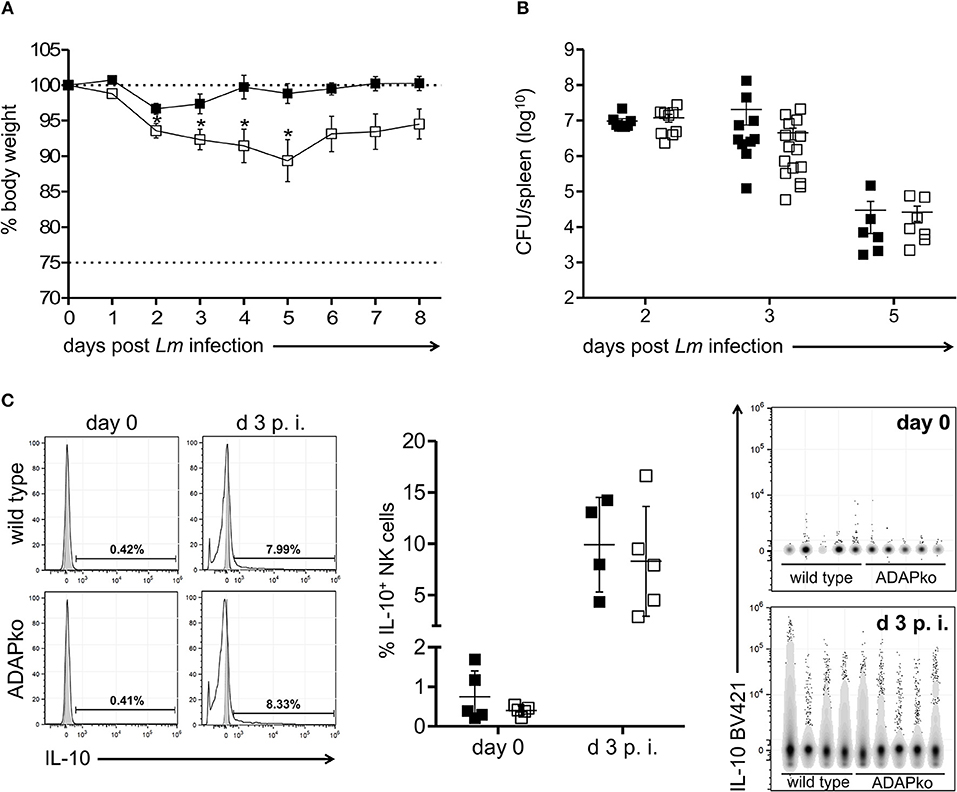
Figure 4. Enhanced susceptibility of conditional ADAPko mice to Listeria monocytogenes infection is not associated with altered IL-10 production by NK cells. ADAPfl/fl × NKp46-Crehet (open symbols) mice lacking ADAP specifically in NK cells and respective littermate controls (ADAPwt/wt × NKp46-Crehet, black symbols) were either infected with (A) 5 × 10⁴ CFU Lm, (B,C) 2.5 × 10⁴ CFU Lm or were left untreated (uninfected control, day 0). (A) Body weight loss of ADAPwt/wt × NKp46-Crehet control mice and conditional ADAPfl/fl × NKp46-Crehet mice during the course of Lm infection. (B) CFU was quantified in the spleen as a measure for the bacterial load. Data are presented as mean ± SEM for n = 6–15 individually analyzed mice per group out of three independent experiments. (C) Representative histograms (left panels) are shown for hepatic CD3−NK1.1+NKp46+ IL-10 producing NK cells (light gray: unstained and untreated; dark gray: respective stained fluorescence minus one control; open: stained liver sample) for naïve NK cells (day 0, female mice) and day 3 post-Lm infection. Summary plots (middle panel) show percentage of IL-10 producing NK cells in liver. Data are presented as mean ± SD with n = 4–5 individual mice per group out of one experiment. Data were constrained to alive singlet NK cells and are shown in columns side-by-side in a concatenated qualitative dot plot (right panels) in which each column represents data of an individual mouse. Groups were compared by unpaired two-tailed t-test with Welch's correction (*p < 0.05).
Interestingly, lack of ADAP in NK cells was associated with considerably lower NK cell numbers in the spleen of conditional ADAPko compared to wild type mice. Notably, this was evident already in naïve mice (Figure 5A). While in wild type animals the number of NK cells steadily increased until day 5 post-Lm infection, the number of ADAPko NK cells in the spleen rose to a far lesser extend and reached the plateau already by day 2 post-Lm infection (Figure 5A). Flow cytometric analysis of NK cell maturation markers revealed only slight though in part significant differences in the maturation of ADAP-sufficient and -deficient NK cells in the spleen of Lm infected mice during the course of infection. However, the frequency of NK cells that reached the different maturation stages (CD27−CD11b− (DN) → CD27+CD11b− → CD27+ CD11b+ (DP) → CD11b+CD27−) was the same by day 5 post-infection (Supplementary Figure 3) and as such impaired NK cell maturation was largely excluded as a reason for the pronounced ADAP-dependent differences in NK cell abundance in the spleen of Lm infected mice.
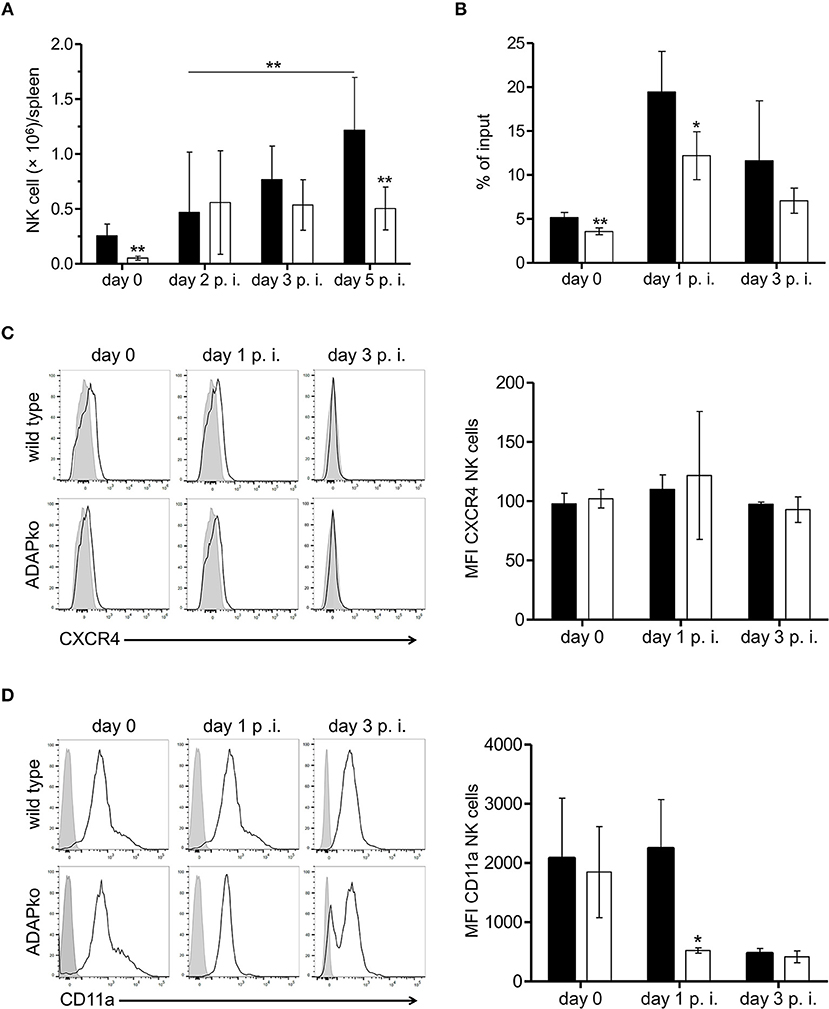
Figure 5. Reduced accumulation in the spleen and impaired migratory capacity of ADAP-deficient NK cells of Lm infected mice. ADAPfl/fl × NKp46-Crehet (open bars) mice lacking ADAP specifically in NK cells and respective littermate controls (ADAPwt/wt × NKp46-Crehet, black bars) were either infected with 2.5 × 10⁴ CFU Lm or were left untreated (uninfected control, day 0). (A) ADAPwt/wt × NKp46-Crehet and conditional ADAPfl/fl × NKp46-Crehet mice were sacrificed at the indicated time points. Leukocytes were isolated from the spleen and NK cells were identified as CD3−NK1.1+CD49b+ cells. Absolute NK cell numbers were calculated from the NK cell frequencies assessed by flow cytometry referred to the absolute leukocyte numbers as well as the frequencies of live cells. Data are presented as mean ± SD for n = 4–15 mice per group out of three independent experiments. (B) Splenocytes were seeded in the upper transwell chamber that was placed in medium containing the chemokine CXCL12 (250 ng/ml). After 4 h cells were recovered from the lower chamber, counted and analyzed by flow cytometry to determine the percentage of migrated NK cells (% of input). Data are presented as mean ± SD for n = 4 mice per group from two independent experiments. (C) Level of CXCR4 and (D) CD11a surface expression on NK cells. Depicted are representative histograms (left panels; light gray: respective stained fluorescence minus one control FMO; open: stained) and mean fluorescence intensity (MFI, right panels) ± SD of (C) CXCR4 and (D) CD11a on NK1.1+ NK cells analyzed day 0 (female mice), day 1 and day 3 p.i. with n = 4–5 individually analyzed mice per group out of one to two experiments. Groups were compared by (A–D) unpaired two-tailed t-test with Welch's correction and additionally (A) by two-way ANOVA with Bonferroni correction for multiple hypothesis testing (*p < 0.05, **p < 0.01).
Since ADAP has been shown before to be involved in the migratory capacity of other immune cells (37, 49) and moreover protein network analyses of our proteome analyses identified three pathways potentially affected by ADAP-deficiency in NK cells to be related to cell migration (data not shown), we speculated that the observed phenotype might at least in part be the consequence of impaired migration of ADAPko NK cells to the spleen of Lm infected mice. To experimentally address this hypothesis we performed in vitro NK cell migration assays using splenocytes from naïve and Lm infected mice. Indeed and well in line with our expectation, NK cell migration toward a chemokine gradient was significantly impaired both in naïve as well as in ADAP-deficient NK cells pre-activated in vivo during Lm infection (Figure 5B). Of note, reduced in vitro migration of ADAPko NK cells toward the NK cell attracting chemokine CXCL12 was not the consequence of altered surface expression of the CXCL12 receptor CXCR4 as we observed similar CXCR4 expression levels on ADAP-deficient and –sufficient NK cells (Figure 5C). Since leukocyte entry into tissues is generally guided by the interaction of integrins with their respective ligands on endothelial cells we analyzed surface expression of selected integrins on splenic NK cells from Lm infected wild type and conditional ADAPko mice. While ADAP-deficiency did not affect expression levels of CD18, CD29, and CD11b on NK cells (data not shown), we observed a striking difference between ADAP-deficient and wild type NK cells with respect to CD11a surface expression on day 1 post Lm infection with significantly lower CD11a expression levels on NK cells lacking ADAP (Figure 5D). Together our data suggest that in addition to effector cytokine production and cytotoxic capacity ADAP is required for efficient migration of NK cells both in vitro and in vivo and that reduced NK cell cellularity in infected tissue of conditional ADAPko mice might be, at least in part, the consequence of reduced CD11a surface expression on ADAP-deficient NK cells.
Discussion
We have studied for the first time ADAP-dependency of NK cell functions during in vivo infection. Our experimental approach is fundamentally different from previous studies as we studied the impact of ADAP on principal NK cell functions following their in vivo priming during infection, i.e., under physiological conditions involving a plethora of infection-induced cytokines as well as a complex network of NK cell-activating and inhibitory receptors. As such we feel that data from our in vivo study cannot directly be compared with the outcome from previous in vitro experiments but instead complement published knowledge and provides further clarification regarding the role of ADAP in infection-primed NK cells.
By extensively studying signaling events induced in NK cells by stimulation of the activating receptors CD137 or NKG2D, Rajasekaran et al. uncovered an ADAP-dependent signaling pathway exclusively responsible for the production of inflammatory cytokines but not for cytotoxicity (12). As an underlying mechanism for this striking dichotomy a unique interaction between Fyn and ADAP was discovered linking upstream signaling to the CBM module which, under the chosen experimental conditions, led to the production of IFN-γ and chemokines while not being responsible for cytotoxicity in murine and human NK cells (12). While applying antibody/cytokine-mediated in vitro stimulation of primed naïve NK cells confirmed these data (Figure 1), more physiological stimulation of naïve NK cells or infection-primed ADAPko NK cells with YAC-1 target cells uncovered impaired cytotoxicity of ADAP-deficient NK cells while their capacity to produce IFN-γ was not affected (Figure 2). Vivier et al. brought into consideration that the above mentioned study utilized IL-2-activated NK cells and that, given the plasticity of NK cells that is heavily dependent on their activation (50), it would be questionable if the findings by Rajasekaran et al. would generally apply to NK cells activated under different conditions (12). During Listeria infection various cytokines are induced that are known to permit NK cell activation (51) and indeed most of the known NK cell-activating cytokines were detectable in sera of Lm infected wild type and ADAPko mice (Supplementary Figure 1). Importantly, ADAPko mice did not exhibit an overall defect in cytokine response to Lm infection (Supplementary Figure 1). Thus, we can largely exclude that impaired effector function in ADAPko NK cells is due to impaired priming in the ADAP-deficient host but is rather an inherent effect due to ADAP-deficiency in NK cells. Apart from the proteome analysis (Figure 3) we did not further analyze the influence of Lm infection on the expression of activating/inhibitory receptors on NK cells and the expression of the corresponding ligands on target cells, respectively. Anyway, we hypothesize that during infection the combination of cytokines and/or receptor-ligand pairs is ideal to prime NK cells for both, cytokine production and cytotoxicity and that under these optimized priming conditions the separation of the ADAP-dependent and -independent signaling pathways in NK cells is abrogated. Future studies are needed to clarify this aspect on the molecular level.
ADAPko NK cells exhibit reduced cytotoxic capacity (Figure 2). This phenotype was further confirmed by proteomic profiling that on the one hand revealed an overall decrease of intracellular perforin and CD107a upon infection suggesting the release of perforin from CD107a+ granules following in vivo priming. Moreover, given that the applied LC-MS/MS analysis is particularly suitable for the detection of intracellular proteins, the observation of a slightly more pronounced decrease in CD107a protein abundance in ADAP-sufficient compared to ADAP-deficient NK cells during infection as well-hints at decreased cytolytic activity of ADAPko NK cells (Figure 3D).
Remarkably, independent of the genotype infection-priming of NK cells resulted in an overall decreased abundance of virtually all detectable prototypic NK cell proteins with the exception of granzyme A and granzyme B that were even found at higher abundances (Figures 3C,D). While at a first glance it might be counter-intuitive that priming of NK cells would result in increased granzyme A and granzyme B levels but at the same time decreased abundance of CD107a and perforin, several mechanisms could explain this finding. Already in previous studies we observed co-localization of CD107a with perforin but not with granzymes (Heyner et al., unpublished) and it has been shown that dependent on the activating signal used to stimulate NK cell function different cytotoxic vesicles are detectable within the cell. For instance, engagement of NKG2D or 2B4 on NK cells induces the co-localization of perforin with Rab27a+ but not Munc13-4+ vesicles. In direct contrast, antibody-dependent CD16 activation induces perforin localization to Munc13-4+ vesicles but not to Rab27a+ ones (52). Moreover, Munc13-4 and Rab27a have been described to be involved in granzyme B polarization to the immunological synapse (53). Thus, the observed differences regarding granzyme A/granzyme B vs. CD107a/perforin abundances might be a result of complex ligand/receptor binding events induced early on during infection leading to discrete maturation of lytic granules in NK cells. On the other hand, we cannot exclude that newly synthesized proteins, i.e., induced gene expression upon infection might also explain the differences of cytotoxic protein abundances. In this context, Fehniger et al. have shown that, well in line with our proteome data (Figure 3D), resting NK cells contain high levels of granzyme A but little granzyme B and perforin (54). Interestingly, they uncovered a clear discrepancy in terms of protein content vs. mRNA content, with mRNA being detectable in naïve NK cells at high abundance for all three genes. While naïve NK cells were per se granzyme A+, stimulation with IL-15 increased the frequency of granzyme B and perforin expressing NK cells. Only in case of granzyme B this was associated with induced mRNA expression (54). While these data do not explain the inverse pattern of granzyme A/granzyme B and perforin in infection-primed NK cells they provide evidence for fundamental differences regarding the regulation of transcription and translation for these cytotoxic mediators in NK cells. Still, both granzyme B and perforin were shown to be required for efficient cytotoxicity in vitro and in vivo (54) and we show here that the abundance of one of them, i.e., perforin seems to be diminished in NK cells lacking ADAP (Figure 2C).
Interestingly, ADAP-deficiency in NK cells was associated with a more severe course of Lm infection (Figure 4A) which was not due to impaired antibacterial immunity (Figure 4B). Activated NK cells respond to Lm infection (19) in a complex process that requires crosstalk with macrophages, neutrophils and dendritic cells (35, 36). With this, NK cells are able to shape the immune response via pro-inflammatory cytokine and chemokine stimulation as well as due to cell-to-cell contacts (55, 56). Enhanced disease severity might be indicative for a critical role of ADAP in NK cells in the overall innate immune response induced during Lm infection. Apart from the role of ADAP in NK cells during listeriosis it is however even not clear whether NK cells exhibit a beneficial or detrimental role in immunity to Lm. An early study by Teixeira and Kaufmann revealed improved pathogen control in mice lacking NK cells (57). The deleterious role of NK cells in listeriosis was confirmed later by Viegas et al. demonstrating that although NK cells are not required for pathogen elimination Lm infected NK cell-deficient mice showed improved survival (58). Data from another study however implied that NK cells may rather be protective during Lm infection (51). By secretion of the pro-inflammatory cytokines IL-12, TNF-α, IL-1β, and IL-18 by Lm activated dendritic cells, NK cells are primed to produce IFN-γ. IFN-γ plays a pivotal role in innate and adaptive immunity to intracellular bacteria and indeed mice lacking the IFN-γ receptor are highly susceptible to Lm infection (59). Despite comparable IFN-γ production in infection-primed wild type and ADAPko NK cells (Figure 2D) IFN-γ serum concentration was increased by day 3 p.i. in ADAPko mice (Supplementary Figure 1). However, since in conventional ADAPko mice also immune cells other than NK cells are deficient for ADAP, we assume that IFN-γ produced by e.g., T cells, NKT cells, macrophages, B cells, or dendritic cells accounts for the observed difference. This is supported by our finding that in conditional ADAPko mice lacking ADAP exclusively in NK cells, IFN-γ serum concentration markedly increases by day 2 post-Lm infection, while we did not observe significant differences in infection-induced IFN-γ levels between wild type and conditional ADAPko mice (data not shown). It has recently been shown that infection-induced NK cell activation increases susceptibility to Lm infection independent from IFN-γ production by NK cells (34). As an underlying mechanism for the detrimental role of NK cells in listeriosis the authors uncovered that NK cells responding to Lm infection acquire the ability to produce the immunosuppressive cytokine IL-10. In a follow-up study the same group identified that licensing of IL-10 production in NK cells requires IL-18 released by Lm infected Bat3+ DCs (60). We did not observe any effect of ADAP-deficiency in NK cells on their capacity to produce IL-10 (Figure 4C). Combined with the finding, that neither the concentration of the immunosuppressive IL-10, nor the NK cell licensing cytokine IL-18 differed in sera of Lm infected wild type and ADAPko mice (Supplementary Figure 1 and data not shown for conditional ADAPko mice), we exclude the possibility that IL-10 produced by NK cells would account for the enhanced morbidity of conditional ADAPko mice to Lm infection.
Within the early phase of Lm infection phagocytes are critically involved in immune containment of the pathogen (61). Infiltrating monocytes and especially neutrophils attracted to the site of infection may cause adverse side effects thus contributing to immunopathology (62, 63). Since infection-primed ADAPko NK cells exhibited impaired production of the phagocyte attracting chemokines CCL3, CCL4, and CCL5 (Supplementary Figure 4) we compared the number of monocytes and neutrophils in the spleen of Lm infected animals. However, no differences in the absolute numbers of monocytes and neutrophils were detectable (data not shown). Macrophages and neutrophils are considered the major source for IL-12 during listeriosis (64, 65). Notably, next to comparable numbers of these cells in the spleen of Lm infected wild type and conditional ADAPko mice we also did not find quantitative differences in serum IL-12 levels (data not shown) as a potential indicator for differential activation of phagocytes in mice lacking ADAP in NK cell. Taken together, enhanced body weight loss of infected conditional ADAPko mice most likely cannot be attributed to enhanced immunopathology exerted by phagocytes. However, the molecular/cellular mechanism by which ADAP-deficiency in NK cells promote disease severity during Lm infection remains elusive.
To the best of our knowledge, no data are available regarding the migration of ADAP-deficient NK cells. Utilizing an in vitro transwell system we could show for the first time that CXCL12-induced migration of ADAP-deficient NK cells is reduced compared to ADAP-sufficient NK cells. During infection, NK cells are recruited to the sites of inflammation in a chemokine-dependent manner. This is well-reflected by the observed increased migratory activity of Lm infection-primed compared to naïve NK cells (Figure 5B). CXCL12 is an important chemokine not only for T cells, but also for the chemo-attraction of NK cells (66). Since Lm infection in mice represents a complex disease model with different leukocyte subsets being recruited and activated to produce pro-inflammatory cytokines and chemokines during early innate immune activation, in vitro testing of CXCL12-induced migration of NK cells only insufficiently reflects the in vivo situation. Nevertheless, impaired migratory activity of ADAP-deficient NK cells might at least in part explain the reduced numbers of NK cells in the spleen of conditional ADAPko mice early after Lm infection (Figure 5A). In T cells, the inside-out signaling pathways leading to integrin activation after chemokine receptor stimulation are well-described (4) and we have recently shown that migration of both, CD4+ and CD8+ T cells, depends on ADAP (6). For NK cells, it is known that integrin-dependent activation is essential for migration and for cytotoxicity (67). Therefore, it seems likely that similar signaling complexes are formed in T cells and NK cells. Of note, compared to wild type NK cells, CD11a surface expression on infection-primed ADAPko NK cells was markedly reduced on day 1 post-infection (Figure 5D). Together with CD18, CD11a forms the heterodimeric adhesion molecule LFA-1 which upon interaction with its ligand ICAM on endothelial cells promotes entry of leukocytes from the bloodstream into tissues. In fact, an early study by Allavena et al. has shown that LFA-1 is crucial for NK cell adhesion to and migration through the vascular endothelium (68). Importantly, at least in T cells the intracellular domain of CD11a is directly linked to the signaling complex involving ADAP (69, 70). Thus, it is tempting to speculate that lack of ADAP in NK cells in NK cells and the associated reduced surface expression of CD11a on NK cells 1 day post Lm infection is mechanistically linked to the reduced accumulation of NK cells in the infected spleen of conditional ADAPko mice (Figure 5A). However, since differential CD11a expression on ADAPko vs. wild type NK cells was only transient and genotype-dependent differences in CD11a surface expression were lost by day 3 post-infection, most probably additional molecular factors will contribute to the observed phenotype. Yet, further studies are needed to dissect in more detail the molecular mechanism underlying reduced migratory activity of naïve and infection-primed ADAP-deficient NK cells.
Data Availability Statement
The raw data supporting the conclusions of this article will be made available by the authors, without undue reservation, to any qualified researcher.
Ethics Statement
The animal study was reviewed and approved by Niedersächsisches Landesamt für Verbraucherschutz und Lebensmittelsicherheit, Germany and Landesamt für Verbraucherschutz, Sachsen-Anhalt, Germany.
Author Contributions
MB designed and performed experiments and wrote the manuscript. ST, PR, MHa, MHe, MV, and GP designed and performed experiments. FK performed data mining and statistical analysis for proteome data. AJ contributed conception to the analyses. LJ contributed conception to the analysis, data interpretation, and provided research material. CG provided research material. BS, AR, and DB designed and supervised the research and wrote the manuscript. All authors contributed to manuscript revision, read, and approved the submitted version.
Funding
This work was funded by the Deutsche Forschungsgemeinschaft (DFG, German Research Foundation) - Project-ID 97850925 - SFB 854 (BS B19, DB A23) and AR (RE 2907/2-2). MB and GP were supported by grants (SI2 and SI3) of the State of Saxony-Anhalt to BS.
Conflict of Interest
The authors declare that the research was conducted in the absence of any commercial or financial relationships that could be construed as a potential conflict of interest.
Acknowledgments
We thank F. Ewert, A. Sohnekind, G. Weitz, and U. Bröder for expert technical assistance, J. Rudolph for coordination of the ADAPfl/fl × NKp46-Crehet breeding, I. Jorde, U. Kärst, and J. Wissing for technical support, S. Kliche for scientific advice as well as L. Gröbe and M. Höxter expert for cell sorting support.
Supplementary Material
The Supplementary Material for this article can be found online at: https://www.frontiersin.org/articles/10.3389/fimmu.2019.03144/full#supplementary-material
References
2. Veale M, Raab M, Li Z, da Silva AJ, Kraeft SK, Weremowicz S, et al. Novel isoform of lymphoid adaptor FYN-T-binding protein (FYB-130) interacts with SLP-76 and up-regulates interleukin 2 production. J Biol Chem. (1999) 274:28427–35. doi: 10.1074/jbc.274.40.28427
3. Peterson EJ. The TCR ADAPts to integrin-mediated cell adhesion. Immunol Rev. (2003) 192:113–21. doi: 10.1034/j.1600-065X.2003.00026.x
4. Kliche S, Worbs T, Wang X, Degen J, Patzak I, Meineke B, et al. CCR7-mediated LFA-1 functions in T cells are regulated by 2 independent ADAP/SKAP55 modules. Blood. (2012) 19:777–85. doi: 10.1182/blood-2011-06-362269
5. Mitchell JS, Burbach BJ, Srivastava R, Fife BT, Shimizu Y. Multistage T cell-dendritic cell interactions control optimal CD4 T cell activation through the ADAP-SKAP55-signaling module. J Immunol. (2013) 191:2372–83. doi: 10.4049/jimmunol.1300107
6. Parzmair GP, Gereke M, Haberkorn O, Annemann M, Podlasly L, Kliche S, et al. ADAP plays a pivotal role in CD4 + T cell activation but is only marginally involved in CD8 + T cell activation, differentiation, and immunity to pathogens. J Leukoc Biol. (2017) 101:407–19. doi: 10.1189/jlb.1A0216-090RR
7. Fiege JK, Beura LK, Burbach BJ, Shimizu Y. Adhesion- and degranulation-promoting adapter protein promotes CD8 T cell differentiation and resident memory formation and function during an acute Infection. J Immunol. (2016) 197:2079–89. doi: 10.4049/jimmunol.1501805
8. Kasirer-Friede A, Cozzi MR, Mazzucato M, De Marco L, Ruggeri ZM, Shattil SJ. Signaling through GP Ib-IX-V activates alpha IIb beta 3 independently of other receptors. Blood. (2004) 103:3403–11. doi: 10.1182/blood-2003-10-3664
9. Rudolph JM, Guttek K, Weitz G, Meinke CA, Kliche S, Reinhold D, et al. Characterization of mice with a platelet-specific deletion of the adapter molecule ADAP. Mol Cell Biol. (2019) 39:e00365–18. doi: 10.1128/MCB.00365-18
10. Dluzniewska J, Zou L, Harmon IR, Ellingson MT, Peterson EJ. Immature hematopoietic cells display selective requirements for adhesion- and degranulation-promoting adaptor protein in development and homeostatsis. Eur J Immunol. (2007) 37:3208–19. doi: 10.1002/eji.200737094
11. Coppolino MG, Krause M, Hagendorff P, Monner DA, Trimble W, Grinstein S, et al. Evidence for a molecular complex consisting of Fyb/SLAP, SLP-76, Nck, VASP and WASP that links the actin cytoskeleton to Fcgamma receptor signalling during phagocytosis. J Cell Sci. (2001) 114:4307–18.
12. Rajasekaran K, Kumar P, Schuldt KM, Peterson EJ, Vanhaesebroeck B, Dixit V, et al. Signaling by Fyn-ADAP via the Carma1-Bcl-10-MAP3K7 signalosome exclusively regulates inflammatory cytokine production in NK cells. Nat Immunol. (2013) 14:1127–36. doi: 10.1038/ni.2708
13. Fostel LV, Dluzniewska J, Shimizu Y, Burbach BJ, Peterson EJ. ADAP is dispensable for NK cell development and function. Int Immunol. (2006) 18:1305–14. doi: 10.1093/intimm/dxl063
14. Yokoyama WM, Kim S, French AR. The dynamic life of natural killer cells. Annu Rev Immunol. (2004) 22:405–29. doi: 10.1146/annurev.immunol.22.012703.104711
15. Lanier LL. NK cell recognition. Annu Rev Immunol. (2005) 23:225–74. doi: 10.1146/annurev.immunol.23.021704.115526
16. Di Santo JP. Natural killer cell developmental pathways: a question of balance. Annu Rev Immunol. (2006) 24:257–86. doi: 10.1146/annurev.immunol.24.021605.090700
17. Bryceson YT, Chiang SC, Darmanin S, Fauriat C, Schlums H, Theorell J, et al. Molecular mechanisms of natural killer cell activation. J Innate Immun. (2011) 3:216–26. doi: 10.1159/000325265
18. Trapani JA, Smyth MJ. Functional significance of the perforin/granzyme cell death pathway. Nat Rev Immunol. (2002) 2:735–47. doi: 10.1038/nri911
19. Humann J, Lenz LL. Activation of naive NK cells in response to Listeria monocytogenes requires IL-18 and contact with infected dendritic cells. J Immunol. (2010) 184:5172–8. doi: 10.4049/jimmunol.0903759
20. Prager I, Watzl C. Mechanisms of natural killer cell-mediated cellular cytotoxicity. J Leukoc Biol. (2019) 105:1319–29. doi: 10.1002/JLB.MR0718-269R
21. Zhang Y, Huang B. The development and diversity of ILCs, NK cells and their relevance in health and diseases. Adv Exp Med Biol. (2017) 1024:225–44. doi: 10.1007/978-981-10-5987-2_11
22. Martín-Fontecha A, Thomsen LL, Brett S, Gerard C, Lipp M, Lanzavecchia A, et al. Induced recruitment of NK cells to lymph nodes provides IFN-γ for TH1 priming. Nat Immunol. (2004) 5:1260–5. doi: 10.1038/ni1138
23. Boehm U, Klamp T, Groot M, Howard JC. Cellular responses to interferon-gamma. Annu Rev Immunol. (1997) 15:749–95. doi: 10.1146/annurev.immunol.15.1.749
24. Kak G, Raza M, Tiwari BK. Interferon-gamma (IFN-γ): exploring its implications in infectious diseases. Biomol Concepts. (2018) 9:64–79. doi: 10.1515/bmc-2018-0007
25. Narni-Mancinelli E, Jaeger BN, Bernat C, Fenis A, Kung S, De Gassart A, et al. Tuning of natural killer cell reactivity by NKp46 and helios calibrates T cell responses. Science. (2012) 335:344–8. doi: 10.1126/science.1215621
26. Lucas M, Schachterle W, Oberle K, Aichele P, Diefenbach A. Dendritic cells prime natural killer cells by trans-presenting interleukin 15. Immunity. (2007) 26:503–17. doi: 10.1016/j.immuni.2007.03.006
27. Nandagopal N, Ali AK, Komal AK, Lee SH. The critical role of IL-15-PI3K-mTOR pathway in natural killer cell effector functions. Front Immunol. (2014) 5:187. doi: 10.3389/fimmu.2014.00187
28. Stackaruk ML, Lee AJ, Ashkar AA. Type I interferon regulation of natural killer cell function in primary and secondary infections. Expert Rev Vaccines. (2013) 8:875–84. doi: 10.1586/14760584.2013.814871
29. Brady J, Carotta S, Thong RP, Chan CJ, Hayakawa Y, Smyth MJ, et al. The interactions of multiple cytokines control NK cell maturation. J Immunol. (2010) 185:6679–88. doi: 10.4049/jimmunol.0903354
30. Takeda K, Tsutsui H, Yoshimoto T, Adachi O, Yoshida N, Kishimoto T, et al. Defective NK cell activity and Th1 response in IL-18-deficient mice. Immunity. (1998) 8:383–90. doi: 10.1016/S1074-7613(00)80543-9
31. Sánchez MJ, Muench MO, Roncarolo MG, Lanier LL, Phillips JH. Identification of a common T/natural killer cell progenitor in human fetal thymus. J Exp Med. (1994) 180:569–76. doi: 10.1084/jem.180.2.569
32. May RM, Okumura M, Hsu CJ, Bassiri H, Yang E, Rak G, et al. Murine natural killer immunoreceptors use distinct proximal signaling complexes to direct cell function. Blood. (2013) 121:3135–46. doi: 10.1182/blood-2012-12-474361
33. Humann J, Bjordahl R, Andreasen K, Lenz LL. Expression of the p60 autolysin enhances NK cell activation and is required for Listeria monocytogenes expansion in IFN-gamma-responsive mice. J Immunol. (2007) 178:2407–14. doi: 10.4049/jimmunol.178.4.2407
34. Clark SE, Filak HC, Guthrie BS, Schmidt RL, Jamieson A, Merkel P, et al. Bacterial manipulation of NK cell regulatory activity increases susceptibility to Listeria monocytogenes Infection. PLoS Pathog. (2016) 12:e1005708. doi: 10.1371/journal.ppat.1005708
35. Newman KC, Riley EM. Whatever turns you on: accessory-cell-dependent activation of NK cells by pathogens. Nat Rev Immunol. (2007) 7:279–91. doi: 10.1038/nri2057
36. Vivier E, Tomasello E, Baratin M, Walzer T, Ugolini S. Functions of natural killer cells. Nat Immunol. (2008) 9:503–10. doi: 10.1038/ni1582
37. Peterson EJ, Woods ML, Dmowski SA, Derimanov G, Jordan MS, Wu JN, et al. Coupling of the TCR to integrin activation by SLAP-130/Fyb. Science. (2001) 293:2263–5. doi: 10.1126/science.1063486
38. Skarnes WC, Rosen B, West AP, Koutsourakis M, Bushell W, Iyer V, et al. A conditional knockout resource for the genome-wide study of mouse gene function. Nature. (2011) 474:337–42. doi: 10.1038/nature10163
39. Narni-Mancinelli E, Chaix J, Fenis A, Kerdiles YM, Yessaad N, Reynders A, et al. Fate mapping analysis of lymphoid cells expressing the NKp46 cell surface receptor. Proc Natl Acad Sci USA. (2011) 108:18324–9. doi: 10.1073/pnas.1112064108
40. Rudolph J, Meinke C, Voss M, Guttek K, Kliche S, Reinhold D, et al. Immune cell-type specific ablation of adapter protein ADAP differentially modulates EAE. Front Immunol. (2019) 10:2343. doi: 10.3389/fimmu.2019.02343
41. Frentzel S, Katsoulis-Dimitriou K, Jeron A, Schmitz I, Bruder D. Essential role of IκBNS for in vivo CD4+ T-cell activation, proliferation, and Th1-cell differentiation during Listeria monocytogenes infection in mice. Eur J Immunol. (2019) 49:1391–8. doi: 10.1002/eji.201847961
42. Hughes CS, Foehr S, Garfield DA, Furlong EE, Steinmetz LM, Krijgsveld J. Ultrasensitive proteome analysis using paramagnetic bead technology. Mol Syst Biol. (2014) 30:757. doi: 10.15252/msb.20145625
43. Sielaff M, Kuharev J, Bohn T, Hahlbrock J, Bopp T, Tenzer S, et al. Evaluation of FASP, SP3, and iST protocols for proteomic sample preparation in the low microgram range. J Proteome Res. (2017) 16:4060–72. doi: 10.1021/acs.jproteome.7b00433
44. Alter G, Malenfant JM, Altfeld M. CD107a as a functional marker for the identification of natural killer cell activity. J Immunol Methods. (2004) 294:15–22. doi: 10.1016/j.jim.2004.08.008
45. Abel AM, Yang C, Thakar MS, Malarkannan S. Natural killer cells: development, maturation, and clinical utilization. Front Immunol. (2018) 13:1869. doi: 10.3389/fimmu.2018.01869
46. Chaix J, Tessmer MS, Hoebe K, Fuséri N, Ryffel B, Dalod M, et al. Cutting edge: priming of NK cells by IL-18. J Immunol. (2008) 181:1627–31. doi: 10.4049/jimmunol.181.3.1627
47. Combs J, Kim SJ, Tan S, Ligon LA, Holzbaur EL, Kuhn J, et al. Recruitment of dynein to the jurkat immunological synapse. Proc Natl Acad Sci USA. (2006) 103:14883–8. doi: 10.1073/pnas.0600914103
48. Sylvester M, Kliche S, Lange S, Geithner S, Klemm C, Schlosser A, et al. Adhesion and degranulation promoting adapter protein (ADAP) is a central hub for phosphotyrosine-mediated interactions in T cells. PLoS ONE. (2010) 5:e11708. doi: 10.1371/journal.pone.0011708
49. Griffiths EK, Krawczyk C, Kong YY, Raab M, Hyduk SJ, Bouchard D, et al. Positive regulation of T cell activation and integrin adhesion by the adapter Fyb/Slap. Science. (2001) 293:2260–3. doi: 10.1126/science.1063397
50. Vivier E, Ugolini S, Nunès JA. ADAPted secretion of cytokines in NK cells. Nat Immunol. (2013) 14:1108–10. doi: 10.1038/ni.2737
51. Shtrichman R, Samuel CE. The role of gamma interferon in antimicrobial immunity. Curr Opin Microbiol. (2001) 4:251–9. doi: 10.1016/S1369-5274(00)00199-5
52. Wood SM, Meeths M, Chiang SC, Bechensteen AG, Boelens JJ, Heilmann C, et al. Different NK cell-activating receptors preferentially recruit Rab27a or Munc13-4 to perforin-containing granules for cytotoxicity. Blood. (2009) 114:4117–27. doi: 10.1182/blood-2009-06-225359
53. Zhang M, Bracaglia C, Prencipe G, Bemrich-Stolz CJ, Beukelman T, Dimmitt RA, et al. A Heterozygous RAB27A mutation associated with delayed cytolytic granule polarization and hemophagocytic lymphohistiocytosis. J Immunol. (2016) 196:2492–503. doi: 10.4049/jimmunol.1501284
54. Fehniger TA, Cai SF, Cao X, Bredemeyer AJ, Presti RM, French AR, et al. Acquisition of murine NK cell cytotoxicity requires the translation of a pre-existing pool of granzyme B and perforin mRNAs. Immunity. (2007) 26:798–811. doi: 10.1016/j.immuni.2007.04.010
55. Cella M, Miller H, Song C. Beyond NK cells: the expanding universe of innate lymphoid cells. Front Immunol. (2014) 5:282. doi: 10.3389/fimmu.2014.00282
56. Lanier LL. Up on the tightrope: natural killer cell activation and inhibition. Nat Immunol. (2008) 9:495. doi: 10.1038/ni1581
57. Teixeira HC, Kaufmann SH. Role of NK1.1+ cells in experimental listeriosis. NK1+ cells are early IFN-gamma producers but impair resistance to Listeria monocytogenes infection. J Immunol. (1994) 152:1873–82.
58. Viegas N, Andzinski L, Wu CF, Komoll RM, Gekara N, Dittmar KE, et al. IFN-γ production by CD27+ NK cells exacerbates Listeria monocytogenes infection in mice by inhibiting granulocyte mobilization. Eur J Immunol. (2013) 43:2626–37. doi: 10.1002/eji.201242937
59. Harty JT, Bevan MJ. Specific immunity to Listeria monocytogenes in the absence of IFN gamma. Immunity. (1995) 3:109–17. doi: 10.1016/1074-7613(95)90163-9
60. Clark SE, Schmidt RL, McDermott DS, Lenz LL. A Batf3/Nlrp3/IL-18 axis promotes natural killer cell IL-10 production during Listeria monocytogenes infection. Cell Rep. (2018) 23:2582–94. doi: 10.1016/j.celrep.2018.04.106
61. Pamer EG. Immune responses to Listeria monocytogenes. Nat Rev Immunol. (2004) 4:812–23. doi: 10.1038/nri1461
62. Thaler B, Hohensinner PJ, Krychtiuk KA, Matzneller P, Koller L, Brekalo M, et al. Differential in vivo activation of monocyte subsets during low-grade inflammation through experimental endotoxemia in humans. Sci Rep. (2016) 26:30162. doi: 10.1038/srep30162
63. Yang Q, Ghose P, Ismail N. Neutrophils mediate immunopathology and negatively regulate protective immune responses during fatal bacterial infection-induced toxic shock. Infect Immun. (2013) 81:751–63. doi: 10.1128/IAI.01409-12
64. Seki E, Tsutsui H, Tsuji NM, Hayashi N, Adachi K, Nakano H, et al. Critical roles of myeloid differentiation factor 88-dependent proinflammatory cytokine release in early phase clearance of Listeria monocytogenes in mice. J Immunol. (2002) 169:3863–8. doi: 10.4049/jimmunol.169.7.3863
65. Tripp CS, Wolf SF, Unanue ER. Interleukin 12 and tumor necrosis factor alpha are costimulators of interferon gamma production by natural killer cells in severe combined immunodeficiency mice with listeriosis, and interleukin 10 is a physiologic antagonist. Proc Natl Acad Sci USA. (1993) 90:3725–9. doi: 10.1073/pnas.90.8.3725
66. Bernardini G, Sciumè G, Bosisio D, Morrone S, Sozzani S, Santoni A. CCL3 and CXCL12 regulate trafficking of mouse bone marrow NK cell subsets. Blood. (2008) 111:3626–34. doi: 10.1182/blood-2007-08-106203
67. Barber DF, Faure M, Long EO. LFA-1 contributes an early signal for NK cell cytotoxicity. J Immunol. (2004) 173:3653–9. doi: 10.4049/jimmunol.173.6.3653
68. Allavena P, Bianchi G, Paganin C, Giardina G, Mantovani A. Regulation of adhesion and transendothelial migration of natural killer cells. Nat Immun. (1996) 15:107–116.
69. Verma NK, Kelleher D. Not just an adhesion molecule: LFA-1 contact tunes the T lymphocyte program. J Immunol. (2017) 199:1213–21. doi: 10.4049/jimmunol.1700495
Keywords: ADAP, natural killer cells, cytotoxicity, Listeria monocytogenes, in vivo infection, migration, IL-10, CD11a
Citation: Böning MAL, Trittel S, Riese P, van Ham M, Heyner M, Voss M, Parzmair GP, Klawonn F, Jeron A, Guzman CA, Jänsch L, Schraven B, Reinhold A and Bruder D (2020) ADAP Promotes Degranulation and Migration of NK Cells Primed During in vivo Listeria monocytogenes Infection in Mice. Front. Immunol. 10:3144. doi: 10.3389/fimmu.2019.03144
Received: 25 July 2019; Accepted: 27 December 2019;
Published: 22 January 2020.
Edited by:
Navin Kumar Verma, Nanyang Technological University, SingaporeReviewed by:
Arun K. Bhunia, Purdue University, United StatesLaurel L. Lenz, School of Medicine, University of Colorado, United States
Copyright © 2020 Böning, Trittel, Riese, van Ham, Heyner, Voss, Parzmair, Klawonn, Jeron, Guzman, Jänsch, Schraven, Reinhold and Bruder. This is an open-access article distributed under the terms of the Creative Commons Attribution License (CC BY). The use, distribution or reproduction in other forums is permitted, provided the original author(s) and the copyright owner(s) are credited and that the original publication in this journal is cited, in accordance with accepted academic practice. No use, distribution or reproduction is permitted which does not comply with these terms.
*Correspondence: Burkhart Schraven, burkhart.schraven@med.ovgu.de; Dunja Bruder, dunja.bruder@med.ovgu.de
†These authors have contributed equally to this study
‡Present address: Maxi Heyner, Omikron Systems GmbH, Braunschweig, Germany
Gerald P. Parzmair, Vakzine Projekt Management GmbH, Hannover, Germany